life cycle analysis container glass bottle - · pdf file6/30/2017 1 1 presented at greenco...
TRANSCRIPT
6/30/2017
1
1
Presented at Greenco -CII Arindom ChakrabortyHindusthan National Glass & Ind. Ltd.Member-AIGMFJune 21, 2017
Life Cycle AnalysisContainer Glass Bottle
2
Glass – what & why
Every ton of glass recycled saves 322 KwH of energy, 246 kg of CO2 & 1200 kg of virgin raw material
Helps in Savings on Waste collection, Transportation and Disposal costs
Product packaged in glass denotes premium quality
ü Made from all natural and sustainable raw material - silica sand, soda-ash, lime stone etc.
ü 100% Recyclable and can be re-used more than 40 times
ü Chemically inert and pure

6/30/2017
2
3
What the consumers say across the globe ….
Source : European Container Glass Federation (FEVE) Consumer Research
92% of consumers want safe drinking water and arewilling to pay more for a better packaging than Plastics
60% say they are willing to pay more for moresustainable packaging as compared to plastics
72% say they want more environment friendly packaging 81% want industry to use more glass containers
4
Why LCA of container glass
1. To evaluate the environmental profile of glass, determine improvement opportunities.
2. External communication of product environmental attributes for enhancing the green brand of
glass product amongst consumers and other stakeholders.
3. Independent Review by Panel of International Experts.
4. Comparison with alternative packaging materials such as PET, beverage carton, pouch, Al Can.
AIGMFPE International /
Thinkstep

6/30/2017
3
5
Comprehensive Life Cycle study
7600 TPD of container glass industry covered
24 Sites visited by research team
72% Capacity using state of the art technology
40-250 Range of furnace size (TPD)
1st LCA study of an industryassociation in India that is performedand reviewed against ISO 14040/44
State-of-the-art LCA methodology asapplied by FEVE and GPI
6
Cradle to Cradle
Cradle-to-Cradle is theultimate test in assessingthe environmental impactof a product because itensures that all aspects ofa product’s life, end-of-lifeand reincarnation areaccountedfor.
6/30/2017
4
7Source: PE International Life Cycle Assessment (LCA) Study in India, 2011
Methodology
v LCA models are created using the GaBi 5 Software for life cycle engineering,developed by PE International AG. GaBi database provides the life cycle inventorydata for several of the raw and process materials obtained from the upstream anddownstreamsystem.
v For 180 ml packaging size of all packaging systems, various sensitivity analyses havebeen performed in order to assess the influence of different parameters.
v 3rd party critical review was carried out to assess
1. Methods are consistent with ISO 14040 and ISO 14044,2. Methods used to carry out the LCA are scientifically and technically valid,3. Data used are appropriate and reasonable in relation to the goal of the study,4. The study report is transparent and consistent.
1. Mr. Matthias FischerHead of the Life Cycle Engineering DepartmentFraunhofer IBP and University of Stuttgart, Germany
2. Mr. VS MathurGeneral Manager (Quality and Environmental) Tata Chemicals Limited, Babrala, India
8
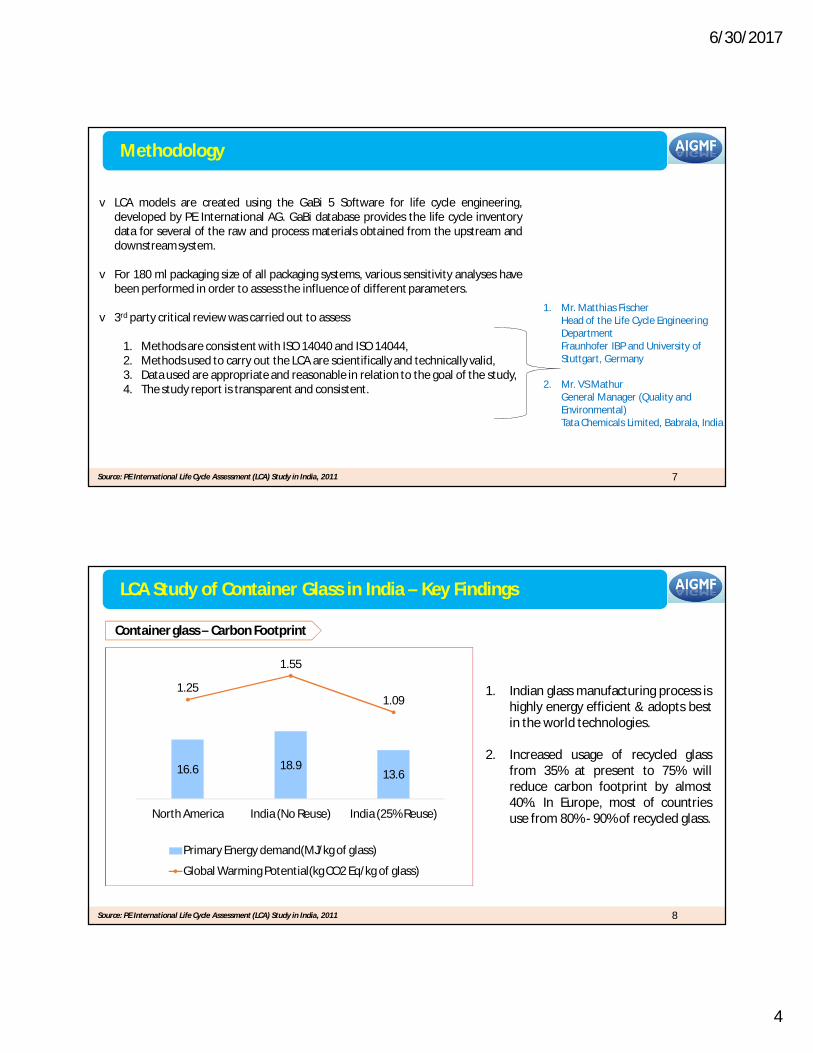
Container glass – Carbon Footprint
Source: PE International Life Cycle Assessment (LCA) Study in India, 2011
LCA Study of Container Glass in India – Key Findings
16.6 18.913.6
1.25
1.55
1.09
00.20.40.60.811.21.41.61.8
0
10
20
30
40
North America India (No Reuse) India (25% Reuse)
Primary Energy demand(MJ/kg of glass)
Global Warming Potential(kg CO2 Eq/kg of glass)
1. Indian glass manufacturing process ishighly energy efficient & adopts bestin the world technologies.
2. Increased usage of recycled glassfrom 35% at present to 75% willreduce carbon footprint by almost40%. In Europe, most of countriesuse from 80% - 90% of recycled glass.
6/30/2017
5
9
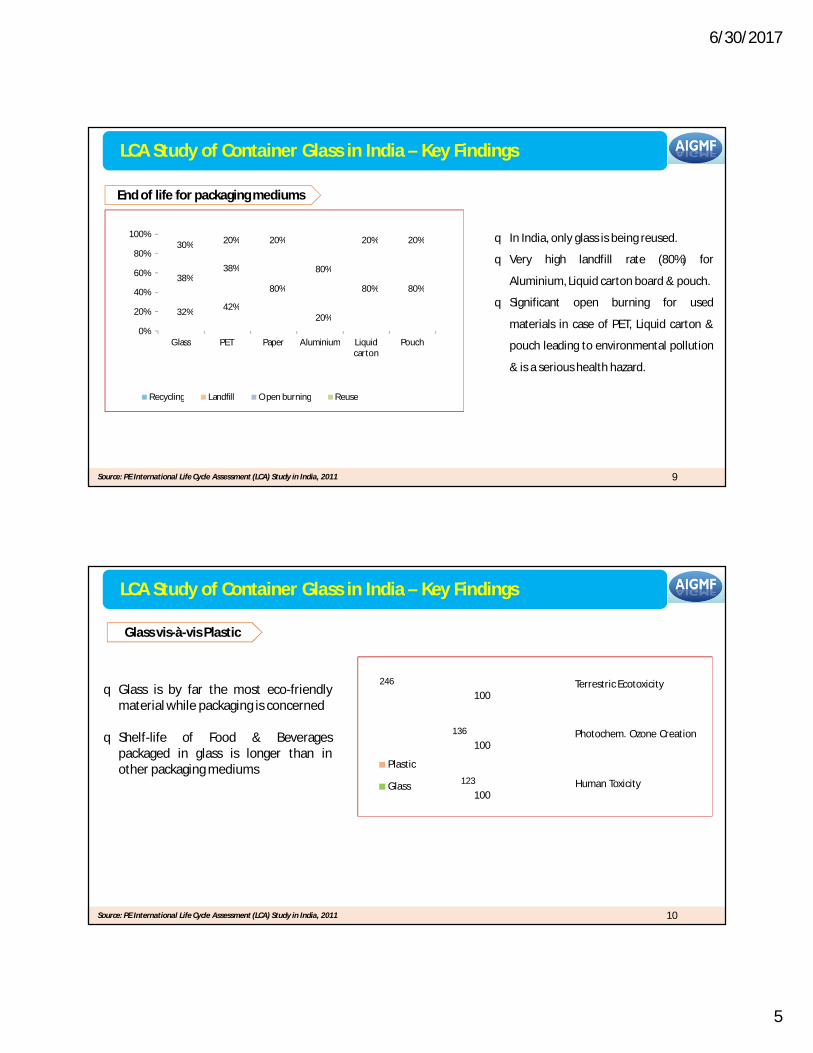
q In India, only glass is being reused.
q Very high landfill rate (80%) for
Aluminium, Liquid carton board & pouch.
q Significant open burning for used
materials in case of PET, Liquid carton &
pouch leading to environmental pollution
& is a serious health hazard.
0%
20%
40%
60%
80%
100%
Glass PET Paper Aluminium Liquid carton
Pouch
32% 42%
80%
20%
38%38%
20%
80%
80% 80%
20% 20% 20%30%
Recycling Landfill Open burning Reuse
End of life for packaging mediums
Source: PE International Life Cycle Assessment (LCA) Study in India, 2011
LCA Study of Container Glass in India – Key Findings
10
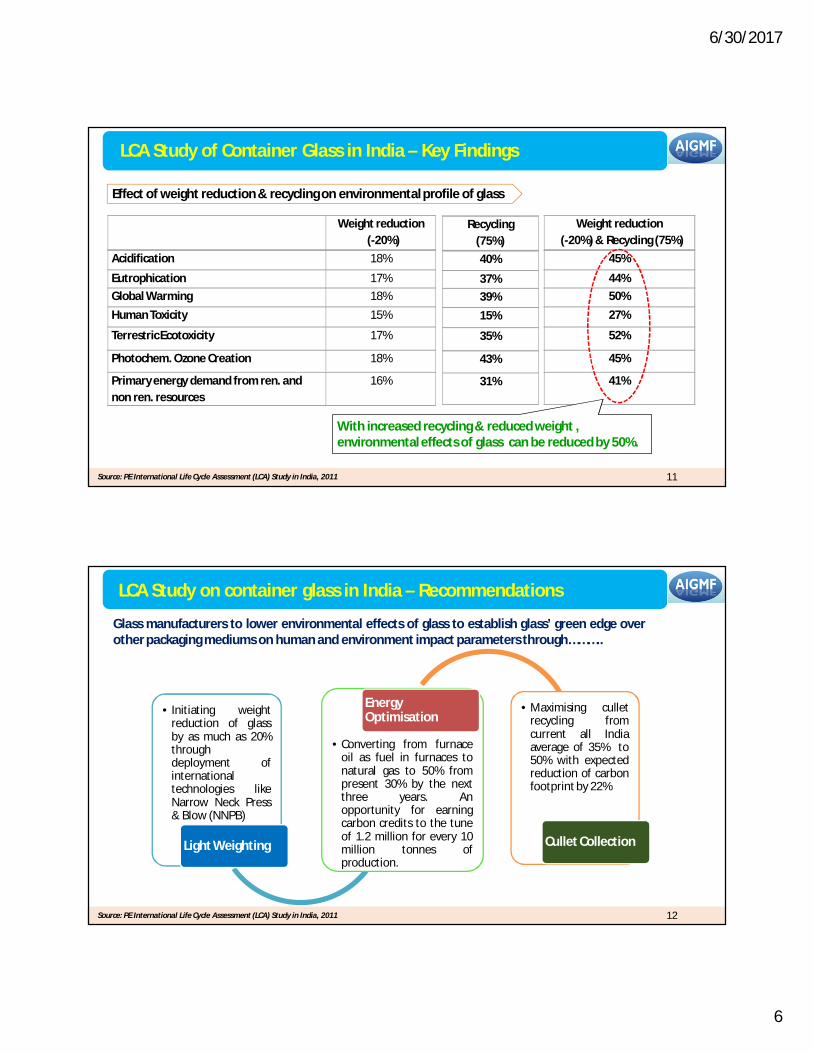
q Glass is by far the most eco-friendlymaterial while packaging is concerned
q Shelf-life of Food & Beveragespackaged in glass is longer than inother packaging mediums
Glass vis-à-vis Plastic
Human Toxicity
Photochem. Ozone Creation
Terrestric Ecotoxicity
100
100
100
123
136
246
Plastic
Glass
Source: PE International Life Cycle Assessment (LCA) Study in India, 2011
LCA Study of Container Glass in India – Key Findings
6/30/2017
6
11
Effect of weight reduction & recycling on environmental profile of glass
Source: PE International Life Cycle Assessment (LCA) Study in India, 2011
LCA Study of Container Glass in India – Key Findings
Weight reduction (-20%)
Acidification 18%
Eutrophication 17%
Global Warming 18%
Human Toxicity 15%
Terrestric Ecotoxicity 17%
Photochem. Ozone Creation 18%
Primary energy demand from ren. and non ren. resources
16%
Recycling (75%)
40%
37%
39%
15%
35%
43%
31%
Weight reduction (-20%) & Recycling (75%)
45%
44%
50%
27%
52%
45%
41%
With increased recycling & reduced weight , environmental effects of glass can be reduced by 50%.
LCA Study on container glass in India – Recommendations
12
Glass manufacturers to lower environmental effects of glass to establish glass’ green edge overother packaging mediums on human and environment impact parameters through………..
• Initiating weightreduction of glassby as much as 20%throughdeployment ofinternationaltechnologies likeNarrow Neck Press& Blow (NNPB)
Light Weighting
• Converting from furnaceoil as fuel in furnaces tonatural gas to 50% frompresent 30% by the nextthree years. Anopportunity for earningcarbon credits to the tuneof 1.2 million for every 10million tonnes ofproduction.
EnergyOptimisation
• Maximising culletrecycling fromcurrent all Indiaaverage of 35% to50% with expectedreduction of carbonfootprint by 22%
Cullet Collection
Source: PE International Life Cycle Assessment (LCA) Study in India, 2011

6/30/2017
7
Container glass – End of life
13Source: PE International Life Cycle Assessment (LCA) Study in India, 2011
(1) Closed-loop of glass packaging back to new packaging
(2) Recycling of glass packaging into non-packaging products or fiberglass
(3) Losses via aggressive landfill cover, incineration
End-of-life management scenarios
Benefits of Closed-loop Recycling
a) Substitution of primary batch materials by cullet.
b) Reduction of energy consumption in melting process due to cullet replacing raw materials.
c) Reduction of emissions in melting process:
i. Reduction of CO2 emissions in relation to the (reduced) consumption of raw materials and energy.
ii. Reduction of NOx, Dust and SOx emissions in proportional relation to the (reduced) energy input.
Glass Recycling – more the better
14
Ø Europe uses almost 70% recycledglass on the average
Ø Only 40% glass is recycled in India &rest goes into landfill
Ø Europe uses almost 70% recycledglass on the average
Ø Only 40% glass is recycled in India &rest goes into landfill
Source: European container glass federation (FEVE)
At 50% recycled glass in manufacturing,Removes 2.2 million MT of CO2 emissions =400,000 cars off the road each year.
Recycling rate ~90%

6/30/2017
8
Way Ahead in India
15
Stakeholders Opportunity
FMCG companies• Implement more renewable/ recycled material in their product.• Implement recycling and reusing initiatives in order to increase the rates of recycling for their products.
Consumers• Follow proper waste disposal practices.• Demand that their products encompass a holistic value chain.
Policy makers• Promote the informal sector to collect low value waste material.• Propose legislation to propel green packaging.
Local municipalitiesDevelop controlled waste streams they own in order to ensure all waste is collected and not just those withhigh market value.
Investors Direct investment to expand green packaging, formal waste management.
Packaging supplier Demonstrate commitment to sustainable packaging.
Recycling – what about these
16
An airport in England collects recycled gum to help make tires, toys, and other products
Wine corks can be recycled into flooring tiles, insulation, automotive parts & sports equipment
Credit cards are chopped and melted into sheets of PVC
Used diaper - fibre and plastic to be recycled into products ranging from benches to railways sleepers

6/30/2017
9
Is Recycling enough ??
17
Not just Recycling…..
Reduce
Reuse Recover Repair
Rethink
Rotate Replenish Recover
Return Restore
Responsibility
Reinvent
Rethink
18