life cycle analysis – fred kaiser building dongqi liao
TRANSCRIPT

UBC Social, Ecological Economic Development Studies (SEEDS) Student Report
Life Cycle Analysis – Fred Kaiser Building
Dongqi Liao
University of British Columbia
CIVL 498C
March 2010
Disclaimer: “UBC SEEDS provides students with the opportunity to share the findings of their studies, as well as their opinions, conclusions
and recommendations with the UBC community. The reader should bear in mind that this is a student project/report and is not an official
document of UBC. Furthermore readers should bear in mind that these reports may not reflect the current status of activities at UBC. We urge
you to contact the research persons mentioned in a report or the SEEDS Coordinator about the current status of the subject matter of a
project/report.”

i
��������
This study is part of a larger study – the UBC LCA Project – which is continually developing. As such the findings contained in this report should be considered preliminary as there may have been subsequent refinements since the initial posting of this report. If further information is required or if you would like to include details from this study in your research please contact [email protected].

ii
Abstract
University of British Columbia
2010 March 29th
Life Cycle Analysis Fred Kaiser Building Dongqi Liao

iii
In this report, Fred Kaiser Building was analyzed for life cycle assessment. This analysis
includes quantity takeoff and data input by using OnScreen Takeoff and Athena Impact
Estimator. TheOnScreen Takeoff Software creates a material list which includes the
material type and quantities for data inputs in Athena Impact Estimator. The Impact
Estimator uses the TRACI impact database to quantify the environmental impacts of the
building assemblies.
The results of impact estimator include Bill of Materials and summary measures by life
cycle stage and assembly group. The summary measures by life cycle stage showed eight
categories of environmental impacts which are associated with the manufacturing stage
of the building.
A sensitivity analysis was base on the five anticipated materials to investigate the relative
impacts of each material overall environmental impact. It was determined that the most
influential component out of the five chosen was the concrete with 30 MPa strength and
average flyash.
In addition, an analysis was conducted to determine the amount of materials needed to
improve the current buildings energy performance to UBC’s Residential Environmental
Assessment Program. Operating energy data was obtained from the UBC building
services department and a spreadsheet template was used to determine the improvement
of operating energy given material upgrades. It was determined that it will take
approximately 36 months to recover the energy input for adding insulation materials from
energy saving.

iv
Contents
Abstract ................................................................................................................................i
Contents...............................................................................................................................ii
Tables..................................................................................................................................iii
Figures................................................................................................................................iii
1.0 Introduction................................................................................................................... 1
2.0 Goal and Scope..............................................................................................................2
2.1 Goal of Study.................................................................................................................2
2.2 Scope of Study ..............................................................................................................3
2.3 Tools, Methodology and Data........................................................................................3
3.0 Building Model..............................................................................................................6
3.1 Takeoffs.........................................................................................................................6
4.0 Bill of Material.............................................................................................................11
5.0 Summary Measures .....................................................................................................14
6.0 Sensitivity Analysis………….....................................................................................16
7.0 Building Performance………………………..............................................................21
8.0 Conclusions..................................................................................................................30
REFERENCE…………………………………………………………………………….31
Author’s Segment………………………………………………………………………..32
Appendix A – Impact Estimator Input Tables...................................................................33
Appendix B – Impact Estimator Input Assumption..........................................................70

v
Tables
Table 1: Building Characteristics.........................................................................................1
Table 2: Bill of Materials...................................................................................................11
Table 3: Overall Summary measure..................................................................................20
Table 4: Concrete block % difference...............................................................................22
Table 5: Concrete 30mpa % difference.............................................................................23
Table 6: Regular gypsum board % difference…………………………………………...24
Table 7: Glazing panel % difference.................................................................................25
Table 8: Rebar rod light section % difference...................................................................26
Figures
Figure 1: Energy................................................................................................................14
Figure 2: Acidification potential.......................................................................................16
Figure 3: Global warming potential...................................................................................16
Figure 4 HH Respiratory Effects Potential........................................................................17
Figure 5: Ozone Depletion Potential..................................................................................17
Figure 6: Smog Potential...................................................................................................18
Figure 7: Eutrophication Potential.....................................................................................19
Figure 8: Weighted Resources...........................................................................................20
Figure 9: Addition of 10% concrete block.........................................................................22
Figure 10: Addition of 10% concrete 30mpa with flyash average....................................23
Figure 11: Addition of 10% regular gypsum board...........................................................24
Figure 12: Addition of 10% glazing panel.........................................................................25
Figure 13: Addition of 10% rebars rod light section.........................................................26
Figure 14: Comparison of building performance between current building and improved
building..............................................................................................................................28
1
1.0 INTRODUCTION
Fred Kaiser Building is located at 2332 Main Mall, at the University Of British
Columba (UBC), in Vancouver, Canada. The year of completion for this building is 2005
with a total cost of $26 million. The building consists of five floors and a basement with
gross area of 136,303 square feet. Three top levels sit a portion of the old two-level civil
and mechanical engineering (CEME) building that was constructed in the 1970s and the
foundation had to under go significant seismic upgrades.
The use of this building includes Engineering Student Services, Technical
Communication Centre, Faculty of Applied Science Dean's Office, Departments of
Electrical and Computer Engineering, Mechanical Engineering.
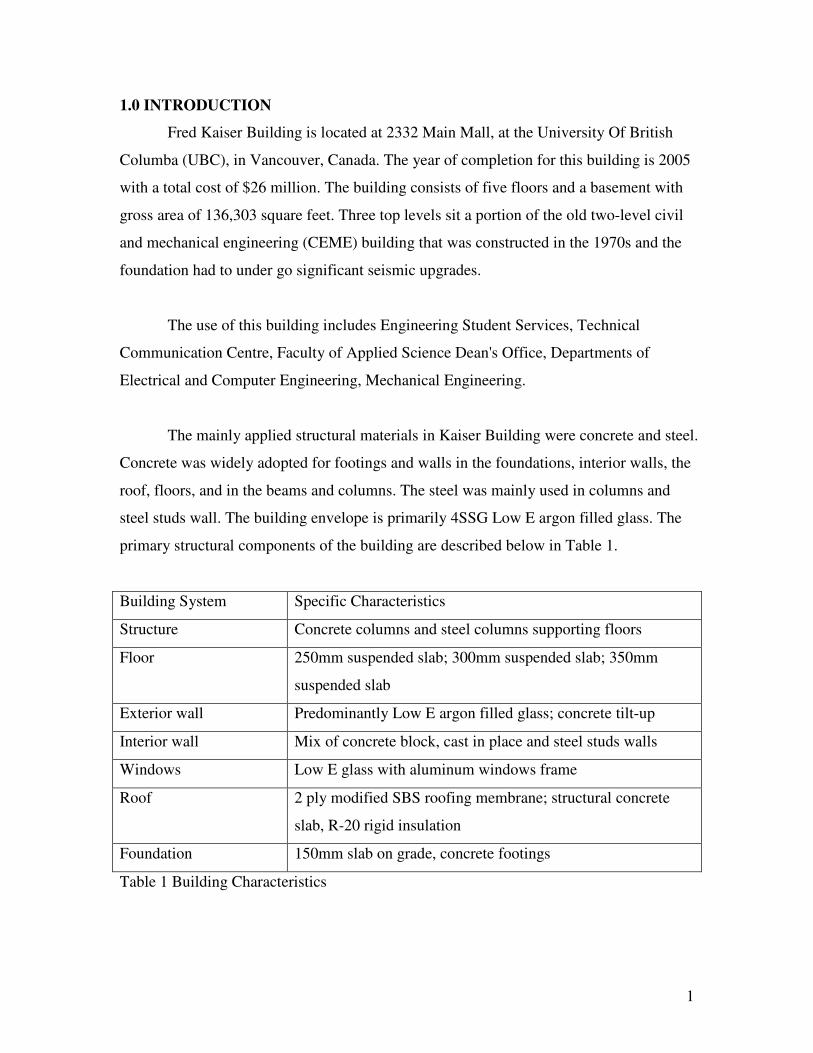
The mainly applied structural materials in Kaiser Building were concrete and steel.
Concrete was widely adopted for footings and walls in the foundations, interior walls, the
roof, floors, and in the beams and columns. The steel was mainly used in columns and
steel studs wall. The building envelope is primarily 4SSG Low E argon filled glass. The
primary structural components of the building are described below in Table 1.
Building System Specific Characteristics
Structure Concrete columns and steel columns supporting floors
Floor 250mm suspended slab; 300mm suspended slab; 350mm
suspended slab
Exterior wall Predominantly Low E argon filled glass; concrete tilt-up
Interior wall Mix of concrete block, cast in place and steel studs walls
Windows Low E glass with aluminum windows frame
Roof 2 ply modified SBS roofing membrane; structural concrete
slab, R-20 rigid insulation
Foundation 150mm slab on grade, concrete footings
Table 1 Building Characteristics

2
2.0 GOAL AND SCOPE
2.1 Goal of Study
This life cycle analysis (LCA) of Fred Kaiser Building at the University of British
Columbia was carried out as an exploratory study to determine the environmental impact
of its design. This LCA of the Kaiser building is also part of a series of twenty-nine
others being carried out simultaneously on respective buildings at UBC with the same
goal and scope.
The main outcomes of this LCA study are the establishment of a materials
inventory and environmental impact references for the Kaiser building. An exemplary
application of these references is in the assessment of potential future performance
upgrades to the structure and envelope of the Kaiser building. When this study is
considered in conjunction with the twenty-nine other UBC building LCA studies, further
applications include the possibility of carrying out environmental performance
comparisons across UBC buildings over time and between different materials, structural
types and building functions. Furthermore, as demonstrated through these potential
applications, this Kaiser building LCA can be seen as an essential part of the formation of
a powerful tool to help inform the decision making process of policy makers in
establishing quantified sustainable development guidelines for future UBC construction,
renovation and demolition projects.
The intended core audiences of this LCA study are those involved in building
development related policy making at UBC, such as the Sustainability Office, who are
involved in creating policies and frameworks for sustainable development on campus.
Other potential audiences include developers, architects, engineers and building owners
involved in design planning, as well as external organizations such as governments,
private industry and other universities whom may want to learn more or become engaged
in performing similar LCA studies within their organizations.
3
2.2 Scope of Study
The product systems being studied in this LCA are the structure, envelope and
operational energy usage associated with space conditioning of the Fred Kaiser Building
on a square foot finished floor area based on as built drawings. In order to focus on
design related impacts, this LCA encompasses a cradle-to-gate scope that includes the
raw material extraction, manufacturing of construction materials and construction of the
structure and envelope of the Fred Kaiser Building, as well as associated transportation
effects throughout.
2.3 Tools, Methodology and Data
Two main software tools are to be utilized to complete this LCA study;
OnCenter’s OnScreen TakeOff and the Athena Sustainable Materials Institute’s Impact
Estimator (IE) for buildings.
The study will first undertake the initial stage of a materials quantity takeoff,
which involves performing linear, area and count measurements of the building’s
structure and envelope. To accomplish this, OnScreen TakeOff version 3.7.0.11 is used,
which is a software tool designed to perform material takeoffs with increased accuracy
and speed in order to enhance the bidding capacity of its users.
Using imported digital plans, the program simplifies the calculation and
measurement of the takeoff process, while reducing the error associated with these two
activities. The measurements generated are formatted into the inputs required for the IE
building LCA software to complete the takeoff process. These formatted inputs as well as
their associated assumptions can be viewed in Annexes A and B respectively. Using the
formatted takeoff data, version 4.0.64 of the IE software, the only available software
capable of meeting the requirements of this study, is used to generate a whole building
LCA model for Kaiser in the Vancouver region as an office rental building type. The IE
software is designed to aid the building community in making more environmentally

4
conscious material and design choices. The tool achieves this by applying a set of
algorithms to the inputted takeoff data in order to complete the takeoff process and
generate a Bill of Materials (BoM). This BoM then utilizes the Athena Life Cycle
Inventory (LCI) Database, version 4.6, in order to generate a cradle-to-grave LCI profile
for the building. In this study, LCI profile results focus on the manufacturing and
transportation of materials and their installation in to the initial structure and envelope
assemblies. As this study is a cradle-to-gate assessment, the expected service life of the
Fred Kaiser Building is set to 1 year, which results in the maintenance operating energy
and end-of-life stages of the building’s life cycle being left outside the scope of
assessment.
The IE then filters the LCA results through a set of characterization measures
based on the mid-point impact assessment methodology developed by the US
Environmental Protection Agency (US EPA), the Tool for the Reduction and Assessment
of Chemical and other environmental Impacts (TRACI) version 2.2. In order to generate
a complete environmental impact profile for the Kaiser building, all of the available
TRACI impact assessment categories available in the IE are included in this study, and
are listed as;
��Global warming potential
��Acidification potential
��Eutrophication potential
��Ozone depletion potential
��Photochemical smog potential
��Human health respiratory effects potential
��Weighted raw resource use
��Primary energy consumption
Using the summary measure results, a sensitivity analysis is then conducted in
order to reveal the effect of material changes on the impact profile of the Kaiser building.
Finally, using the UBC Residential Environmental Assessment Program (REAP) as a

5
guide, this study then estimates the embodied energy involved in upgrading the insulation
and window R-values to REAP standards and calculates the energy payback period of
investing in a better performing envelope.
The primary sources of data for this LCA are the original architectural and
structural drawings when Fred Kaiser Building was initially constructed in 2005. The
assemblies of the building that are modeled include the foundation, floors, walls (interior
and exterior) and roofs, as well as the associated envelope and openings (ie. doors and
windows) within each of these assemblies. The decision to omit other building
components, such as flooring, electrical aspects, HVAC system, finishing and detailing,
etc., are associated with the limitations of available data and the IE software, as well as to
minimize the uncertainty of the model. In the analysis of these assemblies, some of the
drawings lack sufficient material details, which necessitate the usage of assumptions to
complete the modeling of the building in the IE software. Furthermore, there are inherent
assumptions made by the IE software in order to generate the Bill of Materials and
limitations to what it can model, which necessitated further assumptions to be made.
These assumptions and limitation will be discussed further in the Building Model section
and, as previously mentioned, all specific input related assumptions are contained in the
Input Assumptions document in Appendix B.

6
3.0 BUILDING MODEL
3.1 Takeoffs
On-Screen Takeoff Software is the primary tool for completing the building
materials quantity takeoff process. The takeoffs were performed on a set of digital
drawings obtained from UBC campus planning and development office. Details of the
interior and exterior walls are solely based on labels and information provided by the
digital drawings. However, a noticeable amount of building elements which are not
specified by the given drawing, are specified with reasonable assumptions, on-site
observation and appropriate research. The components of the building are named as one
type building system, followed by type of assemble, followed by actual labels specified
in the drawing. The detailed analysis of procedures and assumptions for the quantity
takeoffs are described as the following:
Walls
Exterior wall
The majority of the materials used for exterior walls are large low E argon filled
glass panels. The list of typical and non typical glass panels is provided on the digital
drawing 313-06-026; 313-06-027; 313-06-028. However, the glass materials cannot be
specifically identified in the Impact Estimator. In order to convert to inputs for Impact
Estimator, the glass panels are assumed to be viewable glazing consisting of a double
glazed unit of two 6mm glazing panes with total thickness of 12mm. In addition, the
observation on-site concludes that most glass panels are 90% to 100% glazing. The
glazing was assumed to be 100% glazing to ensure consistency within the curtain wall
materials.
The building envelope on the north and east side of the second floor of the
building consists of both existing concrete walls left from old civil and mechanical
7
building and new concrete walls. The new concrete wall is assembled by precast concrete
panels, which is similar to concrete tilt-up available in Impact Estimator. The concrete
strength is preferred to be 30MPa as it is the closest available option within the software.
The existing exterior concrete walls are not within the cope of life cycle assessment since
the quantity is relatively insignificant to the total impact analysis and the materials were
not part of the manufacturing and construction for Fred Kaiser Building.
Windows in the curtain walls are specified as clear low E operable vents in the
drawing, so they are input as Low E tin glazing operable in the Impact Estimator. All
doors for the building envelope are observed closest to be aluminum exterior 80%
glazing in the Impact Estimator.
Interior walls
The interior walls primarily consist of cast in place, concrete masonry units, and
steel studs.The concrete properties of walls located in the basement are specified in the
concrete properties schedule in the general notes of the drawing. The information for
concrete reinforcement is adopted from reinforcement schedule in the general notes of the
drawing. The type of concrete wall is not specified in the given drawing. Since
foundation walls are mostly poured concrete for certain load bearing, cast in place wall is
assumed in Impact Estimator.
Types of walls on the second, the third, the fourth, and the fifth floors are
specified in the drawings. All concrete masonry unit walls are input as concrete blocks in
the impact estimator. Steel studs wall information is input with good accordance to the
drawing information. Studs weight, stud thickness and stud spacing are taken as interior
walls. All 16mm gypsum wood boards are considered as 5/8” regular gypsum board.
Wall20, 20a and 20b, are indicated as walls within the drawing but lack details
information. The on-site observation concludes these types of wall are close to steel studs
with gypsum boards. Drawing information which is outside the data range of Impact

8
Estimator will be assumed to the closest option available or averaged for input. Detailed
assumptions for each type of wall are listed in Annex B
The thickness of different types of wall is obtained in two measures: manual
measuring on the digital drawings by using on screen takeoffs; and obtaining from
drawing information. The drawing information usually provides specific thickness for
gypsum wood board, studs thickness and wood panel thickness. Thickness of concrete
wall requires manual measurement on the drawing. However, this may result in a slight
overestimation or underestimation of the wall thickness but is not expected to
significantly affect the results of the impact analysis. The height of the wall was
measured as distance between slab to slab on drawing No. 313-06-029. Since the height
varies from slab to slab and mostly within in the range of 2.9 m and 3.3 m, the height of
all interior walls is averaged 3.1 m. The names of types of wall used in Impact Estimator
are in accordance with names indicated in the drawing.
The interior doors can be categorized into two main types: the doors for hallway
are observed closest to steel interior door 50% glazing; the doors for offices and
classrooms are observed closest to hollow core wood interior door. All walls and doors
measured by linear condition and count condition respectively in Onscreen Takeoff.
Roofs
The roof was measured by using Area Condition in Onscreen Takeoff. The
information regarding the roofs is specified in the digital drawing. However, there are
three roof types identified in the building drawings, and they are named accordingly as
R1, R2 and R3 in the roof type legend. Type R1 is specified as gravel ballast; 2 ply
modified SBS roofing membrane; protection board; R-20 rigid insulation and structural
concrete slab. Type R2 is specified as concrete pavers; The 2 ply modified SBS roofing
membrane; protection board; R-20 rigid insulation and exterior sheathing; metal deck.
Type R3 is specified as The 2 ply modified SBS roofing membrane; 16mm densedeck
fireguard roof guard; R-20 Rigid insulation; vapor barrier;50mm concrete topping;

9
existing roof slab. Type R3A is similar to Type R3 in terms of assumptions therefore it is
counted towards R3. The 2 ply modified SBS roofing membrane generally refer to
polyester in between two asphalt layers (Claude).
Therefore, roofs were assumed accordingly as follows: suspended slab; and
modified bitumen roofing system inverted with insulation of polylsocyanurate foam and
polyethylene for vapor barrier in Impact Estimator. The concrete strength, fly ash
percentage; and live loads are referred to general notes in drawing No. 313-07-001. The
span of the roof was measured on the drawing and re-adjusted to be 9.75m for IE input.
Detailed calculations and assumptions are available in Appendix B
There is a small portion of roof which consists of photovoltaic panels sandwiched
in the atrium skylight (Robin). The materials of photovoltaic panels are not within the
scope of Impact Estimator, and not accounted for overall impact analysis.
Floors
The spans for each floor were obtained by measuring distance between concrete
columns by using On-Screen dimensioning tool. Due to a wide variety of the span size,
the spans were averaged and re-adjusted to be within IE inputs limits. The concrete
strength, fly ash percentage; and live loads are referred to general notes in drawing No.
313-07-001. The inputs of live load were with good accordance to the drawing
information since the IE has available options for specified live loads.
The floor was identified as suspended floor with its measured thickness. The
floors with similar thickness are measured together and averaged at a later time for
column and beam inputs. The floor area was measured by using Area Condition in
Onscreen Take off and it was purposed for readjustment of span size. However, the floor
area was divided for few sections for measuring due to shape of the building. There could
be some slight omission or overlapping of the area measurement but it generally complies

10
with known floor areas of the building. Assumptions, Calculated span size and obtained
concrete properties
Mixed Columns & Beams
The two main materials for columns are concrete and steel with various sizes and
shapes. Assumption for beams is considered to be a challenging part of the takeoff
process since information of beams is not available from the given available drawings.
All column takeoffs are named according to column names given in the drawings.
The method used to measure column sizing was completely depended upon the
metrics built into the Impact Estimator. The Impact Estimator calculates the sizing of
beams and columns based on the following inputs; number of beams, number of columns,
floor to floor height, bay size, supported span and live load. Being the case, since no
beams were present in Fred Kaiser building, concrete columns were accounted for on
each floor, while each floor’s area was measured. The hollow structural steel (HSS)
columns in the Kaiser building were located along the building envelope on each floor
and columns for the fifth floor are all steel. The steel columns are modeled in the Extra
Basic Materials, where their associated assumptions and calculations are documented in
Appendix A and Appendix B.
Foundation
The Impact Estimator, slab-on-grade inputs are limited to being either a 100mm
or 200mm thickness. Since the actual SOG thicknesses for the Kaiser building were not
exactly 100mm or 200mm thick, the areas measured in OnScreen required calculations to
adjust the areas to accommodate this limitation.
The Impact Estimator limits the thickness of footings to be between 190mm and
500mm thick. As there are a number of cases where footing thicknesses exceed 500mm,

11
their areas were re-adjusted accordingly to maintain the same volume of footing while
accommodating this limitation.
Lastly, the concrete stairs were modeled as footings (ie. Stairs_Concrete_Total
Length). All stairs had the same thickness and width, so the total length of stair was
measured and were combined into a single input.
Extra Basic Materials
The Hollow Structural Steel (HSS) columns were accounted for using count
conditions for the different types. Using their cross sectional sizing, provided in the Steel
Column Schedule in structural drawing 316-07-003, in conjunction with their height and
per foot weight, referenced from the Steel Tube Institute, allowed for the calculation of
the amount of HSS in weight for the columns. Detailed calculation for the weight of steel
is available in Appendix B
All other materials such as plumbing systems and electrical systems as well as
appliances and interior finishes such as ceiling, flooring, painting and landscaping
materials were outside the scope of this project.
4.0 BILL OF MATERIALS
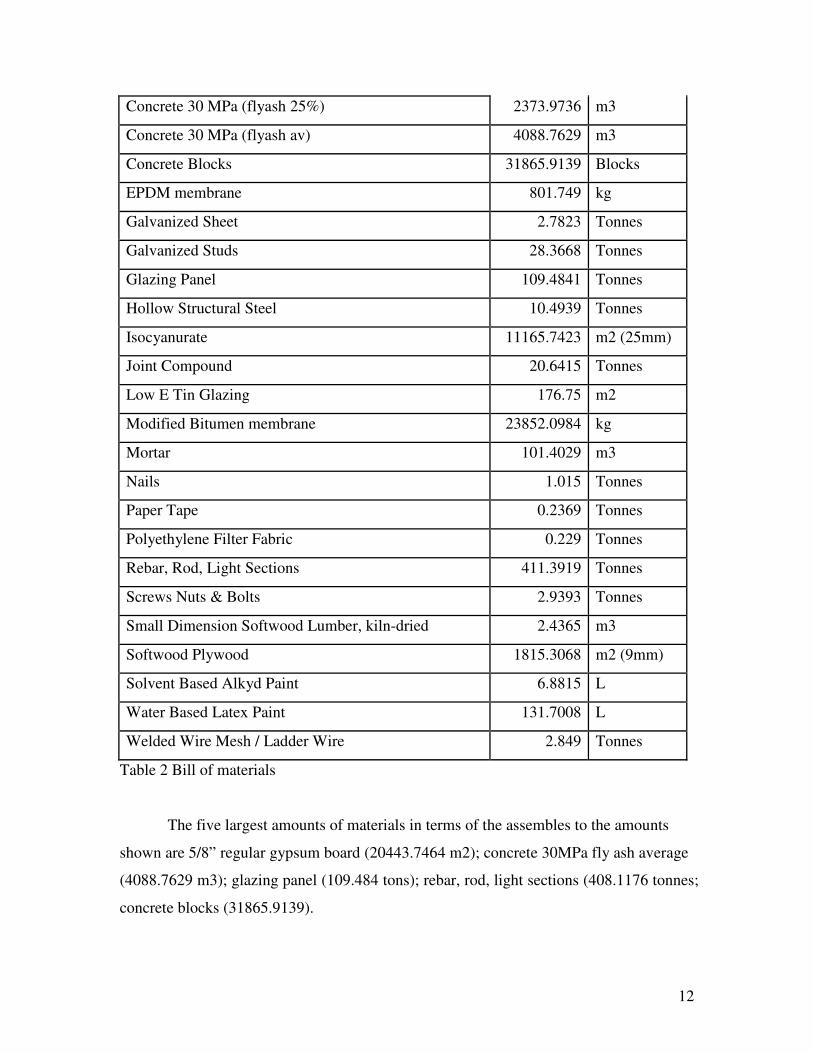
The Bill of Materials report was generated by Impact Estimator as the table below:
Material Quantity Unit
1/2" Regular Gypsum Board 238.7 m2
5/8" Regular Gypsum Board 20443.7464 m2
6 mil Polyethylene 5932.3745 m2
Aluminum 43.8275 Tonnes
Ballast (aggregate stone) 171633.735 kg
Batt. Fiberglass 2063.4474 m2 (25mm)
12
Concrete 30 MPa (flyash 25%) 2373.9736 m3
Concrete 30 MPa (flyash av) 4088.7629 m3
Concrete Blocks 31865.9139 Blocks
EPDM membrane 801.749 kg
Galvanized Sheet 2.7823 Tonnes
Galvanized Studs 28.3668 Tonnes
Glazing Panel 109.4841 Tonnes
Hollow Structural Steel 10.4939 Tonnes
Isocyanurate 11165.7423 m2 (25mm)
Joint Compound 20.6415 Tonnes
Low E Tin Glazing 176.75 m2
Modified Bitumen membrane 23852.0984 kg
Mortar 101.4029 m3
Nails 1.015 Tonnes
Paper Tape 0.2369 Tonnes
Polyethylene Filter Fabric 0.229 Tonnes
Rebar, Rod, Light Sections 411.3919 Tonnes
Screws Nuts & Bolts 2.9393 Tonnes
Small Dimension Softwood Lumber, kiln-dried 2.4365 m3
Softwood Plywood 1815.3068 m2 (9mm)
Solvent Based Alkyd Paint 6.8815 L
Water Based Latex Paint 131.7008 L
Welded Wire Mesh / Ladder Wire 2.849 Tonnes
Table 2 Bill of materials
The five largest amounts of materials in terms of the assembles to the amounts
shown are 5/8” regular gypsum board (20443.7464 m2); concrete 30MPa fly ash average
(4088.7629 m3); glazing panel (109.484 tons); rebar, rod, light sections (408.1176 tonnes;
concrete blocks (31865.9139).
13
The regular gypsum board is most popular material used for interior walls and
concrete wall envelopes within Fred Kaiser Building. The size of gypsum board is
assumed to be all 5/8” thickness for consistency but there are also types of other materials
which cannot be identified by IE such as wood board, and its thickness was rounded off
to be 16 mm which could slight underestimate the quantity of the quantity of softwood
and plywood.
Concrete 30MPa was widely used in the building. However, the measurement of
its thickness and area can vary due to degree of accuracy of measuring by OnScreen tools.
The assumption is slightly conservative and allowing small overestimation of the
thickness to avoid omission of concrete materials. Therefore, the overall concrete
quantity could be slightly over estimated in the Bill of Materials.
Glazing panel is the major portion for the building envelop. The height of the
glazing panel on each floor is assumed to be the same as the floor to ceiling height for
consistency, which could slight underestimate amount of glazing plane but it can be
generally compensated by glazing panel on the fifth floor which has lower height of the
panel due to framing and roof. Overall, the amount of glazing panel should be within the
accepted range of errors for Bill of Materials.
Concrete blocks are important materials for interior walls are measured by linear
conditions and it is an assumption made from concrete masonry units. However, mortar
and cement were not calculated for the assumption due to limited information. The
quantity of mortar could be slightly underestimated in Bill of materials.
Finally rebar, rod and light section inputs are mainly based on drawing
information, but also not limited to assumption of average rebar size since certain rebar
size is larger than the IE rebar size options. Therefore, it is possible that rebar is slight
underestimated.

14
5.0 SUMMARY MEASURE
Energy Consumption
Energy consumptions generally refer to direct energy and indirect energy in all
froms that used for building material manufacturing and transportation. Energy
consumption is measured in mega joules (MJ) (Athena Institute, 2009). The energy
consumption of Fred Kaiser Building is broken up by life-cycle stage in Figure 1. It
shows that most of energy is consumed in the manufacturing stage.
Figure 1 Energy
Acidification Potential
The acidification potential is expressed as a hydrogen ion equivalency based on
mass balance calculations. Acidification is a predominately regional impact that can
affect human health when NOX or SO2 reach high concentrations (Athena Institute,2009).
The acidification potential of Fred Kaiser Building is broken up by life-cycle stage in
Figure 2 below. Most of the NOX or SO2 is produced in the manufacturing process, and
virtually exclusively due to the material production

15
Figure 2 acidification potential
Global Warming Potential
Global Warming Potential is expressed in terms of CO2 equivalence by weight, since carbon dioxide is commonly recognized as greenhouse gas. The CO2 equivalence for other greenhouse gases is a ratio of the heat trapping potential to CO2, affected by a time horizon as different compounds have different reactivity in the atmosphere. The sources of greenhouse gas modeled include combustion for energy as well as processing of some raw resources such as in the production of concrete (Athena Institute, 2009). The global warming potential of Fred Kaiser Building is broken up by life-cycle stage as shown in Figure 3
Figure 3 global warming potential
HH Respiratory Effects Potential
According to the United States Environmental Protection Agency (EPA),
particulates, especially from diesel fuel combustion, can have a dramatic affect on human

16
health due to respiratory problems such as asthma, bronchitis, and acute pulmonary
disease. The Impact Estimator uses TRACI’s "Human Health Particulates from Mobile
Sources" characterization factor to account for the mobility of particles of different sizes,
thus equivocated them to a single size: PM2.5 (Athena Institute, 2009). The human health
respiratory effects potential of Kaiser is shown below in Figure 4, broken up by life-cycle
stage.
Figure 4 HH Respiratory Effects Potential

17
Ozone Depletion Potential
Ozone depletion has been a cause for global concern in the past. The ozone
depletion potential is expressed in mass equivalence of CFC-11, based on their relative
capacity to damage ozone in the stratosphere (Athena Institute, 2009). The ozone
depletion potential of Fred Kaiser Building is broken up by life-cycle stage as shown in
the figure below
Figure 5 Ozone Depletion Potential

18
Smog Potential
Smog, or photochemical ozone creation potential, takes place under certain
climate conditions when air emissions are trapped at ground level and are exposed to
sunlight. The effect is actually a result of the interaction of volatile organic chemicals
(VOCs) and nitrogen oxides and expressed in terms of mass of ethylene equivalence
(Athena Institute, 2009). The smog potential of Fred Kaiser Building is broken up by life-
cycle stage as shown in figure below
Figure 6 Smog Potential
Eutrophication Potential
Eutrophication potential is expressed in terms of mass equivalence of nitrogen
(Athena Institute, 2009). When photosynthetic plant life such as algae proliferate,
nutrients and oxygen are exhausted during certain period of time, which potentially harm
aquatic life and/or producing other negative effects in the fish water habitat. The
eutrophication potential of Fred Kaiser is broken up by life-cycle stage as shown below.

19
Figure 7 Eutrophication Potential
Weight Resource Use
Subjective weighting was studied and adopted with accordance to resource
extraction and experts for the use of this software. The weighted resources include raw
materials such as copper, iron ore, coal, and lumber. These weighted resources were
factored and applied in the Impact Estimator’s Bill of Materials. The results are expressed
what can be thought of as “ecologically weighted kilograms” that represent relative levels
of environmental impact based on expert opinion. The raw materials were used mainly at
the manufacturing stage and the impact is reflected in the figure 8 below.
Figure 8 Weighted resources

20
Summary Measure Table
The table of summary measure in manufacturing, construction and end of life is
listed below. Since the expected life of building is assumed to be one year, all other
stages are not considered in the summary measure. The energy is in mega joule and the
all other quantities are in equivalent kilogram. The results are shown below.
Table 3 Overall Summary measure
Uncertainties
The numbers shown in the summary measures table are not considered as
absolutely accurate, but also accounts for uncertainties inherent within LCA. The Athena
Impact Estimator uses average weighted values of products to come up with an
environmental score (Athena Institute, 2009). The average value can result in
Manufacturing
Construction
End - Of - Life
Material Transportation Material Transportation Material Transportation
Total Effects
Primary Energy
Consumption MJ
25816076.
1
841654.9866 1168404.239 1772751.6 5791.743271 538250.0841 30142928.76
Weighted
Resource Use kg
18925396.
67
538.9645362 27071.32139 1157.064986 136.1422534 366.7608982 18954666.92
Global Warming
Potential (kg CO2
eq)
2666112.1
61
1394.408661 79785.49303 3242.845436 377.0380854 1037.649065 2751949.595
Acidification
Potential (moles
of H+ eq)
1115111.5
52
483.6228924 36557.34849 1031.392849 20.90372548 327.2683696 1153532.088
HH Respiratory
Effects Potential
(kg PM2.5 eq)
10556.789
14
0.583455294 41.30474929 1.239946926 0.019900016 0.393302993 10600.33049
Eutrophication
Potential (kg N
eq)
1226.8480
02
0.504020331 36.23373163 1.069021029 0.014353104 0.309181237 1264.978309
Ozone Depletion
Potential (kg
CFC-11 eq)
0.0042092
53 5.7497E-08 8.81563E-11 1.32808E-07 1.69861E-08 4.24864E-08 0.004209503
Smog Potential
(kg NOx eq)
13111.069
81 10.92377548 908.6570404 23.04033652 0.268604189 7.304462828 14061.26403

21
overestimation or underestimation of the impacts. The assumptions of TRACI are that the
impact of a product grows linearly proportional amount of the used product increases
(��������. This linear relationship does not reflect the actual relationship between
impacts and material quantity which also accounts for other factors such as economy,
capacity constraints. The detailed manufacturing information can be limited due to
confidentiality for a private sector (��������� Imported products such as made-in-China
are more difficult to be analyzed since they are not local products and information
regarding manufacturing, transportation and environmental conditions is unknown or
uncertain.
6.0 SENSITIVITY ANALYSIS
In sensitivity analyses, five important materials were chosen to study the effects
of different materials on the overall impact of the building. The five materials are
concrete 30MPa flyash average; concrete block; 5/8” regular gypsum board; glazing
panel; rebar rod and light section. 10% of the chosen materials were added to the extra
materials in the original models to compare with the impact of the original building. The
focus of the study on these materials is solely on manufacturing and construction phases,
since the impacts are most significant in these two phases.

22
Concrete Block
Concrete block was mainly used in the interior walls inside the building. Quantity
of concrete block was increased by 10% in the original building. The table 4 shows that
changes made on concrete block has relatively higher impact on energy consumption and
global warming potential, ozone depletion potential and smog and acidification potential.
It matches the facts that production of mortar and concrete masonry release greenhouse
gases. However, the impact of concrete block is relatively insignificant to the overall
impact of the building as shown in figure 9.
Add 10% Concrete Block % Difference
Primary Energy Consumption 0.216%
Weighted Resource Use 0.014%
Global Warming Potential 0.248%
Acidification Potential 0.255%
HH Respiratory Effects Potential 0.192%
Eutrophication Potential 0.104%
Ozone Depletion Potential 0.246%
Smog Potential 0.203%
Table 4 Concrete block % difference
0.00 5,000,000.00
10,000,000.00
15,000,000.00
20,000,000.00
25,000,000.00
30,000,000.00
35,000,000.00
Primary Energy Consumption
Weighted Resource Use
Global Warming Potential
Acidification Potential
HH Respiratory Effects Potential
Eutrophication Potential
Ozone Depletion Potential
Smog Potential
Original Kaiser Kaiser + 10% concrete block Figure 9 Addition of 10% concrete block

23
Concrete 30MPa with average fly ash
Concrete 30MPa average fly ash was mainly used in the interior walls inside the
building. Quantity of concrete 30MPa was increased by 10% in the original building. The
table 5 shows that changes made on concrete 30MPa has relatively higher impact on
weighted resource use and global warming potential, ozone depletion potential and smog
and acidification potential. It matches the facts that production of concrete requires raw
materials of gravel and sand for concrete aggregates and the chemical process of the
concrete curing releases green house gases. Overall, the impact of concrete block is
relatively significant to the overall impact of the building as shown in figure 10 Add 10% Concrete 30MPa % Difference
Primary Energy Consumption 2.49%
Weighted Resource Use 5.68%
Global Warming Potential 4.12%
Acidification Potential 3.92%
HH Respiratory Effects Potential 2.94%
Eutrophication Potential 2.17%
Ozone Depletion Potential 5.52%
Smog Potential 4.33%
Table 5 Concrete 30MPa % difference
0.00 5,000,000.00
10,000,000.00
15,000,000.00
20,000,000.00
25,000,000.00
30,000,000.00
35,000,000.00
Primary Energy Consumption
Weighted Resource Use
Global Warming Potential
Acidification Potential
HH Respiratory EffectsPotential
Eutrophication Potential
Ozone Depletion Potential
Smog Potential
Original Kaiser Kaiser + 10% Concrete 30mpa flyash average Figure 10 Addition of 10% concrete 30MPa with flyash average
24
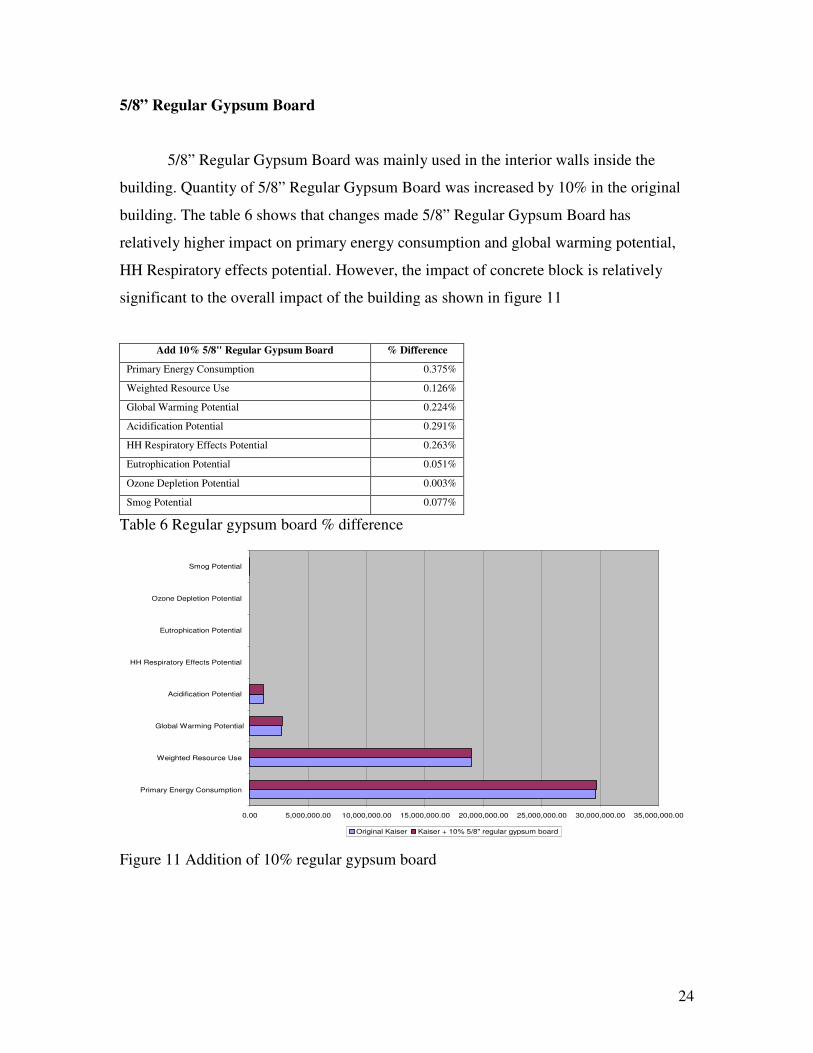
5/8” Regular Gypsum Board
5/8” Regular Gypsum Board was mainly used in the interior walls inside the
building. Quantity of 5/8” Regular Gypsum Board was increased by 10% in the original
building. The table 6 shows that changes made 5/8” Regular Gypsum Board has
relatively higher impact on primary energy consumption and global warming potential,
HH Respiratory effects potential. However, the impact of concrete block is relatively
significant to the overall impact of the building as shown in figure 11
Add 10% 5/8" Regular Gypsum Board % Difference
Primary Energy Consumption 0.375%
Weighted Resource Use 0.126%
Global Warming Potential 0.224%
Acidification Potential 0.291%
HH Respiratory Effects Potential 0.263%
Eutrophication Potential 0.051%
Ozone Depletion Potential 0.003%
Smog Potential 0.077%
Table 6 Regular gypsum board % difference
0.00 5,000,000.00 10,000,000.00 15,000,000.00 20,000,000.00 25,000,000.00 30,000,000.00 35,000,000.00
Primary Energy Consumption
Weighted Resource Use
Global Warming Potential
Acidification Potential
HH Respiratory Effects Potential
Eutrophication Potential
Ozone Depletion Potential
Smog Potential
Original Kaiser Kaiser + 10% 5/8" regular gypsum board Figure 11 Addition of 10% regular gypsum board
25
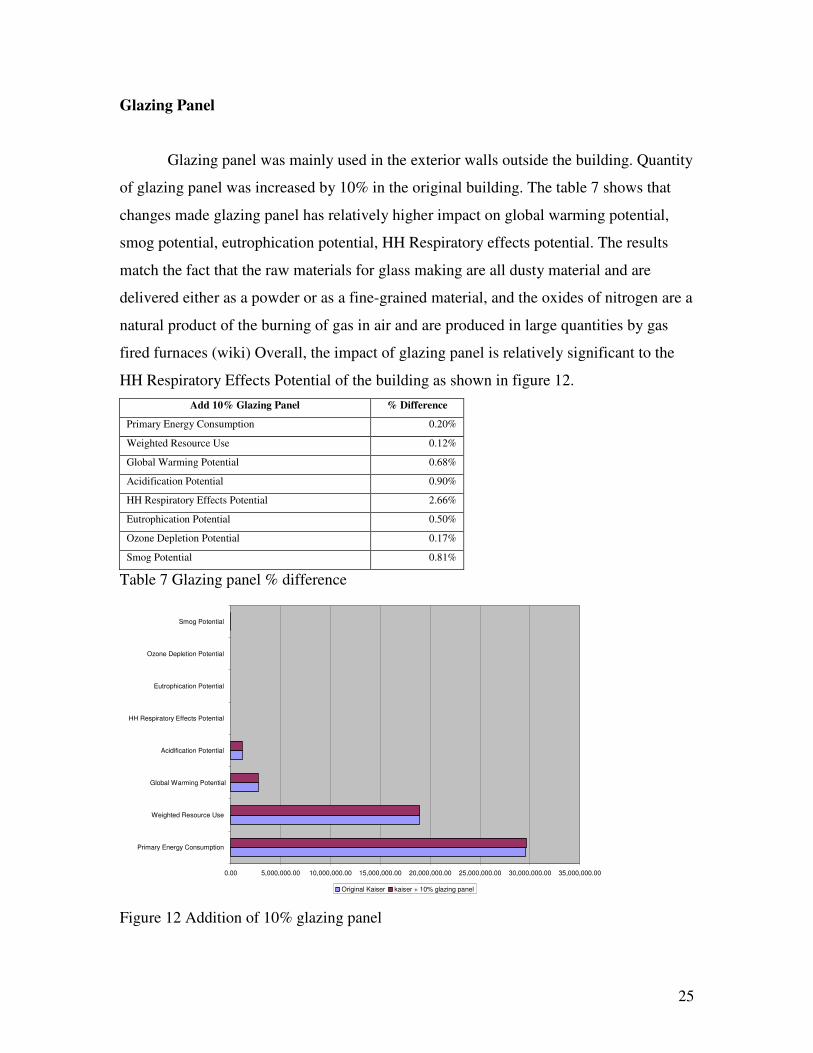
Glazing Panel
Glazing panel was mainly used in the exterior walls outside the building. Quantity
of glazing panel was increased by 10% in the original building. The table 7 shows that
changes made glazing panel has relatively higher impact on global warming potential,
smog potential, eutrophication potential, HH Respiratory effects potential. The results
match the fact that the raw materials for glass making are all dusty material and are
delivered either as a powder or as a fine-grained material, and the oxides of nitrogen are a
natural product of the burning of gas in air and are produced in large quantities by gas
fired furnaces (wiki) Overall, the impact of glazing panel is relatively significant to the
HH Respiratory Effects Potential of the building as shown in figure 12. Add 10% Glazing Panel % Difference
Primary Energy Consumption 0.20%
Weighted Resource Use 0.12%
Global Warming Potential 0.68%
Acidification Potential 0.90%
HH Respiratory Effects Potential 2.66%
Eutrophication Potential 0.50%
Ozone Depletion Potential 0.17%
Smog Potential 0.81%
Table 7 Glazing panel % difference
0.00 5,000,000.00 10,000,000.00 15,000,000.00 20,000,000.00 25,000,000.00 30,000,000.00 35,000,000.00
Primary Energy Consumption
Weighted Resource Use
Global Warming Potential
Acidification Potential
HH Respiratory Effects Potential
Eutrophication Potential
Ozone Depletion Potential
Smog Potential
Original Kaiser kaiser + 10% glazing panel Figure 12 Addition of 10% glazing panel
26
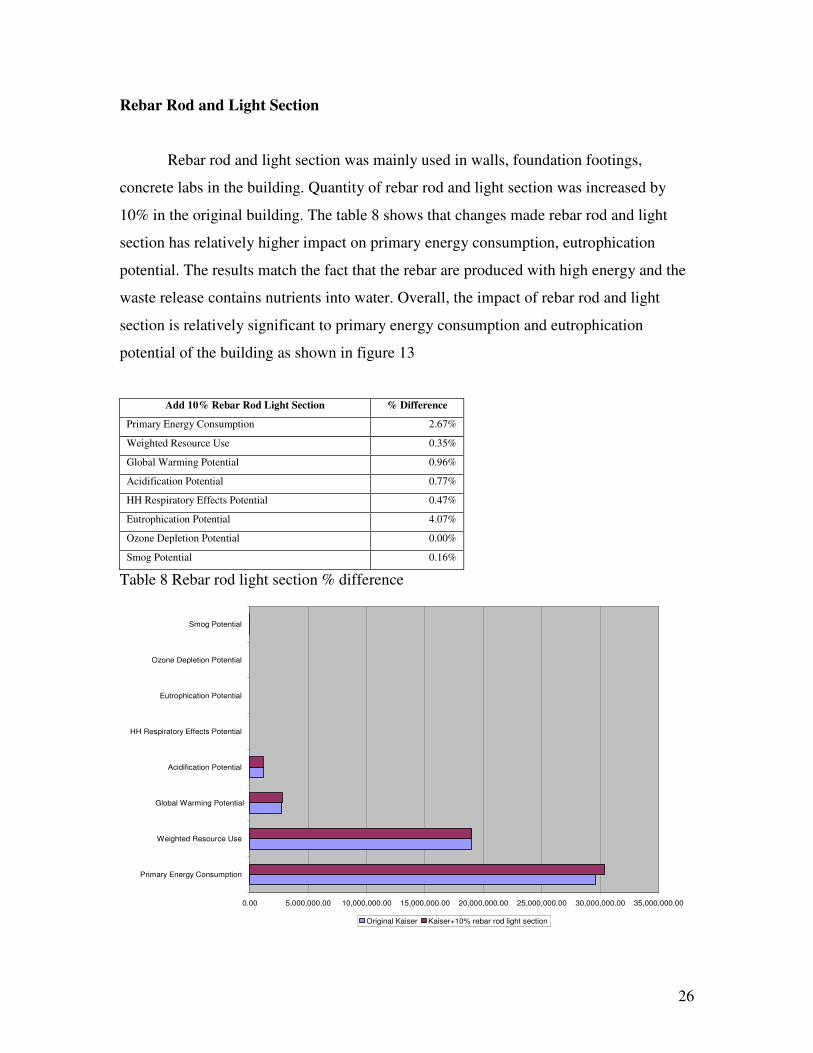
Rebar Rod and Light Section
Rebar rod and light section was mainly used in walls, foundation footings,
concrete labs in the building. Quantity of rebar rod and light section was increased by
10% in the original building. The table 8 shows that changes made rebar rod and light
section has relatively higher impact on primary energy consumption, eutrophication
potential. The results match the fact that the rebar are produced with high energy and the
waste release contains nutrients into water. Overall, the impact of rebar rod and light
section is relatively significant to primary energy consumption and eutrophication
potential of the building as shown in figure 13
Add 10% Rebar Rod Light Section % Difference
Primary Energy Consumption 2.67%
Weighted Resource Use 0.35%
Global Warming Potential 0.96%
Acidification Potential 0.77%
HH Respiratory Effects Potential 0.47%
Eutrophication Potential 4.07%
Ozone Depletion Potential 0.00%
Smog Potential 0.16%
Table 8 Rebar rod light section % difference
0.00 5,000,000.00 10,000,000.00 15,000,000.00 20,000,000.00 25,000,000.00 30,000,000.00 35,000,000.00
Primary Energy Consumption
Weighted Resource Use
Global Warming Potential
Acidification Potential
HH Respiratory Effects Potential
Eutrophication Potential
Ozone Depletion Potential
Smog Potential
Original Kaiser Kaiser+10% rebar rod light section

27
Figure13 Addition of 10% rebars rod light section
When performing life cycle analysis on the building, sensitivity analysis can be applied in
the building design phase when decisions are made on material strengths and quantities.
It can also facilitate decision making with regards to the building maintenance schedule
and potential building upgrades. Design consultants and project manager would have a
better understanding of the implications of alteration in material quantities on various
summary measures.
7.0 BUILDING PERFORMANCE
Fred Kaiser Building was modeled as close as possible to its originality in the
Impact Estimator. The R-value of insulations of roofs, exterior walls and windows were
assigned according to the information of the drawing. The roofs generally have R-20
insulation as indicated in the drawing legend; windows are low E argon filled glazing; the
insulation for concrete wall is assumed to be R-1. The insulations were modified to meet
the Residential Environmental Assessment Program’s (REAP) requirements, where
minimum R-value for roof is 40; R-value for exterior wall Insulation is 18; minimum R-
value for windows is 3.2 (UBC). In order to meet requirements, the walls were equipped
with 2.36 inches foam polyisocyanurate with R-value of 7.2 and the roofs were equipped
with 2.78 inches foam polyisocyanurate with R-value of 7.2 (Colorado).
The energy consumption for manufacturing and construction of the original
Kaiser building was determined to be 36,356,885.2 Mega Joules. For the improved
building, the energy consumption is increased to be 36961362.19 Megal Joules. The
increase in energy consumption was related to addition of foam polyisocyanurate for
insulating materials added to the building envelope. The R-value assigned to the windows
and glazing panels is adequate enough to meet the REAP requirement.
The operating energy usage per year was calculated according to the heat loss
equation Q = A (�T)/R (2) where, R = Calculated R-Value in ft2 ºF h/BTU (these are the

28
Imperial units); A = Assembly of interest ft2; �T = Inside Temperature – Outside
Temperature in ºF. The heat loss was calculated every month and accumulated over the
year for total operating energy. The inside temperature was set to be (20�C); the outside
temperature was based on historical average. The area of external exposure (A) was total
area of the external wall; windows and roof. The R-value (R) used was the weighted
average of the thermal resistance based on the surface area of the given medium.
The energy consumption for manufacturing and construction was input at time
zero and was added by calculated yearly operating energy over 80 years. The trend of
current energy consumption was plotted against the improved energy consumption,
where the intersection point of the two is anticipated as energy pay-back period as shown
in figure 14
0.00
20,000.00
40,000.00
60,000.00
80,000.00
100,000.00
120,000.00
140,000.00
0 3 6 9 12 15 18 21 24 27 30 33 36 39 42 45 48 51 54 57 60 63 66 69 72 75 78
Years
Ene
rgy
Loss
(G
J)
Current Building Improved Building
Figure 14 Comparison of building performance between current building and improved
building
Payback period indicates the length of time for energy saved to recover energy invested
in the improved building at manufacturing and construction stage. The figure() shows

29
that the payback period is approximately 3 years. However, there are still uncertainties in
the energy performance model and payback period calculations since the model is very
basic and it does not account for window frame type and detailed information of the
insulation. However, this model provides a general idea that the improvement on
insulation of the building is recommended, since the building will begin to save energy
yearly after short period time.
30
8.0 CONCLUSION
The life cycle assessment of Fred Kaiser Building was conducted by using
OnScreen takeoffs and Athena Impact Estimator. The information regarding the building
materials was mainly referred to the digital drawing from UBC campus planning and
development office. The information inputs into Athena Impact Estimator were also
based on assumptions under appropriate research, onsite observation and data round up.
The input details and assumption are illustrated in Appendix A and B
The summary measures indicate that environmental impacts are significant at
manufacturing and construction stages, where the primary energy consumption is
30142928.76 Mega Joules. The sensitivity analysis shows that input of concrete pour
with 30MPa can easily affect the environmental impact assessment. Glazing panels can
highly increase HH Respiratory effects potential. Rebar, rod and light section is also
affects the primarily energy consumption largely with 10% quantity increase. The
building performance was highly improved with addition of insulations. The initial
primary energy invested in improvement can be recovered in approximately three years
by the energy saved within the building.
However, Athena Impact Estimator is one of several tools for Life Cycle
Assessment. The model created by the software is relatively basic and subject to change
due to known and unknown uncertainties. The results provided by this study have
noticeable significance in providing the audiences with a general view of the
environmental impact. Meanwhile there are also other tools available for conducting
LCA such as SimaPro, which can be used for comparing results for further study.

31
REFERENCE
Coloradoenergy.org, R Value Table, 2008 retrieved from
http://www.coloradoenergy.org/procorner/stuff/r-values.htm
Claude Duchesne, Tim Kersey and Michel Lelong, Durability of Two-PLY SBS
modified bitumen roofing membranes: 10-year performance results. Proceeding of the
Fourth International Symposium on Roofing Technology
Heijungs, Reinout, and Mark A.J. Huijbregts. "A Review of Approaches to Treat
Uncertainty in LCA." International Environmental Modelling and Software Society. 2008.
iEMSs. 20 March 2010<http://www.iemss.org/iemss2004/pdf/lca/heijarev.pdf>.
Huijbregts, Jan, and Mark Antonius. Uncertainty and variability in environmental life-
cycle assessment. 1st. Huijbregts, M.A.J.: Printed PrintPartners Ipskamp b.v., 2001.
Hendrickson, Chris T., Lester B. Lave, and H. Scott Matthews. Environmental Life Cycle
Assessment of Goods and Services. An Input-Output Approach. 1. Washignton: Green
Design Institute, 2006.
Robin Runet, April 2005, Fred Kaiser Building-UBC, http://www.omicronaec.com/
The Athena Institute, 2009, retrieved from http://www.athenasmi.org/about/index.html
The Athena Institute. "Known Issues with the Impact Estimator for buildings." Athena
Institute.15 Jan 2009. The Athena Institute. 26 Mar 2010
<http://www.athenasmi.org/tools/impactEstimator/knownIssues.html>.
University of British Columbia, 2010 Residential Environmental Assessment Program,
retrieved from http://www.sustain.ubc.ca/campus-sustainability/greening-the-
campus/residential-environmental-assessment-program

32
Wikipedia, Curtain wall, 2010 retrieved from http://en.wikipedia.org/wiki/Curtain_wall

33
Appendix A – Impact Estimator Input Tables
Input Values Assembly Group
Assembly Type Assembly Name Input Fields Known/Measu
red IE Inputs
1 Foundation
1.1 Concrete Slab-on-Grade
1.1.1 SOG_150mm
Length (m) 43.92 53.79
Width (m) 43.92 53.79
Thickness (mm) 150 100
Concrete (MPa) 25 30
Concrete flyash % 50% average
1.2 Concrete Footing
1.2.1 Footing_F1
Length (m) 0.9 0.9
Width (m) 0.9 0.90
Thickness (mm) 300 300
Concrete (MPa) 25 30
Concrete flyash % 50 average
Rebar 20M 20M
1.2.2 Footing_F2

34
Length (m) 1.2 1.2
Width (m) 1.2 1.20
Thickness (mm) 300 300
Concrete (MPa) 25 30
Concrete flyash % 50 average
Rebar 20M 20M
1.2.3. Footing_F3
Length (m) 1.5 1.5
Width (m) 1.5 1.5
Thickness (mm) 400 400
Concrete (MPa) 25 30
Concrete flyash % 50 average
Rebar 20M 20M
1.2.4 Footing_F4
Length (m) 1.75 1.84
Width (m) 1.75 1.84
Thickness (mm) 550 500
Concrete (MPa) 25 30
Concrete flyash % 50 average
Rebar 20M 20M
1.2.5 Footing_F5
Length (m) 2 2.19
Width (m) 2 2.19
Thickness (mm) 600 500

35
Concrete (MPa) 25 30
Concrete flyash % 50 average
Rebar 20M 20M
1.2.6 Footing_F6
Length (m) 2.25 2.66
Width (m) 2.25 2.66
Thickness (mm) 700 500
Concrete (MPa) 25 30
Concrete flyash % 50 average
Rebar 20M 20M
1.2.7 Footing_F7
Length (m) 2.85 3.6
Width (m) 2.85 3.6
Thickness (mm) 800 500
Concrete (MPa) 25 30
Concrete flyash % 50 average
Rebar 25M 20M
1.2.8 Footing_F8
Length (m) 1.6 2.5
Width (m) 2.8 0.00
Thickness (mm) 700 500
Concrete (MPa) 25 30
Concrete flyash % 50 average
Rebar 25M 20M
36
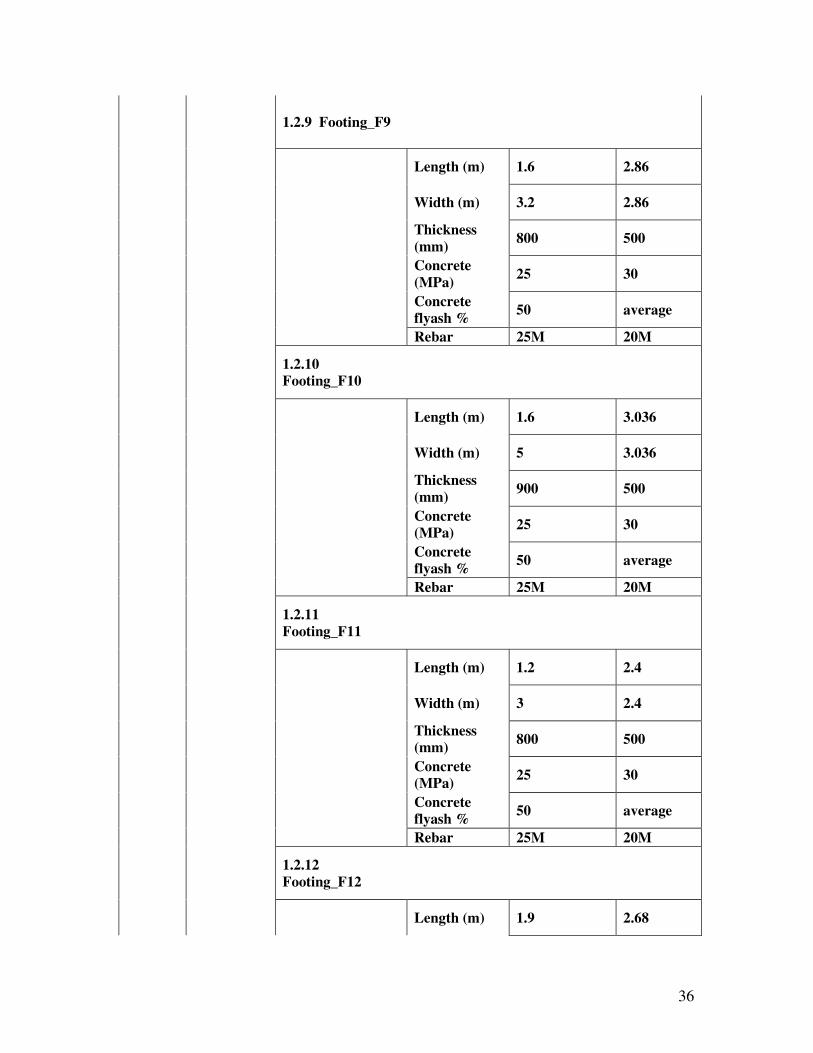
1.2.9 Footing_F9
Length (m) 1.6 2.86
Width (m) 3.2 2.86
Thickness (mm) 800 500
Concrete (MPa) 25 30
Concrete flyash % 50 average
Rebar 25M 20M
1.2.10 Footing_F10
Length (m) 1.6 3.036
Width (m) 5 3.036
Thickness (mm) 900 500
Concrete (MPa) 25 30
Concrete flyash % 50 average
Rebar 25M 20M
1.2.11 Footing_F11
Length (m) 1.2 2.4
Width (m) 3 2.4
Thickness (mm) 800 500
Concrete (MPa) 25 30
Concrete flyash % 50 average
Rebar 25M 20M
1.2.12 Footing_F12
Length (m) 1.9 2.68

37
Width (m) 2.7 2.68
Thickness (mm) 700 500
Concrete (MPa) 25 30
Concrete flyash % 50 average
Rebar 25M 20M
1.2.13 Footing_F13
Length (m) 2.7 3.367
Width (m) 3 3.367
Thickness (mm) 700 500
Concrete (MPa) 25 30
Concrete flyash % 50 average
Rebar 25M 20M
1.2.14 Footing_F14
Length (m) 0.7 0.77
Width (m) 0.7 0.77
Thickness (mm) 600 500
Concrete (MPa) 25 30
Concrete flyash % 50 average
Rebar 25M 20M
1.2.15 Footing_F16
Length (m) 0.45 0.45
Width (m) 0.45 0.45
Thickness (mm) 250 250
Concrete (MPa) 25 30

38
Concrete flyash % 50 average
Rebar 15M 15M
1.2.16 Footing_F17
Length (m) 0.6 0.6
Width (m) 0.6 0.6
Thickness (mm) 450 450
Concrete (MPa) 25 30
Concrete flyash % 50 average
Rebar 20M 20M
1.2.17 Footing_F18
Length (m) 0.90 0.90
Width (m) 0.90 0.90
Thickness (mm) 450.00 450
Concrete (MPa) 25 30
Concrete flyash % 50 average
Rebar 20M 20M
1.2.18 Footing_F19
Length (m) 0.45 0.45
Width (m) 0.45 0.45
Thickness (mm) 250.00 250
Concrete (MPa) 25 30
Concrete flyash % 50 average
Rebar 15M 15M
1.2.19 Footing_F20

39
Length (m) 0.60 0.60
Width (m) 0.60 0.60
Thickness (mm) 300.00 300
Concrete (MPa) 25 30
Concrete flyash % 50 average
Rebar 15M 15M
1.2.20 Footing_SF
Length (m) 0.45 0.45
Width (m) 0.45 0.45
Thickness (mm) 250.00 250
Concrete (MPa) 25 30
Concrete flyash % 50 average
Rebar 15M 15M
1.2.21 Stairs_Concrete_TotalLength
Length (m) 54 54
Width (m) 2 4.8
Thickness (mm) 0.48 0.48
Concrete (MPa) 25 30
Concrete flyash % 50 average
Rebar 15M 15M 2 Walls
2.1 Cast In Place

40
2.1.1 Wall_Cast-in-Place_CW4_440mm
Length (m) 12 12.00
Height (m) 3.1 4.55
Thickness (mm) 440 300
Concrete (MPa) 25 30
Concrete flyash % 40 average
Rebar 15M 15M
2.1.2 Wall_Cast-in-Place_CW5_517mm
Length (m) 19 19
Height (m) 3.1 5.34
Thickness (mm) 517 300
Concrete (MPa) 25 30
Concrete flyash % 40 average
Rebar 20M 20M
2.1.3 Wall_Cast-In-Place_CW6_612mm
Length (m) 14 14
Height (m) 3.1 6.324
Thickness (mm) 612 300
Concrete (MPa) 25 30

41
Concrete flyash % 40 average
Rebar 20M 20M
2.1.4 Wall_Cast-in-Place_Partition_300mm
Length (m) 59 59
Height (m) 3.10 3.10
Thickness (mm) 300 300
Concrete (MPa) 25 30
Concrete flyash % 40 average
Rebar 20M 20M
2.1.5 Wall_Cast-in-Place_perimeter wall_220mm
Length (m) 233 233
Height (m) 3.1 2.27
Thickness (mm) 220 300
Concrete (MPa) 25 30
Concrete flyash % 40 average
Rebar 20M 20M
2.2 Concrete Block Wall
2.2.1 Wall_ConcreteBlock_W01_407mm

42
Length (m) 63 63
Height (m) 3.1 3.1
Rebar 15M 15M
Door Opening Number of Doors 4 4
Door Type -
Steel Interior Door, 50% glazing
2.2.2 Wall_ConcreteBlock_W02_410mm
Length (m) 447 447
Height (m) 3.1 3.1
Rebar 15M 15M
Door Opening Number of Doors 23 23
Door Type -
Steel Interior Door, 50% glazing
2.2.3 Wall_ConcreteBlock_W03_472mm
Length (m) 33 33
Height (m) 3.1 3.1
Rebar 15M 15M
Door Opening Number of Doors 1 1
Door Type -
Steel Interior Door, 50% glazing

43
Steel Studs
Length (m) 33 33
Height (m) 3.1 3.1
Stud Spacing - 400 O.C
Stud Weight - Light (25Ga)
Stud Thickness - 39x92
Sheathing Type - None
Envelope Category Gypsum Board
Gypsum Board
Material Gypsum Regular 5/8"
Gypsum Regular 5/8"
Thickness (mm) 16 16
2.2.4 Wall_ConcreteBlock_W06_230mm
Length (m) 47 47
Height (m) 3.1 3.1
Rebar 15M 15M
Door Opening Number of Doors 3 3
Door Type -
Steel Interior Door, 50% glazing
2.2.5 Wall_ConcreteBlock_W07_442mm
Length (m) 50 50

44
Height (m) 3.1 3.1
Rebar 15M 15M
Door Opening Number of Doors 0 0
Door Type -
Steel Interior Door, 50% glazing
Steel Studs
Length (m) 33 33
Height (m) 3.1 3.1
Stud Spacing - 400 O.C
Stud Weight - Light (25Ga)
Stud Thickness - 39x92
Sheathing Type - None
Envelope Category Gypsum Board
Gypsum Board
Material Gypsum Regular 5/8"
Gypsum Regular 5/8"
Thickness (mm) 16 16
2.2.6 Wall_ConcreteBlock_W05_445mm
Length (m) 6 6
Height (m) 3.1 3.1
Rebar 15M 15M
Door Opening Number of Doors 1 1

45
Door Type -
Steel Interior Door, 50% glazing
Steel Studs
Length (m) 6 6
Height (ft) 3.1 3.1
Stud Spacing 400 O.C 400 O.C
Stud Weight - Light (25Ga)
Stud Thickness - 39x92
Sheathing Type - None
Envelope Category Gypsum Board
Gypsum Board
Material Gypsum Regular 5/8"
Gypsum Regular 5/8"
Thickness (mm) 16 16
Sheathing Type - None
Category Gypsum Board
Gypsum Board
Material Gypsum Regular 5/8"
Gypsum Regular 5/8"
Thickness (mm) 16 16
2.2.7 Wall_ConcreteBlock_W05a_445mm
Length (m) 6 6
Height (m) 3.1 3.1
Rebar 15M 15M

46
Door Opening Number of Doors 3 1
Door Type -
Steel Interior Door, 50% glazing
Steel Studs
Length (m) 6 6
Height (ft) 3.1 3.1
Stud Spacing 400 O.C 400 O.C
Stud Weight - Light (25Ga)
Stud Thickness - 39x92
Sheathing Type - None
Envelope Category Insulation Insulation
Material acoustic insulation
Fiberglass Batt
Thickness (mm) 50 50
Category Gypsum Board
Gypsum Board
Material Gypsum Regular 5/8"
Gypsum Regular 5/8"
Thickness (mm) 16 16
2.2.8 Wall_ConcreteBlock_W05b_445mm
Length (m) 86 86
Height (m) 3.1 3.1
Rebar 15M 15M
Door Opening Number of Doors 3 3

47
Door Type -
Steel Interior Door, 50% glazing
Steel Studs
Length (m) 86 86
Height (ft) 3.1 3.1
Stud Spacing 400 O.C 400 O.C
Stud Weight - Light (25Ga)
Stud Thickness - 39x92
Sheathing Type - None
Envelope Category Gypsum Board
Gypsum Board
Material Gypsum Regular 5/8"
Gypsum Regular 5/8"
Thickness (mm) 16 16
2.2.9 Wall_ConcreteBlock_W18a_232mm
Length (m) 11 11
Height (m) 3.1 3.1
Rebar 15M 15M
Door Opening Number of Doors 0 0
Door Type -
Steel Interior Door, 50% glazing
Steel Studs
48
Length (m) 11 11
Height (m) 3.1 3.1
Stud Spacing 400 O.C 400 O.C
Stud Weight - Light (25Ga)
Stud Thickness - 39x92
Sheathing Type - None
Envelope Category Gypsum Board
Gypsum Board
Material Gypsum Regular 5/8"
Gypsum Regular 5/8"
Thickness (mm) 16 16
Category Gypsum Board
Gypsum Board
Material Gypsum Regular 5/8"
Gypsum Regular 5/8"
Thickness (mm) 16 16
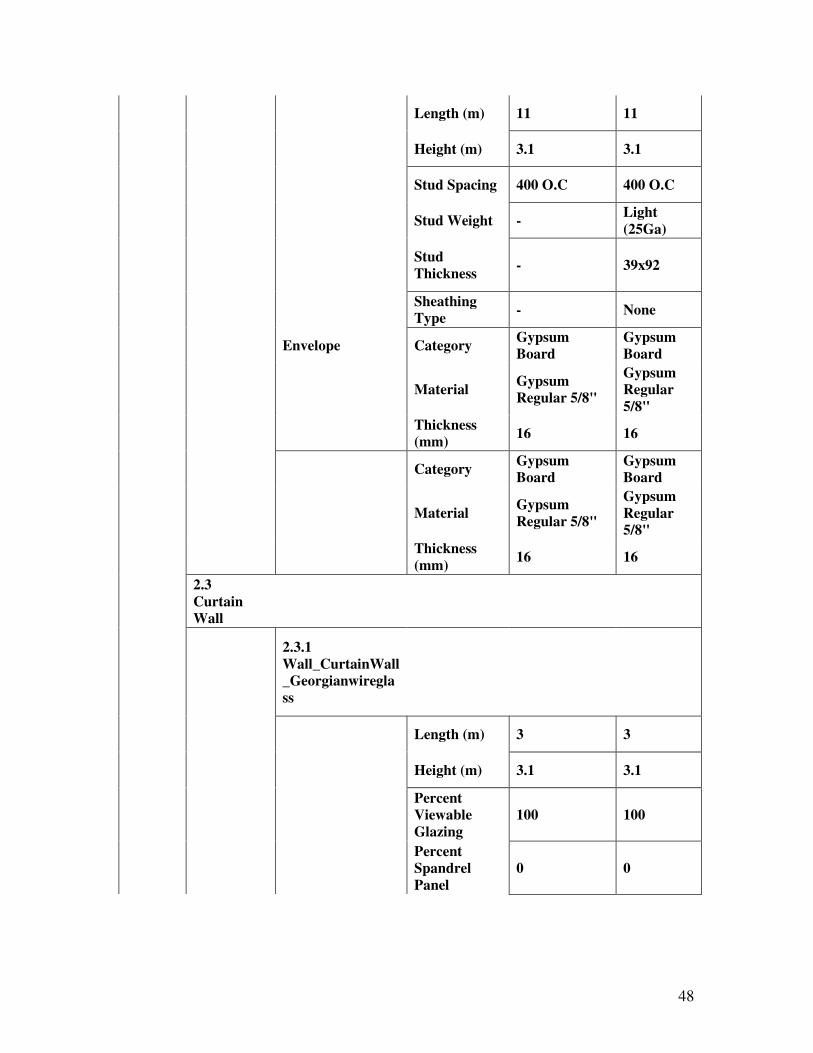
2.3 Curtain Wall
2.3.1 Wall_CurtainWall_Georgianwireglass
Length (m) 3 3
Height (m) 3.1 3.1
Percent Viewable Glazing
100 100
Percent Spandrel Panel
0 0

49
Thickness of Insulation (mm)
12 12
Spandrel Type (Metal/Glass)
glass glass
2.3.2 Wall_CurtainWall_clear glass screen
Length (m) 96 96
Height (m) 3.1 3.1
Percent Viewable Glazing
100 100
Percent Spandrel Panel
0 0
Thickness of Insulation (mm)
12 12
Spandrel Type (Metal/Glass)
glass glass
Door Opening Number of Doors 17 17
Door Type -
Aluminum Exterior Door, 80% glazing
2.3.2 Wall_CurtainWall_W8.1
Length (m) 254 254
Height (m) 3.1 3.1

50
Percent Viewable Glazing
100 100
Percent Spandrel Panel
0 0
Thickness of Insulation (mm)
12 12
Spandrel Type (Metal/Glass)
glass glass
Door Opening Number of Doors 10 10
Door Type -
Aluminum Exterior Door, 80% glazing
2.3.2 Wall_CurtainWall_W8.2
Length (m) 459 459
Height (m) 3.1 3.1
Percent Viewable Glazing
100 100
Percent Spandrel Panel
0 0
Thickness of Insulation (mm)
12 12
Spandrel Type (Metal/Glass)
glass glass
Door Opening Number of Doors 4 4

51
Door Type -
Aluminum Exterior Door, 80% glazing
Windows Number of windows 143 143
Total Windows Area(m^2)
1.00 1
Glazing Low E Operable
Low E Tin Glazing Operable
Frame Type -
Aluminum Exterior Door, 80% glazing
2.3.2 Wall_CurtainWall_W8.3
Length (m) 210 210
Height (m) 3.1 3.1
Percent Viewable Glazing
100 100
Percent Spandrel Panel
0 0
Thickness of Insulation (mm)
- 6
Spandrel Type (Metal/Glass)
glass glass
Door Opening Number of Doors 4 4

52
Door Type -
Aluminum Exterior Door, 80% glazing
Windows Number of windows 32 32
Total Windows Area(m^2)
1.00 1
Glazing Low E Operable
Low E Tin Glazing Operable
Frame Type -
Aluminum Exterior Door, 80% glazing
2.4 Steel Stud
2.4.1 Wall_SteelStud_Wall09
Length (m) 1374 1374
Height (m) 3.1 3.1
Sheathing Type - None
Stud Spacing 400 O.C 400 O.C
Stud Weight - Light (25Ga)
Stud Thickness 92 39x92
Door Opening Number of Doors 74 74
Door Type -
Hollow Core Wood Interior Door

53
Envelope Category Gypsum Wood Board
Gypsum Board
Material - Gypsum Regular 5/8"
Thickness(mm) 16 16
Category Gypsum Wood Board
Gypsum Board
Material - Gypsum Regular 5/8"
Thickness(mm) 16 16
2.4.2 Wall_SteelStud_Wall09a
Length (m) 64 64
Height (m) 3.1 3.1
Sheathing Type None None
Stud Spacing 400 O.C 400 O.C.
Stud Weight - Light (25Ga)
Stud Thickness 92 39x92
Door Opening Number of Doors 1 1
Door Type -
Hollow Core Wood Interior Door
Envelope Category Insulation Insulation
Material acoustic insulation
Fiberglass Batt
Thickness (mm) 50 50
Category Gypsum Wood Board
Gypsum Wood Board
54
Material GWB Gypsum Regular 5/8"
Thickness - -
Category Gypsum Board
Gypsum Board
Material - Gypsum Regular 5/8"
Thickness (mm) 16 16
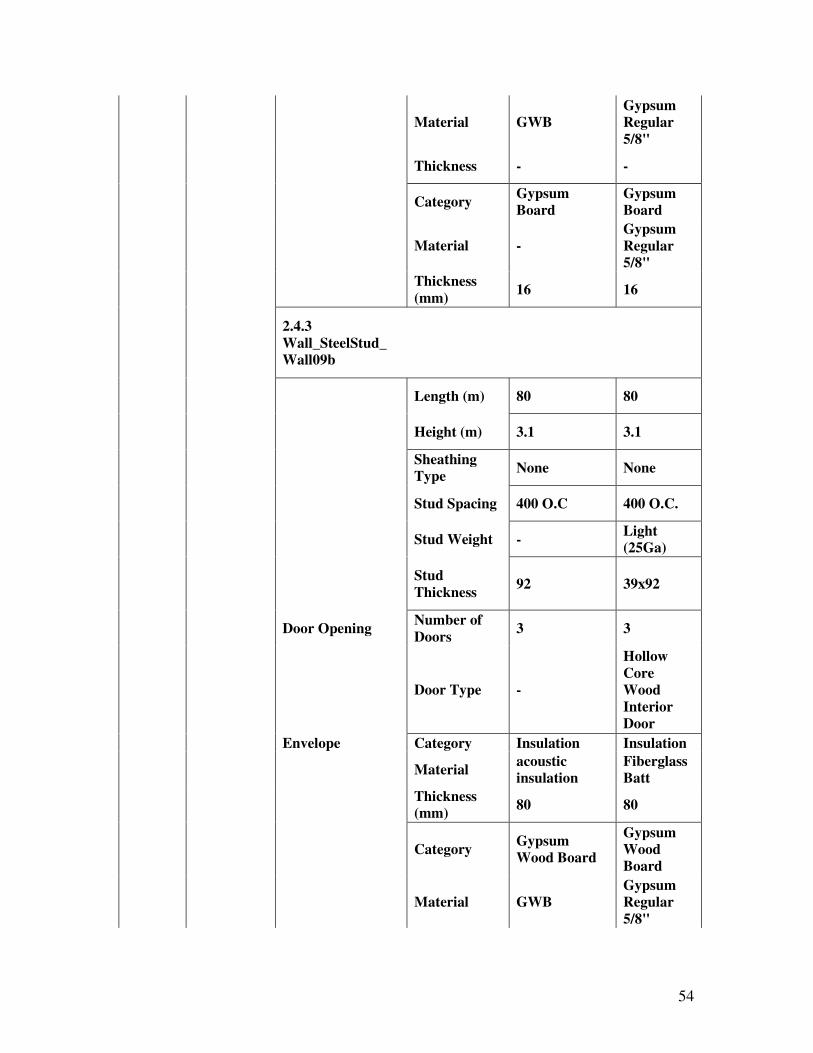
2.4.3 Wall_SteelStud_Wall09b
Length (m) 80 80
Height (m) 3.1 3.1
Sheathing Type None None
Stud Spacing 400 O.C 400 O.C.
Stud Weight - Light (25Ga)
Stud Thickness 92 39x92
Door Opening Number of Doors 3 3
Door Type -
Hollow Core Wood Interior Door
Envelope Category Insulation Insulation
Material acoustic insulation
Fiberglass Batt
Thickness (mm) 80 80
Category Gypsum Wood Board
Gypsum Wood Board
Material GWB Gypsum Regular 5/8"
55
Thickness 16 16
Category Gypsum Board
Gypsum Board
Material GWB Gypsum Regular 5/8"
Thickness (mm) 16 16
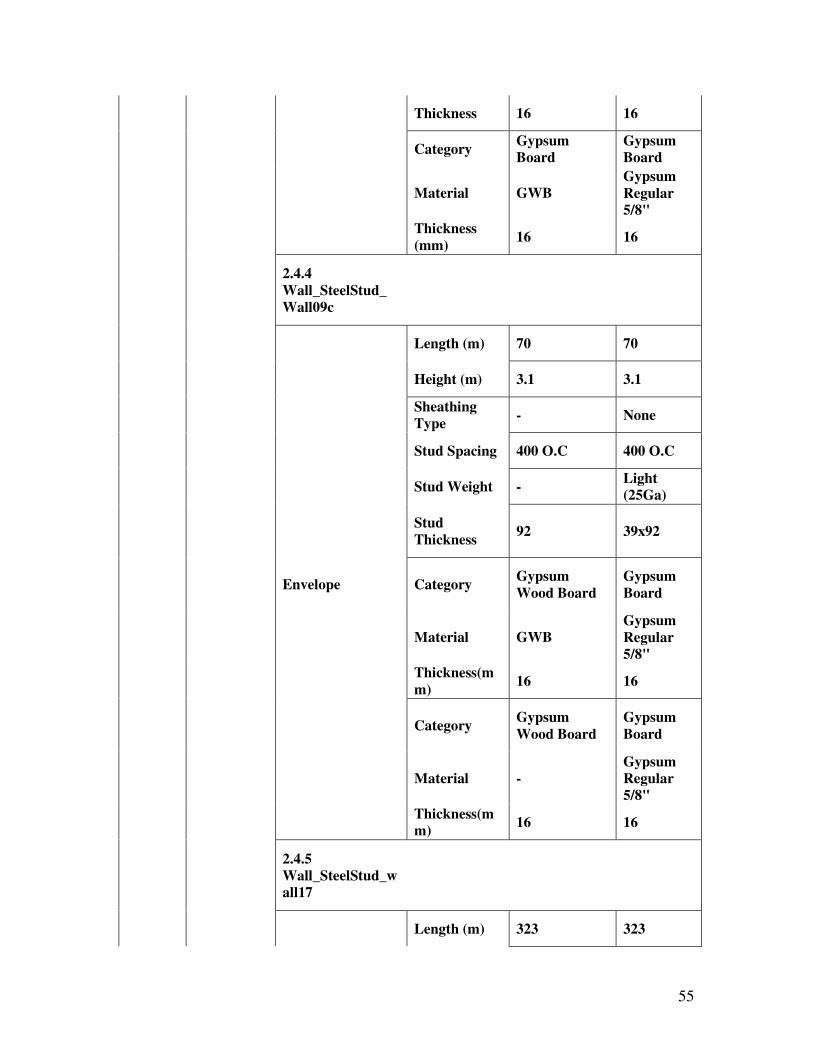
2.4.4 Wall_SteelStud_Wall09c
Length (m) 70 70
Height (m) 3.1 3.1
Sheathing Type - None
Stud Spacing 400 O.C 400 O.C
Stud Weight - Light (25Ga)
Stud Thickness 92 39x92
Envelope Category Gypsum Wood Board
Gypsum Board
Material GWB Gypsum Regular 5/8"
Thickness(mm) 16 16
Category Gypsum Wood Board
Gypsum Board
Material - Gypsum Regular 5/8"
Thickness(mm) 16 16
2.4.5 Wall_SteelStud_wall17
Length (m) 323 323

56
Height (m) 3.1 3.1
Sheathing Type None
Stud Spacing 600 O.C. 600 O.C.
Stud Weight - Light (25Ga)
Stud Thickness 101mm 39x92
Door Opening Number of Doors 8 8
Door Type -
Hollow Core Wood Interior Door
Envelope Category Shalf wall liner
Gypsum Board
Material Gypsum Regular 5/8"
Thickness (mm) 25 25
Category Gypsum Board
Gypsum Board
Material Gypsum Regular 5/8"
Thickness (mm) 16 16
2.4.6 Wall_SteelStud_wall22
Length (m) 13 13
Height (m) 3.1 3.1
Sheathing Type None
Stud Spacing 400 O.C 400 O.C.
Stud Weight - Light (25Ga)

57
Stud Thickness 92 mm 39x92
Door Opening Number of Doors 1 1
Door Type -
Hollow Core Wood Interior Door
Envelope Category Insulation Insulation
Material acoustic insulation
Fiberglass Batt
Thickness (mm) 100 100
Category Gypsum Board
Gypsum Board
Material GWB Gypsum Regular 5/8"
Thickness (mm) 16 16
Category Gypsum Board
Gypsum Board
Material GWB Gypsum Regular 5/8"
Thickness (mm) 16 16
2.4.7 Wall_SteelStud_wall22a
Length (m) 43 43
Height (m) 3.1 3.1
Sheathing Type None
Stud Spacing 400 O.C 400 O.C.
Stud Weight - Light (25Ga)
Stud Thickness 92 mm 39x92
Door Opening Number of Doors 24 24

58
Door Type -
Hollow Core Wood Interior Door
Envelope Category Insulation Insulation
Material acoustic insulation
Fiberglass Batt
Thickness (mm) 50 50
Category Gypsum Board
Gypsum Board
Material GWB Gypsum Regular 5/8"
Thickness (mm) 16 16
Category Gypsum Board
Gypsum Board
Material GWB Gypsum Regular 5/8"
Thickness (mm) 16 16
2.4.8 Wall_SteelStud_wall24
Length (m) 176 176
Height (m) 3.1 3.1
Sheathing Type None
Stud Spacing 400 O.C 400 O.C.
Stud Weight - Light (25Ga)
Stud Thickness 92 mm 39x92
Door Opening Number of Doors 15 15
Door Type -
Hollow Core Wood Interior Door

59
Envelope Category Gypsum Board
Gypsume Board
Material Wood panel Gypsum Regular 5/8"
Thickness (mm) 19 16
Category Gypsum Board
Gypsum Board
Material GWB Gypsum Regular 5/8"
Thickness (mm) 16 16
Category Gypsum Board
Gypsum Board
Material GWB Gypsum Regular 5/8"
Thickness (mm) 16 16
2.4.9 Wall_SteelStud_wall13
Length (m) 16 16
Height (m) 3.1 3.1
Sheathing Type - None
Stud Spacing - 400 O.C.
Stud Weight - Light (25Ga)
Stud Thickness 92 mm 39x92
Envelope Category Gypsum Board
Gypsume Board
Material GWB Gypsum Regular 5/8"
Thickness (mm) 16 16

60
2.4.10 Wall_SteelStud_wall26
Length (m) 292 292
Height (m) 3.1 3.1
Sheathing Type plywood plywood
Stud Spacing 400 O.C 400 O.C.
Stud Weight - Light (25Ga)
Stud Thickness 92 mm 39x92
Envelope Category Gypsum Board
Gypsum Board
Material GWB Gypsum Regular 5/8"
Thickness (mm) 16 16
Category Gypsum Board
Gypsum Board
Material GWB Gypsum Regular 5/8"
Thickness (mm) 16 16
Category Gypsum Board
Gypsum Board
Material GWB Gypsum Regular 5/8"
Thickness (mm) 16 16
2.4.11 Wall_SteelStud_wall27
Length (m) 40 40
Height (m) 3.1 3.1
Sheathing Type Birch Plywood plywood
61
Stud Spacing 400 O.C 400 O.C.
Stud Weight - Light (25Ga)
Stud Thickness 92 mm 39x92
Envelope Category Gypsum Board
Gypsum Board
Material GWB Gypsum Regular 5/8"
Thickness (mm) 16 16
Category Gypsum Board
Gypsum Board
Material GWB Gypsum Regular 5/8"
Thickness (mm) 16 16
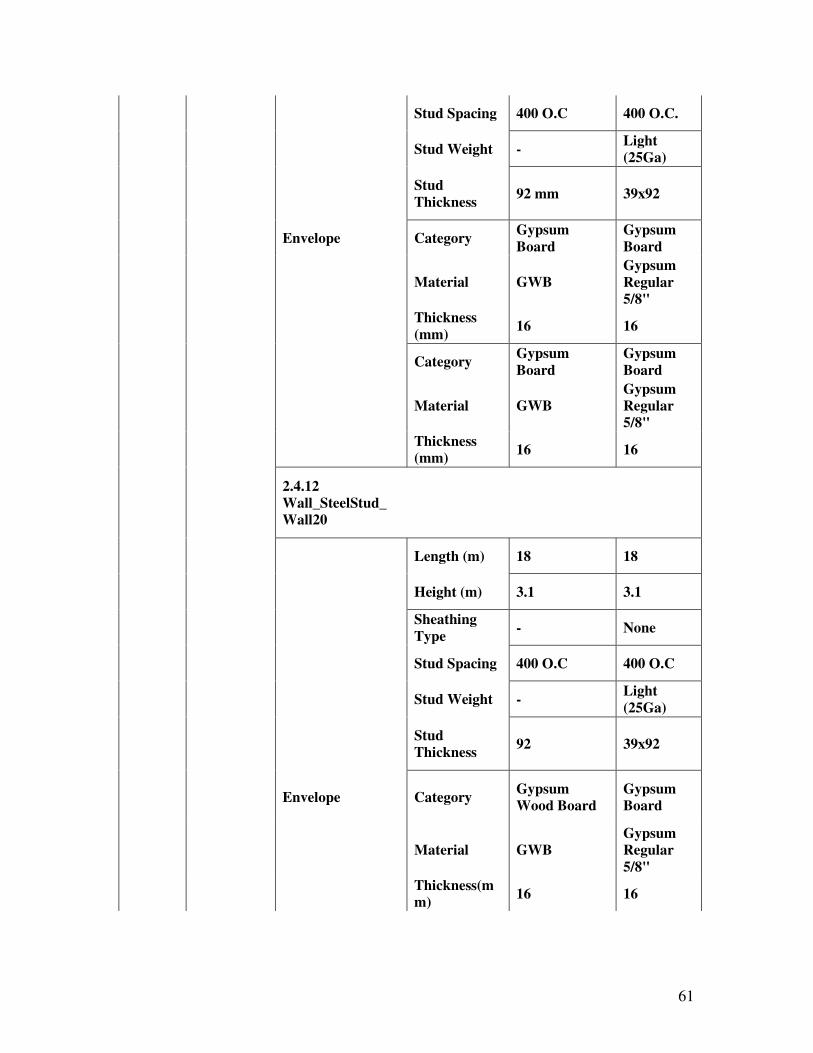
2.4.12 Wall_SteelStud_Wall20
Length (m) 18 18
Height (m) 3.1 3.1
Sheathing Type - None
Stud Spacing 400 O.C 400 O.C
Stud Weight - Light (25Ga)
Stud Thickness 92 39x92
Envelope Category Gypsum Wood Board
Gypsum Board
Material GWB Gypsum Regular 5/8"
Thickness(mm) 16 16

62
Category Gypsum Wood Board
Gypsum Board
Material - Gypsum Regular 5/8"
Thickness(mm) 16 16
2.4.13 Wall_SteelStud_Wall20a
Length (m) 256 256
Height (m) 3.1 3.1
Sheathing Type - None
Stud Spacing 400 O.C 400 O.C
Stud Weight - Light (25Ga)
Stud Thickness 92 39x92
Door Opening Number of Doors 62 62
Door Type -
Hollow Core Wood Interior Door
Envelope Category Gypsum Wood Board
Gypsum Board
Material GWB Gypsum Regular 5/8"
Thickness(mm) 16 16
Category Gypsum Wood Board
Gypsum Board
Material - Gypsum Regular 5/8"
Thickness(mm) 16 16

63
2.4.14 Wall_SteelStud_Wall20b
Length (m) 9 9
Height (m) 3.1 3.1
Sheathing Type - None
Stud Spacing 400 O.C 400 O.C
Stud Weight - Light (25Ga)
Stud Thickness 92 39x92
Envelope Category Gypsum Wood Board
Gypsum Board
Material GWB Gypsum Regular 5/8"
Thickness(mm) 16 16
Category Gypsum Wood Board
Gypsum Board
Material - Gypsum Regular 5/8"
Thickness(mm) 16 16
3 Columns and Beams
3.1 Concrete Column
3.1.1 Column_Concrete_Beam_Basement
Number of Beams
64
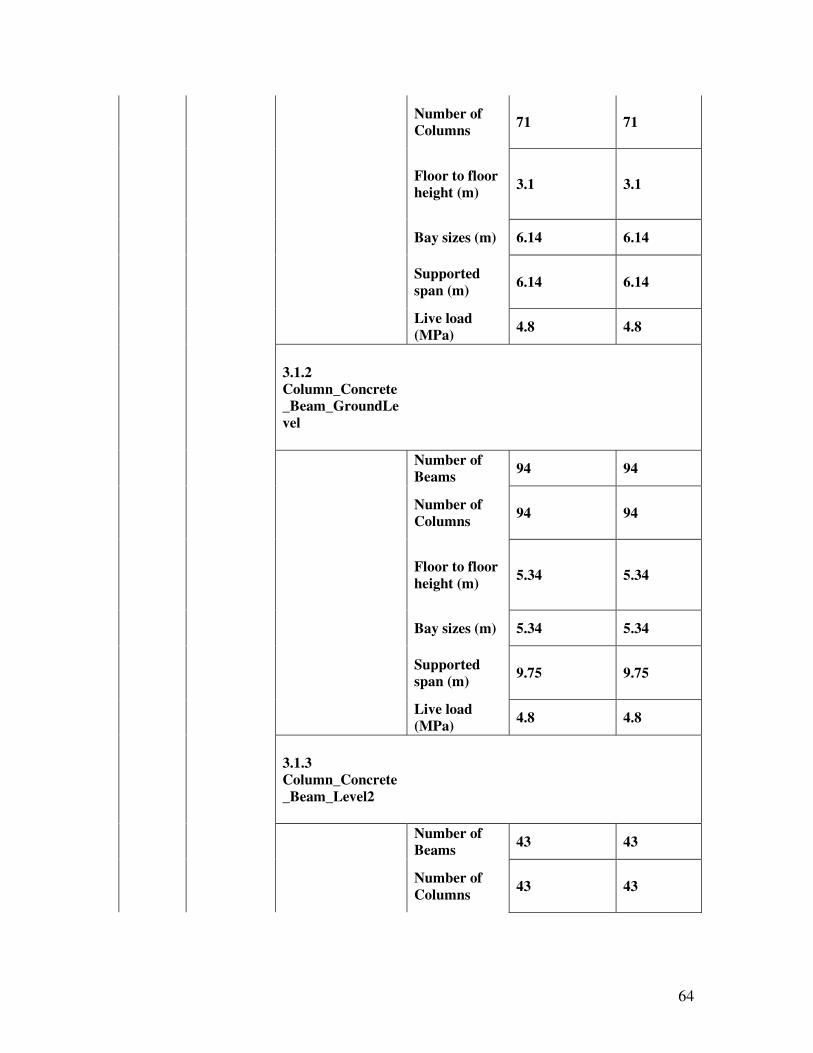
Number of Columns 71 71
Floor to floor height (m) 3.1 3.1
Bay sizes (m) 6.14 6.14
Supported span (m) 6.14 6.14
Live load (MPa) 4.8 4.8
3.1.2 Column_Concrete_Beam_GroundLevel
Number of Beams 94 94
Number of Columns 94 94
Floor to floor height (m) 5.34 5.34
Bay sizes (m) 5.34 5.34
Supported span (m) 9.75 9.75
Live load (MPa) 4.8 4.8
3.1.3 Column_Concrete_Beam_Level2
Number of Beams 43 43
Number of Columns 43 43
65
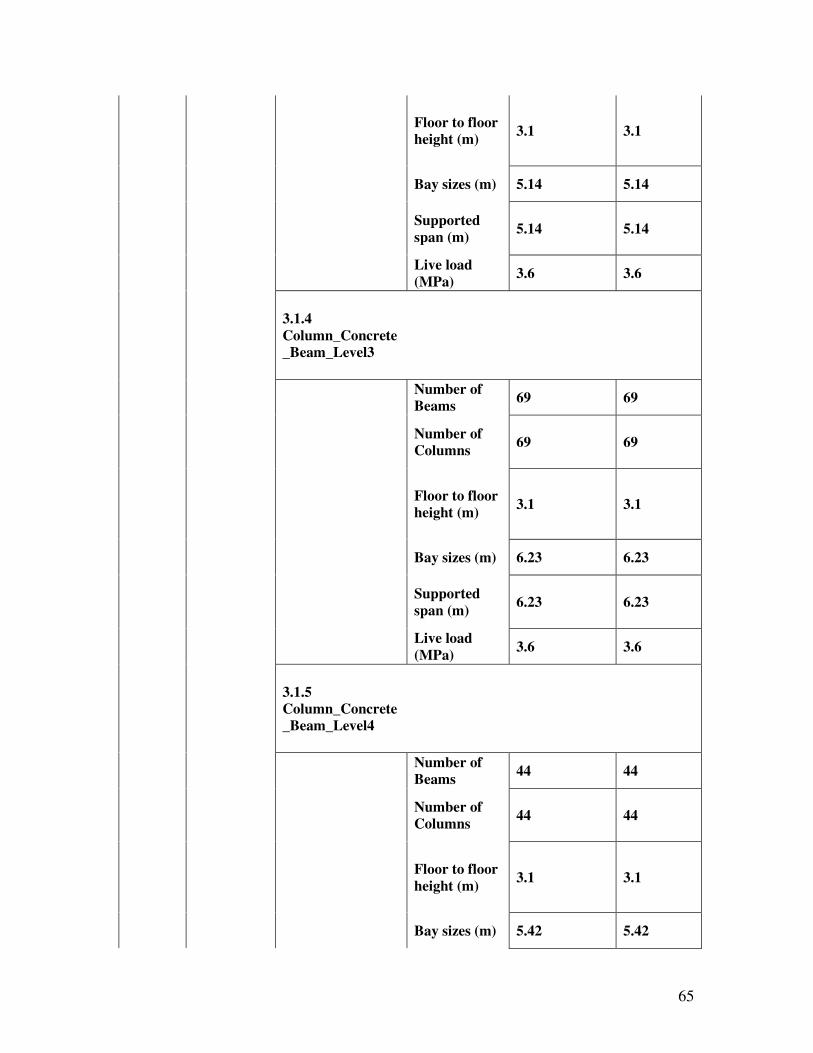
Floor to floor height (m) 3.1 3.1
Bay sizes (m) 5.14 5.14
Supported span (m) 5.14 5.14
Live load (MPa) 3.6 3.6
3.1.4 Column_Concrete_Beam_Level3
Number of Beams 69 69
Number of Columns 69 69
Floor to floor height (m) 3.1 3.1
Bay sizes (m) 6.23 6.23
Supported span (m) 6.23 6.23
Live load (MPa) 3.6 3.6
3.1.5 Column_Concrete_Beam_Level4
Number of Beams 44 44
Number of Columns 44 44
Floor to floor height (m) 3.1 3.1
Bay sizes (m) 5.42 5.42
66
Supported span (m) 5.42 5.42
Live load (MPa) R 3.6
4 Floors
4.1 Concrete Suspended Slab
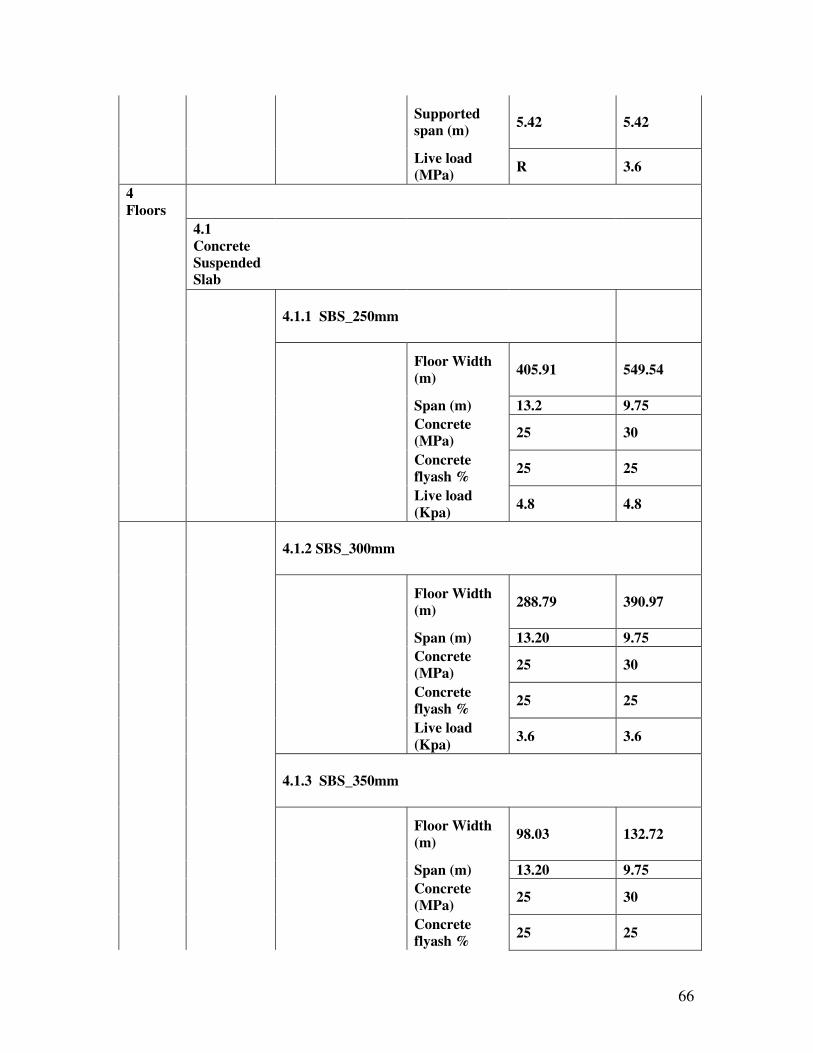
4.1.1 SBS_250mm
Floor Width (m) 405.91 549.54
Span (m) 13.2 9.75
Concrete (MPa) 25 30
Concrete flyash % 25 25
Live load (Kpa) 4.8 4.8
4.1.2 SBS_300mm
Floor Width (m) 288.79 390.97
Span (m) 13.20 9.75
Concrete (MPa) 25 30
Concrete flyash % 25 25
Live load (Kpa) 3.6 3.6
4.1.3 SBS_350mm
Floor Width (m) 98.03 132.72
Span (m) 13.20 9.75
Concrete (MPa) 25 30
Concrete flyash % 25 25
67
Life load (Kpa) 3.6 3.6
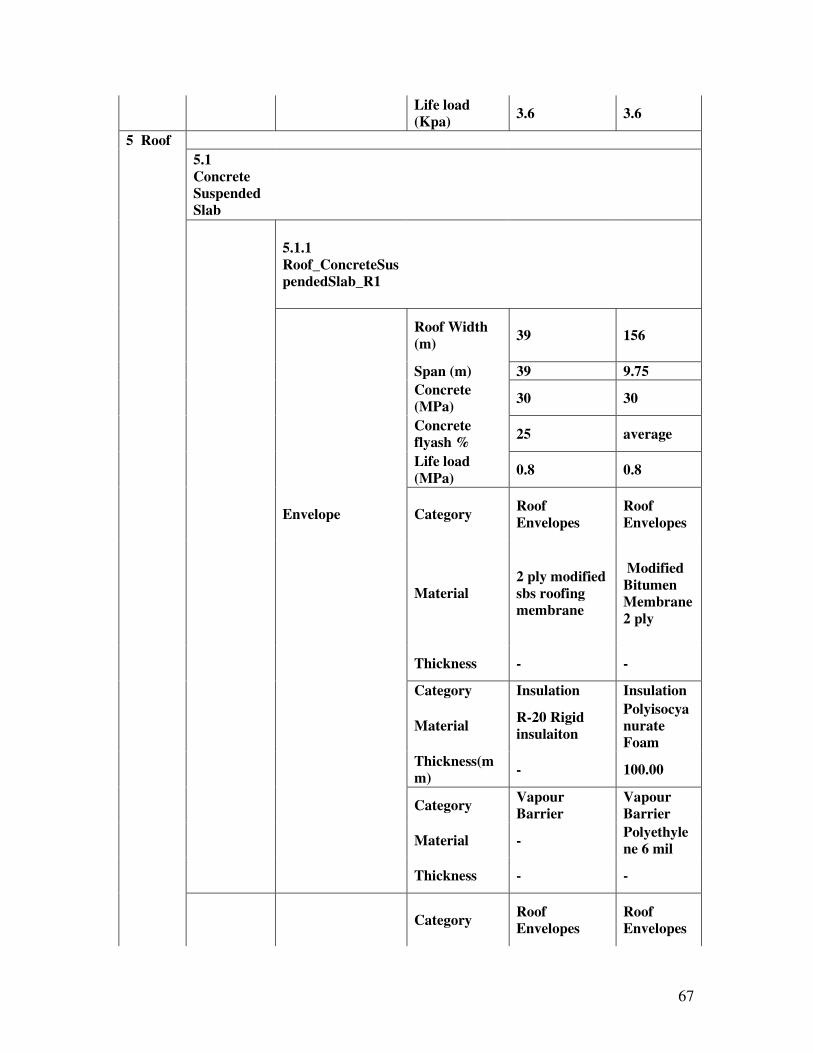
5 Roof
5.1 Concrete Suspended Slab
5.1.1 Roof_ConcreteSuspendedSlab_R1
Roof Width (m) 39 156
Span (m) 39 9.75
Concrete (MPa) 30 30
Concrete flyash % 25 average
Life load (MPa) 0.8 0.8
Envelope Category Roof Envelopes
Roof Envelopes
Material 2 ply modified sbs roofing membrane
Modified Bitumen Membrane 2 ply
Thickness - -
Category Insulation Insulation
Material R-20 Rigid insulaiton
Polyisocyanurate Foam
Thickness(mm) - 100.00
Category Vapour Barrier
Vapour Barrier
Material - Polyethylene 6 mil
Thickness - -
Category Roof Envelopes
Roof Envelopes

68
Material Gravel Ballast Ballast
Thickness 25.381
5.1.2 Roof_ConcreteSuspendedSlab_R2
Roof Width (m) 33.53 115.28
Span (m) 33.53 9.75
Concrete (MPa) 30 30
Concrete flyash % 25 average
Life load (MPa) 0.8 0.8
Envelope Category Roof Envelopes
Roof Envelopes
Material 2 ply modified sbs roofing membrane
Modified Bitumen Membrane 2 ply
Thickness - -
Category Insulation Insulation
Material R-20 Rigid insulaiton
Polyisocyanurate Foam
Thickness(mm) - 100.00
Category Vapour Barrier
Vapour Barrier
Material - Polyethylene 6 mil
Thickness - -
5.1.3 Roof_ConcreteSuspendedSlab_R3
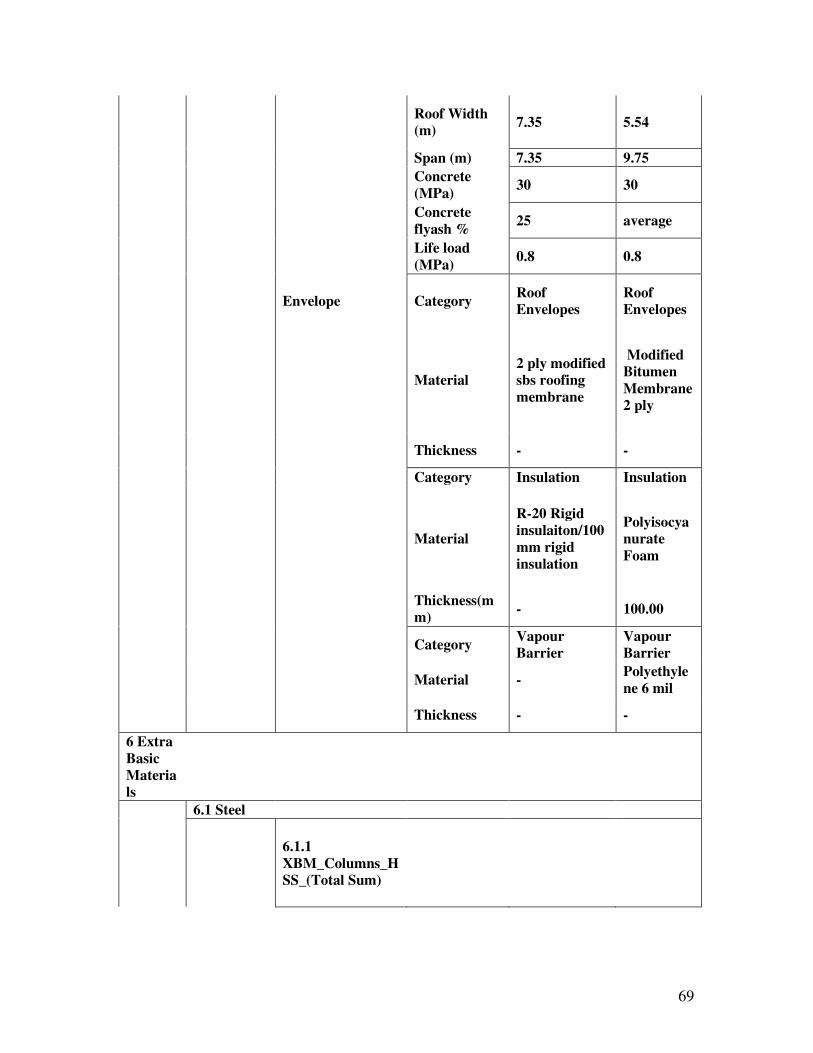
69
Roof Width (m) 7.35 5.54
Span (m) 7.35 9.75
Concrete (MPa) 30 30
Concrete flyash % 25 average
Life load (MPa) 0.8 0.8
Envelope Category Roof Envelopes
Roof Envelopes
Material 2 ply modified sbs roofing membrane
Modified Bitumen Membrane 2 ply
Thickness - -
Category Insulation Insulation
Material
R-20 Rigid insulaiton/100 mm rigid insulation
Polyisocyanurate Foam
Thickness(mm) - 100.00
Category Vapour Barrier
Vapour Barrier
Material - Polyethylene 6 mil
Thickness - -
6 Extra Basic Materials
6.1 Steel
6.1.1 XBM_Columns_HSS_(Total Sum)

70
Hollow Structural Steel (Tons)
- 10.39
Appendix B Impact Estimator Input Assumption
Assembly Group
Assembly Type
Assembly Name Specific Assumptions
1 Foundation
The Impact Estimator, SOG inputs are limited to being either a 100mm or 200mm thickness. Since the actual SOG thicknesses for the Kaiser building were not exactly 100mm or 200mm thick, the areas measured in OnScreen required calculations to adjust the areas to accommodate this limitation. The Impact Estimator limits the thickness of footings to be between 190mm and 500mm thick. As there are a number of cases where footing thicknesses exceed 500mm , their areas were re-adjusted accordingly to maintain the same volume of footing while accommodating this limitation. Lastly, the concrete stairs were modelled as footings (ie. Stairs_Concrete_TotalLength). All stairs had the same thickness and width, so the total length of stair was measured and were combined into a single input.
1.1 Concrete Slab-on-Grade
1.1.1 SOG_150mm
The area of this slab had to be adjusted so that the thickness fit into the 4" thickness specified in the Impact Estimator. The following calculation was done in order to determine appropriate Length and Width (in feet) inputs for this slab; = sqrt[((Measured Slab Area) x (Actual Slab Thickness))/(4”/12) ] = sqrt[ (1929m^2 x (0.15m))/(0.1) ] = 53.8m
1.2 Concrete Footi
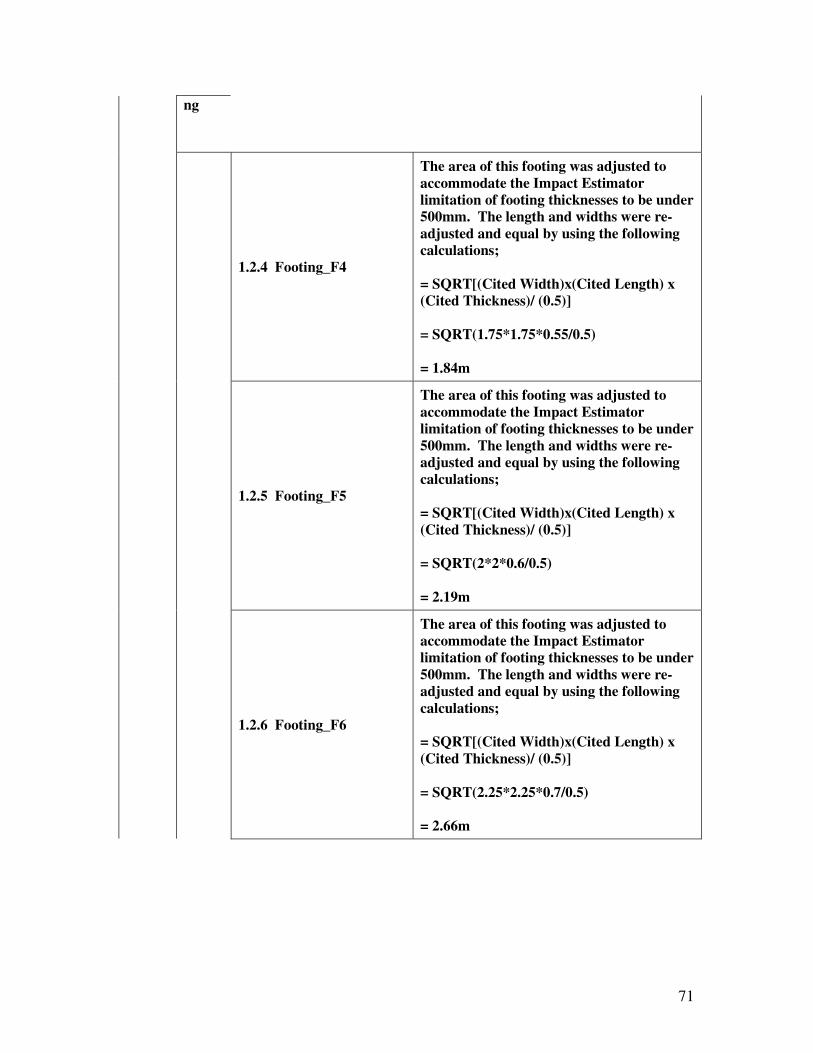
71
ng
1.2.4 Footing_F4
The area of this footing was adjusted to accommodate the Impact Estimator limitation of footing thicknesses to be under 500mm. The length and widths were re-adjusted and equal by using the following calculations; = SQRT[(Cited Width)x(Cited Length) x (Cited Thickness)/ (0.5)] = SQRT(1.75*1.75*0.55/0.5) = 1.84m
1.2.5 Footing_F5
The area of this footing was adjusted to accommodate the Impact Estimator limitation of footing thicknesses to be under 500mm. The length and widths were re-adjusted and equal by using the following calculations; = SQRT[(Cited Width)x(Cited Length) x (Cited Thickness)/ (0.5)] = SQRT(2*2*0.6/0.5) = 2.19m
1.2.6 Footing_F6
The area of this footing was adjusted to accommodate the Impact Estimator limitation of footing thicknesses to be under 500mm. The length and widths were re-adjusted and equal by using the following calculations; = SQRT[(Cited Width)x(Cited Length) x (Cited Thickness)/ (0.5)] = SQRT(2.25*2.25*0.7/0.5) = 2.66m

72
1.2.7 Footing_F7
The area of this footing was adjusted to accommodate the Impact Estimator limitation of footing thicknesses to be under 500mm. The length and widths were re-adjusted and equal by using the following calculations; = SQRT[(Cited Width)x(Cited Length) x (Cited Thickness)/ (0.5)] = SQRT(2.85*2.85*0.8/0.5) = 3.6m
1.2.8 Footing_F8
The area of this footing was adjusted to accommodate the Impact Estimator limitation of footing thicknesses to be under 500mm. The length and widths were re-adjusted and equal by using the following calculations; =SQRT[(Cited Width)x(Cited Length) x (Cited Thickness)/ (0.5)] = SQRT(1.6*2.8*0.7/0.5) = 2.5m

73
1.2.9 Footing_F9
The area of this footing was adjusted to accommodate the Impact Estimator limitation of footing thicknesses to be under 500mm. The length and widths were re-adjusted and equal by using the following calculations; =SQRT[(Cited Width)x(Cited Length) x (Cited Thickness)/ (0.5)] = SQRT(1.6*3.2*0.8/0.5) = 2.86m
1.2.10 Footing_F10
The area of this footing was adjusted to accommodate the Impact Estimator limitation of footing thicknesses to be under 500mm. The length and widths were re-adjusted and equal by using the following calculations; =SQRT[(Cited Width)x(Cited Length) x (Cited Thickness)/ (0.5)] = SQRT(1.6*3.2*0.9/0.5) = 3.036m

74
1.2.11 Footing_F11
The area of this footing was adjusted to accommodate the Impact Estimator limitation of footing thicknesses to be under 500mm. The length and widths were re-adjusted and equal by using the following calculations; =SQRT[(Cited Width)x(Cited Length) x (Cited Thickness)/ (0.5)] = SQRT(1.2*3*0.8/0.5) = 2.4m
1.2.12 Footing_F12
The area of this footing was adjusted to accommodate the Impact Estimator limitation of footing thicknesses to be under 500mm. The length and widths were re-adjusted and equal by using the following calculations; =SQRT[(Cited Width)x(Cited Length) x (Cited Thickness)/ (0.5)] = SQRT(1.9*2.7*0.7/0.5) = 2.68m
1.2.13 Footing_F13
The area of this footing was adjusted to accommodate the Impact Estimator limitation of footing thicknesses to be under 500mm. The length and widths were re-adjusted and equal by using the following calculations; =SQRT[(Cited Width)x(Cited Length) x (Cited Thickness)/ (0.5)] = SQRT(2.7*3*0.7/0.5) = 3.367m
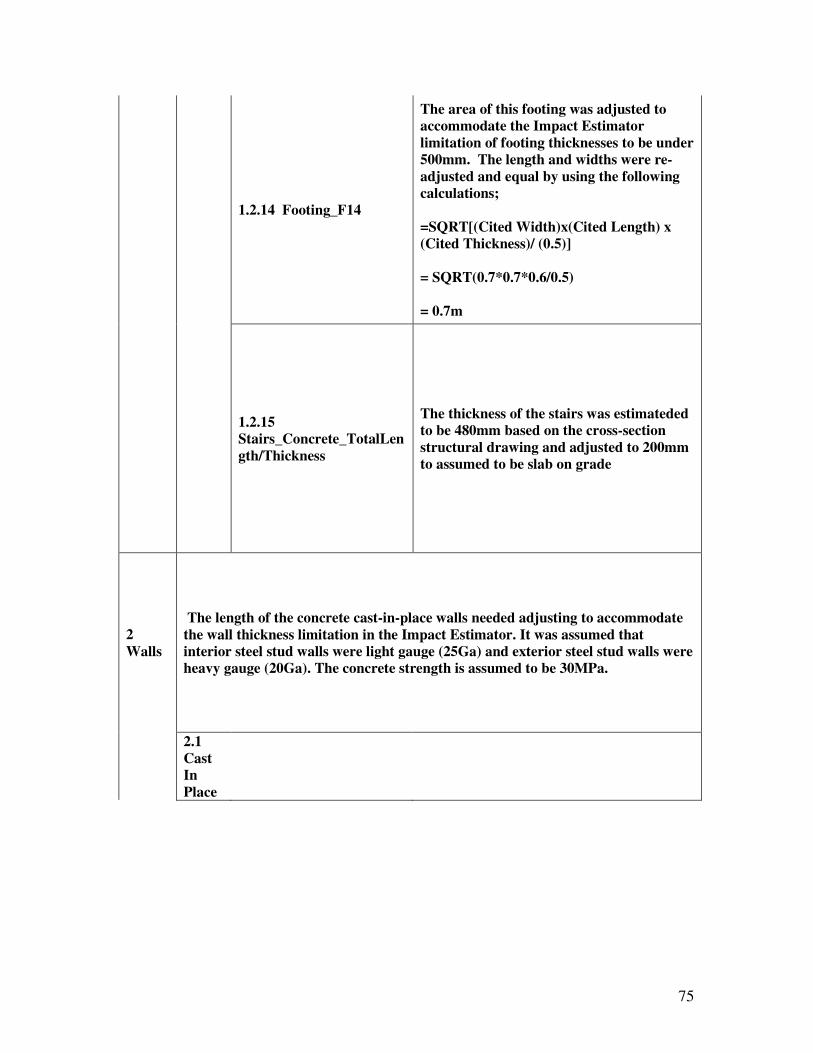
75
1.2.14 Footing_F14
The area of this footing was adjusted to accommodate the Impact Estimator limitation of footing thicknesses to be under 500mm. The length and widths were re-adjusted and equal by using the following calculations; =SQRT[(Cited Width)x(Cited Length) x (Cited Thickness)/ (0.5)] = SQRT(0.7*0.7*0.6/0.5) = 0.7m
1.2.15 Stairs_Concrete_TotalLength/Thickness
The thickness of the stairs was estimateded to be 480mm based on the cross-section structural drawing and adjusted to 200mm to assumed to be slab on grade
2 Walls
The length of the concrete cast-in-place walls needed adjusting to accommodate the wall thickness limitation in the Impact Estimator. It was assumed that interior steel stud walls were light gauge (25Ga) and exterior steel stud walls were heavy gauge (20Ga). The concrete strength is assumed to be 30MPa.
2.1 Cast In Place

76
2.1.1 Wall_Cast-in-Place_CW4_440mm
This wall height was increased by a factor in order to fit the 300mm thickness limitation of the Impact Estimator. This was done by increasing the height of the wall using the following equation; = (Measured Length*Measured Height) * [(Cited Thickness)/[Measured L *300] = (12*3.1*0.44)/(12*0.3) = 4.55m
2.1.2 Wall_Cast-in-Place_CW5_517mm
This wall height was increased by a factor in order to fit the 300mm thickness limitation of the Impact Estimator. This was done by increasing the height of the wall using the following equation; = (Measured Length*Measured Height) * [(Cited Thickness)/[Measured L *300] = (19*3.1*0.517)/(19*0.3) = 5.34m
2.1.3 Wall_Cast-In-Place_CW6_612mm
This wall height was increased by a factor in order to fit the 300mm thickness limitation of the Impact Estimator. This was done by increasing the height of the wall using the following equation; = (Measured Length*Measured Height) * [(Cited Thickness)/[Measured L *300] =(14*3.1*0.612)/(14*0.3) = 6.32m

77
2.1.5 Wall_Cast-in-Place_Perimeter wall_220mm
This wall height was increased by a factor in order to fit the 300mm thickness limitation of the Impact Estimator. This was done by increasing the height of the wall using the following equation; = (Measured Length*Measured Height) * [(Cited Thickness)/[Measured L *300] =(233*3.1*0.22)/(233*0.3) = 2.27m
2.2 Concrete Block Wall
2.2.1 Wall_ConcreteBlock_W01_407mm
Steel Interior Door with 50% glazing was the closest estimtation to the observed doors in this wall.
2.2.2 Wall_ConcreteBlock_W02_410mm
Steel Interior Door with 50% glazing was the closest estimtation to the observed doors in this wall.
2.2.3 Wall_ConcreteBlock_W03_472mm
Steel Interior Door with 50% glazing was the closest estimtation to the observed doors in this wall.
2.2.4 Wall_ConcreteBlock_W06_230mm
Steel Interior Door with 50% glazing was the closest estimtation to the observed doors in this wall.

78
2.2.5 Wall_ConcreteBlock_W07_442mm
Steel Interior Door with 50% glazing was the closest estimtation to the observed doors in this wall.
2.2.6 Wall_ConcreteBlock_W05_445mm
Steel Interior Door with 50% glazing was the closest estimtation to the observed doors in this wall.
2.2.7 Wall_ConcreteBlock_W05a_445mm
Steel Interior Door with 50% glazing was the closest estimtation to the observed doors in this wall.
2.2.8 Wall_ConcreteBlock_W05b_445mm
Steel Interior Door with 50% glazing was the closest estimtation to the observed doors in this wall.
2.2.9 Wall_ConcreteBlock_W18a_232mm
Steel Interior Door with 50% glazing was the closest estimtation to the observed doors in this wall.
2.3 Curtain Wall
2.3.1 Wall_CurtainWall_Georgianwireglass
Georgianwire glass is assumed to be Curtain wall100% glazing glass spantrel panel

79
2.3.2 Wall_CurtainWall_clear glass screen
Clear glass is assumed to be Curtain wall100% glazing glass spantrel panel
2.3.3 Wall_CurtainWall_W8.1
Aluminum Door with 80% glazing was the closest estimtation to the observed doors in this wall.
2.3.4 Wall_CurtainWall_W8.2
Aluminum Door with 80% glazing was the closest estimtation to the observed doors in this wall.
2.3.5 Wall_CurtainWall_W8.3
Aluminum Door with 80% glazing was the closest estimtation to the observed doors in this wall. The windows are Low E clear glass so Low E tin glazing is the closet assumtion
2.4 Steel Stud
2.4.1 Wall_SteelStud_Wall 09
The doors are observed closest to be hollow core interior door. The gypsum on bohth sides was assumed to be of the same specifications as 5/8" Regular Gypsum
2.4.2 Wall_SteelStud_Wall 09a
The doors are observed closest to be hollow core interior door. The gypsum on bohth sides was assumed to be of the same specifications as 5/8" Regular Gypsum. Acoustic Batt insulation was not available in the Impact Estimator so Fiberglass Batt was selected as the closest surrogate.

80
2.4.3 Wall_SteelStud_Wall 09b
The doors are observed closest to be hollow core interior door. The gypsum on bohth sides was assumed to be of the same specifications as 5/8" Regular Gypsum. Acoustic Batt insulation was not available in the Impact Estimator so Fiberglass Batt was selected as the closest surrogate.
2.4.4 Wall_SteelStud_Wall 09c
The gypsum on bohth sides was assumed to be of the same specifications as 5/8" Regular Gypsum. Acoustic Batt insulation was not available in the Impact Estimator so Fiberglass Batt was selected as the closest surrogate.
2.4.5 Wall_SteelStud_Wall17
The doors are observed closest to be hollow core interior door. The shaft line is assumed closest to be gypsum wood board. The gypsum on both sides was assumed to be of the same specifications as 5/8" Regular Gypsum
2.4.5 Wall_SteelStud_Wall22
The doors are observed closest to be hollow core interior door. The gypsum on bohth sides was assumed to be of the same specifications as 5/8" Regular Gypsum. Acoustic Batt insulation was not available in the Impact Estimator so Fiberglass Batt was selected as the closest surrogate.
2.4.5 Wall_SteelStud_Wall22a
The doors are observed closest to be hollow core interior door. The gypsum on both sides was assumed to be of the same specifications as 5/8" Regular Gypsum. Acoustic Batt insulation was not available in the Impact Estimator so Fiberglass Batt was selected as the closest surrogate.

81
2.4.5 Wall_SteelStud_Wall24
The doors are observed closest to be hollow core interior door. The gypsum on bohth sides was assumed to be of the same specifications as 5/8" Regular Gypsum.
2.4.9 Wall_SteelStud_Wall13
The gypsum on bohth sides was assumed to be of the same specifications as 5/8" Regular Gypsum.
2.4.10 Wall_SteelStud_Wall26
The gypsum on bohth sides was assumed to be of the same specifications as 5/8" Regular Gypsum. Since there is no plywood option in Impact Estimator, 5/8" Regular Gypsum is the closest assumption
2.4.11 Wall_SteelStud_Wall27
The gypsum on bohth sides was assumed to be of the same specifications as 5/8" Regular Gypsum. Since there is no birch plywood option in Impact Estimator, 5/8" Regular Gypsum is the closest assumption
2.4.12 Wall_SteelStud_Wall20
The wall is assumed to be steel studes with gypusm wood boards
2.4.13 Wall_SteelStud_Wall20a
The wall is assumed to be steel studes with gypusm wood boards
2.4.14 Wall_SteelStud_Wall20b
The wall is assumed to be steel studes with gypusm wood boards

82
3 Columns and Beams
The method used to measure column sizing was completely depended upon the metrics built into the Impact Estimator. That is, the Impact Estimator calculates the sizing of beams and columns based on the following inputs; number of beams, number of columns, floor to floor height, bay size, supported span and live load. This being the case, in OnScreen, since no beams were present in the Kaiser building, concrete columns were accounted for on each floor, while each floor’s area was measured. The hollow structural steel (HSS) columns in the Kaiser building were modeled in the Extra Basic Materials, where their associated assumptions and calculations are documented.
3.1 Concrete Column
3.1.1 Column_Concrete_Beam_N/A_Basement
Because of the variability of bay and span sizes, they were calculated using the following calculation; the supported floor is the ground floor and area is 2679 m sqr = sqrt[(Measured Supported Floor Area) / (Counted Number of Columns)] = SQRT(2679/(2x71) = 6.14m
3.1.2 Column_Concrete_Beam_N/A_GroundLevel
Because of the variability of bay and span sizes, they were calculated using the following calculation; The supported floor is the second floor and area is 2679 m sqr = sqrt[(Measured Supported Floor Area) / (Counted Number of Columns)] = SQRT(2679/94) = 6.14m

83
3.1.3 Column_Concrete_Beam_N/A_Level2
Because of the variability of bay and span sizes, they were calculated using the following calculation; The supported floor is third floor and the supported area is 1134 = sqrt[(Measured Supported Floor Area) / (Counted Number of Columns)] = SQRT(1134/43) = 5.14m
3.1.4 Column_Concrete_Beam_N/A_Level3
Because of the variability of bay and span sizes, they were calculated using the following calculation; The supported floor is fourth floor and area is 2679 m sqr = sqrt[(Measured Supported Floor Area) / (Counted Number of Columns)] = SQRT(2679/69) = 6.23m
3.1.5 Column_Concrete_Beam_N/A_Level4
Because of the variability of bay and span sizes, they were calculated using the following calculation; The supported floor is fifth floor and the supported area is 1294 = sqrt[(Measured Supported Floor Area) / (Counted Number of Columns)] = SQRT(1294/44) = 5.42 m
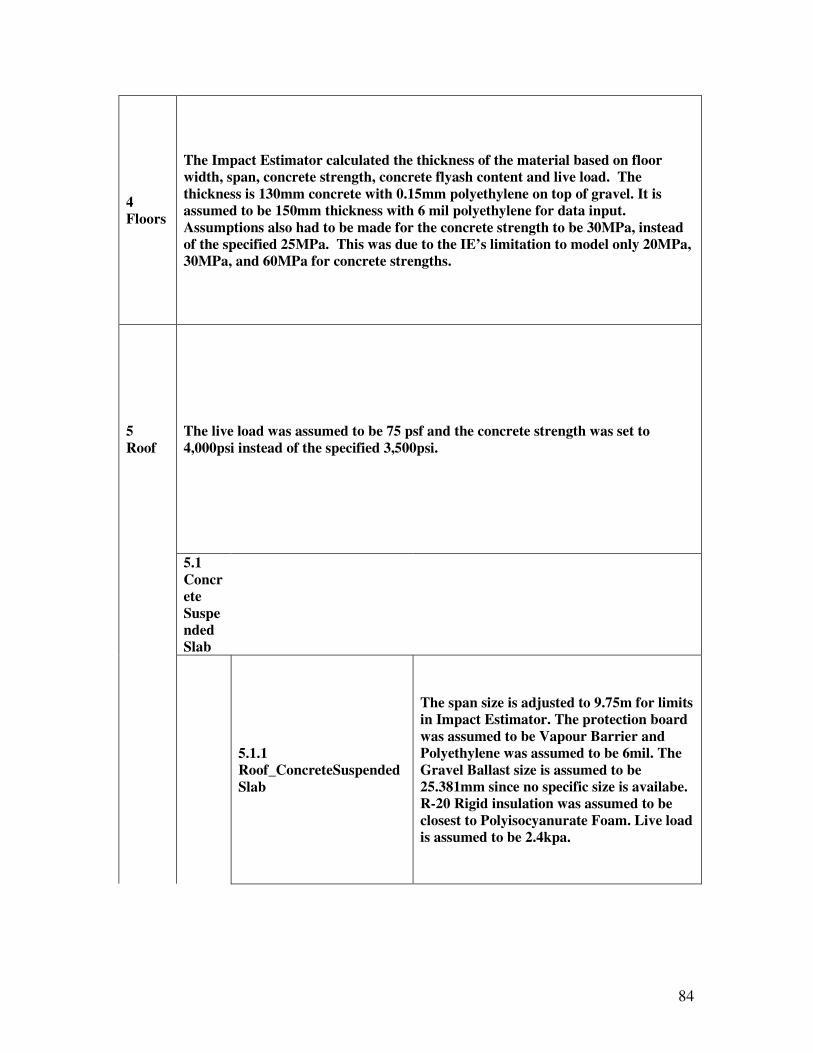
84
4 Floors
The Impact Estimator calculated the thickness of the material based on floor width, span, concrete strength, concrete flyash content and live load. The thickness is 130mm concrete with 0.15mm polyethylene on top of gravel. It is assumed to be 150mm thickness with 6 mil polyethylene for data input. Assumptions also had to be made for the concrete strength to be 30MPa, instead of the specified 25MPa. This was due to the IE’s limitation to model only 20MPa, 30MPa, and 60MPa for concrete strengths.
5 Roof
The live load was assumed to be 75 psf and the concrete strength was set to 4,000psi instead of the specified 3,500psi.
5.1 Concrete Suspended Slab
5.1.1 Roof_ConcreteSuspendedSlab
The span size is adjusted to 9.75m for limits in Impact Estimator. The protection board was assumed to be Vapour Barrier and Polyethylene was assumed to be 6mil. The Gravel Ballast size is assumed to be 25.381mm since no specific size is availabe. R-20 Rigid insulation was assumed to be closest to Polyisocyanurate Foam. Live load is assumed to be 2.4kpa.

85
5.1.2 Roof_ConcreteSuspendedSlab
The span size is adjusted to 9.75m for limits in Impact Estimator. The protection board was assumed to be Vapour Barrier and Polyethylene was assumed to be 6mil. R-20 Rigid insulation was assumed to be closest to Polyisocyanurate Foam. Live load is assumed to be 2.4kpa.
5.1.4 Roof_ConcreteSuspendedSlab
The span size is adjusted to 9.75m for limits in Impact Estimator. Vapour Barrier was assumed to be Polyethylene 6mil. R-20 Rigid insulation was assumed to be closest to Polyisocyanurate Foam. Live load is assumed to be 2.4kpa.
5.1.4 Sloped glazing roof
This type of roof was not counted towards to roof quantity since there is no close assumption in IMPact estimator and the area of the roof is less than 5% of the overall roof area.

86
6 Extra Basic Materials
The Hollow Structura Stell (HSS) columns were accounted for using count conditions for the different types. Using their cross sectional sizing, provided in the Steel Column Schedule in structural drawing 316-07-003, in conjunction with their height and per foot weight, referenced from the Steel Tube Institute, allowed for the calculation of the amount of HSS in weight for the columns seen below.
6.1 Steel
6.1.1 XBM_Columns_HSS_(Total Sum)
The following equation describes how the weight of Hollow Structural Steel was calculated; All HSS is considered to be SC6 (HSS 203x152x8.0) since limited available informaiton. Total counts for SC6 is 133 All Hollow Structura lSteel columns were assumed to have a height of 10ft Long tons were used (ie. 1 Ton = 2000 lbs) in the conversion from lbs to Tons. The source that was cited for the weight of the HSS beams was The Steel Tube Institute at http://www.steeltubeinstitute.org/pdf/brochures/dimension_brochure.pdf. The equation shows as the following: Number of column x linear density x column height = 133 x 15. 62 x 10 / 2000 10.39 tons