life cycle assessment as a tool for material selection - …. neha bhatia is an asst.professor in...
TRANSCRIPT

Ar. Neha Bhatia is an Asst.professor in the Department of Architecture, Accredited to Pune University, Pune, Maharastra.
Life Cycle Assessment as a tool for
Material Selection - A comparison of
Autoclaved Aerated Concrete and VSBK
Brick Wall Assembly.
Neha Bhatia, M-Arch (Sustainable Architecture)
Pad. Dr. D. Y. Patil College of Architecture, Akurdi, Pune.
1.0 ABSTRACT
Energy use of a building can be derived from five sources: Embodied Energy from mining and
manufacturing of materials, Energy from transportation of materials, Energy from construction of the
building, Energy use during operation of the building, and Energy used in the disposal of the building at
the end of its life. Buildings use many materials with a high Embodied Energy, and it is estimated that,
10% of its total energy use comes from Embodied Energy in materials. Thus, the use of low Embodied
Energy Materials for the sustainable development is preferred. Life cycle assessment (LCA) offers a
comprehensive approach to evaluating and improving the environmental impacts of buildings
materials, buildings and its products through all of its life stages.
Brick and Cement are majorly used materials in building industry. Kiln Burnt Brick is majorly use
exterior wall material in the market. Also, Aerated Concrete (AAC) is a non-combustible, cementitious
building material that is expanding into new worldwide markets.
The Paper will be aimed to compare the environmental impact of materials- Kiln Burnt Brick and
Autoclaved Aerated Concrete used for wall assemblies. Study will be focused on evaluating the materials
with respect to its Embodied Energy, Energy and Resource consumption, Environmental Impact in terms
of CO2 Emissions, Cost, Health safety etc. The functional unit and unit distance will be defined to allow
comparisons to be made between materials. The study will include interaction with the Manufacturers,
Market study of the materials, and use of material in a particular building. The final objective of the
paper is to evaluate the materials on the bases of Life Cycle Assessment Impact Categories which
includes: Raw Material Index (RMI), Water consumption, Embodied Energy (EE) and Operational
Energy (U-Value), Electricity, Occupational Health and Safety (OHS Index), Total Cost, CO2
Emissions.
Key words: - Life Cycle Assessment, Materials, Kiln Burnt Brick, Autoclaved Aerated Concrete, Life
Cycle Assessment Impact Categories.
2.0 INTRODUCTION
Building construction in India is estimated to grow at a rate of 6.6% per year between 2005 and
2030 (McKinsey and Company, 2009). The building stock is expected to multiply five times during this
period, resulting in a continuous increase in demand for building materials, which could have long
lasting implications in terms of natural resource depletion, future energy demand, local pollution,
contributions to greenhouse gas emissions as well as socio-economic conditions of a significant number
of low-income workers. Thus it is an imperative and urgent need to have a comprehensive plan for
development of walling materials production in India, with the least impact to the earth.
30th INTERNATIONAL PLEA CONFERENCE 16-18 December 2014, CEPT University, Ahmedabad
1
All materials have environmental implications. Thus the choice of materials for a project requires
considerations of aesthetic appeal, initial and ongoing costs, life cycle assessment considerations (such
as material performance, availability and impact on the environment) and the ability to reuse, recycle or
dispose of the material at the end of its life. It is estimated that, 10% of buildings total energy use comes
from embodied energy in materials. Thus, the use of low embodied energy materials for the sustainable
development is preferred. Life Cycle Assessment (LCA) offers a comprehensive approach to evaluating
and improving the environmental impacts of buildings materials, buildings and its products through all
of its life stages from cradle-to-grave (i.e., from raw material extraction through materials processing,
manufacture, distribution, use, repair and maintenance, and disposal or recycling).
Brick and Cement are majorly used materials in building industry. Kiln Burnt Brick is majorly use
exterior wall material in the market. Also, Aerated Concrete (AAC) is a non-combustible, cementitious
building material that is expanding into new worldwide markets.
3.0 AIM AND OBJECTIVE
The Paper is aimed to compare the environmental impact of materials- Kiln Burnt Brick and
Autoclaved Aerated Concrete used for wall assemblies.
The final objective of the paper is to evaluate the materials on the bases of Life Cycle Assessment
Impact Categories which includes: Raw Material Index (RMI), Water consumption, Embodied Energy
(EE) and Operational Energy (U-Value), Electricity, Occupational Health and Safety (OHS Index), Total
Cost, CO2 Emissions.
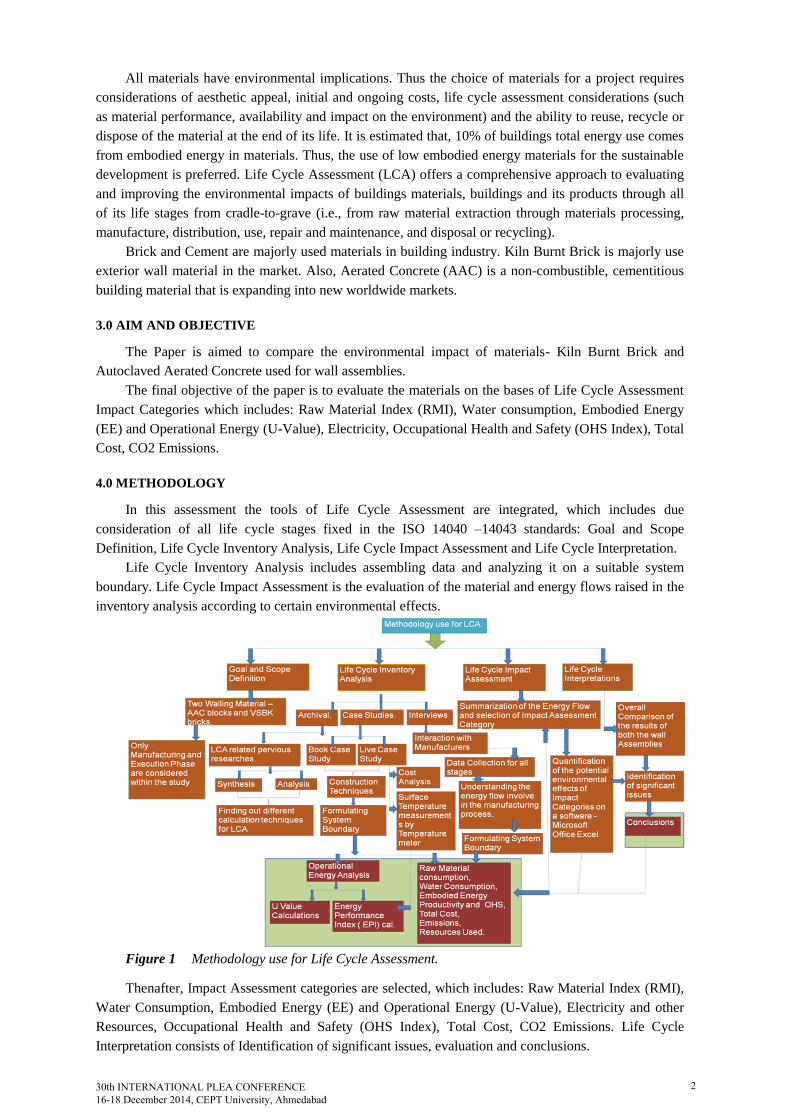
4.0 METHODOLOGY
In this assessment the tools of Life Cycle Assessment are integrated, which includes due
consideration of all life cycle stages fixed in the ISO 14040 –14043 standards: Goal and Scope
Definition, Life Cycle Inventory Analysis, Life Cycle Impact Assessment and Life Cycle Interpretation.
Life Cycle Inventory Analysis includes assembling data and analyzing it on a suitable system
boundary. Life Cycle Impact Assessment is the evaluation of the material and energy flows raised in the
inventory analysis according to certain environmental effects.
Figure 1 Methodology use for Life Cycle Assessment.
Thenafter, Impact Assessment categories are selected, which includes: Raw Material Index (RMI),
Water Consumption, Embodied Energy (EE) and Operational Energy (U-Value), Electricity and other
Resources, Occupational Health and Safety (OHS Index), Total Cost, CO2 Emissions. Life Cycle
Interpretation consists of Identification of significant issues, evaluation and conclusions.
30th INTERNATIONAL PLEA CONFERENCE 16-18 December 2014, CEPT University, Ahmedabad
2

5.0 SCOPE AND LIMITATION
Study is focused on evaluating only two walling materials - Kiln Burnt Brick and Autoclaved
Aerated Concrete with respect to its formulated Impact Assessment Categories. The functional unit and
unit distance is defined to allow comparisons to be made between materials. The study includes
interaction with the Manufacturers, Market study of the materials, and use of material in a particular
building.
Building use: Evaluation of the materials and energy consumptions is restricted to the use of a
building only, its maintenance and restoring, not considered within this study. Also, Transport of the
wastes generated during the Construction and Demolition phase, not considered within this study. No
consideration of labour cost as it will have negligible effect on the results.
To understand the implication of these materials, the live site data collection is limited to pune
(moderate climate), but to understand the impact of operational energy a theoretically comparative study
base has been done with a case study of composite climate.
6.0 LIFE CYCLE ASSESSMENT
A Life Cycle Assessment (LCA) provides a mechanism for systematically evaluating the inputs,
outputs and the potential environmental impacts linked to a product or process throughout its life cycle.
(ISO 14040). LCA addresses the impacts of a product through all of its life stages.
Life Cycle Assessment is a technique to assess environmental impacts associated with all the stages
of a product’s life from cradle to grave.
6.1 EMBODIED ENERGY
Embodied energy is the total energy required for the extraction, processing, manufacture and
delivery of building materials to the building site. Energy consumption produces CO2, which contributes
to greenhouse gas emissions, so embodied energy is considered an indicator of the overall environmental
impact of building materials and systems. It does not include the operation or disposal of materials.
The total amount of embodied energy may account for 20% of the building’s energy use, so
reducing embodied energy can significantly reduce the overall environmental impact of the building.
Energy consumption during manufacturing can give an approximate indication of the
environmental impact of the material, and for most building materials, the major environmental impacts
occur during the initial processes.
Figure 2 Typical phases of materials Life Cycle, along with inputs and outputs at each phase.
7.0 LIFE CYCLE INVENTORYANALYSIS OF AAC BLOCKS AND VSBK BRICK
7.1 Autoclaved Aerated concrete and Vertical Shaft Brick Kiln (VSBK)
AAC is lightweight, precast building material that simultaneously provides structure, insulations,
and fire & mold resistance. Main ingredients include fly ash, water, quicklime, cement, aluminium
powder & gypsum. The block hardness is being achieved by cement strength, & instant curing
mechanism by autoclaving. Gypsum acts as a long term strength gainer. The chemical reaction due to the
aluminium paste provides AAC its distinct porous structure, lightness & insulation properties,
completely different compare to other lightweight materials.
The VSBK is a vertical kiln with a stationary fire and a moving brick arrangement. The figure
below shows the VSBK principle in a schematic diagram. The kiln operates like a counter current heat
30th INTERNATIONAL PLEA CONFERENCE 16-18 December 2014, CEPT University, Ahmedabad
3
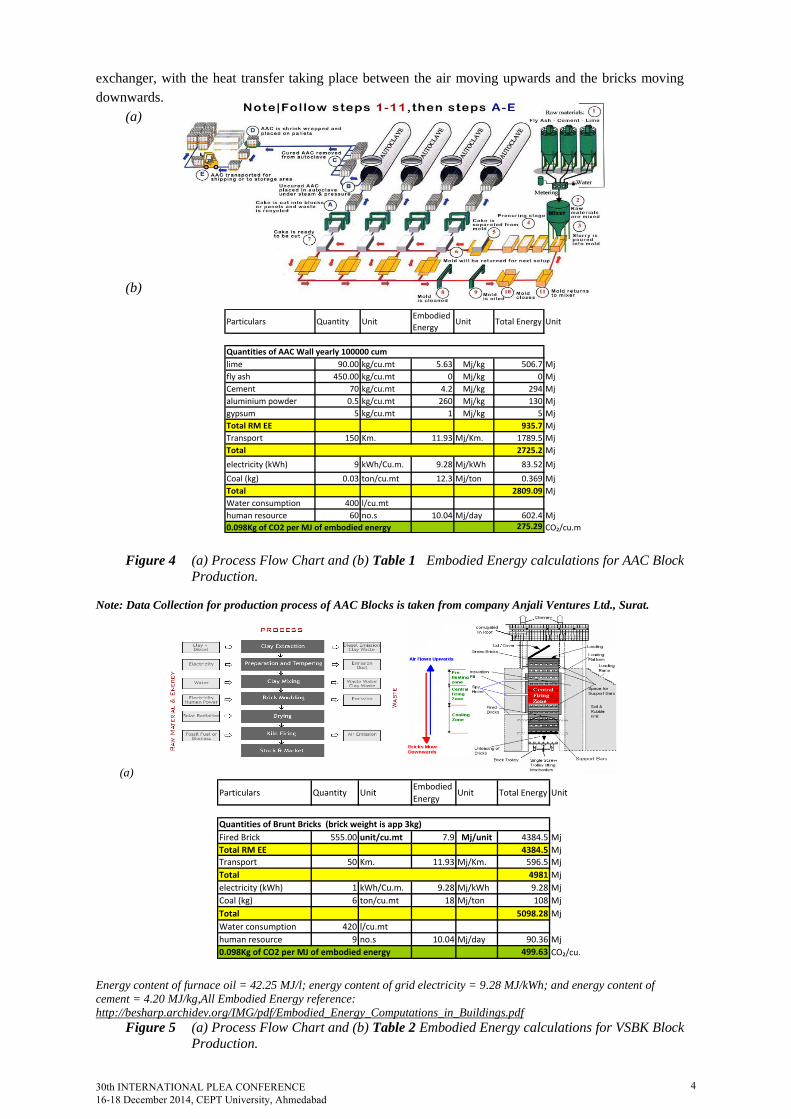
exchanger, with the heat transfer taking place between the air moving upwards and the bricks moving
downwards.
(a)
(b)
Particulars Quantity UnitEmbodied
EnergyUnit Total Energy Unit
lime 90.00 kg/cu.mt 5.63 Mj/kg 506.7 Mj
fly ash 450.00 kg/cu.mt 0 Mj/kg 0 Mj
Cement 70 kg/cu.mt 4.2 Mj/kg 294 Mj
aluminium powder 0.5 kg/cu.mt 260 Mj/kg 130 Mj
gypsum 5 kg/cu.mt 1 Mj/kg 5 Mj
Total RM EE 935.7 Mj
Transport 150 Km. 11.93 Mj/Km. 1789.5 Mj
Total 2725.2 Mj
electricity (kWh) 9 kWh/Cu.m. 9.28 Mj/kWh 83.52 Mj
Coal (kg) 0.03 ton/cu.mt 12.3 Mj/ton 0.369 Mj
Total 2809.09 Mj
Water consumption 400 l/cu.mt
human resource 60 no.s 10.04 Mj/day 602.4 Mj275.29 CO₂/cu.m
Quantities of AAC Wall yearly 100000 cum
0.098Kg of CO2 per MJ of embodied energy
Figure 4 (a) Process Flow Chart and (b) Table 1 Embodied Energy calculations for AAC Block
Production.
Note: Data Collection for production process of AAC Blocks is taken from company Anjali Ventures Ltd., Surat.
(a)
Particulars Quantity UnitEmbodied
EnergyUnit Total Energy Unit
Fired Brick 555.00 unit/cu.mt 7.9 Mj/unit 4384.5 Mj
Total RM EE 4384.5 Mj
Transport 50 Km. 11.93 Mj/Km. 596.5 Mj
Total 4981 Mj
electricity (kWh) 1 kWh/Cu.m. 9.28 Mj/kWh 9.28 Mj
Coal (kg) 6 ton/cu.mt 18 Mj/ton 108 Mj
Total 5098.28 Mj
Water consumption 420 l/cu.mt
human resource 9 no.s 10.04 Mj/day 90.36 Mj
499.63 CO₂/cu.
Quantities of Brunt Bricks (brick weight is app 3kg)
0.098Kg of CO2 per MJ of embodied energy
Energy content of furnace oil = 42.25 MJ/l; energy content of grid electricity = 9.28 MJ/kWh; and energy content of
cement = 4.20 MJ/kg,All Embodied Energy reference:
http://besharp.archidev.org/IMG/pdf/Embodied_Energy_Computations_in_Buildings.pdf
Figure 5 (a) Process Flow Chart and (b) Table 2 Embodied Energy calculations for VSBK Block
Production.
30th INTERNATIONAL PLEA CONFERENCE 16-18 December 2014, CEPT University, Ahmedabad
4

Particulars Quantity UnitEmbodied
EnergyUnit Total Energy Unit Particulars Quantity Unit
Embodied
EnergyUnit
Total
EnergyUnit
Volume of wall 107.54 Cu.m. Volume of wall 107.54 Cu.m.
Volume Green mortar 2.15 Cu.m. 3.2 Mj/cu.m. 6.88 Mj Volume mortar 3584.71 Cu.m. 479.14 MjCement 0 Cu.m. 5999.7 Mj/cu.m. 0 Mj Cement 0.07 Cu.m. 5999.7 Mj/cu.m. 419.98 MjTransport 150 Km. 11.93 Mj/Km. 1789.5 Mj Transport 50 Km. 11.93 Mj/Km. 596.5 Mj
Total 1796.38 Mj Sand 2.00 Cu.m. 29.58 Mj/cu.m. 59.16 Mj
Sand 0 Cu.m. 29.58 Mj/cu.m. 0 Mj Electricity 4 kWh 9.28 Mj/kWh 37.12 MjElectricity 2 kWh 9.28 Mj/kWh 18.56 Mj Total 1112.76 Mj
size(625 x 250x 150
mm)0.023438 Cu.m. 42.67 size(230 x 110 x 70 mm) 0.001771 Cu.m.
No.s of blocks 4229.96 no.s/cu.mt 65.84 Mj/Block 2809.09 Mj No.s of blocks 44530.58 no.s 9.03 Mj/Block 5098.28 Mj
Total 4624.03 Mj Total 6211.04 Mj
E.E. of total wall 497274.64 Mj E.E. of total wall 667944.10 Mj
48732.91 kg of CO₂ 65458.52 kg of CO₂
Quantities of brick Wall
0.098Kg of CO2 per MJ of embodied energy 0.098Kg of CO2 per MJ of embodied energy
Quantities of AAC Wall
blocks/ cu,mt 555 brick in 1 cu.mt
(a) (b)
Source: - embodied energy of various materials and technologies - data and summary - 1.pdf
About 0.098 tonnes of CO2 are produced per gigajoule of embodied energy = 0.098Kg of CO2 per MJ of embodied energy
Table 3 Embodied Energy calculations involved in constructing the Wall Assembly of AAC amd
VSBK.
8.0 CASE STUDIES (CLIMATE: COMPOSITE CLIMATE)
8.1 Fortis Hospital – 3 Star rated. (Location: Shalimar Bagh, New Delhi)
The 500 bedded Fortis hospital at Shalimar Bagh is designed with a vision to provide an
environment friendly health care facility in an area of 64,400 sq mts. It is the first hospital building in
India to have registered for the GRIHA green building rating system.
(a) (b)
Figure 6 Energy Efficiency Interventions - Building Envelope (a) Cross Section of Wall and Roof
Assemblies. (b) U value Calculations and Energy Performance Index (EPI).
9.0 LIVE CASE STUDY (CLIMATE: MODERATE)
9.1 Park Turquoise (Location: Wakad, Pune)
Turquoise is Apartment Flats of 2 bhk (1150 sq. ft), 2.5 bhk (1330 sq. ft), 3 bhk (1550 sq .ft).
A Park Turquoise is the luxurious 70-acre township boasting of ample landscaped and open areas.
(a) (b)
Figure 7 (a) Layout of Live Case Study (b) Typical Floor Plan of the Building.
9.2 Construction Techniques
The building envelope has used Autoclaved Aerated concrete blocks instead of conventional bricks.
The windows are glazed units with low thermal transmittance. Building Envelop is of AAC blocks with
external 1:4 cement and sand plaster and internal gypsum plaster.
U-value calculations for 150mm and 200 mm AAC wall=0.76 w/km² degC and 0.61 w/km² degC.
U-value calculations for 150mm and 230 mm VSBK wall = 1.95 w/km² degC and 1.77 w/km² degC
30th INTERNATIONAL PLEA CONFERENCE 16-18 December 2014, CEPT University, Ahmedabad
5

Figure 8 AAC block Wall Section Brick Wall Section
9.3 Cost Analysis of the Project
All required quantities are refered based on the data collected from the Live Case Study to allow
comparision between the two materials.
Table 4 Comparative cost analysis of Wall Assemblies.
10.0 LIFE CYCLE IMPACT ASSESSMENT OF AAC BLOCKS AND VSBK BRICKS
Based on the data collected from the live case study, Comparative Analysis is been done between
both the materials on various parameters and the results derived from these calculations are as follows:
10.1 Raw Material consumption (per cubic meter of 150 mm thick Non-Loadbearing Wall)
Raw Material Index = (Clay quantity x 2 + Silt x 1 + Sand quantity x 1 + Lime quantity x 1 + Cement quantity x 1 x 1.45
+ Fly ash quantity x 0)/5 Source: www.enzenglobal.com/pdf_downloads/strategy_walling.pdf
Figure 9 Raw Materials in block production and construction of Wall Assemblies.
10.2 Water Consumption (l/m3 for 150mm Non Loadbearing wall).
Figure 10 Water Consumption in Block Production and Construction of Wall Assemblies.
Gypsum Plaster
AAC Block Wall
Exterior wall Plaster0.46
1.84
0.70
3.00
Int. Gypsum Plaster
Exterior wall Plaster
Int. cement sand Plaster
Red Brick Wall
Exterior wall Plaster
0.46
1.84
0.70
3.00
Int. cement sand Plaster
Exterior wall Plaster
Int. Gypsum Plaster
Int. Gypsum Plaster
Clay Silt Sand Flyash Cement LimeAlu.
PowderGypsu
m
Raw materia
l
Raw material index
AAC Blocks 0 0 0 450.00 70 90.00 0.5 5 615.50 197
Burnt Bricks 499.50 582.75 499.50 0 0 0 0 0 1581.7 2081.2
0
500
1000
1500
2000
2500
Mat
eri
al u
sed
Raw material
Block production
Unplastered Plastered
T.W Plastered
Wall
T.W Unplatered
AAC Blocks 39655.88 0 200 39855.88 39655.88
Burnt Bricks 44530.58 6219.11 200.00 44730.58 50749.69
0.00
10000.00
20000.00
30000.00
40000.00
50000.00
60000.00
Wat
er
Water consumptionNon-Load bearing walls 150mm thick.
Block
production
Unplastered Plastered T.W Plastered
Wall
T.W
Unplatered
AAC
Blocks
39655.88 0 200 39855.88 39655.88
Burnt
Bricks
44530.58 6219.11 200.00 44730.58 50749.69
Construction Total water consumption
30th INTERNATIONAL PLEA CONFERENCE 16-18 December 2014, CEPT University, Ahmedabad
6

10.3 Energy Consumption (Embodied Energy and Operational Energy of 150 mm Non Loadbearing
wall).
About 0.098 tonnes of CO2 are produced per gigajoule of embodied energy = 0.098Kg of CO2 per MJ of embodied energy.
Figure 11 Embodied energy (MJ/m3) and Operational Energy (W/m2.deg C) in Wall Assemblies.
10.4 Productivity and OHS (for 150mm Non Loadbearing wall)
Scores for each sub-parameter: High (H) = 3’, ‘Moderate (M) = 2’ and ‘Low (L) = 1; Available (A) = 1’, ‘Inadequate (I)
= 2’ and ‘Not available (NA) = 3, NA=0 for (d), OHS Index = (Sum of scores for each sub-parameter)/9
Figure 12 Occupational Health and Safety Assessment for masonry Wall Assemblies.
10.5 Wall cost for 150mm (AAC) and 230mm (VSBK) Non Loadbearing masonry Wall Assemblies:
Figure 13 Total Wall Cost for masonary construction of Wall Assemblies.
10.6 Emissions:
Figure 14 Emissions related to Wall Assemblies (kg of CO2).
Block production
Transportation (raw
materials &
finished product)
Plastered Unplastered Plastered UnplasteredT.EE
PlasteredT.EE
UnplasteredU value
AAC Blocks 2809.09 1789.5 26.88 6.88 24.00 12.00 4649.47 4617.47 0.75
Burnt Bricks 5098.28 1112.76 519.14 479.14 60.00 30.00 6790.19 6720.19 1.95
0.00
1000.00
2000.00
3000.00
4000.00
5000.00
6000.00
7000.00
8000.00
Ene
rgy
Embodied energy and oprational energy
Exposure to dust
Exposure to heat
Exposure to air
pollutants
Manual Handling
Risk
Personal protective equipment
Risk of falling
Sanitation facilities
available at
plant
Safe drinking
water
available at plant
Housing for
temporary
workers (d)
OHS Index
AAC Blocks 1.00 1 1 1.00 1.00 1 1 1 0 0.9
Burnt Bricks 1.00 1.00 2.00 2.00 3.00 1.00 3.00 2.00 2.00 1.9
0.00
0.50
1.00
1.50
2.00
2.50
3.00
3.50
Val
ue
s
Occupational Health and Safety
No. of Blocks/ Bricks
required
Value of one Block or Brick
Total value of Blocks
used
Build Fast Plus
mortar
Cement and sand mortar
Masons and
Helpers
water for curing
Reinforced coping
Wastage and
breakage
Steel used in stucture
Manpower for 7 day
curingElectricity
Labour for shifting
and
housekeeping
Total Cost
AAC Blocks 4229.96 86.5 365891.5 45600.00 0.00 33000 0 0 12344.75 1690000. 0 600 2000 2149436.
Burnt Bricks 44530.58 7.50 333979.3 0.00 100371.9 75000.00 20000.00 35847.12 73781.76 1950000. 4000 1680 2500 2597160.
0.00
500000.00
1000000.00
1500000.00
2000000.00
2500000.00
3000000.00
Ru
pe
es
Wall Cost
Non-Load bearing walls 150mm thick.
Production Construction Total CO2
kg of CO2 kg of CO2 kg of CO2
AAC
Blocks
275.29 48732.91 49008.21
Burnt
Bricks
499.63 65458.52 65958.15
Production
AAC Blocks 275.29
Burnt Bricks 499.63
0.00
100.00
200.00
300.00
400.00
500.00
600.00
un
its
CO2 Emissions
Construction
AAC Blocks 48732.91
Burnt Bricks 65458.52
0.00
10000.00
20000.00
30000.00
40000.00
50000.00
60000.00
70000.00
un
its
CO2 Emissions
Total CO2
AAC Blocks 49008.21
Burnt Bricks 65958.15
0.00
10000.00
20000.00
30000.00
40000.00
50000.00
60000.00
70000.00
un
its
CO2 Emissions
30th INTERNATIONAL PLEA CONFERENCE 16-18 December 2014, CEPT University, Ahmedabad
7

10.7 Resources used:
http://www.victoria.ac.nz/cbpr/documents/pdfs/ee-co2_report_2003.pdf
The total emission factor for electricity is 16.43g CO2 / MJ.
About 0.098 tonnes of CO2 are produced per gigajoule of embodied
energy = 0.098Kg of CO2 per MJ of embodied energy.
Figure 15 Resources used in wall assemblies /cu mt.
11.0 LIFE CYCLE INTERPRETATIONS
11.1 Overall Comparision
1. It is apparent that masonry units with the least or no clay content (i.e AAC blocks which contains
waste material such as Fly Ash) have low impact. Density also influences raw material impact, thus
AAC blocks resulting from the aerated nature (approximately 80% air) have lower raw material impact.
Larger block size reduces the quantity of mortar wastage on construction site. Additionally, the raw
materials that are consumed are generally abundant and found in most geographic regions, allowing
them to be locally sourced. Furthermore, much of the raw materials used in AAC production may consist
of recycled materials, including copper mine tailings and flyash, a byproduct of coal-fired power plants.
2. AAC blocks use cement in the production process and require curing. However, steam curing
under high pressure (autoclaving) results in significantly lower water consumption. Larger block size
reduces the quantity of mortar used in construction and thus the water requirement on site. Whereas,
Water requires for curing Brick Masonry for 7 days is much large, thus the water consumption increases.
3. Burnt bricks show much higher embodied energy compared to AAC Blocks. The thermal
performance of AAC wall assembly is also generally superior to Burnt bricks as reflected in the U-
values. AAC blocks wall assembly have the lower U-value due to the porous nature of the material.
4. Burnt brick production is traditionally a labour intensive process. The use of manual labour for
moulding therefore results in significantly lower productivity compared to mechanized processes.
Block size also influences construction productivity and a larger block size requires less time and
effort for construction. Poor conditions for labour at brick kiln sites are reflected in OHS index
compared to AAC. Units producing AAC Blocks are generally located close to large urban areas and do
not require labour to live on site during the production period as in the case of Burnt Brick.
5. Cost of AAC block is higher but the overall cost of the construction reduces drastically. Due to
the larger block size of AAC masonry reduces the mortar quantity contributing to lower cost for the wall
assembly. Also due to its lightweight characteristics the steel consumption reduces by 0.4kg which lower
the total cost of construction.
6. CO2 emissions are lower for AAC Production and Wall Assembly compared to Burnt brick
Walls and its production.Also, Resource Consunmtion of AAC is lower and thus the CO2 emmissions.
ACKNOWLEDGEMENT
I would like to thank people of AAC block production company Anjali Ventures Ltd., Surat.
12.0 REFERENCES
1. 2003, from http://www.victoria.ac.nz/cbpr/documents/pdfs/ee-co2_report_2003.pdf.
2. Krishnakedar. S. Gumaste, 2006, from
http://besharp.archidev.org/IMG/pdf/Embodied_Energy_Computations_in_Buildings.pdf.
3. 2011, from http://www.enzenglobal.com/pdf_downloads/strategy_walling.pdf
4. from, http://www.vsbkindia.com/factfile.htm
electricity (kWh)
Coal (ton) ElectricityTotal
ElectricityTotal Coal
AAC Blocks 9.00 0.03 2 11.00 0.03
Burnt Bricks 1.00 6.66 4.00 5.00 6.66
0.00
2.00
4.00
6.00
8.00
10.00
12.00
Un
its
ResourcesNon-Load bearing walls 150mm thick.
Construction
electricity
(kWh)
Coal (ton) Electricity Total
Electricity
Total Coal kg of CO2 kg of CO2 Total CO2
AAC
Blocks
9.00 0.03 2 11.00 0.030.18073 0.00285 0.18358
Burnt
Bricks
1.00 6.66 4.00 5.00 6.660.08215 0.6327 0.71485
EmissionsTotal water consumptionProduction
30th INTERNATIONAL PLEA CONFERENCE 16-18 December 2014, CEPT University, Ahmedabad
8