life-cycle asset accumulation and allocation in...
TRANSCRIPT
Life-cycle Asset Accumulation and Allocation in Canada
Kevin Milligan
Department of Economics
University of British Columbia
997–1873 East Mall
Vancouver, British Columbia
V6T 1Z1
(604) 822–6747
November 27, 2004
Abstract
This paper documents the life-cycle patterns of household portfolios in Canada, and investi-
gates several hypotheses about asset accumulation and allocation. Inferences are drawn from the
1999 Survey of Financial Security, with some comparisons to earlier wealth surveys from 1977
and 1984. I find cross-sectional evidence for asset decumulation at older ages when annuitized
assets like pension wealth are included in the analysis. I also find that the portfolio share of
financial assets increases sharply with age, while indicators of risk tolerance appear to decrease.
This is consistent with families desiring more liquid and less risky assets as they age.
JEL Code: D31, E21, G11
Keywords: Wealth, savings, lifecycle, portfolio choice
1

1 Introduction
The study of financial portfolios has produced a broad and deep body of empirical and theoretical
knowledge about the pricing of financial assets and their allocation within a portfolio. However,
directly held financial assets represent only a small fraction of household portfolios — most house-
holds hold more wealth in housing and pensions, for example. This observation has driven an
interest in documenting the broader asset allocation decisions made by households.
Household portfolio decisions may also provide insight into life-cycle patterns of saving. A key
prediction of the life-cycle model is that households decumulate assets in retirement. The evidence
on the decumulation hypothesis, as surveyed by Browning and Lusardi (1996), is mixed at best.1
A variety of models have attempted to resolve this puzzle through, for example, bequests (Kotlikoff
and Summers (1981)), uncertain lifetime (Davies (1981)), or precautionary savings (Zeldes (1989)).
Examining the accumulation and decumulation of different household assets may provide further
insight into the puzzle and these models.
The life-cycle holdings of risky assets present another motivation for the study of household
portfolios. Samuelson (1969) sets out the theoretical case for age-independence of risk-taking,
showing that investing over longer horizons does not diversify risk away. Ameriks and Zeldes
(2001) and Gollier (2002) provide reviews of the theory, pointing out that the age-independence
hypothesis depends critically on several strong assumptions.2 There is empirical evidence on age
patterns of risky asset holding from many countries.3 Broadly, the existing evidence suggests
that the age profile of risk-bearing tends to follow a hump shape pattern, with risk tolerance first
increasing with age then decreasing in later life. The evidence is stronger on the extensive margin
(the ownership rate) than on the intensive margin (portfolio shares).
In this paper, I study household portfolio allocation over the life-cycle in Canada, with two spe-
cific purposes. First, I document the life-cycle patterns in household wealth allocation in Canada,
comparing data from the 1970s, 1980s, and 1990s. Second, I provide some evidence on the con-
cordance of the life-cycle patterns in the data with established theories and evidence of life-cycle
portfolio behaviour. On both fronts, I place the Canadian evidence in the context of international
studies.
Using three cross-sections of microdata, I uncover several interesting facts about asset holding in
Canada. Overall household assets at the peak of the life-cycle increased sharply from 1977 to 1999,
rising by more than 40 per cent at the median. Among younger families, however, median assets
were lower in 1999 than in 1977. The category showing greatest growth is tax-preferred savings
accounts such as Registered Retirement Savings Plans. Wealth held in these accounts increased
dramatically, from less than 2 per cent of assets in 1977 to more than 12 per cent in 1999. Finally,
the estimated value of income security wealth is large. In 1999, including income security wealth
1

increases total assets by 41 per cent.
I also examine the question of asset decumulation at older ages. Browning and Crossley (2001)
suggest that the inclusion of assets that annuitize, such as pensions, might lead to stronger sup-
port for the decumulation hypothesis. I find that when annuitizing assets are excluded, there is
little evidence of decumulation. However, when employer-provided pensions and public pensions
are accounted for, there is stronger evidence of decumulation. This accords with the alternative
resolution to the puzzle of asset decumulation presented by Jappelli and Modigliani (1998) using
data for Italy — excluding annuitized assets from the analysis leads to age-wealth profiles that
are too flat. Accordingly, tests for asset decumulation that ignore the assets that annuitize will be
biased against finding decumulation.
Finally, I document the life-cycle patterns of household portfolio allocation, uncovering sharp
differences through the life-cycle. I find that the share of wealth held in financial assets increases
with age, particularly in bank accounts. As well, direct holding of stocks goes down with age while
holding of fixed income securities goes up. This may suggest increasing preferences for liquidity
and increasing risk aversion with age. It might also suggest that pensions are ‘over-’ annuitized,
as funds from pensions and tax-preferred accounts move into liquid forms of savings rather than
consumption.
Many researchers have addressed similar and related questions using Canadian data. Wealth
inequality is the focus in Beach et al. (1981), Davies (1993), Siddiq and Beach (1995), and Moris-
sette et al. (2002). More closely related to my work, two papers study the decline of total wealth
at older ages. King and Dicks-Mireaux (1982) find some evidence of decumulation, especially when
they consider pension wealth. Using the same data, Burbidge and Robb (1985) find evidence for
decumulation only among blue-collar workers, although they do not consider pensions. Finally,
Burbidge and Davies (1994) describe household portfolios in Canada using earlier waves of data.
2 Data and Descriptive Statistics
I use asset and debt surveys from 1977, 1984, and 1999 for the analysis. The 1977 and 1984 files are
part of the Survey of Consumer Finances. The 1999 survey is called the Survey of Financial Security.
I use the master files of the 1999 survey, which feature greater disaggregation than the public use
files, but is otherwise similar.4 Comparing the Survey of Consumer Finances to the Survey of
Financial Security, the latter survey includes a broader range of assets, notably employer-provided
pensions and Registered Retirement Income Funds. As shown by Davies (1979), under-reporting
may be a problem in asset surveys. I assess the extent of this problem below by comparing the
survey data to available aggregate data. Results from all three surveys are reported in 1999 dollars,
2

adjusted by the consumer price index.
The surveys are based on samples drawn from the geographically stratified sampling frames of
the Labour Force Survey, which is broadly representative of Canadians when the survey weights
are applied.5 The unit of observation is the census family, with demographic information provided
for the respondent and each family member aged 15 and over.6 All references in the paper to
the ‘family’ encompass both census families and non-family persons. Asset and debt variables are
aggregated to the family level. In 1999, an additional sample of families from high income areas
was added in order to ensure a sufficiently large sample of households with wealth. This structure
makes necessary the use of sample weights to ensure results are nationally representative. In both
years of the Survey of Consumer Finances, a small number of observations are labelled ‘special
family units,’ indicating that demographic information is masked to prevent privacy disclosure. I
remove these special family units from the sample for 1977 and 1984. I use the provided weights
for all results appearing in the paper.
Compared to U.S. data sources, the Canadian data have advantages and disadvantages. The
larger sample size of the Canadian samples helps by providing sufficient data for the study of
particular subsamples, such as age groups. As well, the imputed pension wealth variables available
in the 1999 Survey of Financial Security help by broadening the wealth measures included in
the data. In contrast, the U.S. Survey of Consumer Finances has a smaller sample size and less
information on employer pensions. The major advantage of the American data is the greater
disaggregation of the wealth categories. As one example, researchers can observe asset allocation
within tax-preferred accounts and mutual funds. This disaggregation is not possible with the
Canadian data.
2.1 Income Security Wealth
In addition to the variables provided by the surveys, I include one further measure of wealth in
the analysis. Income security wealth represents the estimated net present value of future public
pension flows, based on the work history to date.7 While phantasmal rather than physical in nature,
income security wealth arises through foregone consumption when young (taxes and contributions)
which generate a flow of income when older (pension benefits). Jappelli and Modigliani (1998),
among others, argue that its consideration is crucial to making inferences about life-cycle wealth
accumulation. The country studies in Borsch-Supan (2003) also feature a comparison between
‘mandatory’ public pension wealth and ‘discretionary’ wealth.
The calculation of income security wealth requires data beyond what is available in the surveys
at hand. Specifically, knowledge of earnings histories back to age 18 or 1966, along with an estimate
of income in retirement, is necessary to calculate the entitlements to the Canada/Quebec Pension
3

Plans and the income-tested benefits of the Guaranteed Income Supplement and the Allowance. To
proceed, I impute this information to individuals using the observed characteristics of household
members in the survey. The imputation is described in the Appendix, and exploits an income
security wealth calculator developed in previous work (Baker et al. (2003)). Of special importance,
the income security wealth calculations assume that retirement occurs at age 62. This means
that income security wealth profiles necessarily decline from this age.8 The dependence of the
results on the imputation procedure renders inferences about income security wealth only partially
informative. For this reason, I include measures of wealth that include income security wealth only
as a supplement to the main results.
2.2 Descriptive Statistics
I report descriptive statistics for the 1999 Survey of Financial Security in Table 1. With the
exception of pensions, the reported values are the respondent’s assessments of the current market
value of the asset.9 Pensions are valued by matching the reported pension registration number
to administrative data sources.10 For each variable, several statistics about the distribution are
displayed across the row. First is the unconditional mean over all observations, followed by the
aggregate share of total assets for each measure. For many assets, some families have no holdings.
For this reason, I provide the mean, standard deviation, and several percentiles of the distribution
for each variable conditional on holding the asset.
The rows of the table present information on different asset categories. At the top is total
assets. I decompose total assets into six mutually exclusive and exhaustive categories: financial,
pensions, tax-preferred savings, property, durables, and business equity. For these categories, where
appropriate, I further disaggregate into several components. In all cases, the aggregation and
disaggregation was verified against the totals variables reported in the survey. Statistics on debt
and net worth are provided at the bottom of the table.
The aggregation of assets across different categories raises a measurement question. All asset
values are reported on a pre-tax basis, but the tax treatment of the assets varies greatly. For
example, capital gains taxes may be owing on financial assets but capital gains on primary residences
are tax-exempt. Lacking a transparent method of placing the asset categories on an after-tax basis,
I follow the international literature and leave the assets on a pre-tax basis. The taxable status of
different categories of assets should be kept in mind when comparing across categories.
The first row contains information on total assets. The mean family total assets in the sample
is $286,784, reported in 1999 dollars. Aggregated to the national level using the weights, this
represents a total of 3.50 trillion dollars. As a comparison, the National Balance Sheet Accounts
show a similar total, with aggregate Total Assets reported at 3.75 trillion dollars in 1999.11 The
4

distribution of assets is skewed toward higher wealth levels, with the mean situated above the
median and just below the 75th percentile.
In the second row I report total assets using a restricted set of assets chosen to mimic the
assets reported in the 1977 and 1984 Survey of Consumer Finance surveys. I follow Morissette et
al. (2002) in excluding work-related pensions, household contents, other durables, annuities, and
Registered Retirement Income Funds to arrive at the measure I call Total assets, SCF definition.
It should be noted, however, that this exclusion assumes that there has been no substitution from
the assets included in the restricted measure to those in the excluded assets. The mean of Total
assets, SCF definition is $212,264, with 96.7 per cent of households reporting a positive value.12
Financial assets is the first asset category in the table. This category includes deposits in
bank accounts, term deposits such as guaranteed investment certificates (GICs), mutual funds,
directly held publicly traded or private equity, fixed income assets, along with a residual other
financial assets category. Overall, financial assets represent 12.1 per cent of total family assets.
The distribution is highly skewed, with a mean of $34,782 and a median of only $4,350. The median
holdings of bank account deposits is $2,000, which represents about 1.96 weeks of average family
income in 1999. While more than 87 per cent of families have bank account deposits, participation
in other types of financial assets is more limited. Only 11.2 per cent of households hold stocks
directly, while 14.7 per cent hold fixed income securities.
Next in Table 1 are statistics on pensions. Actuarial present values of rights accrued under
pensions provided by past and current employers are reported in the Survey of Financial Security.
Around 32 per cent of families in the sample have a family member enrolled in a pension plan
in his or her workplace. As a comparison, 33.4 per cent of the labour force is covered by an
employer pension, as reported in Statistics Canada (2002).13 The proportion of households holding
an annuity or a foreign pension is very small. Overall, pension benefits amount to 17.4 per cent of
family assets.
Tax-preferred savings accounts constitute 12.0 per cent of family assets. All five of the registered
plans listed in the table provide special tax treatment to savings. The most popular are Registered
Retirement Savings Plans, which must be converted to Registered Retirement Income Funds by age
69 (71 prior to 1996). Registered Education Savings Plans have grown in popularity, but are still
relatively small relative to Registered Retirement Savings Plans. New contributions to Registered
Home Ownership Savings Plans were discontinued in 1985, but funds contributed previous to then
continue to be held inside the plans. Deferred Profit Sharing Plans play a relatively small role in
household portfolios.
Property holdings exceed $109,000 per family, on average over all families. Conditional on
owning property, the value is $172,251 at the mean and $132,000 at the median. The bulk of
property holdings is in primary residences. Real estate holdings other than the primary residence
5

are also relatively large at the mean, at $116,998. However, the distribution of other real estate
holdings is much more skewed than the value of primary residences — the median of Other real
estate is about 56 per cent of the mean value, conditional on holding.
Real estate has traditionally been the largest asset in family portfolios. On first look, this
appears to be true for 1999 as well, with the value of primary residences representing 38.2 per cent
of family assets. However, the sum of the shares of pensions and tax-preferred assets is 29.4 per
cent. This sum exceeds the net value (less the value of mortgages) of real estate of 28.1 per cent.
In the durables category I place vehicles, contents, and other durables including collectibles,
valuables, and other non-financial assets. All families report a positive level of household contents,
making the durables category positive for all families. The largest skewness in this category is found
in the other durables component. This component is formed from the raw variables that report
collectibles and other non-financial assets. The very high standard deviation of 132,022 among
those with positive holdings is driven mostly by a handful of observations with other non-financial
assets greater than one million dollars.14
Around 18 per cent of the families in the sample report a positive amount of business equity. The
business equity category includes both farms and professional practices, along with other types of
businesses. The median value of the equity held is only $10,000. Moreover, the value of the families’
holdings is equal to exactly one for 30.5 percent of the sample. These firms typically showed a value
of zero for the book value of the assets.15 This suggests that these firms are very small or not going
concerns. Overall, business equity accounts for around 10 per cent of total family wealth.
The next category in Table 1 reports the debt position of Canadian families, followed immedi-
ately by net worth. The average family debt of $37,499 offsets about 13 per cent of average total
assets, leaving average net worth of $249,285. The largest debt by far is mortgages, at an average
value of $82,844, conditional on having a mortgage. Student loans and credit card debt play a much
smaller role on average across all families. However, the incidence of student loans is lower and the
average value conditional on holding is higher than credit card debt. The other debt component
includes consumer and vehicle loans, and has a fairly broad incidence across families of 42.1 per
cent.
The final rows of the table report statistics related to the income security wealth position of
the family. Because of the assumptions necessary to generate an imputed income security wealth
number for each family, the values should be interpreted carefully. I provide the estimates here
only to illustrate the importance of the relative magnitude — it is equal to 41 per cent of total
family assets. Aggregated up to the national level, this represents $1.45 trillion.16
Table 2 contains some of the same descriptive statistics, but restricting the sample to the lowest
and the highest quartiles of net worth. The quartiles are formed separately by age, so the age
distribution is identical across quartiles. The mean level of every asset category is higher for the
6

top quartile. Total assets in the top quartile have a mean of $726,221, while in the bottom quartile
the mean of total assets was only $25,455. Positive holdings of financial assets outside bank accounts
are much lower in the low quartile compared to the top quartile. The same low holdings pattern
is true for pensions and for property holdings. Interestingly, 21.2 per cent of low quartile families
show positive level of Registered Retirement Savings Plans. The observed differences in household
portfolio allocation across high and low wealth households may contradict two-fund separation,
which predicts all agents will hold a similar risky portfolio.17 Finally, the income security wealth
level in the bottom quartile is $99,007. The comparable figure for the top quartile is $133,609;
not much higher. The closeness of the level of income security wealth is a result of the strong
redistributive effect of the income-tested programs such as the Guaranteed Income Supplement.
The same set of descriptive statistics are reported for the 1977 and 1984 Survey of Consumer
Finances data sets in Table 3. (All dollar values are adjusted to 1999 using the consumer price
index.) As mentioned above, several assets were not included in the earlier surveys, so care must
be taken in comparing the 1977 and 1984 surveys with the corresponding numbers from the 1999
Survey of Financial Security survey in Table 1. Moreover, the differences in sampling between
the surveys may also contribute to differences in reported wealth across the surveys. With these
limitations in mind, total assets at both the mean and median dropped slightly over the seven
years between 1977 and 1984. In the next 15 years to 1999, however, there was substantial growth
in total assets. Comparing to the Total assets, SCF definition measure reported in Table 1, total
assets increased by 56.5 per cent at the mean, and 36.0 per cent at the median between 1984 and
1999.
The dispersion of assets in 1977 and 1984 is much tighter than in 1999. The ratio of the standard
deviation to the median for Total assets, SCF definition rose slightly from 2.26 in 1977 to 2.33 in
1984. By 1999, this ratio reached 4.42. The increase in measured wealth inequality is studied
extensively in Morissette et al. (2002). It is possible that the observed increase in wealth inequality
reflects improvements in the sampling of high-wealth households in the 1999 survey, or differences in
asset coverage in the questions. However, Morissette et al. (2002) compare the survey responses to
wealth values in the national accounts and conclude that survey differences are unlikely to account
for more than a small fraction of the observed increase in inequality.
Among the asset categories, the two largest differences between the 1999 results and the 1977
and 1984 results are tax-preferred savings and property. Registered Retirement Savings Plans
grow from only 1.6 per cent of family assets in 1977 to 9.8 per cent in 1999. Both participation
and average holdings expanded greatly over this period. Whether these new tax-preferred assets
represent new savings or just savings diverted from other sources is difficult to determine, as the
1977 and 1984 surveys lack information on pension assets. For property holdings, the median value
of primary residences advanced by 13 per cent, but this did not stop a large drop in the share of
7

property in family assets from 59 per cent in 1977 to 46.2 per cent of non-pension assets in 1999.
Business equity was not as widely held in the earlier surveys with 13.6 per cent with positive
holdings in 1984 and 18.5 per cent in 1999. However, the share of household wealth held in this
form dropped by 1999 as the growth in this category was overshadowed by growth in other asset
categories.18
3 Asset holding over the life cycle
In this section, I study the life-cycle patterns of wealth holding and accumulation. For this first
pass at the data, the analysis is univariate in nature, comparing only across ages. Importantly,
across-cohort differences in preferences, lifetime earnings, or opportunities may contribute to the
patterns evident in the univariate analysis. In a single cross-section, it is not possible to distinguish
between cohort effects and age effects. The potential dangers of misinterpretation are made clear
in Borsch-Supan and Lusardi (2003), who show that cross-sectional and panel data from Germany
display very different patterns across ages. However, by drawing comparisons to the 1977 and 1984
cross-sections and to the international evidence, some inferences on the life-cycle patterns of asset
holding may be reasonably made. As well, I attempt some limited cohort analysis by stacking the
three cross-sections.
The three surveys were conducted at different parts of the business cycle and in both high-return
and low-return periods for asset markets. The 1977 survey followed several years of fluctuating
growth and high inflation. The 1984 survey took place in the midst of a robust recovery from the
disinflationary recession of 1982. Finally, the end of the 1990s was a period of strong economic
growth leading up to the 1999 survey. In 1977 stock markets were weak in the five years before
the survey with the Toronto Stock Exchange index losing 5.6 percent, but in both 1984 and 1999
the stock market was strong in the five years before the survey. Finally, housing markets were
strong in 1999, but weak in 1984 following the recession of the early 1980s.19 Because of these
differences, comparisons across different survey years should take account of the differing economic
environment.
Another caveat is raised by family structure. I use data from all families rather than restricting
the analysis to married and common-law families.20 At younger and older ages, singles predominate.
For this reason, the marital composition of the sample may contribute to the asset allocation
choices appearing in the figures. This choice of sample is appropriate if the question of interest
is understanding how the allocation of a typical family changes through time, since the family
structure also changes through time.
A related point is mortality. Shorrocks (1975) argues that the well-known positive correlation
8

between longevity and wealth results in a bias toward higher wealth-holding at old ages.21 In my
analysis, I do not adjust for mortality, meaning that the values reported for older ages should be
interpreted as conditional on survival to that age.
I use three-year age groups for the analysis in order to ensure an adequate number of families
in each age group. The age groups are formed based on the age of the older partner in the couple.
When there is an age gap between the partners, the assets and debts of the younger partner are
consequently attributed to the age group of the older partner. The number of observations in the
age groups ranges between 269 and 1,159 in 1999.
In the graphs appearing below, three figures are presented for each category of wealth. The first
graphs the mean, median, 25th, and 75th percentile of the wealth measure against age. Second, the
incidence of holding for each asset type is displayed. Finally, I show the mean of each family’s asset
shares by age. I begin by examining total assets, then proceed to study each of the six categories
in turn.
3.1 Total assets
The first set of figures examines total assets. In Figure 1a, mean assets peak with the 55-57 age
group at $500,737, while the peak of the median lies directly below at $316,346. The 25th and
75th percentiles also peak in this age group, at $126,571 and $625,427 respectively. After the peak,
total assets drop at all displayed parts of the distribution. From ages 55-57 to 82-84, the decline
at the 75th percentile is to 41.4 per cent of the peak value, while at the 25th percentile the decline
is similar, at 38.8 per cent.
Figure 1b graphs the ownership rates for the asset categories, uncovering diverse patterns among
the categories. Financial assets and durables are held constantly across the ages at high levels. In
contrast, annuitizing assets such as tax-preferred savings and pensions follow a strong hump-shaped
pattern across the ages in this cross-section. Property holding increases through the 20s and 30s,
but only begins to fall in the 70s. Venti and Wise (2001) find that families in the United States
rarely stop home-ownership in the absence of a severe health or mortality shock. If this holds true
for Canadian families, then an increased incidence of health and mortality shocks after age 70 could
explain this pattern. Finally, business equity holding begins to drop in the data after age 60.
The mean of the category shares is displayed in Figure 1c. At early ages, families hold almost
all of their assets in durables and financial assets. At middle ages, the dominant asset is property,
reaching 40.3 per cent at ages 43-45. Tax preferred and pension assets also grow through middle
ages. During the retirement years, the most striking feature of the figure is the rebounding share
of financial assets. After reaching a low of 7.1 per cent at ages 43-45, the share of total assets held
in financial assets rises to over 30 per cent by age 80. A very similar pattern is visible in the data
9

for 1977 and 1984 as well, providing some evidence that this phenomenon is not a cohort effect but
a true age effect. However, longitudinal data are necessary to find decisive evidence.
The pie charts in Figures 1d through 1f display cross-sections taken from Figure 1c at different
ages. The age patterns for the asset categories are shown clearly in the three charts. Business
equity, pensions, and tax-preferred assets first increase then decrease. In contrast, the financial
asset share decreases then increases, while durables and property shares move monotonically across
these three age categories.
Figures 2a, 3a, and 4a repeat the analysis of Figure 1a for other definitions of wealth. Figure
2a shows the life-cycle path of total assets including the imputed income security wealth measure.
Median assets including income security wealth peaks at $529,597, with a more starkly hump-
shaped accumulation pattern. Because income security wealth accumulates with age, and then is
forcibly annuitized in retirement, it follows that including income security wealth in the measure of
assets will make for a more hump-shaped accumulation pattern. The decline in median assets from
ages 64-66 to 79-81 is $231,531 (44 per cent) when income security wealth is included, but only
$117,267 (38 per cent) when income security wealth is not included. This steeper decline provides
evidence that the inclusion of annuitized assets like income security wealth strengthens the case for
asset decumulation in retirement.
The next figure displays the cross-sectional age pattern of accumulation using the SCF definition
of total assets, which will be useful for comparisons with the 1977 and 1984 figures. Finally, Figure
4a graphs net worth, calculated as total assets less debt. There is little difference between total
assets and net worth from middle ages onward, as debt becomes increasingly unimportant at those
ages. Through the 20s, 30s, and 40s, however, the slope of the accumulation of net worth is much
higher than total assets, reflecting the decrease in debt over these ages.
Figures 5 and 6 repeat the analysis for the 1977 and 1984 data. There are differences in both the
levels and the slopes across years. Assets at the peak of the life-cycle are almost unchanged around
$150,000 for the median in 1977 and 1984. Large increases occurred by 1999, however. Comparing
to the SCF definition values for 1999 in Figure 3a, there was an increase at the life-cycle peak
of 42.3 per cent to $205,501 at the median. The slope of total assets across ages also undergoes
large changes across the different years. In 1977, the difference in median wealth between ages
28-30 and the peak was $83,635. In 1999, the same difference was $174,531. It is not until ages
46-48 that median wealth in 1999 exceeds the level in 1977. Taken together, this suggests that the
cross-sectional age-wealth profile is substantially steeper in 1999 than 1977.
The sources of the increase in peak assets can be seen more clearly by examining the allocation
of assets across categories in Figures 5c and 6c. Tax-preferred savings take a negligible share of
assets in 1977, and although the share in tax-preferred forms nearly doubles at the peak of the
life-cycle by 1984, tax-preferred assets still represent only around 5 per cent of the average family’s
10

portfolio. This contrasts with 11 per cent at the life-cycle peak in 1999. The other main source of
the increase is in property holdings. At the age 58-60 mean, the value of property increased by 53
per cent to $157,052 in 1999 compared to 1984.
Figure 7 displays median total assets (using the comparable SCF definition) for several cohorts
through the three surveys. The 1977 and 1984 data points are 7 years apart, and the 1999 data
point records the total assets for the cohort another 15 years later. The cohorts are labelled for
their year of birth. For each of the cohorts, median total assets changes little between 1977 and
1984, but grows substantially higher in 1999. Looking within cohorts, there is little evidence of
declining assets at older ages. However, this may be a result of a positive year effect shock in 1999
rather than continued asset accumulation at older ages. The increase in assets for the older cohorts,
however, appears to be more moderate than for younger cohorts. For example, the 1915 cohort
increased $46,513 at the median between 1984 and 1999 (or 43 percent), while the 1924 cohort
increased by $117,596 (or 97 percent).
This initial analysis of the data reveals three interesting observations. First, total assets in
Canada have increased substantially at the peak of the life-cycle between 1977 and 1999, while
accumulation toward the peak has become remarkably steeper. Second, there are sharp differences
in the holding and allocation of assets in different categories across ages. In particular, if annuitized
assets such as employer-provided pensions or income security wealth are left out of the analysis,
then the remaining observed assets show a slower rate of decumulation in retirement. Third, the
portfolio share of financial assets traces an intriguing U-shaped pattern through the life cycle. In
the remainder of the paper I will examine these findings more closely first by breaking down each
asset category into its components to study the data at a more disaggregated level, and then in
section 4 with regressions to control for observable differences across age groups.
3.2 Breakdown by asset category
I next turn to breaking down each asset category into its constituent components. This analysis
allows deeper insight into the factors driving the patterns seen above with more aggregated data.
The same three graphs are presented for each of the six asset categories. I focus only on the 1999
Survey of Financial Security results as they provide the deepest level of disaggregation. Results
from 1977 and 1984 appear similar, however, when comparisons are feasible.
The first category is financial assets, in Figure 8. In 8a, the mean lies above the 75th percentile
at most ages. However, even at the 25th percentile, financial assets are rising with age through
retirement. This is consistent with the age pattern of the financial asset share observed earlier.
The second graph for financial assets shows ownership rates, in Figure 8b. The ownership rate
for accounts is not shown, as it does not fit the scale of the other lines — it is relatively constant
11
across the ages between 85 and 95 per cent. The other rates of ownership are much lower, at less
than 25 per cent. Mutual fund ownership displays an odd pattern, bumping up at middle age
before heading back down under 15 per cent. As broad-based mutual fund investing has arisen
only in recent decades, the patten of mutual fund ownership may reflect cohort effects more than
age effects.
The most interesting pattern in the figure is the divergence between fixed income and equity
holding. At middle ages they track each other closely at around 15 per cent of families. After age 54,
however, they diverge greatly until reaching a gap of more than 15 percentage points at ages 82-84.
This phenomenon is consistent with an increase in aversion to risk with age.22 Any inference from
these data should be tempered by consideration of across-cohort differences in financial strategy.
However, it should be noted that the same pattern appears in the 1977 and 1984 results. In addition,
the inability to see inside mutual fund and tax-preferred account holdings makes it impossible to
conclude that the divergence holds across the entire portfolio.
Finally, in Figure 8c, the components of financial assets are presented. The components that
appears to be driving the upward trend in the share of financial assets with age are accounts and
term deposits. Combined, they rise at the mean from 4.7 per cent of assets at age 55-57 to 25.1 per
cent at age 82-84. A very similar pattern appears in the 1977 and 1984 data, suggesting that this
result is not simply a cohort effect. While term deposits may reflect a desire for safety, the increase
in the share for bank accounts is a switch into liquidity. Poterba and Samwick (2002) find similar
results in a repeated cross-section sample of US data, with higher ownership rates and asset shares
in bank accounts among older Americans. However, in Poterba and Samwick (2001) the authors
find that cohort effects may contribute to much of the observed increase in bank account ownership
with age.
To the extent that a true age effect underlies the observed patterns, the results suggest that
families build up a base of very liquid assets as they age, substituting away from categories such as
business equity and tax-preferred savings. The run-up of liquid financial assets may indicate that
the forced annuitization of Registered Retirement Income Funds and employer-provided pensions
is more than sufficient for current consumption. Some evidence is provided by Lin (2000) who
studies repeated cross-sections of flow-savings data for Canada. Lin finds that the savings rate
drops at retirement but then grows again. More study of consumption patterns through retirement
is necessary to better understand this phenomenon. Also, the funds accumulated in financial assets
may provide a buffer against longevity risk, or they may represent a desire to consume less in order
to make a larger bequest at death.
The age profiles for pensions in Figure 9 show distinct life-cycle patterns. In Figure 9a, the
profile at the median is non-zero only at middle ages, consistent with the prevailing rates of coverage
of employer-provided pensions in Canada. The peak for pension assets at the mean is reached at
12

age 61-63. Since pensions are typically annuitized through retirement, pension wealth necessarily
falls at a relatively smooth rate. In the ownership graph 8b, the rise of in-pay pensions and the fall
of current employer pensions is evident, crossing at ages 58-60. The transition reflects the change
from employment to retirement. This transition is also evident in the share graph in Figure 8c.
There is a strong and sharp increase in in-pay pensions starting in the early 50s, accompanied by
a sharp drop in the share of current employer pensions.
Why does total pension wealth in Figure 9a rise so steeply near the ages of retirement? One
might argue that the net present value of future pension flows should be the same one day before
retirement (when it is included in current employer) and one day after retirement (when it is
included in in-pay). Two possible resolutions to the puzzle arise. First, there may be differences
in the pension valuation methodology that drive the observed differences in pension wealth at ages
near retirement. For example, before pension receipt begins, the form of the pension that is to
be received in the future must be imputed given available information. In contrast, after pension
receipt begins, information is revealed and less must be imputed. If there were a systematic bias
in the imputation, then it might explain the observed age patterns.
However, there is good reason to believe that the observed increase is correct. The second
potential resolution to the puzzle comes from the patterns of accrual of pension benefits, as docu-
mented in Pesando and Gunderson (1988) and Pesando et al. (1992). Accrual at later ages is much
higher than early ages in general, accounting for the sharp slope at pre-retirement ages evident
in Figure 7c.23 The authors also document very sharp spikes in the accrual profile at ages when
workers become eligible for early retirement, or when age plus years of service hits some special
number. If workers follow the incentives and indeed retire in great numbers at these ages, then
the shift from current employer to in-pay pensions would therefore coincide directly with a great
accrual in their pension wealth. This could account at least in part for the large increase in total
pension wealth at these ages.
Tax-preferred accounts exhibit some of the same patterns as pension wealth, as forced annuiti-
zation of the wealth leads to sharp declines through retirement ages. In Figure 10a the mean and
percentiles of the distribution of wealth held in tax-preferred savings are displayed. The peak of
the mean is at ages 58-60. After age 70, the decline is particularly steep, falling from over $50,000
at ages 73-75 to less than $10,000 at ages 10 years older.
Figures 10b and 10c document the transition to Registered Retirement Income Funds from
Registered Retirement Savings Plans. The age at which funds must be switched into Registered
Retirement Income Funds is 69, but the age groups are formed on the older spouse’s age, so those
married to spouses older or younger than themselves will show later or earlier transitions of family
holdings into the Registered Retirement Income Funds. The cross-over point for participation in
Registered Retirement Income Funds and Registered Retirement Savings Plans is after the 67-
13
69 age group. While 92.2 per cent of tax-preferred savings are in Registered Retirement Savings
Plans at ages 61-63 versus 5.9 per cent in Registered Retirement Income Funds, there is an almost
complete reversal to 7.1 per cent versus 91.0 per cent by ages 76-78. For the other three forms
of tax-preferred savings in the graphs, participation and mean wealth is quite limited. Of note,
participation in Registered Education Savings Plans rises above 10 per cent for families after age
40.
The graphs in Figure 10 show that tax-preferred wealth falls very abruptly with age. From a
mean of $64,766 at ages 67-69, tax-preferred wealth falls to $5,496 by ages 82-84. What accounts for
this pattern? The first possibility to consider is the difference in Registered Retirement Savings Plan
participation and accumulation across cohorts. As seen earlier, participation in 1977 and 1984 was
much lower across all ages. This suggests that the older cohorts observed in 1999 likely had less tax-
preferred wealth accumulated than the younger cohorts in 1999. However, other explanations could
contribute to the observed effect. For example, withdrawals from Registered Retirement Income
Funds could be occurring more quickly than required.24 These withdrawals might be influenced
by the income-testing of public pension benefits. Guaranteed Income Supplement benefits are
subjected to an income test of 50 cents for each dollar of income, including income from Registered
Retirement Savings Plans or Registered Retirement Income Funds. In addition, Old Age Security
benefits are reduced by 15 cents per dollar of income over a threshold ($57,879 in 2003). A family
trying to maximize its future public pension benefits might find it optimal to withdraw funds from
tax-preferred accounts very quickly in order to receive some benefits in future years, rather than
having continued withdrawals wipe out income-tested benefit eligibility in every future year. This
would have to be balanced against the value of continued tax-exempt accrual within the registered
account. Further research on withdrawals would shed more light on the observed cross-sectional
age patterns.
The next set of figures displays the age profile of property assets. In Figure 11a, the mean of the
distribution of property holdings lies fairly close to the median, in contrast with the financial asset
graph in Figure 11a. The median peaks at ages 58-60 at $125,000. At the 25th percentile, only at
middle ages does property ownership occur, with the line sitting at zero for other ages. In Figure
11b, the home ownership rate increases from the 20s until the 40s, after which it sits steadily above
70 per cent until the 70s. The rate then falls through the 80s. Investment in other real estate is
much more limited, reaching a peak of 27.1 per cent at ages 64-66.
The final two asset categories are durables and business equity, displayed in Figures 12 and
13. The patterns for durables align quite closely with those seen for housing equity. This is
not surprising, as accumulation and decumulation of household contents should depend on home
ownership. In Figure 12b, the decline in vehicle ownership mirrors that of home ownership in
Figure 11b. Consequently it may be that declines in vehicle ownership are also related to health or
14

mortality shocks within the family. The accumulation and decline in business equity seen in Figure
13a is seen to be a result of changes in ownership rates in Figure 13b. This suggests that as small
business owners retire, they sell their ownership stakes.
I bring the univariate examination to an end with debt holdings in Figure 14. The age profile
of debt is quite distinct from assets, but strongly consistent with life-cycle behaviour. Families
accumulate debts when younger and pay them off when older. In Figure 14a, the mean level of
debt is remarkably flat from the late 20s until the early 50s, at around $50,000. As can be seen in
Figure 13b, the repayment of debt accelerates with age, particularly after age 60. The decline is
fairly similar across all categories of debt.
The one exception is student loan debt. Student loan debt displays an intriguing pattern, first
dropping, then rising through the 40s, and finally falling from the 50s on. The pattern likely reflects
the family basis for the data. The bump in the 50s may be debt incurred by children still living at
home with their 50 year old parents.
Breaking down the wealth categories into their components has provided several interesting
insights. First, the increase in the portfolio share of financial assets with age is driven in large
part by bank accounts, which indicates a liquidity interpretation for this effect. As well, the
liquidity findings suggest that pension assets may be ‘over-’ annuitized relative to the consumption
preferences of seniors. Second, risk tolerance, as measured by direct ownership of stocks versus fixed
income assets, appears to decrease with age. Third, the strongly hump-shaped life-cycle patterns
for employer-provided pensions and tax-preferred savings emphasized the importance of including
these assets when measuring the life-cycle accumulation and decumulation of wealth.
4 Regression analysis
The previous section identified and documented several patterns in the age profile of wealth ac-
cumulation. In this section, I subject three of the observed age profile patterns to a stronger test
by controlling for observable household characteristics in a regression framework. The econometric
ambition of this exercise is modest — the goal is to improve the credibility of the inferences drawn
in the descriptive analysis of the previous section. A more rigorous empirical analysis is left for
future work. As before, it should be noted that the unavailability of panel data renders difficult
the interpretation of the observed results as caused by aging rather than as manifestations of cross-
cohort differences. However, results with the 1977 and 1984 cross-sections were similar, when the
available asset data made comparisons feasible.25
15

4.1 Do assets fall in retirement?
The first question I address is whether assets fall in retirement. The unconditional age profiles
showed declining profiles with age after retirement, especially when annuitized wealth measures such
as employer-provided pensions, tax-preferred accounts, and income security wealth were included.
Burbidge and Robb (1985) found some evidence of decumulation in the 1977 Survey of Consumer
Finances, but only among married lower skill workers. The goal of the regressions below is to
demonstrate the impact of including annuitized variables in the wealth measure on conclusions
about the decumulation of wealth at older ages.
For these regressions, I exclude observations with negative business equity, and those with zero
assets.26 I focus on the assets of those families where the older spouse is age 62 or more.27 There
are three dependent variables. The first is the logarithm of total assets less pension wealth and tax-
preferred savings. This measure of assets excludes the annuitized assets, and more closely resembles
what was available to researchers using the 1977 or 1984 Survey of Consumer Finances to study
this question. The second measure of assets is simply the logarithm of total assets. The third and
final measure is the logarithm of total assets plus income security wealth.
The empirical specification I estimate with ordinary least squares is:
log(Assets) = β0 + β1AGE + β2X + ε. (1)
Assets is one of the three dependent variables described above. The vector X is a set of controls
including dummies for older spouse education, sex, marital status, province, and size of urban area
of residence. I make inferences about the decumulation pattern after retirement using a simple
specification with linear age.
Table 4 displays the results. The three dependent variables are set in the three panels of the
table. Across the columns are differing selection criteria for the sample. The first specification
in Panel A takes all of the observations in the sample. The estimated coefficient on AGE is
0.007, which is statistically indistinguishable from zero. This suggests that there is no evidence of
decumulation of non-pension assets in the data. The next column takes only the married families
in the sample. I choose this specification to align more closely with the analysis of Burbidge and
Robb (1985) who study only married families. Again, there is little evidence of decumulation.
The insignificant point estimate of -0.006 implies that for married couples after age 62, there is an
average decumulation of 0.6 per cent per year in non-pension assets. The large drop in the r-squared
indicates that a large proportion of the variation in assets is between married and single couples.
The final two columns break down the sample into those for which the older spouse is a high school
dropout and those for which he or she is a university degree-holder. I take education groups as a
simple proxy for lifetime earnings potential. The point estimates suggest a stronger decumulation
16
effect for those with university, but the significance level is too low to draw conclusions.
Panel B of the table repeats the analysis for the total assets measure. Using all observations
in the first column, the result is insignificant. However, when using just the married observations,
there is a significant 1.7 per cent per year rate of decumulation. This contrasts with the Burbidge
and Robb (1985) findings because of the inclusion of more annuitizing assets — pensions and tax-
preferred savings. These data were not available in the earlier Surveys of Consumer Finances that
were used by the authors. As in Panel A, there is some evidence of stronger decumulation among
the university educated, although it is statistically insignificant at conventional levels.
Finally, Panel C of Table 4 includes income security wealth in the measure of assets. Across all
four samples in the panel the results are remarkably similar. In the sample with all observations,
the families are predicted to draw down their assets at a rate of 2.4 per cent per year. Since income
security wealth is annuitized, this result is mechanical. However, this is exactly the point of the
regression. When annuitized assets are included in the measure of wealth, asset non-decumulation
disappears. A similar case for annuitizing public pension wealth and non-decumulating financial
wealth is made for Italy in Brugiavini and Padula (2003) and for Germany in Borsch-Supan and
Lusardi (2003).
4.2 How do asset shares change with age?
In the unconditional age profiles, the portfolio share of financial variables rose at older ages, while
the share of property fell. I subject this finding to a stronger test by controlling for a set of
observable covariates in the following ordinary least squares specification:
SHARE = β0 + β1AGE + β2log(TotalAssets) + β3X + ε. (2)
Only households with the older spouse having reached at least age 62 are included in the sample.
The variable SHARE is formed by the ratio of an asset category to total assets. The two categories
I study here are financial assets and property. I again use a linear specification in age. The vector
of controls X is the same as used in the decumulation regressions in equation 1, with one exception:
in some specifications, I include the log of total assets as a regressor.
The regression results are reported in the top panel of Table 5. Across the table I report results
excluding and including the log of assets as a regressor, and for the two asset share dependent
variables. There is little difference between the coefficient with and without the control for total
assets in either case. For financial asset share, the estimate of 0.008 for the coefficient on the
older spouse age indicates that one more year of age increases the share of financial assets by a
statistically significant 0.8 percentage points, or 4.8 per cent of the mean. The rate of increase is
17

steep, implying almost a 50 per cent increase in financial asset share over a decade. These results
indicate empirical support for the observation that liquid wealth increases with age in the 1999
cross-section. Again, either an age or a cohort explanation is consistent with this finding.
Property asset share results are displayed in the second half of the top panel of Table 5. The
coefficient on the older spouse age is near zero and not statistically significant. This indicates a
fairly flat average profile among those over 62 for property asset share in this linear specification. A
quadratic specification (not shown) does indicate some support for property asset share decreasing
at older ages in this sample.
Taken together, this evidence may indicate an increasing preference for more liquid assets in
retirement. At older ages, the likelihood of a strong health or mortality shock increases. Rather
than the prospect of a ‘fire sale’ of illiquid assets, older families may hold more liquid assets to
facilitate fast access to their wealth in case of a shock.
4.3 How does ownership of risky assets change with age?
The final set of regressions examines the age profile of the ownership of risky assets. In the
unconditional age profiles, ownership of stocks declined slightly at older ages while ownership of
fixed income securities increased markedly. If stocks are assumed to be riskier than fixed income
securities, then this may be evidence in support of a decreasing age profile for risk tolerance. The
regressions will subject this observation to a more rigorous test. For the regressions, I take binary
variables indicating ownership of stocks and of fixed income securities to form dependent variables
in an ordinary least squares regression of the form
OWNERSHIP = β0 + β1AGE + β2log(TotalAssets) + β3X + ε. (3)
The control variables are the same as in equation 2. I estimate the equations using a linear
probability model with ordinary least squares. Results using a probit were similar.
The bottom panel of Table 5 provides the regression results for the ownership regressions,
showing specifications with and without the total asset control. The linear effect of age on stock
ownership is estimated to be very close to zero in both the regression with and without the total
asset control. Fixed income ownership, on the other hand, is estimated to increase at 0.5 percentage
points per year in the specification without the asset control, and also 0.5 percentage points per
year in the specification with the asset control. This indicates strongly that families headed by
older individuals in the 1999 sample are more likely to hold fixed income assets. Again, this is
consistent with evidence from the earlier waves of Canadian data and the international evidence,
which gives more credibility to an age over a cohort interpretation.
18
The evidence suggests that there is some aversion to ownership of stocks at older ages, and
more holding of bonds and other fixed income securities. This is consistent with studies in Italy
(Guiso and Jappelli (2002)), the United Kingdom (Banks and Tanner (2002)), and the United
States (Bertaut and Starr-McCluer (2002) and Ameriks and Zeldes (2001)). In contrast, evidence
for Germany by Eymann and Borsch-Supan (2002) and for the Netherlands by Alessie et al. (2002)
does not support a drop in risk tolerance among the elderly. A further caveat for the Canadian
results must be raised because the data do not allow researchers to see inside mutual funds or
tax-preferred accounts to see the asset allocation of those funds and accounts. Still, this provides
some evidence consistent with an hypothesis of increasing risk-aversion at older ages.
5 Conclusion
This paper has provided some basic facts about life-cycle asset accumulation and allocation by
Canadian families. Comparisons of the data from 1999 to earlier surveys revealed several striking
trends, including a sharp increase in the level of median assets and the steepness of asset accu-
mulation, the rise of tax-preferred savings accounts to a prominent place in family portfolios, and
a relative decrease in the importance of housing wealth. Income security wealth was found to be
equal to about 41 per cent of other household assets. In addition, I found evidence in support of
three important observations. First, total assets decline more sharply in retirement when annu-
itized assets are included. Second, the portfolio share of liquid assets increases at older ages. Third,
holdings of less risky financial assets appear to increase in retirement. These findings are broadly
consistent with the international literature.
Some caveats limit the interpretation of the findings. Foremost is the necessary reliance on
cross-sectional rather than panel data to draw inferences, requiring an assumption that cohort
effects are not driving the observed patterns in the data. In addition, the disaggregation of assets
in the Survey of Financial Security is not as great as in the Survey of Consumer Finances in
the United States. Both of these data limitations render some of the inferences somewhat more
tentative. However, the consistency of the patterns across years and the similarity of the results
with those from other international studies of household portfolios lend more confidence to the age
interpretation of the results.
A parade of puzzles remain for future work. Among them, more answers must be found about
the causes of the rise in financial assets at older ages. What roles are played by the sale of homes
and business equity, the annuitization of pension assets, and money flowing out of tax-preferred
accounts? In addition to implications for different models of household saving, the answers to these
questions have important policy implications for the design of pensions and for income security
19

programs for the elderly.
20

A Description of Variables
Below is a brief description of each of the wealth measures used in the analysis of the 1999 Surveyof Financial Security. For more details, please consult the questionnaire (Statistics Canada (1999)),the guidebook (Statistics Canada (2003)), or the pension valuation methodology guide (StatisticsCanada (2001b)).
A.1 1999 Survey of Financial Security
Accounts: Chequing accounts and savings accounts.Term deposits: Term deposits and guaranteed investment certificates.Stocks: Directly held equity; outside of mutual funds or registered accounts.Fixed income: Bonds, mortgage backed securities, and t-bills; outside of mutual funds or regis-
tered accounts.Other financial assets: trust funds, loans, and other financial assets.Pension from current employer : Valued on a going-concern basis, meaning that only earnings
up to the present are included in the pension valuation formula.Pension from previous employer : Valued based on reported last earnings from the previous
employer.Pension currently paying : Valued based on observed pension income.Foreign pension: Valued based on observed pension income.Annuity : Reported asset value of annuities.Registered Retirement Savings Plans: Reported amount in Registered Retirement Savings Plans
including locked-in funds.Registered Home Ownership Savings Plan: Reported amount in Registered Home Ownership
Savings Plan.Registered Education Savings Plan: Reported amount in Registered Education Savings Plan.Registered Retirement Income Fund : Reported amount in Registered Retirement Income Fund.Deferred Profit Sharing Plan: Reported amount in Deferred Profit Sharing Plan.Primary Residence: Self-reported market value of primary residence.Other Real estate: Self-reported market value of real estate not including primary residence,
both Canadian and foreign.Vehicles: Value of all personal use vehicles, including watercraft, recreational vehicles, and
aircraft.Contents: Contents of primary residence, including furniture, appliances, and electronic equip-
ment.Other durables: Reported value of jewellery, artwork, antiques, collectibles plus any other assets
such as copyrights, patents, or royalties.Mortgages: Reported total of mortgage on principal residence and other real estate.Student Loans: Reported value of student loan debt.Credit card : Reported value of credit card and installment debt.Other debt : Reported value of car loans, lines of credit, and other debt.
21

A.2 1977 and 1984 Survey of Consumer Finances
For these surveys, most of the variables were used directly as provided. Below I list the exceptionswhere aggregations or imputations were used. The aggregations and disaggregations have beenchecked against reported total assets to ensure each asset category is included once and only once.
Fixed Income: Reported value of savings bonds.Other financial assets: Reported value of other assets, cash, and imputed value of other liquid
assets. The imputed value of other liquid assets was calculated as the residual of reported liquidassets less cash, savings bonds, and deposits.
Vehicles: Reported value of cars plus the reported value of other vehicles.
A.3 Income Security Wealth Imputation
The imputation of income security wealth requires a work history back to age 18 or the year 1966 inorder to calculate Canada/Quebec Pension Plan benefits. In addition, an estimate of total futureretirement income is necessary to properly impute income-tested benefits such as the GuaranteedIncome Supplement and the Allowance, as well as federal and provincial taxes.
The work history is imputed based on marital status, sex, age, and education. Earnings regres-sions using data from the 1971-1997 Survey of Consumer Finances were run to obtain the estimatedcoefficients, which provided an earnings estimate for each year given the observed characteristicsof each family member in 1999. For years not available in the Survey of Consumer Finances, I takethe nearest available year of data and adjust earnings based on growth in the average industrialwage.
Future non-labour income is imputed to households based on marital status, sex, and age usingdata from the closest Census. The procedure is identical to the imputation used in Baker et al.(2003).
Given these imputed data, the calculation proceeds using a calculator developed for, and fullydescribed in, Baker et al. (2003). The calculator accounts for benefits from the Canada/QuebecPension Plan, the Guaranteed Income Supplement and Allowance, and Old Age Security. Provincialand federal taxes are subtracted from all flows. All parameter values are assumed to remain constantin real terms for future years; the 1999 data assume 1999 parameters into the future. Future benefitsare discounted for life expectancy and a real interest rate of three per cent per annum.
In all cases, I assume that retirement occurs at age 62. Mechanically, this leads income securitywealth to begin falling at that age. An earlier draft of the paper used age 65 and found similarresults.
22
References
Alessie, Rob, Stefan Hochguertel, and Arthur van Soest (2002) ‘Household portfolios in the Nether-lands.’ In Household Portfolios, ed. Luigi Guiso, Michael Haliassos, and Tullio Jappelli (Cam-bridge MA: MIT Press)
Ameriks, John, and Stephen P. Zeldes (2001) ‘How do household portfolio shares vary with age?’Working Paper, Columbia University
Attanasio, Orazaio, and Carl Emmerson (2003) ‘Mortality, health status, and wealth.’ Journal ofthe European Economic Association 1(4), 821–850
Baker, Michael, Jonathan Gruber, and Kevin Milligan (2003) ‘The retirement incentive effect ofCanada’s income security programs.’ Canadian Journal of Economics 36(2), 261–290
Banks, James, and Sarah Tanner (2002) ‘Household portfolios in the United Kingdom.’ In HouseholdPortfolios, ed. Luigi Guiso, Michael Haliassos, and Tullio Jappelli (Cambridge MA: MIT Press)
Beach, Charles M., David E. Card, and Frank Flatters (1981) Distribution of income and wealth inOntario: Theory and evidence (Toronto: Ontario Economic Council and University of TorontoPress)
Bertaut, Carol C., and Martha Starr-McCluer (2002) ‘Household portfolios in the United States.’In Household Portfolios, ed. Luigi Guiso, Michael Haliassos, and Tullio Jappelli (Cambridge MA:MIT Press)
Borsch-Supan, Axel (2003) Life-cycle Savings and Public Policy (San Diego: Academic Press)
Borsch-Supan, Axel, and Annamaria Lusardi (2003) ‘Saving: A cross-national perspective.’ InLife-cycle Savings and Public Policy, ed. Axel Borsch-Supan (San Diego: Academic Press)
Browning, Martin, and Annamaria Lusardi (1996) ‘Household saving: Micro theories and microfacts.’ Journal of Economic Literature 34(2), 1797–1855
Browning, Martin, and Thomas F. Crossley (2001) ‘The life-cycle model of consumption and saving.’Journal of Economic Perspectives 15(3), 3–22
Brugiavini, Agar, and Mario Padula (2003) ‘Household saving behavior and pension policies inItaly.’ In Life-cycle Savings and Public Policy, ed. Axel Borsch-Supan (San Diego: AcademicPress)
Burbidge, J. B., and A. L. Robb (1985) ‘Evidence on wealth-age profiles in Canadian cross-sectiondata.’ Canadian Journal of Economics 18(4), 854–875
Burbidge, John, and James B. Davies (1994) ‘Household data on saving behavior in Canada.’In International comparisons of household savings, ed. James Poterba (Chicago: University ofChicago Press)
Davies, James B. (1979) ‘On the size distribution of wealth in Canada.’ Review of Income andWealth 25, 237–259
23

(1981) ‘Uncertain lifetime, consumption, and dissaving in retirement.’ Journal of Political Econ-omy 89(3), 561–577
(1993) ‘The distribution of wealth in Canada.’ In Research in Economic Inequality Vol. 4, ed.Edward Wolff (Greenwich, CT: JAI Press)
Eymann, Angelika, and Axel Borsch-Supan (2002) ‘Household portfolios in Germany.’ In HouseholdPortfolios, ed. Luigi Guiso, Michael Haliassos, and Tullio Jappelli (Cambridge MA: MIT Press)
Feldstein, Martin (1974) ‘Social security, induced retirement and aggregate capital accumulation.’Journal of Political Economy 82(5), 905–926
Gollier, Christian (2002) ‘What does theory have to say about household portfolios?’ In HouseholdPortfolios, ed. Luigi Guiso, Michael Haliassos, and Tullio Jappelli (Cambridge MA: MIT Press)
Guiso, Luigi, and Tullio Jappelli (2002) ‘Household portfolios in Italy.’ In Household Portfolios, ed.Luigi Guiso, Michael Haliassos, and Tullio Jappelli (Cambridge MA: MIT Press)
Guiso, Luigi, Michael Haliassos, and Tullio Jappelli (2002) Household Portfolios (Cambridge MA:MIT Press)
Human Resources Development Canada (2000) ‘Income security program information card.’ Tech-nical Report, Forecasting, Information, and Results Measurement, Ottawa
Jappelli, Tullio, and Franco Modigliani (1998) ‘The age-saving profile and the life-cycle hypothesis.’Working Paper 9, Centre for Studies in Economics and Finance, University of Salerno
King, M. A., and L.-D. L. Dicks-Mireaux (1982) ‘Asset holdings and the life-cycle.’ EconomicJournal 92(366), 247–267
Kotlikoff, Laurence J., and Lawrence H. Summers (1981) ‘The role of intergenerational transfers inaggregate capital accumulation.’ Journal of Political Economy 89(4), 706–732
Lin, Xiaofen (2000) ‘Saving before and after retirement: A study of Canadian couples, 1969–1992.’In Independence and Economic Security, ed. Frank T. Denton, Deborah Fretz, and Byron G.Spencer (Vancouver and Toronto: UBC Press)
Lin, Zhengxi, Janice Yates, and Garnett Picot (1999) ‘Rising self-employment in the midst of highunemployment: An empirical analysis of recent developments in Canada.’ Analytical StudiesBranch Research Paper Series 133, Statistics Canada
Morissette, Rene, Xuelin Zhang, and Marie Drolet (2002) ‘The evolution of wealth inequality inCanada 1984-1999.’ Analytical Studies Branch Research Paper Series 187, Statistics Canada
Office of the Superintendent of Financial Institutions (2001) ‘18th actuarial report on the CanadaPension Plan.’ Technical Report, Office of the Chief Actuary, Ottawa
Pesando, James E., and Morley Gunderson (1988) ‘Retirement incentives contained in occupationalpension plans and their implications for the mandatory retirement debate.’ Canadian Journal ofEconomics 21(2), 244–264
24

Pesando, James E., Morley Gunderson, and Pauline Shum (1992) ‘Incentive and redistributiveeffects of private-sector union pension plans in Canada.’ Industrial Relations 31(1), 179–194
Poterba, James M., and Andrew A. Samwick (2001) ‘Portfolio allocations over the life cycle.’ InAging Issues in the United States and Japan, ed. Seiritsu Ogura, Toshiaki Tachibanaki, andDavid A. Wise (Chicago: University of Chicago Press)
(2002) ‘Taxation and household portfolio composition: US evidence from the 1980s and 1990s.’Journal of Public Economics 87(1), 5–38
Samuelson, Paul A. (1969) ‘Lifetime portfolio selection by dynamic stochastic planning.’ Review ofEconomics and Statistics 51(3), 239–246
Shorrocks, A. F. (1975) ‘The age-wealth relationship: A cross-section and cohort analysis.’ Reviewof Economics and Statistics 57(2), 155–163
Siddiq, Fazley K., and Charles M. Beach (1995) ‘Characterizing life-cycle wealth distributions usingstatistical inference and dominance criteria.’ Empirical Economics 20, 551–575
Statistics Canada (1989) ‘A guide to the financial flow and national balance sheet accounts.’ Cat-alogue Number 13-585E, Statistics Canada, Ottawa
(1999) ‘Survey of Financial Security questionnaire.’ Catalogue Number 8-5400-70.1, StatisticsCanada, Ottawa
(2001a) ‘The assets and debts of Canadians: An overview of the results of the Survey of FinancialSecurity.’ Catalogue Number 13-595-XIE, Statistics Canada, Ottawa
(2001b) ‘Survey of Financial Security methodology for estimating the value of employer pensionplan benefits.’ Catalogue Number 13F0026MIE - 01003, Statistics Canada, Ottawa
(2002) ‘Pension plans in Canada.’ Catalogue Number 74-401, Statistics Canada, Ottawa
(2003) ‘1999 survey of financial security public use microdata file user guide.’ Catalogue Number13F0026MIE2003002, Statistics Canada, Ottawa
Venti, Steven F., and David A. Wise (2001) ‘Aging and housing equity: Another look.’ WorkingPaper 8608, National Bureau of Economic Research
Zeldes, Stephen P. (1989) ‘Optimal consumption with stochastic income: Deviations from certaintyequivalence.’ Quarterly Journal of Economics 104(2), 275–298
25

Notes
Lead Footnote: This research is supported by a SSHRC standard research grant and by the National
Institute on Aging, through Grant number P01-AG05842 to the National Bureau of Economic
Research. I thank the NBER for hosting me while this paper was written, as well as John Burbidge,
Byron Spencer, and seminar participants at the Bank of Canada, Guelph, McMaster, and York for
helpful comments. Finally, thanks to Lee Grenon and the BC Interuniversity Research Data Centre
for help with the data, and to Alfred Kong for excellent research assistance. This paper represents
the views of the author and does not necessarily reflect the opinions of Statistics Canada.
1Borsch-Supan (2003) assembles recent evidence on six countries. Borsch-Supan and Lusardi
(2003) note (p. 22) that there is strikingly little evidence of dissaving at older ages.
2For example, markets must be complete, investors must have no non-tradeable assets (such as
human capital), and utility functions must be of the constant relative risk aversion class.
3See the country studies in Guiso et al. (2002), as well as Ameriks and Zeldes (2001) and
Poterba and Samwick (2001).
4The public use data is subjected to the addition of random ‘noise’, as well as being rounded and
subjected to top and bottom coding. The public use data set also groups the age variable, making
age profiles more coarse. The differences between the public use and master files are described in
Statistics Canada (2003).
5According to Statistics Canada (2001a), the exclusions from the sampling frame are residents of
the territories, those living on Indian reserves, representatives of foreign countries and their families,
26

members of the military living on bases, residents of penal institutions, members of religious and
communal colonies, and chronic care patients. In 1999, the survey universe included 98 per cent of
the population.
6When comparing 1999 data to earlier years, it is important to note that changes in family
formation may affect the measurement of wealth, since it is measured on a family basis. Because
of increased marital breakdown, the same assets are split across more families.
7Treating future public pension flows as ‘wealth’ goes back to Feldstein (1974), who introduced
the concept of social security wealth.
8Assigning individual retirement ages would detract from the transparency of the income security
wealth analysis and raise the possible endogeneity of the retirement decision to wealth. Age 62 was
chosen to match the age at which more males are out of the labour force than in it, as calculated
using the 1999 Survey of Labour and Income Dynamics. Alternative definitions of retirement lead
to average retirement ages in the 60-63 range. When the analysis in this paper is repeated using
other ages near 62, the inferences do not change.
9For example, for the value of the primary residence the respondent is asked “how much would
this property sell for today?” The questions for other assets are similar.
10The survey questionnaire asks for the pension registration number from the respondent’s T-4
tax form. By matching this number to administrative data on pensions maintained by Statistics
Canada, the provisions of the pension (such as the earnings base, the rate of accrual with years
of service, flat or indexed benefits) are obtained. See Statistics Canada (2001b) for details on the
methodology used.
27

11The National Balance Sheet Accounts are assembled using data on aggregated financial flows.
More detail on the construction of the National Balance Sheet Accounts is found in Statistics
Canada (1989). The Total Assets data are taken from CANSIM series V33462.
12Few households reported no assets in 1999 because household contents are included as assets.
With this category excluded under the SCF definition, more households show zero total assets.
13Since my sample includes non-workers, the proportion with a pension should be lower than in
the employer pension data.
14The questionnaire for the Survey of Financial Security suggests that such items as copyrights,
patents, and royalties should be categorized as other non-financial assets. These are perhaps not
well classified as durables, but these assets do not naturally fit better under other categories.
15The industry categories for which zero book value is most prevalent are for professional, man-
agement, education, and health services. It is least prevalent for agriculture.
16This figure also represents an estimate of the total public pension liability. An alternative
calculation of the public pension liability provides a ‘reality check’ for the 1.45 trillion dollar figure.
According to the Office of the Superintendent of Financial Institutions (2001), the liability for fu-
ture Canada Pension Plan payments at December 31, 2000 was $486.68 billion. Human Resources
Development Canada (2000) reports that Canada Pension Plan expenditures represented 39.29 per
cent of public pension expenditures in the September to December quarter of 2000. (The balance
of the public pension expenditures went to Quebec Pension Plan, Old Age Security, Guaranteed
Income Supplement, and Allowance payments.) If one assumes that Canada Pension Plan expendi-
tures remain a constant fraction of total public pension expenditures, then the $486.68 billion may
28

be scaled by 1/0.3929 to arrive at an estimate of the total public pension liability: $1.24 trillion.
Because Canada and Quebec Pension Plan payments grow with aggregate wages while the other
pensions are fixed to price increases, this ratio may not stay fixed. However, as a rough approx-
imation, these calculations contribute some confidence that the imputed income security wealth
variable is of a sensible magnitude.
17See Gollier (2002) for a discussion of the application of portfolio theory to the study of household
portfolios. Agents will hold a similar risky portfolio only if they have linear absolute risk tolerances
with the same slope parameter.
18For more on the growth of self-employment through the 1990s, see Lin et al. (1999).
19All macro statistics are taken from the CANSIM database.
20For the rest of the paper I refer to both married and common-law relationships as ‘married’
families.
21More recent evidence is found in Attanasio and Emmerson (2003).
22See Ameriks and Zeldes (2001) for a detailed discussion of the theoretical basis for age effects
in risk preferences.
23The cause of the higher accrual rate at older ages is the ‘final earnings’ used in many pension
benefit formulas. At older ages, an extra year of work contributes not only an extra year of service,
but also makes all previous years of service more valuable if benefits are determined as some function
of the best years of earnings. In contrast, if someone leaves a firm at a younger age, her ’best’ years
of earnings would not seem high relative to contemporary wages when the pension is actually paid,
29

especially if there is substantial inflation or wage growth. See Pesando and Gunderson (1988) for
more detail.
24Each year, at least a minimum amount must be withdrawn from the Registered Retirement
Income Fund. The minimum amount increases with age. For example, the minimum is 5.0 per cent
of fair market value for those age 70, and 10.33 per cent at age 85.
25Pooled regression analysis is made difficult by data constraints. The public-use version of the
1999 Survey of Financial Security reports age in groups.
26There are only a handful of negative business equity observations. Results including the nega-
tive observations using the inverse hyperbolic sine transformation are very similar.
27Studying net wealth rather than assets makes little difference to the sample of older families,
as debt is low.
30

Table 1: Descriptive Statistics: 1999 Survey of Financial Security
Unconditional Share of Proportion Conditional on PositiveMean Total Assets Positive Mean Std Dev 25th Median 75th
Total assets 286784 1.000 1.000 286891 610565 29169 165518 351324Total assets, SCF definition 212264 0.967 219495 547524 18000 124100 250000
Financial 34782 0.121 0.899 38672 202136 1000 4350 19800Accounts 5880 0.021 0.872 6746 19820 600 2000 6000Term deposits 7282 0.025 0.180 40400 87003 5000 13000 40000Mutual funds 6554 0.023 0.142 46188 96775 4000 13000 48000Stocks 10602 0.037 0.112 94892 458550 2000 10000 43000Fixed income 2330 0.008 0.147 15830 56121 1000 2750 10000Other financial assets 2134 0.007 0.069 31109 108971 1000 5000 20000
Pensions 49910 0.174 0.476 104817 145548 12391 49391 137069Pension from current employer 20217 0.070 0.321 63028 92690 5672 26763 79849Pension from previous employer 2096 0.007 0.052 40046 44773 10691 24045 51250Pension currently paying 27149 0.095 0.140 193648 188046 58302 134190 264728Foreign pension 156 0.001 0.002 77594 108515 3500 56000 100000Annuity 292 0.001 0.006 45979 64874 6000 19000 62000
Tax-preferred savings 34468 0.120 0.610 56498 115104 6000 20000 60000Registered Retirement Savings Plan 28080 0.098 0.549 51190 104346 5300 20000 51854Registered Home Ownership Saving Plan 57 0.000 0.003 20291 41329 1000 10000 20000Registered Education Savings Plan 409 0.001 0.058 7105 17793 1700 3500 6800Registered Retirement Income Fund 5329 0.019 0.066 81034 108723 16000 43000 100000Deferred Profit Sharing Plan 592 0.002 0.031 19408 57445 1500 6000 18300
Property 109614 0.382 0.636 172251 213185 85000 132000 200000Primary residence 90356 0.315 0.604 149662 146527 83000 125000 180000Other real estate 19258 0.067 0.165 116998 252302 26000 65000 130000
Durables 28980 0.101 1.000 28980 83829 6000 18000 36500Vehicles 10290 0.036 0.772 13329 17695 3450 9000 18000Contents 15298 0.053 1.000 15298 31043 1000 10000 20000Other Durables 3391 0.012 0.277 12239 132022 1500 4000 10000
Business Equity 29031 0.101 0.185 158164 759600 1 10000 85000
Debt 37499 0.680 55155 73336 6500 29000 84500Mortgages 29069 0.351 82844 74257 40000 69000 106000Student loans 1218 0.118 10361 10512 3800 7280 13500Credit card 1167 0.385 3033 4028 700 1800 4000Other debt 6046 0.421 14371 26207 3000 8200 17000
Net Worth 249285 0.941 265743 614396 31136 1E+05 3E+05
Income Security Wealth 117813 1.000 117813 64727 65609 103729 160971Assets + Income Security Wealth 404597 1.000 404697 632161 123362 279834 499957Net Worth + Income Security Wealth 367097 0.999 367567 621354 107493 226999 454933
All values reported in 1999 Canadian dollars. Sample weights used in calculations. Based on 15,933 observationsfrom the Survey of Financial Security. 31

Table 2: Descriptive Statistics: High and Low Asset Quartiles in the 1999 Survey of FinancialSecurity
Low quartile High quartileUncon- Share of Pro- Uncon- Share of Pro-ditional Total portion ditional Total portionMean Assets Positive Mean Assets Positive
Total assets 25455 1.000 0.999 726221 1.000 1.000Total assets, SCF definition 17956 0.905 549249 1.000
Financial 2400 0.094 0.793 107716 0.148 0.973Accounts 1414 0.056 0.776 12268 0.017 0.939Term deposits 472 0.019 0.048 20050 0.028 0.320Mutual funds 170 0.007 0.028 21064 0.029 0.301Stocks 65 0.003 0.018 40178 0.055 0.270Fixed income 123 0.005 0.041 7207 0.010 0.257Other financial assets 155 0.006 0.036 6949 0.010 0.113
Pensions 2467 0.097 0.162 120724 0.166 0.660Pension from current employer 1080 0.042 0.103 43964 0.061 0.431Pension from previous employer 337 0.013 0.022 3797 0.005 0.073Pension currently paying 1039 0.041 0.037 71533 0.099 0.226Foreign pension 1 0.000 0.000 518 0.001 0.005Annuity 11 0.000 0.001 911 0.001 0.015
Tax-preferred savings 1914 0.075 0.241 94599 0.130 0.864Registered Retirement Savings Plan 1572 0.062 0.212 76132 0.105 0.777Registered Home Ownership Saving Plan 1 0.000 0.001 151 0.000 0.004Registered Education Savings Plan 60 0.002 0.018 1068 0.001 0.106Registered Retirement Income Fund 255 0.010 0.016 15621 0.022 0.118Deferred Profit Sharing Plan 27 0.001 0.009 1625 0.002 0.050
Property 11294 0.444 0.178 238350 0.328 0.912Primary residence 9927 0.390 0.152 182266 0.251 0.877Other real estate 1367 0.054 0.037 56084 0.077 0.318
Durables 7349 0.289 1.000 58331 0.080 1.000Vehicles 2599 0.102 0.529 19329 0.027 0.914Contents 4280 0.168 1.000 29678 0.041 1.000Other Durables 470 0.018 0.159 9324 0.013 0.388
Business Equity 30 0.001 0.079 106502 0.147 0.319
Debt 13105 0.613 55850 0.682Mortgages 6605 0.099 44833 0.457Student loans 2552 0.191 547 0.063Credit card 1134 0.367 874 0.301Other debt 2813 0.326 9597 0.438
Net Worth 12350 0.771 670371 1.000
Income Security Wealth 99007 1.000 133609 1.000Assets + Income Security Wealth 124470 1.000 859830 1.000Net Worth + Income Security Wealth 111358 0.996 803980 1.000
All values reported in 1999 Canadian dollars. Sample weights used in calculations. Based on 15,933 observationsfrom the Survey of Financial Security.
32

Table 3: Descriptive Statistics: 1977 and 1984 Surveys of Consumer Finances
1977
Sur
vey
of C
onsu
mer
Fin
ance
s19
84 S
urve
y of
Con
sum
er F
inan
ces
Unc
on-
Sha
reP
rop-
Con
diti
nal o
n P
osit
ive
Unc
on-
Sha
reP
rop-
Con
diti
nal o
n P
osit
ive
diti
onal
of to
tal
orti
ondi
tion
alof
orti
onM
ean
Ass
ets
Pos
itiv
eM
ean
25th
Med
ian
75th
Std
Dev
Mea
nA
sset
sP
osit
ive
Mea
n25
thM
edia
n75
thS
td D
ev
Tot
al a
sset
s, S
CF
def
init
ion
1402
221.
000
0.98
314
2665
1361
196
688
1849
0221
8871
1337
161.
000
0.98
613
5676
1182
485
749
1707
1019
9413
Fin
anci
al23
188
0.16
50.
963
2408
914
3758
0421
219
6368
524
651
0.18
40.
970
2539
111
1155
8922
209
6434
2A
ccou
nts
1420
00.
101
0.87
616
208
1381
5166
1519
436
633
1397
30.
104
0.88
215
834
1088
4239
1471
337
243
Sto
cks
1724
0.01
20.
083
2074
611
7449
7315
056
5245
528
430.
021
0.13
021
806
920
3985
1532
668
898
Fix
ed In
com
e41
090.
029
0.25
416
166
1519
4511
1459
234
274
3728
0.02
80.
277
1345
615
3345
9813
947
2723
8O
ther
fin
anci
al a
sset
s31
540.
022
0.87
336
1583
193
553
3286
341
070.
031
0.88
964
7961
184
613
3622
0
Tax
-pre
ferr
ed s
avin
gs24
170.
017
0.16
714
511
2763
6906
1436
524
731
5602
0.04
20.
295
1900
530
6591
9623
295
2794
6R
RS
Ps
2212
0.01
60.
141
1564
931
0871
8316
575
2629
353
620.
040
0.27
319
613
3678
9196
2452
228
415
RH
OS
Ps
205
0.00
10.
039
5291
2763
4144
6354
3972
240
0.00
20.
044
5491
1533
3065
7663
5471
Pro
pert
y82
749
0.59
00.
618
1338
2071
549
1160
2516
5750
1095
8472
492
0.54
20.
597
1213
8763
603
9961
914
5596
1041
07P
rim
ary
resi
denc
e70
996
0.50
60.
595
1193
8169
063
1105
0015
1938
8047
261
496
0.46
00.
570
1078
3761
304
9195
613
1037
8393
9O
ther
rea
l est
ate
1175
30.
084
0.16
172
968
1657
541
438
8287
511
8482
1099
60.
082
0.17
562
680
1532
638
315
7509
788
711
Dur
able
s63
920.
046
0.72
688
0130
3969
0612
431
8052
8174
0.06
10.
769
1062
830
6576
6313
947
1162
9V
ehic
les
6392
0.04
60.
726
8801
3039
6906
1243
180
5281
740.
061
0.76
910
628
3065
7663
1394
711
629
Bus
ines
s E
quit
y25
476
0.18
20.
128
1993
1732
8624
1933
869
063
2486
2522
798
0.17
00.
136
1675
1315
326
6130
419
9237
2665
59
Deb
t22
234
--0.
651
3414
541
4416
630
5248
843
985
1824
7--
0.66
627
410
2299
1101
941
303
3899
3M
ortg
ages
1620
90.
321
5043
821
548
4143
871
825
4195
112
681
0.28
245
031
1823
838
315
6130
435
825
Oth
er d
ebt
6025
0.57
110
552
1343
5249
1215
521
378
5566
0.60
292
4892
038
3110
268
2094
6
Net
Wor
th11
7989
--0.
892
1331
6816
851
7596
916
7192
2178
3611
5469
--0.
909
1276
7014
541
6911
115
5941
1974
74
Inco
me
Sec
urit
y W
ealt
h85
058
--1.
000
8505
851
954
7320
311
0185
4707
610
3189
--1.
000
1031
8961
508
9104
113
3302
5743
4A
sset
s +
ISW
2252
801.
000
2252
8078
657
1828
5328
8623
2344
0723
6905
1.00
023
6945
8831
118
8934
3077
2222
4387
Net
wor
th +
ISW
2030
460.
998
2035
8670
618
1496
0026
3567
2281
6521
8658
0.99
921
8991
8075
716
0263
2862
9921
8992
All
val
ues
repo
rted
in 1
999
Can
adia
n do
llar
s. S
ampl
e w
eigh
ts u
sed
in c
alcu
lati
ons.
33
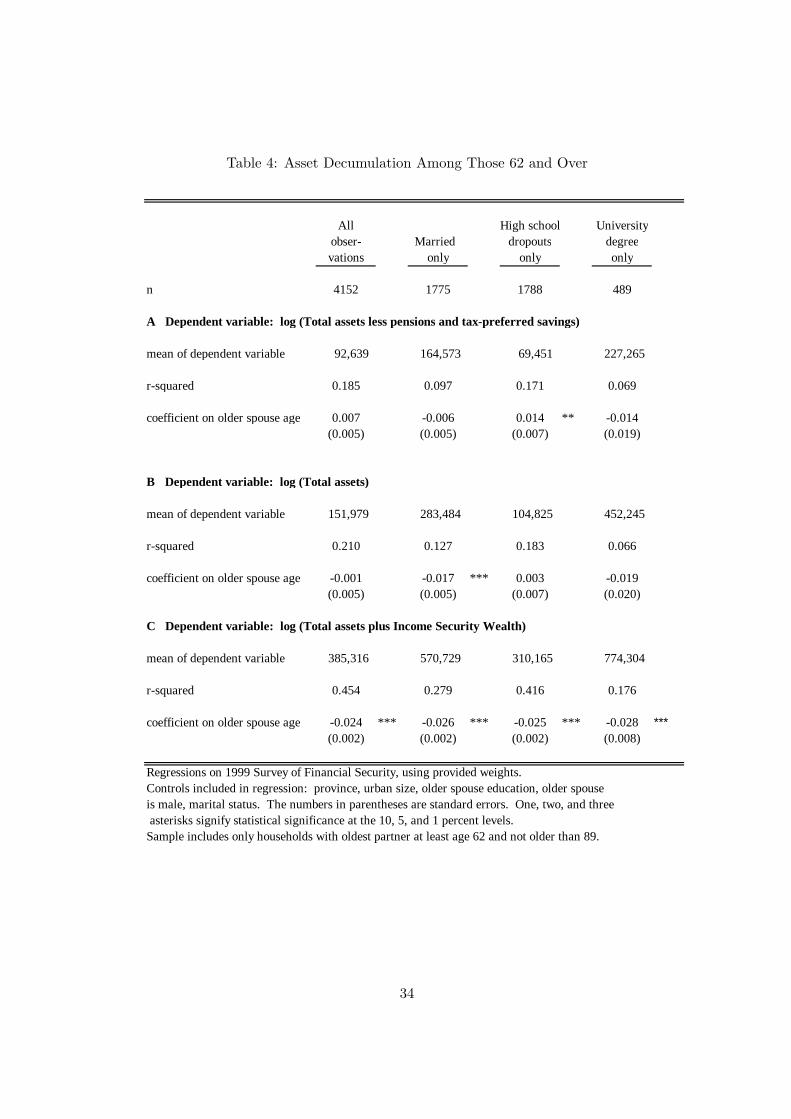
Table 4: Asset Decumulation Among Those 62 and Over
All High school Universityobser- Married dropouts degreevations only only only
n 4152 1775 1788 489
A Dependent variable: log (Total assets less pensions and tax-preferred savings)
mean of dependent variable 92,639 164,573 69,451 227,265
r-squared 0.185 0.097 0.171 0.069
coefficient on older spouse age 0.007 -0.006 0.014 ** -0.014(0.005) (0.005) (0.007) (0.019)
B Dependent variable: log (Total assets)
mean of dependent variable 151,979 283,484 104,825 452,245
r-squared 0.210 0.127 0.183 0.066
coefficient on older spouse age -0.001 -0.017 *** 0.003 -0.019(0.005) (0.005) (0.007) (0.020)
C Dependent variable: log (Total assets plus Income Security Wealth)
mean of dependent variable 385,316 570,729 310,165 774,304
r-squared 0.454 0.279 0.416 0.176
coefficient on older spouse age -0.024 *** -0.026 *** -0.025 *** -0.028 ***(0.002) (0.002) (0.002) (0.008)
Regressions on 1999 Survey of Financial Security, using provided weights.Controls included in regression: province, urban size, older spouse education, older spouseis male, marital status. The numbers in parentheses are standard errors. One, two, and three asterisks signify statistical significance at the 10, 5, and 1 percent levels.Sample includes only households with oldest partner at least age 62 and not older than 89.
34

Table 5: Asset Shares and Ownership Among Those 62 and Over
A Dependent variable: Shares in total assets
Financial asset share Property asset shareno asset with asset no asset with assetcontrol control control control
mean of dependent variable 0.175 0.175 0.336 0.336
r-squared 0.136 0.138 0.064 0.146
coefficient on log(Total assets) -- -0.006 * -- 0.054 ***(0.003) (0.003)
coefficient on older spouse age 0.008 *** 0.008 *** 0.000 0.001(0.001) (0.001) (0.001) (0.001)
B Dependent variable: Positive holding of assets
Stock ownership Fixed income ownershipno asset with asset no asset with assetcontrol control control control
mean of dependent variable 0.102 0.102 0.182 0.182
r-squared 0.053 0.117 0.036 0.088
coefficient on log(Total assets) -- 0.050 *** -- 0.057 ***(0.004) (0.004)
coefficient on older spouse age 0.000 0.000 0.005 *** 0.005 ***(0.001) (0.001) (0.001) (0.001)
Regressions on 1999 Survey of Financial Security, using provided weights.Sample includes households with older spouse at least 62 years old and no more than 89.Controls included in regression: province, urban size, older spouse education,older spouse is male, marital status. There are 4225 observations in each regression.The numbers in parentheses are standard errors. One, two, and three asterisks signify statistical significance at the 10, 5, and 1 percent levels.
35

Figure 1a: Total Assets 1999 - Accumulation
0
100,000
200,000
300,000
400,000
500,000
600,000
700,000
unde
r 22
25-2
7
31-3
3
37-3
9
43-4
5
49-5
1
55-5
7
61-6
3
67-6
9
73-7
5
79-8
1
85 p
lus
Age groups
1999
Can
adia
n do
llar
s
Mean25th pctMedian75th pct
Figure 1d: Shares at Age 25-27
Financial16%
Pension3%
Tax-Preferred9%
Property16%
Durables55%
Business1%
Figure 1b: Total Assets 1999 - Ownership
0.00
0.10
0.20
0.30
0.40
0.50
0.60
0.70
0.80
0.90
1.00
unde
r 22
25-2
7
31-3
3
37-3
9
43-4
5
49-5
1
55-5
7
61-6
3
67-6
9
73-7
5
79-8
1
85 p
lus
Age groups
Prop
orti
on w
ith
posi
tive
val
ue
FinancialPensionTax-preferredPropertyDurablesBusiness
Figure 1e: Shares at Age 55-57
Financial9%
Pension21%
Tax-Preferred12%
Property33%
Durables21%
Business4%
Figure 1c: Total Assets 1999 - Allocation
0.00
0.10
0.20
0.30
0.40
0.50
0.60
0.70
0.80
0.90
1.00
unde
r 22
25-2
7
31-3
3
37-3
9
43-4
5
49-5
1
55-5
7
61-6
3
67-6
9
73-7
5
79-8
1
85 p
lus
Age groups
Shar
e of
Tot
al A
sset
s
FinancialPensionTax-preferredPropertyDurablesBusiness
Figure 1f: Shares at Age 76-78
Financial20%
Pension20%
Tax-Preferred7%
Property36%
Durables16%
Business1%
36

Figure 2a: Total Assets (plus ISW) 1999 - Accumulation
0
100,000
200,000
300,000
400,000
500,000
600,000
700,000
800,000
900,000
unde
r 22
25-2
7
31-3
3
37-3
9
43-4
5
49-5
1
55-5
7
61-6
3
67-6
9
73-7
5
79-8
1
over
85
Age groups
1999
Can
adia
n do
llar
s
Mean25th pctMedian75th pct
Figure 5a: Total Assets 1977 - Accumulation
0
50,000
100,000
150,000
200,000
250,000
300,000
unde
r 22
25-2
7
31-3
3
37-3
9
43-4
5
49-5
1
55-5
7
61-6
3
67-6
9
73-7
5
Age groups
1999
Can
adia
n do
llar
s
Mean25th pctMedian75th pct
Figure 3a: Total Assets (SCF definition) 1999 - Accumulation
0
50,000
100,000
150,000
200,000
250,000
300,000
350,000
400,000
450,000
unde
r 22
25-2
7
31-3
3
37-3
9
43-4
5
49-5
1
55-5
7
61-6
3
67-6
9
73-7
5
79-8
1
85 p
lus
Age groups
1999
Can
adia
n do
llar
s
Mean25th pctMedian75th pct
Figure 5b: Total Assets 1977 - Ownership
0.00
0.10
0.20
0.30
0.40
0.50
0.60
0.70
0.80
0.90
1.00
unde
r 22
25-2
7
31-3
3
37-3
9
43-4
5
49-5
1
55-5
7
61-6
3
67-6
9
73-7
5
Age groups
Prop
orti
on w
ith
posi
tive
val
ue
FinancialTax-preferredPropertyDurablesBusiness
Figure 4a: Net Worth 1999 - Accumulation
-100,000
0
100,000
200,000
300,000
400,000
500,000
600,000
unde
r 22
25-2
7
31-3
3
37-3
9
43-4
5
49-5
1
55-5
7
61-6
3
67-6
9
73-7
5
79-8
1
85 p
lus
Age groups
1999
Can
adia
n do
llar
s
Mean25th pctMedian75th pct
Figure 5c: Total Assets 1977 - Allocation
0.00
0.10
0.20
0.30
0.40
0.50
0.60
0.70
0.80
0.90
1.00
unde
r 22
25-2
7
31-3
3
37-3
9
43-4
5
49-5
1
55-5
7
61-6
3
67-6
9
73-7
5
Age groups
Shar
e of
Tot
al A
sset
s
FinancialPensionsTax-preferredPropertyDurablesBusiness
37

Figure 6a: Total Assets 1984 - Accumulation
0
50,000
100,000
150,000
200,000
250,000
300,000
unde
r 22
25-2
7
31-3
3
37-3
9
43-4
5
49-5
1
55-5
7
61-6
3
67-6
9
73-7
5
79 p
lus
Age groups
1999
Can
adia
n do
llar
s
Mean25th pctMedian75th pct
Figure 6b: Total Assets 1984 - Ownership
0.00
0.10
0.20
0.30
0.40
0.50
0.60
0.70
0.80
0.90
1.00
unde
r 22
25-2
7
31-3
3
37-3
9
43-4
5
49-5
1
55-5
7
61-6
3
67-6
9
73-7
5
79 p
lus
Age groups
Prop
orti
on w
ith
posi
tive
val
ue
FinancialTax-preferredPropertyDurablesBusiness
Figure 6c: Total Assets 1984 - Allocation
0.00
0.10
0.20
0.30
0.40
0.50
0.60
0.70
0.80
0.90
1.00
unde
r 22
25-2
7
31-3
3
37-3
9
43-4
5
49-5
1
55-5
7
61-6
3
67-6
9
73-7
5
79 p
lus
Age groups
Shar
e of
Tot
al A
sset
s
FinancialPensionsTax-preferredPropertyDurablesBusiness
Figure 7: Total Assets by cohort from 1977, 1984 and 1999
010
0000
2000
0030
0000
1999
dol
lars
20 40 60 80Age
1906 19151924 19331942 1951
38

Figure 8a: Financial Assets 1999 - Accumulation
0
20,000
40,000
60,000
80,000
100,000
120,000
unde
r 22
25-2
7
31-3
3
37-3
9
43-4
5
49-5
1
55-5
7
61-6
3
67-6
9
73-7
5
79-8
1
85 p
lus
Age groups
1999
Can
adia
n do
llar
s
Mean25th pctMedian75th pct
Figure 9a: Pensions 1999 - Accumulation
0
20,000
40,000
60,000
80,000
100,000
120,000
140,000
160,000
180,000
200,000
unde
r 22
25-2
7
31-3
3
37-3
9
43-4
5
49-5
1
55-5
7
61-6
3
67-6
9
73-7
5
79-8
1
85 p
lus
Age groups
1999
Can
adia
n do
llar
s
Mean25th pctMedian75th pct
Figure 8b: Financial Assets 1999 - Ownership
0.00
0.05
0.10
0.15
0.20
0.25
0.30
0.35
0.40
0.45
unde
r 22
25-2
7
31-3
3
37-3
9
43-4
5
49-5
1
55-5
7
61-6
3
67-6
9
73-7
5
79-8
1
85 p
lus
Age groups
Pro
port
ion
wit
h po
siti
ve v
alue
Term depositsMutual fundsEquityFixed incomeOther financial assets
Figure 9b: Pensions 1999 - Ownership
0
0.1
0.2
0.3
0.4
0.5
0.6
unde
r 22
25-2
7
31-3
3
37-3
9
43-4
5
49-5
1
55-5
7
61-6
3
67-6
9
73-7
5
79-8
1
85 p
lus
Age groups
Prop
orti
on w
ith
posi
tive
val
ue
Current employerPast employerIn-payAnnuity
Figure 8c: Financial Assets 1999 - Allocation
0.00
0.05
0.10
0.15
0.20
0.25
0.30
0.35
unde
r 22
25-2
7
31-3
3
37-3
9
43-4
5
49-5
1
55-5
7
61-6
3
67-6
9
73-7
5
79-8
1
85 p
lus
Age groups
Shar
e of
Tot
al A
sset
s
Accounts
Term deposits
Mutual funds
Equity
Fixed income
Other financial assets
Figure 9c: Pension Assets 1999 - Allocation
0.00
0.05
0.10
0.15
0.20
0.25
unde
r 22
25-2
7
31-3
3
37-3
9
43-4
5
49-5
1
55-5
7
61-6
3
67-6
9
73-7
5
79-8
1
85 p
lus
Age groups
Shar
e of
Tot
al A
sset
s
Current employer
Past employer
In-pay
Foreign
Annuity
39

Figure 10a: Tax-preferred Savings 1999 - Accumulation
0
10,000
20,000
30,000
40,000
50,000
60,000
70,000
80,000
90,000
unde
r 22
25-2
7
31-3
3
37-3
9
43-4
5
49-5
1
55-5
7
61-6
3
67-6
9
73-7
5
79-8
1
85 p
lus
Age groups
1999
Can
adia
n do
llar
s
Mean25th pctMedian75th pct
Figure 11a: Property 1999 - Accumulation
0
50,000
100,000
150,000
200,000
250,000
unde
r 22
25-2
7
31-3
3
37-3
9
43-4
5
49-5
1
55-5
7
61-6
3
67-6
9
73-7
5
79-8
1
85 p
lus
Age groups
1999
Can
adia
n do
llar
s
25th pctMedian75th pctMean
Figure 10b: Tax-preferred Savings 1999 - Ownership
0
0.1
0.2
0.3
0.4
0.5
0.6
0.7
0.8
unde
r 22
25-2
7
31-3
3
37-3
9
43-4
5
49-5
1
55-5
7
61-6
3
67-6
9
73-7
5
79-8
1
85 p
lus
Age groups
Prop
orti
on w
ith
posi
tive
val
ue
Registered Retirement Savings PlanRegistered Education Savings PlanRegistered Retirement Income FundDeferred Profit Sharing Plan
Figure 11b: Property 1999 - Ownership
0
0.1
0.2
0.3
0.4
0.5
0.6
0.7
0.8
0.9
unde
r 22
25-2
7
31-3
3
37-3
9
43-4
5
49-5
1
55-5
7
61-6
3
67-6
9
73-7
5
79-8
1
85 p
lus
Age groups
Prop
orti
on w
ith
posi
tive
val
ue
Primary residenceOther real estate
Figure 10c: Tax-Preferred 1999 - Allocation
0.00
0.02
0.04
0.06
0.08
0.10
0.12
0.14
unde
r 22
25-2
7
31-3
3
37-3
9
43-4
5
49-5
1
55-5
7
61-6
3
67-6
9
73-7
5
79-8
1
85 p
lus
Age groups
Shar
e of
Tot
al A
sset
s
Registered Retirement Savings PlanRegistered Home Ownership Savings PlanRegistered Education Savings PlanRegistered Retirement Income FundDeferred Profit Sharing Plan
Figure 11c: Property 1999 - Allocation
0.00
0.05
0.10
0.15
0.20
0.25
0.30
0.35
0.40
0.45
unde
r 22
25-2
7
31-3
3
37-3
9
43-4
5
49-5
1
55-5
7
61-6
3
67-6
9
73-7
5
79-8
1
85 p
lus
Age groups
Shar
e of
Tot
al A
sset
s
Primary residenceOther real estate
40
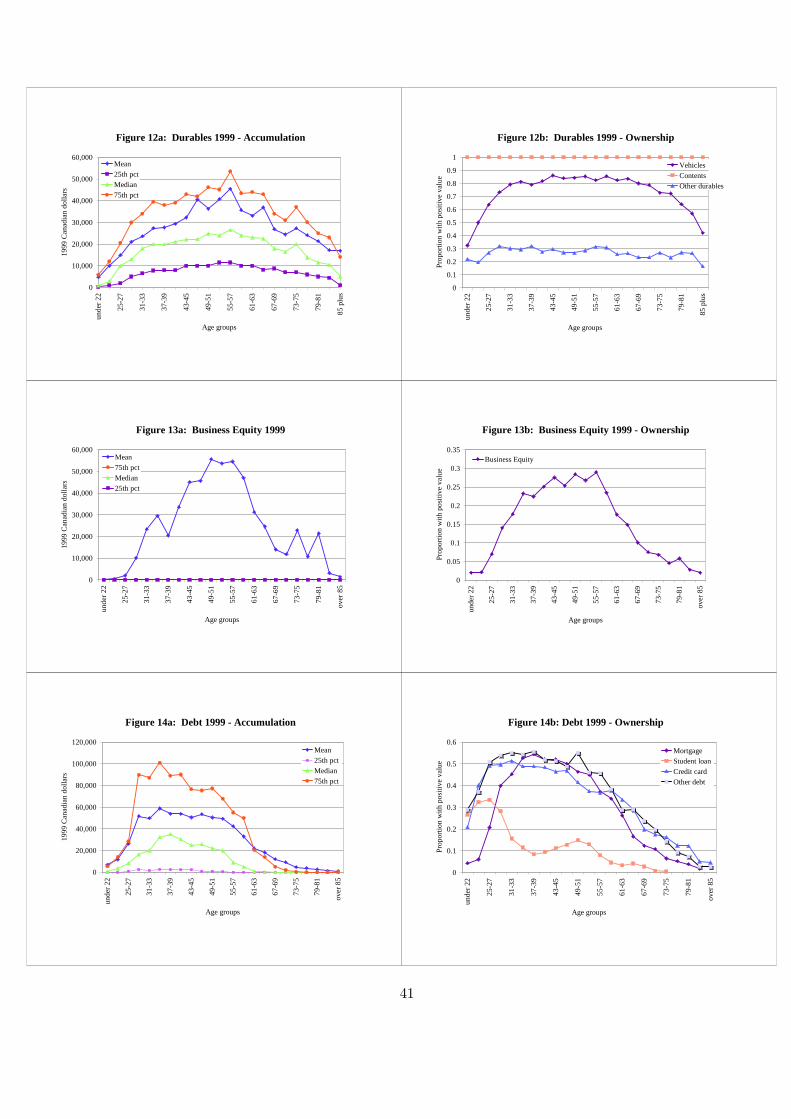
Figure 12a: Durables 1999 - Accumulation
0
10,000
20,000
30,000
40,000
50,000
60,000
unde
r 22
25-2
7
31-3
3
37-3
9
43-4
5
49-5
1
55-5
7
61-6
3
67-6
9
73-7
5
79-8
1
85 p
lus
Age groups
1999
Can
adia
n do
llar
s
Mean25th pctMedian75th pct
Figure 12b: Durables 1999 - Ownership
0
0.1
0.2
0.3
0.4
0.5
0.6
0.7
0.8
0.9
1
unde
r 22
25-2
7
31-3
3
37-3
9
43-4
5
49-5
1
55-5
7
61-6
3
67-6
9
73-7
5
79-8
1
85 p
lus
Age groups
Prop
orti
on w
ith
posi
tive
val
ue
VehiclesContentsOther durables
Figure 13a: Business Equity 1999
0
10,000
20,000
30,000
40,000
50,000
60,000
unde
r 22
25-2
7
31-3
3
37-3
9
43-4
5
49-5
1
55-5
7
61-6
3
67-6
9
73-7
5
79-8
1
over
85
Age groups
1999
Can
adia
n do
llar
s
Mean75th pctMedian25th pct
Figure 13b: Business Equity 1999 - Ownership
0
0.05
0.1
0.15
0.2
0.25
0.3
0.35
unde
r 22
25-2
7
31-3
3
37-3
9
43-4
5
49-5
1
55-5
7
61-6
3
67-6
9
73-7
5
79-8
1
over
85
Age groups
Prop
orti
on w
ith
posi
tive
val
ue
Business Equity
Figure 14a: Debt 1999 - Accumulation
0
20,000
40,000
60,000
80,000
100,000
120,000
unde
r 22
25-2
7
31-3
3
37-3
9
43-4
5
49-5
1
55-5
7
61-6
3
67-6
9
73-7
5
79-8
1
over
85
Age groups
1999
Can
adia
n do
llar
s
Mean25th pctMedian75th pct
Figure 14b: Debt 1999 - Ownership
0
0.1
0.2
0.3
0.4
0.5
0.6
unde
r 22
25-2
7
31-3
3
37-3
9
43-4
5
49-5
1
55-5
7
61-6
3
67-6
9
73-7
5
79-8
1
over
85
Age groups
Prop
orti
on w
ith
posi
tive
val
ue
MortgageStudent loanCredit cardOther debt
41