life cycle cost analysis - college of engineering - purdue ...ncaupg/activities/2003... · look at...
TRANSCRIPT

Life Cycle Cost Analysis
Ronald CollinsPavement Technology
a Division of Astec, Inc.

Life Cycle Cost Analysis
“LCCA is an analysis technique that builds on the well founded principles of economic analysis to evaluate the over-the-long-term economic efficiency between competing alternative investment options” - FHWA LCCA Technical Bulletin FHWA-SA-98-079

Life Cycle Cost Analysis
• Benefits of more expensive mixes may not readily be seen
• Must look at the mix in the long run, not just the up front dollar figure
• Life Cycle Cost Analysis (LCCA) can help look at the “long run”
• LCCA is probably one of the most under-utilized tools in our industry

Life Cycle Cost Analysis
• For example, SMA is normally a higher priced mix than standard mixes
• In some cases, if it lasts just slightly longer than the conventional mix, it will be worth it

Life Cycle Cost Analysis
Mix Type Average Bid CostSMA 47.00HV Mix 38.00
Mix Costs in Wisconsin
•Compare placing 2,000 tons of the HV Mix for resurfacing Vs. 2,000 tons of the SMA
•Total Cost of the HV Mix = $76,000
•Total Cost of the SMA Mix = $94,000
•Assume a discount rate of 3%
Life Cycle Cost Analysis
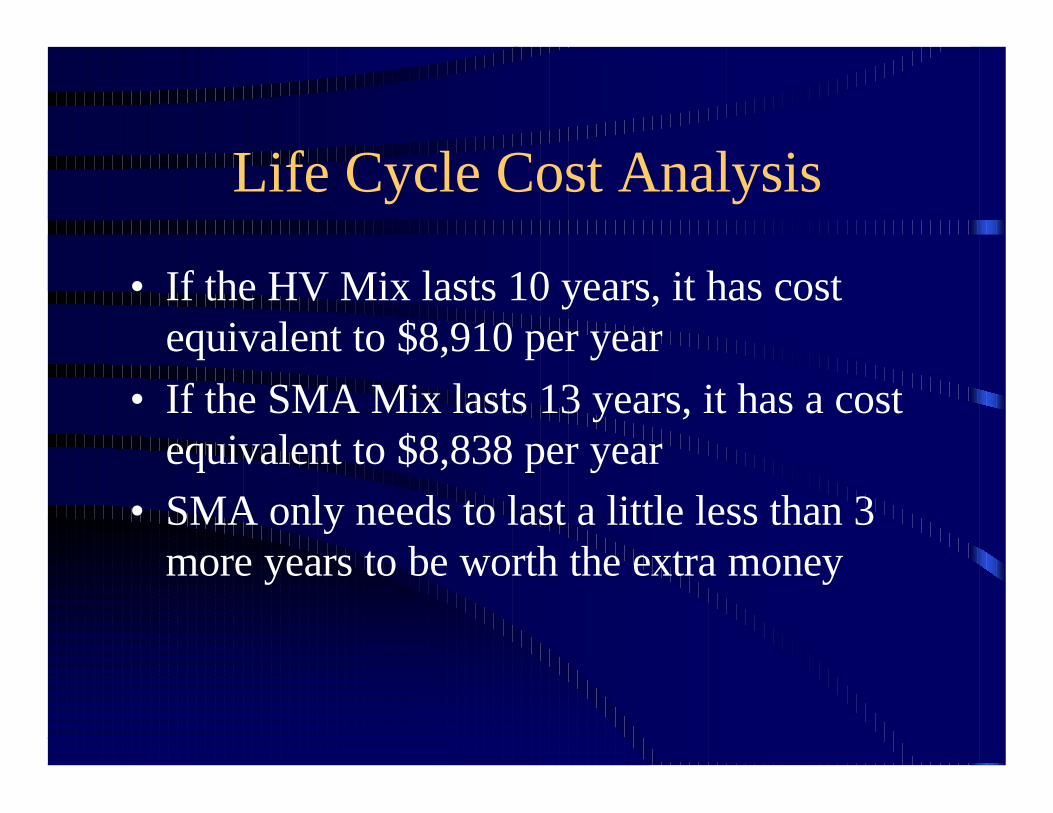
• If the HV Mix lasts 10 years, it has cost equivalent to $8,910 per year
• If the SMA Mix lasts 13 years, it has a cost equivalent to $8,838 per year
• SMA only needs to last a little less than 3 more years to be worth the extra money
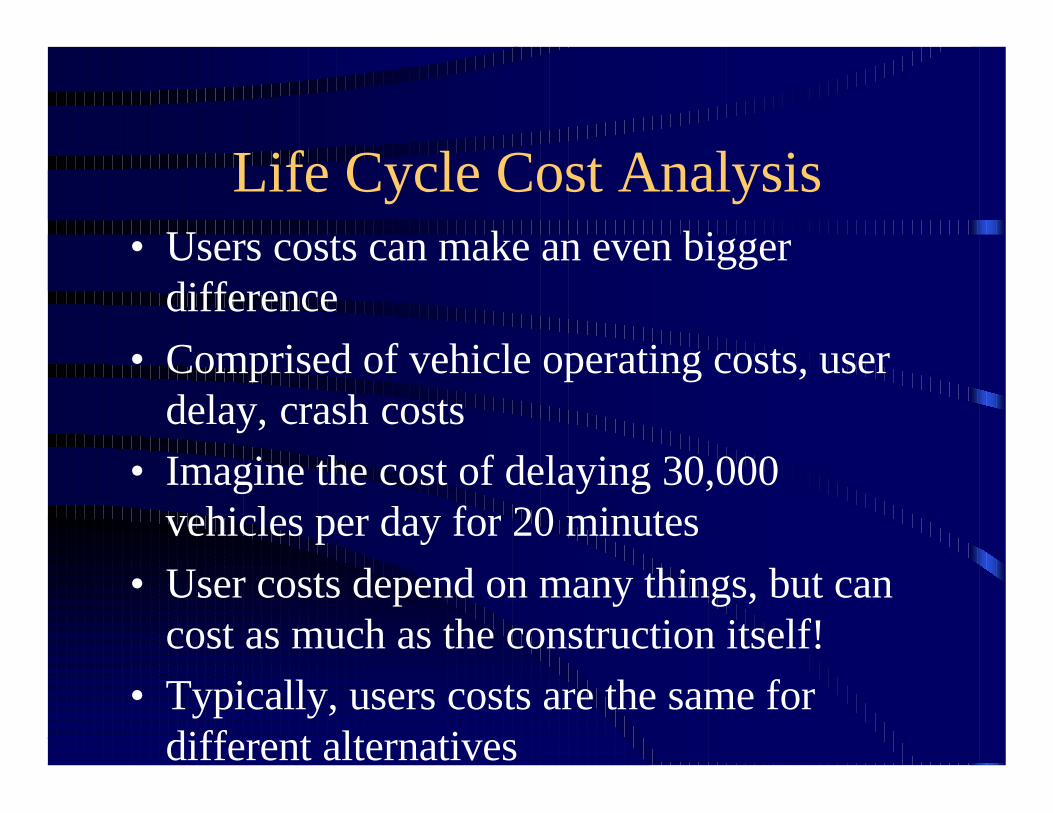
Life Cycle Cost Analysis• Users costs can make an even bigger
difference• Comprised of vehicle operating costs, user
delay, crash costs• Imagine the cost of delaying 30,000
vehicles per day for 20 minutes• User costs depend on many things, but can
cost as much as the construction itself!• Typically, users costs are the same for
different alternatives

Life Cycle Cost Analysis
Mix Type Average Bid CostSMA 47.00HV Mix 38.00
Mix Costs in Wisconsin with Users Costs
•Compare placing 2,000 tons of the HV Mix for resurfacing Vs. 2,000 tons of the SMA
•Assume Users Cost of $75,000 for construction
•Total Cost of the HV Mix = $76,000 + $75,000 = $151,000
•Total Cost of the SMA Mix = $94,000 + $75,000 = $169,000
•Assume a discount rate of 3%

Life Cycle Cost Analysis
• If the HV Mix lasts 10 years, it has cost equivalent to $17,702 per year
• If the SMA Mix lasts 11.5 years, it will have an equivalent annual cost
• SMA only needs to last about 1.5 more years to be worth the extra money
…with users costs taken into account

Life Cycle Cost Analysis
• LCCA can also be beneficial in analyzing the performance of your mixes
• Must ask the question: “If we can make a mix that will last longer, what will it be worth to us”
• Life cycle cost analysis as well as performance analysis can help

Life Cycle Cost Analysis
• Several states have begun performance testing all mix designs before placement
• Asphalt Pavement Analyzer (APA) is one tool that can be used


Life Cycle Cost Analysis
• Mixes designs can be tested before being placed on the road
• Poor performers are identified ahead of time– rejected or– redesigned to perform
better
100 lb Rubber Hose Inflated to 100 psi
HMA Specimen
Life Cycle Cost Analysis
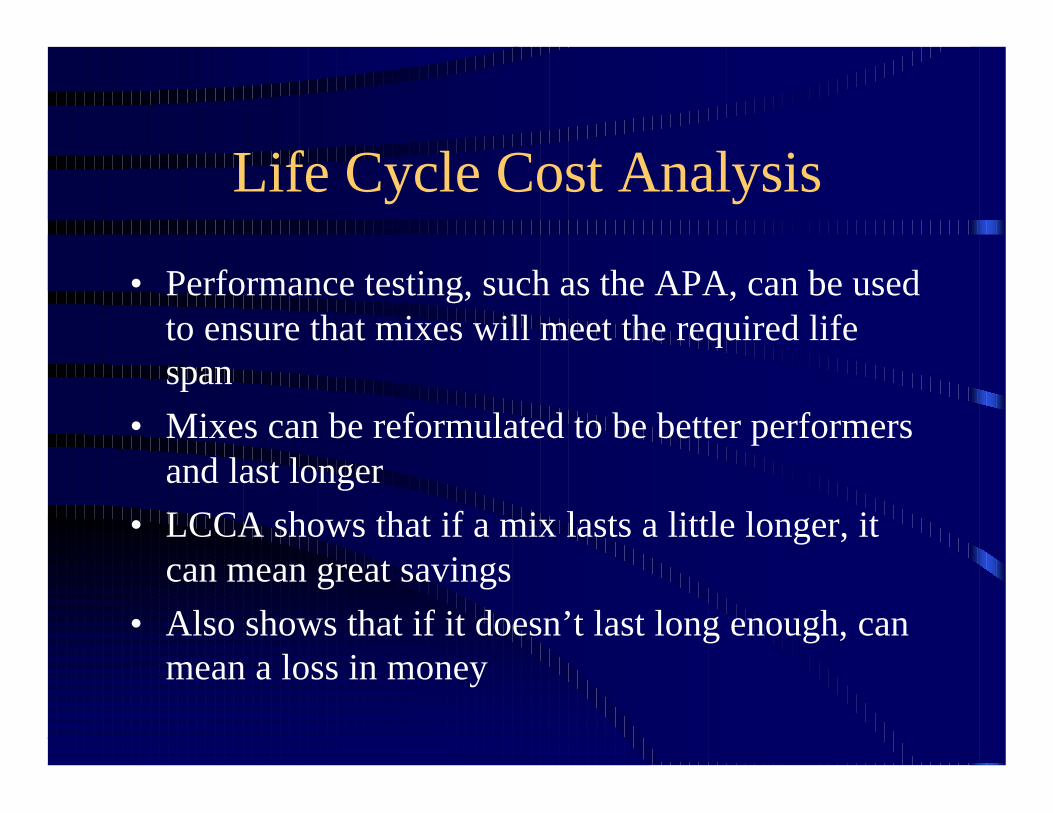
• Performance testing, such as the APA, can be used to ensure that mixes will meet the required life span
• Mixes can be reformulated to be better performers and last longer
• LCCA shows that if a mix lasts a little longer, it can mean great savings
• Also shows that if it doesn’t last long enough, can mean a loss in money

Life Cycle Cost AnalysisExample: Use Wisconsin HV Mix at $38 per ton
Will Place 2000 tons for a total of $76,000
What will the equivalent yearly cost of the mix be if it lasts 10 years?
…if it lasts 11 years?
…if it lasts 12 years?
-OR-
If it only lasts 7 or 8 years?

Life Cycle Cost Analysis
Number of Years Annualized Cost
% Difference from 10 Year
Cost7 $12,198 37%8 $10,827 22%9 $9,761 10%10 $8,910 0%
10.5 $8,545 -4%11 $8,214 -8%12 $7,635 -14%13 $7,146 -20%14 $6,728 -24%15 $6,366 -29%

Life Cycle Cost Analysis
• What is it worth to the an agency and the contracting industry to make a mix last 11 years instead of 10?– 8% reduction in cost– money that can be used somewhere else– more paving
• Performance testing your mixes prior to construction will pay off in the long run.

Life Cycle Cost Analysis
Added Years
% Decrease in Annual
CostTotal Dollars
Saved0.5 4% $3,600,000
1 8% $7,200,0002 14% $12,600,0003 20% $18,000,0004 24% $21,600,0005 29% $26,100,000
Assume your state places 3,000,000 tons of HMA per year at an average mix price of $30/ton ($90,000,000). If you can increasethe life of all mixes, what is it worth.

Life Cycle Cost Analysis
• Yearly budget of $90,000,000 for HMA• Adding 1 year of life will decrease costs by
8%• Savings of $7,200,000 per year• After 11 years, you will have saved
$92,216,129– equal to one year’s budget!

Life Cycle Cost Analysis
Added Years
% Decrease in Annual
CostTotal Dollars
Saved0.5 4% $6,000,000
1 8% $12,000,0002 14% $21,000,0003 20% $30,000,0004 24% $36,000,0005 29% $43,500,000
Assume your state places 5,000,000 tons of HMA per year at an average mix price of $30/ton ($150,000,000). If you can increase the life of your pavements, what is it worth.

Life Cycle Cost Analysis
• Yearly budget of $150,000,000 for HMA• Adding 1 year of life will decrease costs by
8%• Savings of $12,000,000 per year• After 11 years, you will have saved
$153,693,548– equal to one year’s budget!

Life Cycle Cost Analysis
• Will improving the mixes make them more expensive?– Not necessarily– May just mean changing mix proportions

Life Cycle Cost Analysis
$/ton Percentage Total Cost#78 Stone $13.35 40.00% $5.34
Sand $9.60 30.00% $2.88Screenings $9.00 30.00% $2.70
Binder $175.00 6.00% $10.50$21.42
$/ton Percentage Total Cost#78 Stone $13.35 70.00% $9.35
Sand $9.60 20.00% $1.92Screenings $9.00 10.00% $0.90
Binder $175.00 5.50% $9.63$21.79
Improved Mix
Conventional Mix

Life Cycle Cost Analysis• Significant changes to mixes may take
longer to realize a savings– polymers– fibers
• Georgia DOT performed LCCA in the early days of SMA to decide if it was worth the extra cost

SMA Annualized Costs are37% lower than Conventional Mix
SMA
Conventional$79,532
$50,095
Annualized Cost per Mile
Life Cycle Cost Analysis
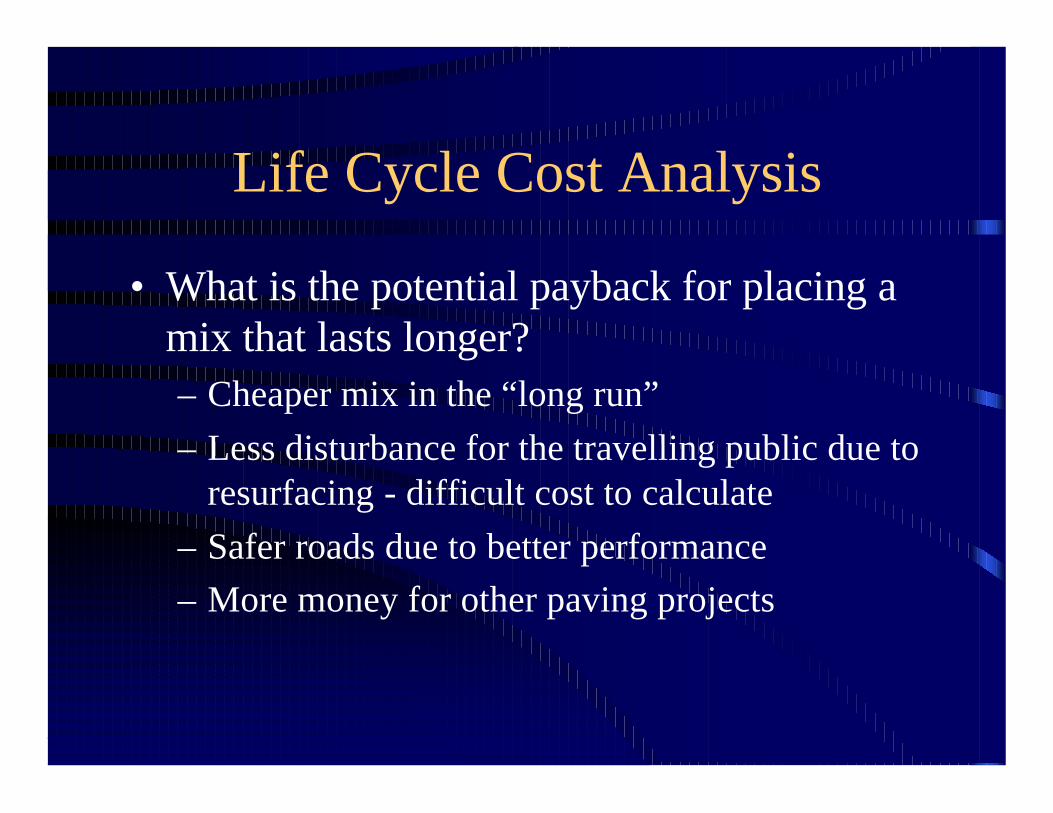
• What is the potential payback for placing a mix that lasts longer?– Cheaper mix in the “long run”– Less disturbance for the travelling public due to
resurfacing - difficult cost to calculate– Safer roads due to better performance– More money for other paving projects

Life Cycle Cost Analysis
• What is the cost of early failure?– Road requires repair earlier– Must spend budgeted money on unbudgeted
items– More roads deteriorate due to lack of funds– Increases user expenses