life cycle costs and carbon emissions of offshore wind … cycle costs and carbon emissions of...
TRANSCRIPT

Life Cycle Costs and Carbon Emissions of Offshore Wind Power
R Camilla Thomson, Gareth P Harrison, University of Edinburgh
June 2015
Summary
There is a significant diversity of views on the life cycle levelised costs and carbon emissions of energy
technologies, including offshore wind. ClimateXChange has commissioned a briefing paper to help Scottish policy
makers and other interested parties better understand these perspectives, the uncertainties associated with them,
and the differing underpinning assumptions. In particular, this review:
Identifies the varied academic and wider perspectives on the life cycle costs and emissions of offshore wind
technologies and associated infrastructure;
Synthesises the existing evidence and assumptions used to support these perspectives;
Identifies variations in the evidence and assumptions;
Identifies areas of consensus and any outliers.
1 Introduction
Energy policy is right at the top of the political agenda following concerns over the cost of living, recent price rises
by the main utilities and the cause of these price rises. There is very vocal argument about the impacts of ‘green
obligations’ and subsidies for renewable energy sources, particularly as wind energy production reaches record
levels in Scotland and across the United Kingdom. Additionally, reports of low generation margins and risks to
security of supply are adding to the mix.
Carbon emissions, affordable energy and security of supply are strands of the energy policy ‘trilemma’. The three
aspects are very heavily interdependent and, consequently, there is substantial scope for disagreement -
particularly where one aspect is focussed on exclusively. This makes rational policymaking challenging.
Understanding the economics of wind energy is vitally important to ensure a rational discussion about the role of
wind power within the energy mix. The challenge is that ‘cost’ means different things to different people, with
often conflicting views apparently supported by ‘evidence’. In part this is due to confusion about current and likely
future costs of generation, what might be included or excluded in estimates and the characteristics of wind
relative to other generation types. Additionally, there is conflation of ‘costs’, ‘prices’ within the power markets and
‘subsidies’.
Another key issue is the debate over whether offshore wind farms actually achieve a net carbon emissions saving
over their lifetime. The carbon emissions reduction of wind power cannot simply be estimated as equal to the
ClimateXChange is Scotland’s Centre of Expertise on Climate Change, supporting the Scottish Government’s policy
development on climate change mitigation, adaptation and the transition to a low carbon economy. The centre delivers
objective, independent, integrated and authoritative evidence in response to clearly specified policy questions.
www.climatexchange.org.uk

Life Cycle Costs and Carbon Emissions of Offshore Wind Power
2
carbon emissions of conventional coal- or gas-fired generation: firstly, wind power generation is not zero carbon,
as greenhouse gases are emitted during installation, maintenance and decommissioning; secondly, wind power
will not replace all forms of conventional generation equally, so the true carbon emissions displacement will
depend upon a combination of factors – including the types of power generation being replaced, any decrease in
efficiency of conventional plant operating at part load, and the impact of any increase in frequency of start-up and
shut-down of conventional plant. There may also be longer-term impacts associated with the installation of new
conventional plant to back up an increase in installed wind capacity. Many of the existing publications examining
the carbon emissions of offshore wind concentrate on either one or other of the above issues, with positive
reports often focussing on the relatively small life cycle emissions of wind power in comparison to fossil-fuelled
generation, and negative reports highlighting the uncertainty of calculating the true emissions displacement.
This briefing paper critically examines both of these issues in order to provide guidance on the most realistic
estimates of life cycle costs and carbon emissions savings for offshore wind power generation in Scotland and the
UK. The specific issues addressed in this review are:
Life Cycle Costs – The cost of producing energy from offshore wind compared to conventional sources.
Life Cycle Carbon Emissions – The overall carbon emissions associated with offshore wind over the life cycle of the
plant: examining the existing evidence of these life cycle emissions, and comparing them with other technologies.
System Costs and Emissions – The impact on life cycle cost and emissions of the technology required to
complement offshore wind power as a mainstream energy source, including the costs and emissions associated
with the installation and operation of conventional generation to cope with the variable output of wind power,
and an understanding of the emissions displacement of offshore wind for realistic estimates of emissions savings.
1.1 Glossary
This list is intended as a quick reference to clarify specific terms used in this paper.
Carbon emissions Greenhouse gas (GHG) emissions
Carbon footprint Life cycle carbon/greenhouse gas emissions
Carbon payback period The time for displaced emissions to equal the life cycle carbon emissions
Discount rate A value which determines the future value of costs in present value terms.
Displaced emissions A measure of the greenhouse gases not emitted from conventional generators due
to power from wind
Efficiency penalty The decrease in efficiency of conventional generators when operating at part load
Emissions intensity The greenhouse gas emissions per unit of output energy
External cost An impact that has economic value but is not captured by traditional financial cost
measures.
Lifetime emissions savings Net reduction in greenhouse gas emissions over the life time of the wind farm
Levelised cost of energy Measure of life cycle costs expressed per unit of electricity generated

Life Cycle Costs and Carbon Emissions of Offshore Wind Power
3
Marginal generation The type of power generation operating on the margin
System costs Costs associated with the operation and planning of the wider electricity system
1.2 Wind farm life cycle
Costs and carbon emissions arise during every stage of the life cycle of a wind farm, illustrated by Figure 1. The
elements of each of these stages considered in this report are further explained below.
Manufacturing of wind farm components
Transport and installation
Operation and maintenance
Dismantling and disposal
Figure 1 - Life cycle of a wind farm
Manufacturing of wind farm components
The first stage includes the extraction and production of raw materials, and the manufacture of wind farm
components. Figure 2 illustrates which components are typically included within the system boundary for
estimation of the costs and emissions of an offshore wind farm, with the principal components of the turbine itself
illustrated in Figure 3, and described in greater detail in Appendix 2. The wind turbine assembly varies little for
onshore or offshore installations, with the main difference being the tower height, typically 80 m offshore and 100
onshore (Vestas, 2006). Instead the principal differences between onshore and offshore farms are in the design of
the foundations, groundworks and transmission equipment.
Figure 2 - System boundary for an offshore wind farm (after (Vestas, 2006))
Wind turbine designs, however, do vary significantly from manufacturer to manufacturer, principally in size and
choice of materials - this will affect the cost and emissions of each design; for example, the precise design of
composite materials used in the nacelle and hub may vary, while cables, electrical equipment, hydraulic
equipment and foundations also use different quantities of materials depending upon the location and design of
the farm itself. Furthermore, different manufacturers in different locations may use different proportions of
recycled raw materials, which will also affect both the costs and emissions at this stage.
Transport and installation
The second life cycle stage is transport and installation. This includes the preparation of foundations for turbines
and offshore transformer stations, laying of cables, preparation of onshore access roads and ground works, as well
as transport, installation and commissioning of the wind turbines, offshore transformer, and cable transmission

Life Cycle Costs and Carbon Emissions of Offshore Wind Power
4
station. Costs and carbon emissions will arise from all of these processes, and there may also be an impact on
carbon emissions due to changes in the marine environment and seabed.
Figure 3 - Wind turbine (image edited from a photograph by Andy Dingley via Wikimedia Commons)
Operations and maintenance
Costs and carbon emissions that arise during the third life cycle stage of a wind farm are largely due to
maintenance activities, such as inspection visits (including transport of equipment and people to and from the
site), regular changes of oil and other lubricants, renewal of cathodic protection, maintenance of paintwork and
component renovation or replacement (including the impacts associated with the materials and manufacture of
these components, and associated disposal of any operational waste) (Vattenfall, 2013; Vestas, 2006). There are
some costs and emissions associated with the operation of wind turbines, due to energy consumption to operate
the yaw system, the brakes, and power up the generator (Guezuraga et al., 2012), but this is usually subtracted
from the estimated energy production and is, therefore, included only as a loss of earnings or reduction in total
output.
Dismantling and disposal
The final stage in the life cycle of a wind farm is decommissioning, which includes all dismantling, transport,
disposal and recycling (Vestas, 2006). There are costs and carbon emissions associated with all of these processes,
although recycling can also result in a carbon saving or financial revenue.

Life Cycle Costs and Carbon Emissions of Offshore Wind Power
5
Key Messages
There is confusion about current and likely future costs of generation, what might be included or
excluded in estimates and the characteristics of wind relative to other generation types.
There is conflation of ‘costs’, ‘prices’ within the power markets and ‘subsidies’.
The carbon emissions reduction of wind power is complex, as life cycle emissions of wind are non-zero
and true carbon emissions displacement will depend upon the operation of the whole grid
Variations in cost and carbon emissions estimates are affected by assumptions made in the calculation
itself and also differences in wind turbine designs, manufacturing and installation locations,
maintenance and disposal.
Life Cycle Costs and Carbon Emissions of Offshore Wind Power
6
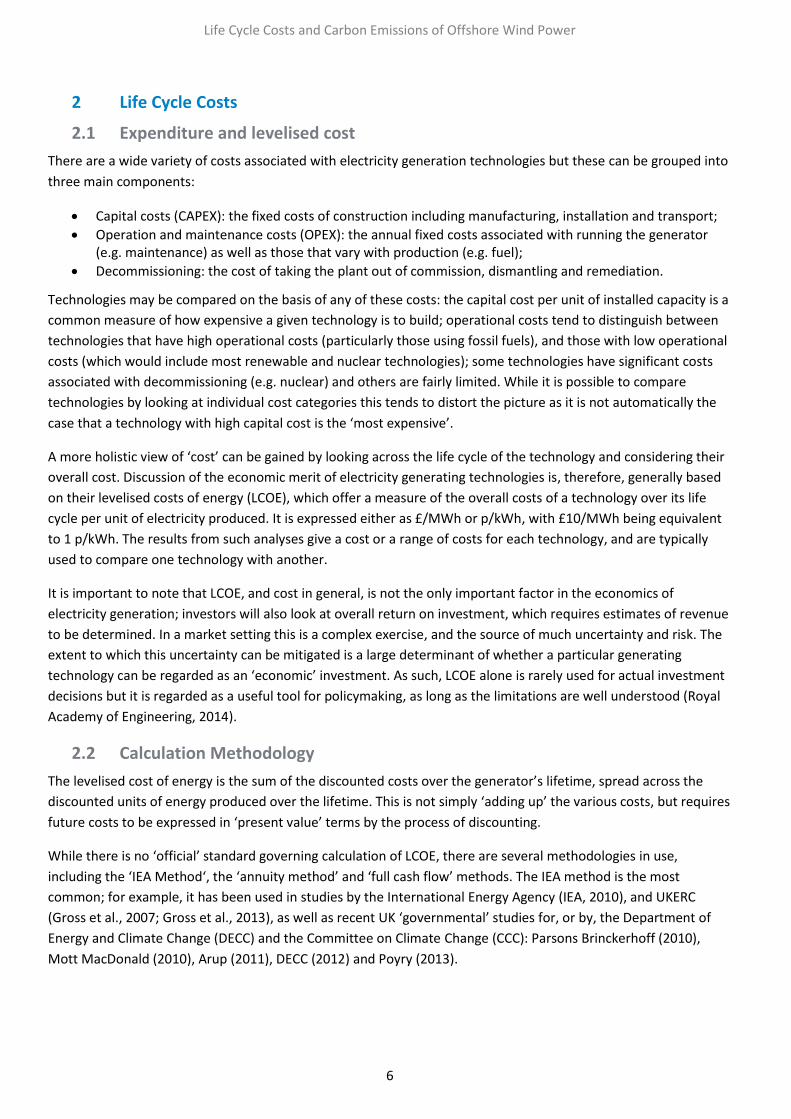
2 Life Cycle Costs
2.1 Expenditure and levelised cost
There are a wide variety of costs associated with electricity generation technologies but these can be grouped into
three main components:
Capital costs (CAPEX): the fixed costs of construction including manufacturing, installation and transport;
Operation and maintenance costs (OPEX): the annual fixed costs associated with running the generator (e.g. maintenance) as well as those that vary with production (e.g. fuel);
Decommissioning: the cost of taking the plant out of commission, dismantling and remediation.
Technologies may be compared on the basis of any of these costs: the capital cost per unit of installed capacity is a
common measure of how expensive a given technology is to build; operational costs tend to distinguish between
technologies that have high operational costs (particularly those using fossil fuels), and those with low operational
costs (which would include most renewable and nuclear technologies); some technologies have significant costs
associated with decommissioning (e.g. nuclear) and others are fairly limited. While it is possible to compare
technologies by looking at individual cost categories this tends to distort the picture as it is not automatically the
case that a technology with high capital cost is the ‘most expensive’.
A more holistic view of ‘cost’ can be gained by looking across the life cycle of the technology and considering their
overall cost. Discussion of the economic merit of electricity generating technologies is, therefore, generally based
on their levelised costs of energy (LCOE), which offer a measure of the overall costs of a technology over its life
cycle per unit of electricity produced. It is expressed either as £/MWh or p/kWh, with £10/MWh being equivalent
to 1 p/kWh. The results from such analyses give a cost or a range of costs for each technology, and are typically
used to compare one technology with another.
It is important to note that LCOE, and cost in general, is not the only important factor in the economics of
electricity generation; investors will also look at overall return on investment, which requires estimates of revenue
to be determined. In a market setting this is a complex exercise, and the source of much uncertainty and risk. The
extent to which this uncertainty can be mitigated is a large determinant of whether a particular generating
technology can be regarded as an ‘economic’ investment. As such, LCOE alone is rarely used for actual investment
decisions but it is regarded as a useful tool for policymaking, as long as the limitations are well understood (Royal
Academy of Engineering, 2014).
2.2 Calculation Methodology
The levelised cost of energy is the sum of the discounted costs over the generator’s lifetime, spread across the
discounted units of energy produced over the lifetime. This is not simply ‘adding up’ the various costs, but requires
future costs to be expressed in ‘present value’ terms by the process of discounting.
While there is no ‘official’ standard governing calculation of LCOE, there are several methodologies in use,
including the ‘IEA Method‘, the ‘annuity method’ and ‘full cash flow’ methods. The IEA method is the most
common; for example, it has been used in studies by the International Energy Agency (IEA, 2010), and UKERC
(Gross et al., 2007; Gross et al., 2013), as well as recent UK ‘governmental’ studies for, or by, the Department of
Energy and Climate Change (DECC) and the Committee on Climate Change (CCC): Parsons Brinckerhoff (2010),
Mott MacDonald (2010), Arup (2011), DECC (2012) and Poyry (2013).

Life Cycle Costs and Carbon Emissions of Offshore Wind Power
7
The LCOE is given by:
T
tt
t
T
tt
tttt
r
E
r
DFOC
)1(
)1(LCOE
where C is the capital cost (£); O is operations and maintenance (O&M) cost (£); F is fuel cost (£); D is the
decommissioning cost (£); E is the electricity produced (MWh); r is the discount rate (%); and t is the year in which
a cost occurs during the project lifetime T. For a wind farm, no fuel is burned to generate power, so fuel cost is
zero; however, indirect fuel use for transport is associated with many activities during the farm’s life.
Irrespective of which method is used, the calculation of LCOE requires a substantial number of factors to be
determined, which can be split into those that determine cost and those that determine energy production. Figure
4 shows the main information that is required to estimate the costs and energy production of a typical wind farm.
These reduce to three main factors: capital cost, operating cost and energy production, which can then be
considered along with the discount rate and other financial parameters.
Figure 4 - Cost of energy for a wind farm
As LCOE is applied to many different generating technologies with a wide range of intended applications, there is
substantial scope for variation introduced by different assumptions, methods and uncertainty. Figure 5 illustrates
the areas where variation can be introduced in estimates of LCOE. These can be divided into four categories:
variation in input data arising from the scenarios used, timing and locations, as well as uncertainty in the data
itself; uncertainties introduced by the financial assumptions, again arising from location such as tax rates and
treatment, prevailing financial treatments, whether pre-or post-tax rates are used, and adjustments for risk or
inflation; variations in the physical and temporal boundaries analysed, and whether specific cost categories are
included or not; and finally, differences in the methodology used, and intended scope.
Life Cycle Costs and Carbon Emissions of Offshore Wind Power
8
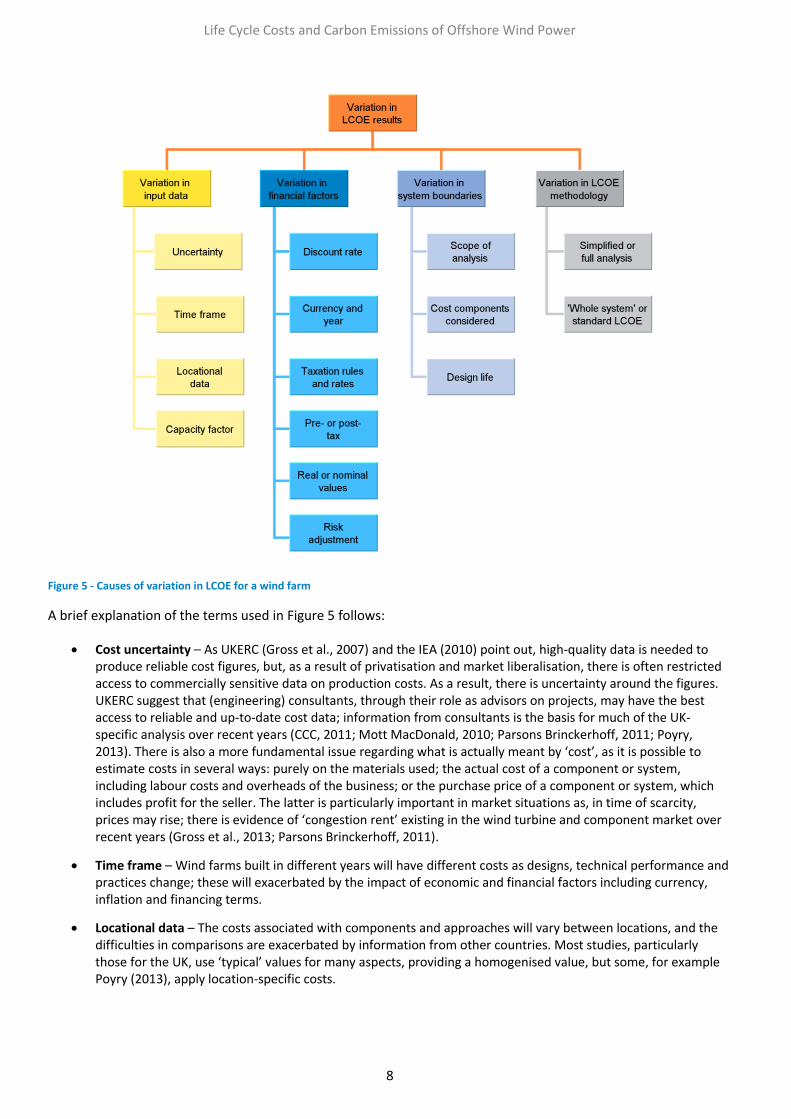
Figure 5 - Causes of variation in LCOE for a wind farm
A brief explanation of the terms used in Figure 5 follows:
Cost uncertainty – As UKERC (Gross et al., 2007) and the IEA (2010) point out, high-quality data is needed to produce reliable cost figures, but, as a result of privatisation and market liberalisation, there is often restricted access to commercially sensitive data on production costs. As a result, there is uncertainty around the figures. UKERC suggest that (engineering) consultants, through their role as advisors on projects, may have the best access to reliable and up-to-date cost data; information from consultants is the basis for much of the UK-specific analysis over recent years (CCC, 2011; Mott MacDonald, 2010; Parsons Brinckerhoff, 2011; Poyry, 2013). There is also a more fundamental issue regarding what is actually meant by ‘cost’, as it is possible to estimate costs in several ways: purely on the materials used; the actual cost of a component or system, including labour costs and overheads of the business; or the purchase price of a component or system, which includes profit for the seller. The latter is particularly important in market situations as, in time of scarcity, prices may rise; there is evidence of ‘congestion rent’ existing in the wind turbine and component market over recent years (Gross et al., 2013; Parsons Brinckerhoff, 2011).
Time frame – Wind farms built in different years will have different costs as designs, technical performance and practices change; these will exacerbated by the impact of economic and financial factors including currency, inflation and financing terms.
Locational data – The costs associated with components and approaches will vary between locations, and the difficulties in comparisons are exacerbated by information from other countries. Most studies, particularly those for the UK, use ‘typical’ values for many aspects, providing a homogenised value, but some, for example Poyry (2013), apply location-specific costs.

Life Cycle Costs and Carbon Emissions of Offshore Wind Power
9
Capacity factor (or load factor) – A measure of the energy production of a wind farm, defined as the proportion of energy generated over a period compared to maximum possible output. A great deal of emphasis has been placed on capacity factor as ‘evidence’ of wind farms being a poor choice; often this is as a result of it being mistaken for efficiency, or the amount of time that the wind farm operates for. The value depends on capacity and production, which means that although a large generator will produce more energy than a smaller one, it may not have a higher capacity factor. Capacity factor is, therefore, a major determinant of LCOE. It is the case that early Round 1 offshore turbines had poor reliability, initially, and, consequently, low capacity factor. Since then, reliability has improved significantly and the larger devices employed in Round 2 sites in locations with higher wind speeds have capacity factors that are much higher. DECC (2011a) report that UK offshore wind capacity factor in 2013 was almost 39%. This was a fairly average year for wind speeds and values have been lower in previous years (e.g. 25.9% in 2009). Variations are due to substantial inter-annual wind speed variation and the calculation which uses the median capacity during the year: the timing of new capacity additions can distort the picture either by raising or lowering the overall capacity factor. Interestingly, the offshore wind farms fully operational at the beginning of 2013 had a capacity factor of 37.5%, which suggests that additions in the year had higher capacity factors than the existing fleet despite the expectation of ‘teething troubles’. It appears that the more pessimistic estimates from some commentators, such as Gibson (2011), substantially underestimate capacity factors and lend credibility to the estimates by Mott MacDonald (2010), DECC (2012) and Crown Estate (2012) of 38-41% for Round 2 sites.
Discount rate – Discounting is central to the LCOE calculation and describes the time value of money where the value of cash sums declines over time due to inflation, expectations of real returns and, critically, the risk that future costs may turn out to be different than expected. The discount rate is normally taken to be the weighted average cost of capital, combining higher expected rates of return to equity and lower debt rates. The discount rate reduces future costs whilst leaving capital costs largely unchanged; this is important when comparing technologies with very different cost profiles. Studies use discount rates expressed as pre-tax or post-tax, as well as real or nominal rates; care must be taken in comparing studies as post-tax rates will be lower than pre-tax and nominal rates will be higher than real. In general, LCOE assessments use a single real pre-tax discount rate for all technologies, with recent UK and IEA LCOE studies using 10% as the real cost of capital for generation; however, recent analyses (Oxera, 2011) have differentiated on the basis of risk.
Risk adjustment – Using the same discount rate across technologies, or for technologies across time, effectively ignores differences in risk (Awerbuch and Yang, 2008). Oxera (2011) currently estimate well-established dispatchable technologies (gas, hydro) to have a pre-tax real discount rate of 6 to 9%, onshore wind at 7 to 10% and offshore wind at 10 to 14%. While these adjustments are effective in differentiating project risk they do not tackle a more fundamental issue with most LCOE analyses: while trends in fossil fuel costs are captured, the risk arising from cost volatility is not considered (Awerbuch and Yang, 2008).
Currency and year – When and where studies relate to has a bearing on the values that are quoted. In particular, there are substantial swings in currency values relative to Sterling which can create changes in relative costs; this is a particularly important factor in the wind sector where the main suppliers are based outside the UK. This, along with changes in inflation and commodity prices (e.g. steel), can have a big impact on costs. Studies such as UKERC (Gross et al., 2013) and Bolinger and Wiser (2012), that take a longitudinal view, do account for these relative movements.
Taxation rules and rates – Most LCOE studies apply the IEA method in which such factors do not appear directly, although their impact arises indirectly in terms of expected pre-tax discount rates, which would be higher than post-tax rates. Studies using the full cash low models explicitly account for these factors.
Scope of analysis – Different studies set different physical system boundaries for analysis: a single turbine, a farm including other infrastructure such as grid connection, or inclusion of ‘knock on effects’ elsewhere in the system – this is considered in detail in Section 3.
Cost components considered – Credible analysis of LCOE requires information on all cost components; as a minimum these need to include capital costs and operating costs. There are also costs associated with project development, which are detailed in most work, and decommissioning costs, which tend to be more uncertain so it has been practice to assume these to be equal to the scrap value of the assets (Royal Academy of Engineering, 2014). Nuclear differs with high decommissioning costs and uncertainty; although, discounting over many

Life Cycle Costs and Carbon Emissions of Offshore Wind Power
10
decades means that, at project evaluation, decommissioning costs are virtually negligible at realistic discount rates (IEA, 2010). The inclusion of ‘interest during construction’ (IDC) varies between studies and particularly affects projects that have long construction periods where there are borrowings but no production. Effective assessment of this requires knowledge of the construction schedule and the financing; IEA (2010), Gibson (2011) and Crown Estate (2012) all estimate the IDC. Most use an ‘overnight’ cost that includes pre-construction work, construction and contingency (Mott MacDonald, 2010).
Design life – Typically a wind farm is considered to have a design life of 20 years, although there is variation in assumptions. A shorter design life will tend to raise LCOE and vice versa. The actual life time of the wind farm varies, normally determined by economic decisions around whether or not to ‘re-power’ the farm (where turbines are replaced with modern, larger turbines).
Full versus simplified analysis – LCOE analyses using the IEA Method are simplified versions of assessments based on full cash flow models that explicitly consider a project from the investor (or equity) point of view and allow a more realistic evaluation of all costs applicable within specific jurisdictions. It is explicit about financing arrangements (debt/equity ratio and returns), loan periods, tax rates and depreciation. It takes the form (Schwabe, 2011):
T
tt
e
t
T
tt
e
ttttt
r
TaxE
r
DepIntTaxDFOTaxCe
1
1
)1(
)1(
)1(
)()()1(
LCOE
where e is the proportion of the project funded by equity; re is the return on equity; Tax is the tax rate; Int is the interest paid on the loan and Dep is depreciation. This makes explicit assumptions about accounting rules in different jurisdictions, which are complex and varied and which affect the timing and amounts of cash flows (Schwabe, 2011).
‘Whole system’ or standard LCOE – There are many views on what the ‘true’ cost of wind power is and what additional costs can be attributed to it. Many of these additional costs are associated with the impacts of wind power on the operation and makeup of the electricity system, and include transmission upgrades, system balancing and provision of backup. Most studies do not consider these costs, but a few do, including PB Power (2004), Gibson (2011) and Civitas (Lea, 2012).These issues are examined in more detail in Section 3.There are also other non-financial costs not captured by LCOE; these ‘external’ costs tend to be environmental and health impacts which, while challenging to quantify, show that fossil fuelled generation has relatively high external costs, while those for wind are very low. It is notable that carbon costs are also now being routinely included in LCOE analyses (CCC, 2011; IEA, 2010; Parsons Brinckerhoff, 2011), although remain absent in others (Gibson, 2011). IEA (2010) justifies their inclusion due to the existence of mature carbon policies such as the EU Emissions Trading Scheme, which associates real financial costs with carbon pricing.
2.3 Current Cost Estimates
In recent years there have been a series of studies providing estimates of costs for offshore wind and comparator
technologies. These include UK-specific work for, and by, DECC, the CCC and Crown Estate (Arup, 2011; Crown
Estate, 2012; DECC, 2012; Mott MacDonald, 2010; Mott MacDonald, 2011; Poyry, 2013), as well as a range of work
by international and overseas bodies. There has been only a modest amount of peer reviewed academic work
published alongside this, some by pressure groups and individuals; of note are the longitudinal investigations into
the variations in levelised costs over time including those by UKERC (Gross et al., 2013), the IEA Wind Task 26
(Lantz et al., 2012) and the Berkeley Laboratory (Wiser, 2012), which have been valuable in indicating the basis for
wind cost variation over recent years. Given the reported variations in costs, only relatively recent studies have
been included here.

Life Cycle Costs and Carbon Emissions of Offshore Wind Power
11
Compared to onshore wind, offshore wind is at an early stage of deployment, with little over a decade since the
first commercial installation in Denmark. The stage of development for UK projects is fairly well captured by the
Crown Estate leasing rounds: ‘Round’ 1, Round 2 and Round 3. A further leasing round was specifically for sites in
Scotland, referred to as ‘Scottish Exclusivity’ sites have similar characteristics to Round 2. Round 1 were
demonstration projects that were quite close to shore in shallow waters and with relatively modest overall
capacity using turbines that were generally ‘marinised’ onshore turbines. Round 2 projects are located further
offshore in medium water depths constructed with generally larger turbines in large arrays of many hundreds of
megawatts. Round 3 projects will be constructed from 2015 onwards using very large turbines connected in
gigawatt-scale farms and located in deeper water far offshore. These trends, and the rapid pace of development,
mean that costs increase from Rounds 1 to 3. Key features of the rounds are shown in Table 1.
Round Status Distance to shore (km)
Water depth (m)
Turbine capacity (MW)
Farm capacity (MW)
Round 1 Built < 10 15 2-3 60 - 90
Round 2/Scottish Exclusivity Completing < 30 30 3-6 150 - 500
Round 3 Construction 2015+ 50 – 150 30 – 60 5-10 1000 – 9000
Table 1 - Characteristics of UK offshore wind farms
The methods employed in estimating costs are varied: parametric cost models (Tegen, 2013); project
development, survey or reverse engineered (Mott MacDonald, 2011); anonymised price reporting (Milborrow,
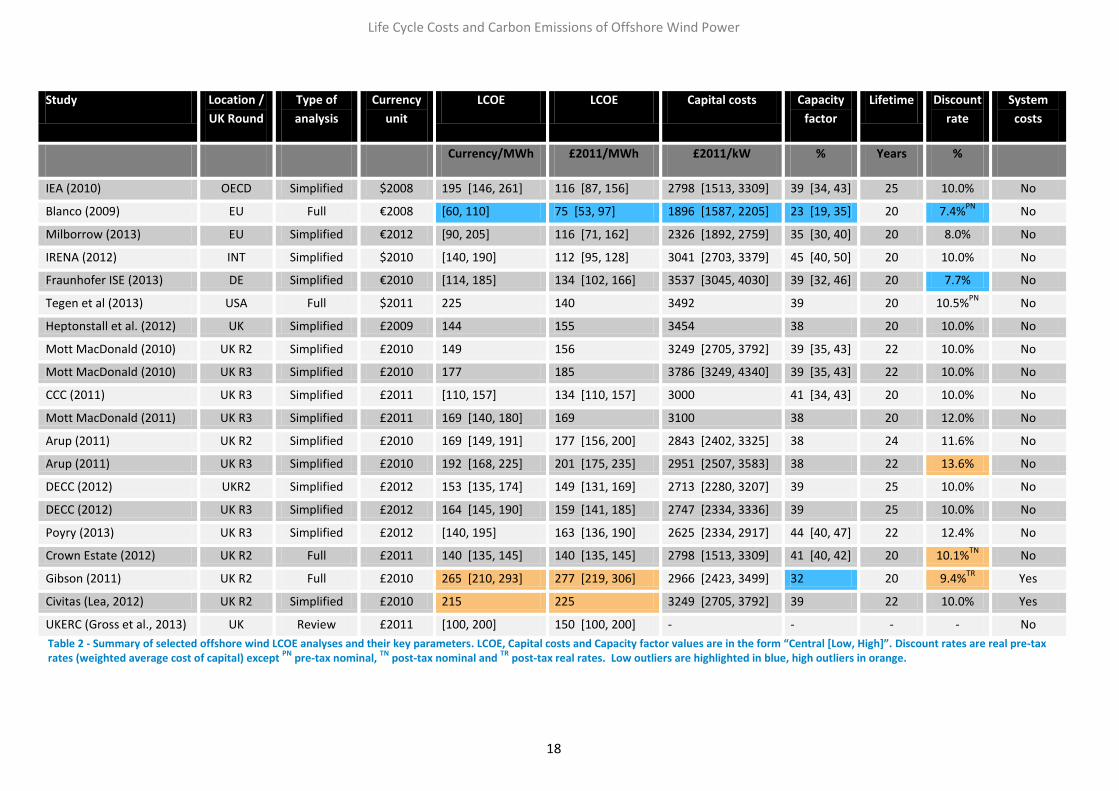
2013), or re-engineered from other sources (Giberson, 2013; Gibson, 2011). A summary of the LCOE studies
analysed is shown in Table 2, where the LCOE is given in its original currency values along with costs corrected to
2011 pounds sterling (indicated by ‘£2011’).
Treatment of uncertainty varies between studies: none; simple percentage ranges; scenarios for specific
parameters based around a central value with high and low values (CCC, 2011); reporting full ranges of parameter
sensitivities (Tegen, 2013); ‘probabilistic’ estimates using subjective weighting for key parameters (Gibson, 2011);
or location-specific parameter values allowing differentiation between capacity factor, costs and ultimately LCOE
(Poyry, 2013).
Capital cost
For offshore wind, capital cost is the dominant determinant of LCOE. It typically accounts for 60 to 80% of overall
life cycle costs and is either expressed in terms of cost per unit capacity of wind farm (£/kW), as a total cost, or as a
component of the levelised cost (£/MWh). Most of the studies reviewed provided capital costs explicitly.
The capital cost is itself broken down by a series of major cost items relating to the development of the project,
purchase of equipment, transportation, site preparation and installation. Figure 6 shows an example for an early
UK Round 3 offshore wind farm (Mott MacDonald, 2011). This, and most other studies, gives figures on a ‘farm’
basis, and includes the costs of connecting the farm to the grid but excludes interest during construction. The most
significant part of the capital cost is the turbine itself, which accounts for around 45%, although the proportion is
lower than for onshore turbines due as a result of the other significant costs elsewhere in the offshore wind farm.
In most offshore wind farms the cost of turbine foundations is the next most expensive item. The electrical costs
are also high as a result installing offshore intra-array cables, the need for offshore substations on larger farms,
and the connection to shore. Many studies include the cost of the cable connection to shore within the capital
costs (CCC, 2011; Gibson, 2011; Heptonstall et al., 2012; Lea, 2012; Mott MacDonald, 2010; Mott MacDonald,
2011); however, reflecting the recent developments in the offshore transmission network regulation regime, other

Life Cycle Costs and Carbon Emissions of Offshore Wind Power
12
studies (Arup, 2011; Crown Estate, 2012; DECC, 2012) instead include specific annual payments to an Offshore
Transmission Operator (OFTO) in the Operations and Maintenance costs. This introduces some additional variation
between costs and will also impact on overall LCOE, as regulated rates of return for OFTOs differ from the farm as
a whole. This also has the effect of reducing the apparent capital cost contribution to LCOE to around 60% (Crown
Estate, 2012).
A major source of variation is captured by the development stage referred to in the UK by the ‘Round’, as defined
by the sequence in which offshore sites were leased by the Crown Estate. Later development stages sees capital
costs tending to rise, with larger individual turbines and foundations (driven in part by the need for specialist
installation vessels able to handle the weight and size), larger farms, deeper water and a greater distance to shore.
The country and currency also play a significant role. The capital costs generally include other costs such as
development, insurance and contingency, which are typically higher in percentage and absolute terms than
onshore wind.
The nature of offshore wind farms is such that, above and beyond the cost of the equipment itself, the cost of
installation is more substantial than for onshore farms. Crown Estate (2012) suggest that installation of a 4MW
turbine currently costs around £600,000 per turbine, with 61% associated with installing the foundation, 22% the
cabling within the array, and only 17% for installing the turbine itself. This accounts for around 20% of the capital
cost, excluding the grid connection costs. The cost of vessels is a very substantial component of this cost.
Figure 6 - Typical breakdown of capital cost for large offshore wind farm (Mott MacDonald, 2011)
Materials costs are a determinant of capital costs, and changes in commodity prices (particularly steel and copper)
contribute to price variations. Perhaps surprisingly, materials costs for offshore wind farms contribute a modest
5%, while labour costs associated with manufacture, site or project management represent the largest part of the
capital cost (Mott MacDonald, 2011). This is particularly true of the carbon and glass fibre manufacturing process
of turbine rotors, which remains largely manual. Additionally, the extent of the component supply chain,
competition and the impacts of scarcity and supplier’s contingency costs contribute to variations in capital costs;
this is particularly apparent in offshore wind where a limited numbers of turbine and cable suppliers are in the
market.
The price of turbines has fluctuated substantially over the last ten years, as Bolinger and Wiser (2012), Lantz et al
(2012) and UKERC (Gross et al., 2013) show. Crown Estate (2012) suggest that these variations have stabilised
Life Cycle Costs and Carbon Emissions of Offshore Wind Power
13
somewhat, and, among the studies that report separate capital costs for offshore wind turbines, there is evidence
to support this, with costs of around £1300 to 1400/kW (Crown Estate, 2012; IRENA, 2012; Mott MacDonald,
2011). There is a tendency for larger offshore wind turbines to have lower prices per unit capacity than smaller
ones (Crown Estate, 2012) although these are undoubtedly more expensive than onshore designs at present.
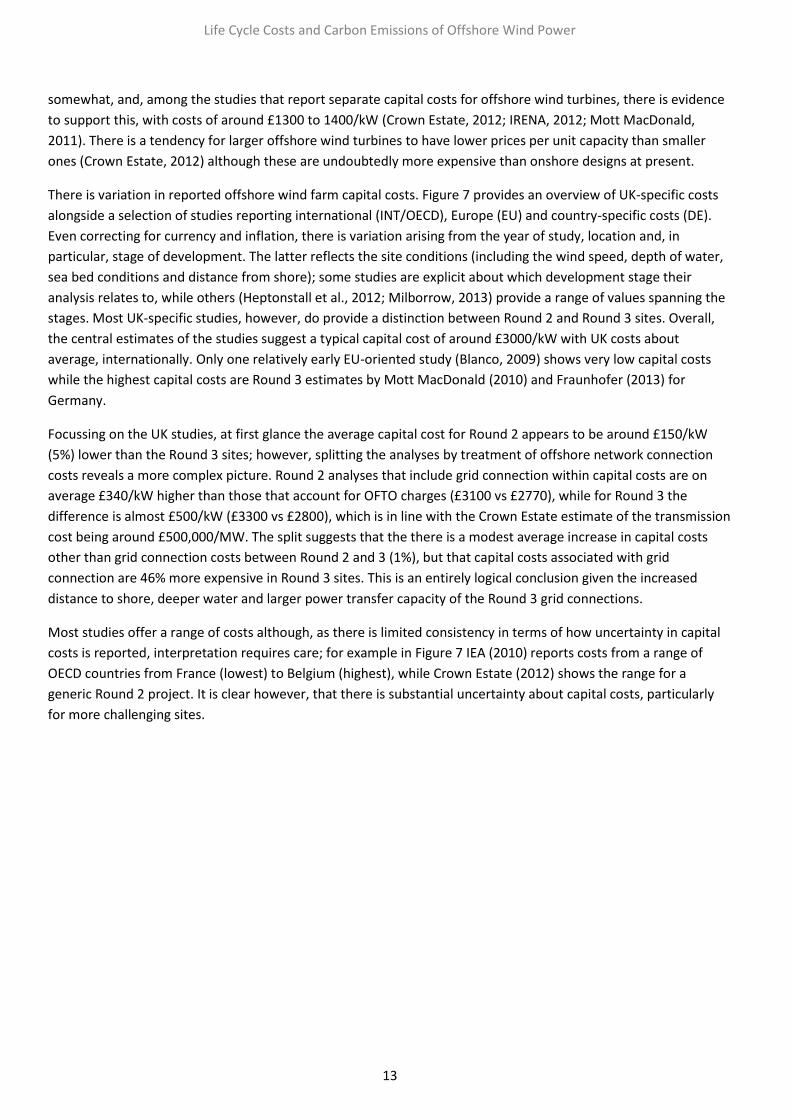
There is variation in reported offshore wind farm capital costs. Figure 7 provides an overview of UK-specific costs
alongside a selection of studies reporting international (INT/OECD), Europe (EU) and country-specific costs (DE).
Even correcting for currency and inflation, there is variation arising from the year of study, location and, in
particular, stage of development. The latter reflects the site conditions (including the wind speed, depth of water,
sea bed conditions and distance from shore); some studies are explicit about which development stage their
analysis relates to, while others (Heptonstall et al., 2012; Milborrow, 2013) provide a range of values spanning the
stages. Most UK-specific studies, however, do provide a distinction between Round 2 and Round 3 sites. Overall,
the central estimates of the studies suggest a typical capital cost of around £3000/kW with UK costs about
average, internationally. Only one relatively early EU-oriented study (Blanco, 2009) shows very low capital costs
while the highest capital costs are Round 3 estimates by Mott MacDonald (2010) and Fraunhofer (2013) for
Germany.
Focussing on the UK studies, at first glance the average capital cost for Round 2 appears to be around £150/kW
(5%) lower than the Round 3 sites; however, splitting the analyses by treatment of offshore network connection
costs reveals a more complex picture. Round 2 analyses that include grid connection within capital costs are on
average £340/kW higher than those that account for OFTO charges (£3100 vs £2770), while for Round 3 the
difference is almost £500/kW (£3300 vs £2800), which is in line with the Crown Estate estimate of the transmission
cost being around £500,000/MW. The split suggests that the there is a modest average increase in capital costs
other than grid connection costs between Round 2 and 3 (1%), but that capital costs associated with grid
connection are 46% more expensive in Round 3 sites. This is an entirely logical conclusion given the increased
distance to shore, deeper water and larger power transfer capacity of the Round 3 grid connections.
Most studies offer a range of costs although, as there is limited consistency in terms of how uncertainty in capital
costs is reported, interpretation requires care; for example in Figure 7 IEA (2010) reports costs from a range of
OECD countries from France (lowest) to Belgium (highest), while Crown Estate (2012) shows the range for a
generic Round 2 project. It is clear however, that there is substantial uncertainty about capital costs, particularly
for more challenging sites.
Life Cycle Costs and Carbon Emissions of Offshore Wind Power
14
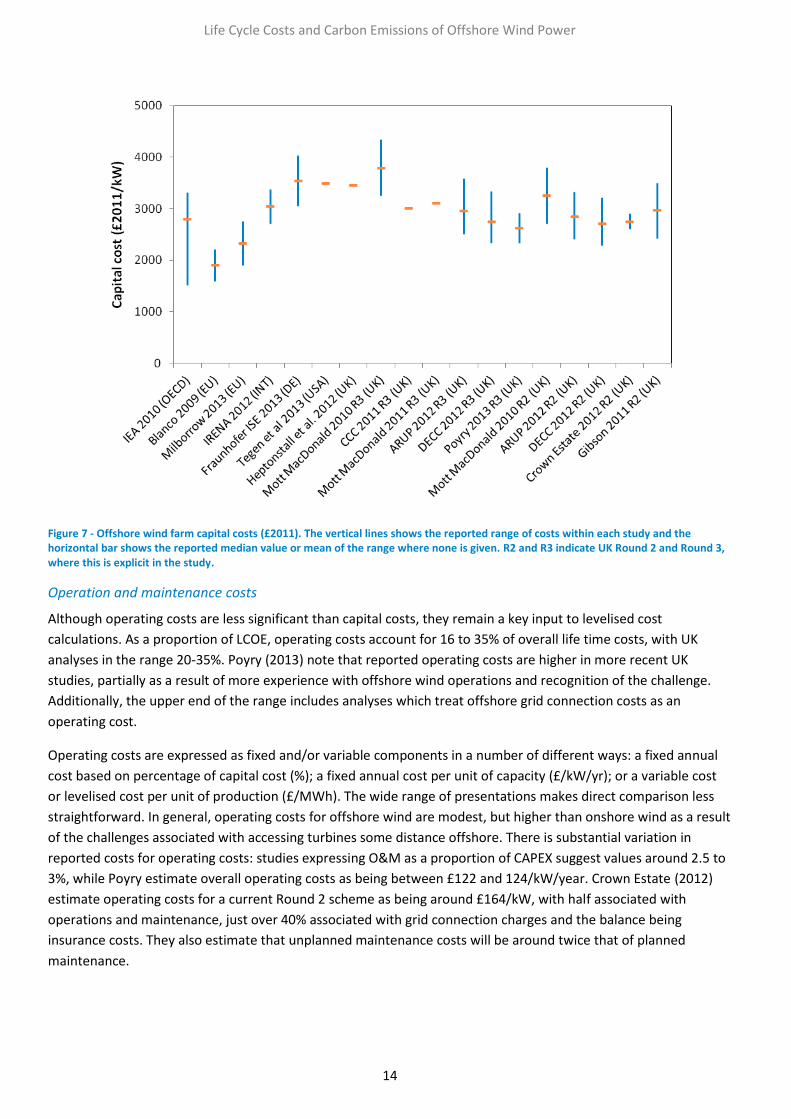
Figure 7 - Offshore wind farm capital costs (£2011). The vertical lines shows the reported range of costs within each study and the horizontal bar shows the reported median value or mean of the range where none is given. R2 and R3 indicate UK Round 2 and Round 3, where this is explicit in the study.
Operation and maintenance costs
Although operating costs are less significant than capital costs, they remain a key input to levelised cost
calculations. As a proportion of LCOE, operating costs account for 16 to 35% of overall life time costs, with UK
analyses in the range 20-35%. Poyry (2013) note that reported operating costs are higher in more recent UK
studies, partially as a result of more experience with offshore wind operations and recognition of the challenge.
Additionally, the upper end of the range includes analyses which treat offshore grid connection costs as an
operating cost.
Operating costs are expressed as fixed and/or variable components in a number of different ways: a fixed annual
cost based on percentage of capital cost (%); a fixed annual cost per unit of capacity (£/kW/yr); or a variable cost
or levelised cost per unit of production (£/MWh). The wide range of presentations makes direct comparison less
straightforward. In general, operating costs for offshore wind are modest, but higher than onshore wind as a result
of the challenges associated with accessing turbines some distance offshore. There is substantial variation in
reported costs for operating costs: studies expressing O&M as a proportion of CAPEX suggest values around 2.5 to
3%, while Poyry estimate overall operating costs as being between £122 and 124/kW/year. Crown Estate (2012)
estimate operating costs for a current Round 2 scheme as being around £164/kW, with half associated with
operations and maintenance, just over 40% associated with grid connection charges and the balance being
insurance costs. They also estimate that unplanned maintenance costs will be around twice that of planned
maintenance.

Life Cycle Costs and Carbon Emissions of Offshore Wind Power
15
Decommissioning
Decommissioning costs are largely neglected in studies as, for the reasons outlined earlier, the discounted value is
generally low, or costs are assumed to be equivalent to the salvage value of the assets. In studies that include such
costs for wind, they are included as a percentage of capital cost, e.g. 5% (IEA, 2010); or as a per kW cost. Crown
Estate (2012) include the costs of removing the turbines and infrastructure above the seabed, but ignore any
residual value. Tegen et al (2012) account for a $165/kW ‘surety bond’ to cover costs of decommissioning.
Levelised Costs
The variations in capital and operating costs feed through into the overall levelised cost of energy estimates. Here
they are joined by a series of other factors that lead to significant variation in LCOE. Figure 8 shows the range of
LCOE estimates (in £2011) for the same studies shown in Figure 7, as well as values from Civitas (Lea, 2012) and
the UKERC (Gross et al., 2013) review for comparison.
Figure 8 - LCOE of offshore wind farms (£2011). The bar shows the reported range of costs within each study and the bar shows the reported median value or where none given the mean of the range. R2 and R3 indicate UK Round 2 and Round 3 where this is explicit in the study.
Several things are apparent:
Higher values of CAPEX do not automatically translate into higher LCOE; for example, Fraunhofer (2013) has one of the higher CAPEX ranges but one of the lowest LCOE ranges;
UK-specific studies and the UKERC ranges tend to show higher LCOE values than those for overseas;
The spread of values is much greater overall with two studies in particular indicating substantially higher LCOE.
While capital costs are a key determinant of LCOE, Schwabe et al. (2011) indicate that assumptions on capacity
factor, lifetime, discount rate and financing structure are important. For the studies examined here, the central

Life Cycle Costs and Carbon Emissions of Offshore Wind Power
16
values for LCOE are more strongly correlated with capacity factor and discount rate than capital cost, with lifetime
showing a modest relationship.
The typical central value for capacity factor is 39%, with the UK studies tending to be marginally lower than
international values, although exclusion of the low estimate by Gibson (2011) puts the UK average marginally
above the international studies. LCOE is shown in Figure 9 to decrease as capacity factor increases.
Figure 9 - LCOE variation with capacity factor. Studies that include system costs are clearly identified by square markers.
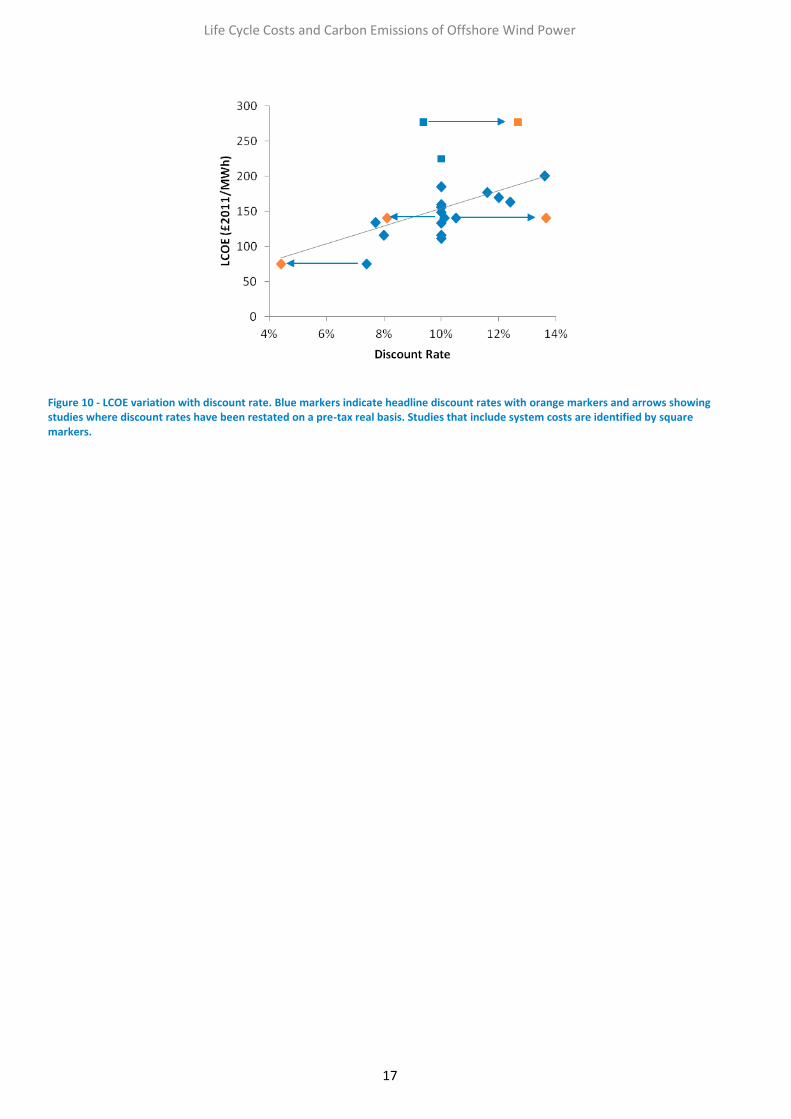
The UK studies almost universally apply the simplified LCOE method, using pre-tax real discount rates of 10% or,
when risk-adjusted, up to 13.6%. Other than the IEA (2010) and IRENA (2012) studies, which use a similar discount
rate and method, the international studies tend to have substantially lower real discount rates: Fraunhofer (2013)
use a fairly low 7.7%, while the 10.5% nominal discount rate used by Tegen et al. (2013) is equivalent to 8.1% real.
Gibson (2011) and Crown Estate (2012) are unusual in applying a post-tax rate. Conversion of the small number of
alternatively presented discount rates into their pre-tax real equivalents creates an even stronger correlation, as
Figure 10 demonstrates. The national variation in discount rates reflects expectations of cost of debt and equity as
well as financing preferences. In addition, Oxera (2011) note that discount rates also reflect perceptions of a range
of risks including those from policy.
The final point is that that Gibson (2011) and Civitas (Lea, 2012) have much higher apparent LCOE as a result of
adding ‘system costs’ to the baseline levelised costs. Civitas (Lea, 2012) combines the £149/MWh baseline LCOE
from Mott MacDonald (2010) with £67/MWh of system costs based on Gibson’s estimates of balancing, additional
backup and transmission costs. Gibson’s higher LCOE estimate is made up of a £75/MWh system cost and a
baseline LCOE of £187/MWh, despite also using Mott Macdonald (2010) cost components. In part both estimates
are higher as a result of a more conservative 32% capacity factor. More importantly, close inspection of Gibson’s
spreadsheets suggests a series of factors that serve to inflate the LCOE: a ‘Full’ LCOE method is used that calculates
IDC using a very high 12.5% post-tax equity rate of return, low gearing and a separate debt repayment charge is
applied at the overall discount rate. The latter item is effectively double-counting, and it is notable that the
financial treatment of on- and offshore wind differs from the other generation types examined. Both studies are
clearly marked in Figure 10. The system costs are examined in more detail in Section 3.
Life Cycle Costs and Carbon Emissions of Offshore Wind Power
17
Figure 10 - LCOE variation with discount rate. Blue markers indicate headline discount rates with orange markers and arrows showing studies where discount rates have been restated on a pre-tax real basis. Studies that include system costs are identified by square markers.
Life Cycle Costs and Carbon Emissions of Offshore Wind Power
18
Study Location /
UK Round
Type of
analysis
Currency
unit
LCOE LCOE Capital costs Capacity
factor
Lifetime Discount
rate
System
costs
Currency/MWh £2011/MWh £2011/kW % Years %
IEA (2010) OECD Simplified $2008 195 [146, 261] 116 [87, 156] 2798 [1513, 3309] 39 [34, 43] 25 10.0% No
Blanco (2009) EU Full €2008 [60, 110] 75 [53, 97] 1896 [1587, 2205] 23 [19, 35] 20 7.4%PN
No
Milborrow (2013) EU Simplified €2012 [90, 205] 116 [71, 162] 2326 [1892, 2759] 35 [30, 40] 20 8.0% No
IRENA (2012) INT Simplified $2010 [140, 190] 112 [95, 128] 3041 [2703, 3379] 45 [40, 50] 20 10.0% No
Fraunhofer ISE (2013) DE Simplified €2010 [114, 185] 134 [102, 166] 3537 [3045, 4030] 39 [32, 46] 20 7.7% No
Tegen et al (2013) USA Full $2011 225 140 3492 39 20 10.5%PN
No
Heptonstall et al. (2012) UK Simplified £2009 144 155 3454 38 20 10.0% No
Mott MacDonald (2010) UK R2 Simplified £2010 149 156 3249 [2705, 3792] 39 [35, 43] 22 10.0% No
Mott MacDonald (2010) UK R3 Simplified £2010 177 185 3786 [3249, 4340] 39 [35, 43] 22 10.0% No
CCC (2011) UK R3 Simplified £2011 [110, 157] 134 [110, 157] 3000 41 [34, 43] 20 10.0% No
Mott MacDonald (2011) UK R3 Simplified £2011 169 [140, 180] 169 3100 38 20 12.0% No
Arup (2011) UK R2 Simplified £2010 169 [149, 191] 177 [156, 200] 2843 [2402, 3325] 38 24 11.6% No
Arup (2011) UK R3 Simplified £2010 192 [168, 225] 201 [175, 235] 2951 [2507, 3583] 38 22 13.6% No
DECC (2012) UKR2 Simplified £2012 153 [135, 174] 149 [131, 169] 2713 [2280, 3207] 39 25 10.0% No
DECC (2012) UK R3 Simplified £2012 164 [145, 190] 159 [141, 185] 2747 [2334, 3336] 39 25 10.0% No
Poyry (2013) UK R3 Simplified £2012 [140, 195] 163 [136, 190] 2625 [2334, 2917] 44 [40, 47] 22 12.4% No
Crown Estate (2012) UK R2 Full £2011 140 [135, 145] 140 [135, 145] 2798 [1513, 3309] 41 [40, 42] 20 10.1%TN
No
Gibson (2011) UK R2 Full £2010 265 [210, 293] 277 [219, 306] 2966 [2423, 3499] 32 20 9.4%TR
Yes
Civitas (Lea, 2012) UK R2 Simplified £2010 215 225 3249 [2705, 3792] 39 22 10.0% Yes
UKERC (Gross et al., 2013) UK Review £2011 [100, 200] 150 [100, 200] - - - - No
Table 2 - Summary of selected offshore wind LCOE analyses and their key parameters. LCOE, Capital costs and Capacity factor values are in the form “Central [Low, High]”. Discount rates are real pre-tax rates (weighted average cost of capital) except
PN pre-tax nominal,
TN post-tax nominal and
TR post-tax real rates. Low outliers are highlighted in blue, high outliers in orange.

Life Cycle Costs and Carbon Emissions of Offshore Wind Power
19
Comparison with other generating technologies
Many studies reviewed and referred to in the cost analyses presented earlier offer comparisons between wind and
other technologies. In the main the UK-specific analyses are representative, and the UKERC study (Gross et al.,
2013) conveniently provides an analysis of current levelised costs, as summarised in Table 3. It is apparent that
there are substantial uncertainties around all technologies: capital cost, capacity factor and discount rate are
important for nuclear while fossil fuel and carbon costs are important factors for CCGT.
An aspect that often gets overlooked in comparisons is that the LCOE for thermal power plant generally assume
operation as baseload with capacity factors that are at the upper end of the range (85-90%). In an electricity
system with variable demand it is not possible that all thermal plant will operate as baseload, as marginal cost will
dictate that some will operate less frequently so their capacity factor will decline and LCOE will increase; this effect
is expected to be enhanced as more wind enters the system, squeezing operational opportunities for gas and coal
generation.
Although it is evident that offshore wind is substantially more expensive at present, the overlapping of the ranges
for nuclear, onshore wind and combined cycle gas turbines means there is no clear outcome in terms of which
technology is currently ‘cheapest’ on the basis of levelised costs.
Generation technology Range (£/MWh)
Nuclear 70 – 105
Gas (CCGT) 60 – 100
Onshore wind 70 – 125
Offshore wind 100 – 200
Table 3 - LCOE of a range of generating technologies: on and offshore wind, combined cycle gas turbines and nuclear generation (in £2011) based on sample of UK studies by UKERC (Gross et al., 2013)
2.4 Outlook for LCOE of Offshore Wind
For many new and established generating technologies there is an expectation that costs will come down and
performance will increase with time; a wide range of literature on innovation supports this view. UKERC (Gross et
al., 2013) summarises the mechanisms through which this occurs and compares the two main approaches used to
project future costs:
1. Technical engineering assessment; and 2. Extrapolation using experience curves (or learning rates).
Engineering assessment breaks down a system into constituent parts, and parametric modelling is used to examine
contributions to overall cost and scope for improvements (Mukora et al., 2009). Experience curves, on the other
hand seek, mathematical relationships between historic costs and the cumulative production of a product; this can
be extrapolated into the future to assess potential costs at specific levels of deployment. The key parameter in
experience curve analysis is the ‘learning rate’ – with a higher value resulting in a faster decrease in costs with
installed capacity. Such studies have been widely used, but UKERC (Gross et al., 2013) have identified a number of
limitations, and conclude that engineering assessment may be the most appropriate method for assessment of
emerging technologies such as offshore wind, while learning rates then become more appropriate once a track
record is established. Gross (2013) further note that cost gains due to learning may be overwhelmed by external
factors, including fuel and commodity prices and supply chain issues, and that many of these factors are uncertain
and volatile.

Life Cycle Costs and Carbon Emissions of Offshore Wind Power
20
Although it does not explicitly identify cost projections from individual studies, UKERC’s analysis of available
literature suggests a generally downward cost trend for most technologies apart from gas, but identifies that a
substantial range exists, as Table 4 shows. To illustrate the point several studies for offshore wind have been
picked out for further analysis.
Generation technology 2020 2030
Central value Range Central value Range
Nuclear 70 30 - 130 60 30 – 125
Gas (CCGT) 94 55 – 108 96 52 – 138
Onshore wind 83 47 – 112 88 71 – 104
Offshore wind 127 92 – 140 112 98 – 130
Table 4 - Forecast LCOE for generating technologies: on and offshore wind, combined cycle gas turbines and nuclear generation (in £2011) based on sample of UK studies by UKERC (Gross et al., 2013)
A feature of the analyses is the extent of the uncertainty, but there are a number of common themes. As
deployment increases the move to more challenging sites further offshore and in deeper water (i.e. from Round 2
to 3), the costs of foundations, installation and grid connection will tend to increase (Mott MacDonald, 2011);
however, studies agree that significant cost reductions will occur through:
Erosion of ‘market congestion’ premiums, as manufacturing capacity and competition from China and other low cost regions increases;
Larger wind turbines with new low-mass generator designs and capacity factors reaching 45% will cut costs per kW;
Larger farms will allow sharing of infrastructure, while larger turbines mean fewer foundations for a given farm capacity;
A move to high voltage DC connections will reduce the number of long distance subsea cables;
Improvements in foundation design and manufacturing;
Improvements in deployment and servicing approaches and the capabilities of suppliers;
As deployment increases and practices mature, the risk associated with offshore wind will decrease, driving the discount rate and LCOE downwards.
The Crown Estate (2012) offer an extremely detailed and well documented analysis of the potential technological,
financial and supply chain interventions necessary to reduce LCOE for offshore wind to £100/MWh by 2020. The
analysis is based around four cost storylines that are more or less favourable, and their central estimates indicate
LCOE could fall to between £86 and 115/MWh by 2020. Technology and supply chain factors that include
increasing turbine size to 5 to 7 MW (from 3 to 5 MW) and the ‘industrialisation’ of the supply chain, suggest
opportunities to reduce LCOE of 39% by 2020. The sophisticated financial modelling suggests that discount rates
will fall from around 10% to around 9% by 2020, depending on technology risk and market growth; this is
equivalent to a reduction in LCOE of 6% on its own.
Mott MacDonald (2011) estimate that capital costs could fall by 28% per MW by 2020 and 43% per MW by 2040,
with all main costs falling, and electrical and turbine costs almost halving, between 2011 and 2040. On the basis of
net capacity factors increasing to 40% by 2020 and 45% by 2040, capital costs per MWh will fall by 55% by 2040.
Together with reduction in discount rates from 12% in 2011 to 10.5% in 2020 and 8.3% in 2040, LCOE will fall from
£169/MWh to £103-114/MWh in 2020 and £69-82/MWh in 2040.
Arup (2011) expect that, despite the impact of anticipated rising steel and labour prices, capital costs will decrease
between 2010 and 2030 by 24% by 2020, largely from learning as turbines are scaled up. Furthermore, they expect
Life Cycle Costs and Carbon Emissions of Offshore Wind Power
21
O&M to fall 11% by 2020, with labour and spare parts a major driver. Excluding any change in discount rate,
median LCOE is anticipated to fall from £169 to £107 (37%) by 2020, within a range of £95-121/MWh.
The CCC (2011) anticipate that capital costs will fall by 16% by 2020 and 43% by 2040, with significant savings on
the turbine (45%), bigger turbines and larger arrays. Internationally, IRENA (2012) expect 8 to 10% falls in LCOE by
2015 and in the medium to long term reductions of 10 to 30% arising from learning-by-doing, supply chain
improvements, manufacturing economies of scale, competition and more R&D investment.
While generally not including detailed analysis of major technological innovation, some studies speculate that
further cost reduction potential exists through use of 20 MW capacity turbines (CCC, 2011), floating turbines and
vertical axis turbine designs (Mott MacDonald, 2011).
Key Messages
Capital costs for offshore wind are approximately £3000/kW.
Two studies (Gibson, 2011; Lea, 2012) show life cycle costs that are notably above others arising from
inclusion of very high estimates of system costs. Further Gibson (2011) uses high discount rates, low
capacity factors and otherwise unusual financial treatments.
Blanco (2009) suggests an exceptionally low cost of energy; this can be attributed to a very low
estimate of capital cost and very low discount rates.
Discount rate assumptions are critical to the eventual levelised cost of offshore wind; post tax real
discount rates of 10% are typical for the UK and higher than international comparators.
Currently offshore wind is by some margin more expensive than onshore wind, nuclear and gas
generation; however, there appears to be substantial scope to reduce costs significantly by 2020.

Life Cycle Costs and Carbon Emissions of Offshore Wind Power
22
3 Effect of Wind Power on System Costs
The impact of wind on other generators, and the system as a whole, is generally excluded from levelised cost
calculations, although some studies do include them; for example PB Power (2004), Gibson (2011), Civitas (Lea,
2012), and the American Tradition Institute (ATI) (Taylor and Tanton, 2012). Some of these studies that include
‘system costs’ use it as evidence that wind energy costs are “significantly understated [because] they failed to take
its unusual indirect and infrastructure costs into account” (Taylor and Tanton, 2012). These studies suggest that
inclusion of the system costs of offshore wind increases the apparent cost by 30% (PB Power, 2004), 33% (Gibson,
2011), or 45% (Lea, 2012).
In essence the ‘system’ costs that are referred to are:
The costs of balancing the power system to cope with the variable output of wind farms;
The costs of providing ‘backup’ or, more specifically, costs of ensuring there is sufficient generation capacity to meet demand;
The cost of additional transmission that is required to connect wind plants, and the losses associated with it.
There have been several reviews of aspects of these costs – notably Costs and Impacts of Intermittency (Gross et
al., 2006), as well as a wide range of relevant studies since then. The IEA (2010) make the point that "there is no
disagreement between experts that such system costs for non-dispatchable renewables exist [but there is] little
agreement (and, in fact, very little information) about their precise amount”. Studies show that generation mix,
network capacity and interconnection, as well as the availability of mechanisms for managing variability, are
important in determining costs, which makes comparison challenging.
Additionally, while the operation of the power system (or national grid) operates on relatively simple concepts, the
system itself is highly complex, requiring substantial engineering expertise to operate securely and efficiently.
Furthermore, the engineering practices required to achieve this do not feature in the (classical) economic theories
that explain market operation; as such, there is substantial scope for misunderstanding terms and outcomes.
3.1 Balancing
The variable nature of wind power, in contrast to conventional, dispatchable technologies, requires flexible
‘reserves’ to be on hand for times when the resource is not available (IEA, 2010); therefore, the cost of onshore
wind is higher at system level than at farm level.
Reserves are used to handle unpredicted variations in demand or generation on a range of timescales from
seconds to around four hours. They include ‘frequency response’ generation that automatically reacts to rapid
changes such as the sudden loss of a large generator, and operating reserve, which deals with slower variations
over time, such as changing generator availability or incorrect forecasts . Operating reserves are provided by
power stations running at part load, standby generators that can be started quickly (hydro, diesel, open cycle gas
turbines), as well as (some) contracted demand response. Reserve therefore creates costs in terms of operating
power plants less efficiently (see Section 5.1), as well as the cost of contracts for ensuring standby generation is
available. The amount of reserve is specified by National Grid on the basis of the largest generator than can be
lost, and the level of error in forecasting demand and wind four hours ahead of delivery. Increases in wind capacity
will therefore increase the amount of reserve that needs to be held, but this amount depends on overall expected
errors, not simply that of wind. The four hour window is important as this is the standard lead time to start a
thermal power plant to cover shortfalls. National Grid handles this through the Balancing Mechanism and several
other schemes.

Life Cycle Costs and Carbon Emissions of Offshore Wind Power
23
IEA (2010) compares several international studies that show balancing costs increase with wind penetration,
although the rate of increase does level off: at penetration levels of up to around 20%, costs are around £0.60 to
4/MWh ($1 to 6/MWh), or around 10% of wind cost. Katzenstein and Apt (2012) note that the costs of handling
variability of wind power in Texas reduces as wind capacity factors increase, and as the number of plants increases.
The Eastern Interconnection Wind Integration Study (EnerNex Corporation, 2011) shows that for large balancing
areas and fully developed regional markets, the cost of integration is about $5/MWh (US$ 2009). Specific studies
for the UK also suggest increases in the volume of reserve held: Strbac et al (2007) suggest an extra 4.6 to 6.3 GW
of reserve will be necessary to integrate 25 GW wind, costing £3.4 to 6.3/MWh (corrected to £2011); National Grid
(2010) estimate that the extra balancing costs for wind for a 40% wind penetration in 2020 are of the order of
£500–1000 million per annum (£3.5–7.0/MWh of wind). The uncertainty in these estimates arises from the
uncertainty of the future trajectory of the costs of balancing services, as they are dependent on fuel prices. For
comparison, the cost of balancing the system in 2012/13 was £803 million (~1% of customer bills), of which £170
million was due to managing grid constraints and £7 million for constraining wind farms.
A concern that has arisen in recent years has been around the impact that ‘cycling’ of thermal power plants has on
the fuel savings due to wind operation. While one of the less credible studies (le Pair, 2011b) is examined in detail
in Appendix 3, there is a reasonable basis for concern. The issue arises from the need to operate thermal power
plant flexibly to respond to wind power production, leading to part-loading, increased ramping, and additional
shutdowns and start-ups. This potentially leads to costs associated with higher fuel consumption per MWh due to
less efficient operation, as well as impacts on operations, maintenance and reliability. Denny and O’Malley (2009)
suggest that fuel associated with on-off cycles represent a modest part of the costs, between 2 and 50%
depending on the generator. The ATI (Taylor and Tanton, 2012) speculate that ‘additional gas consumption’ would
cost $4 to 8/MWh despite admitting that they were unaware of the true penalty. A more credible analysis by NREL
(2013b) found that, for the Western Integration in the USA, the increase in O&M costs from cycling were $0.14–
$0.67 per MWh (<40p/MWh) compared to around $30/MWh of cost savings associated with avoided fossil fuel
use.
Overall, the literature suggests that balancing costs are likely to be lower in larger markets, with a geographical
spread of plants, and when wind is part of a complementary portfolio of other generation technologies (IEA, 2010).
This is important in considering wind integration in Scotland as, while Scotland’s wind penetration will be locally
very high, it is the penetration at GB level and the extent of transmission and external interconnections that will
strongly govern balancing costs. While there are undoubtedly additional balancing costs arising from integrating
variable wind, the IEA (2010) and other studies suggest they are not prohibitive. Additionally, the Committee on
Climate Change suggest that, with the right investment in flexibility in the form of storage, demand side
management and interconnection, costs can be managed (at around £10/MWh) at even relatively high levels of
renewables penetration. Furthermore, these are generally one-off investment costs and “low compared to costs of
deploying renewable generation” (Barrs, 2011).
3.2 Backup
Ensuring that there is sufficient generating capacity to provide secure electricity supply is a key issue, and concern
is expressed about ensuring ‘backup’ is provided to cover days when there is little or no wind; however, in
analysing this issue some studies make an explicit assumption that additional dedicated generating capacity must
be built to ‘firm up’ wind, and that this entails high additional costs to cover capital and operating expenses.
Gibson (2011) and Civitas (Lea, 2012) refer to this as ‘Planning Reserve’ but the same idea is used in studies by PB
Power (2004), the ATI (Taylor and Tanton, 2012) and Hughes (2012). In arriving at a cost of £16.7/MWh
(~£20/MWh in £2011), PB Power (2004) assume that open cycle gas turbines are built to cover the equivalent of

Life Cycle Costs and Carbon Emissions of Offshore Wind Power
24
65% of the wind capacity, with the capital cost, fixed O&M and the difference between the marginal fuel cost of
OCGT and CCGT generation attributed to wind. Gibson (2011) assumes 92% of wind capacity is required as backup,
hence a higher £28/MWh charge (and £24/MWh for Civitas (Lea, 2012)) to cover capital costs. The ATI (Taylor and
Tanton, 2012) assume 75% of the wind capacity would be backed up by CCGT, amounting to $17/MWh of backup
costs.
Milborrow (2009) and others make the point that this is not a realistic representation as, in reality, all fossil fuel
and nuclear power stations in a given system provide backup to all others. As each has a statistical probability of
experiencing an outage, more capacity is built than is required at peak demand levels to cover this eventuality.
Wind is essentially no different, although its availability is governed by the weather rather than the mechanical
reliability. As wind is added to the system it, in itself, adds to system reliability and this is referred to as its
‘capacity credit’. Importantly, as wind is added, it is not automatically the case that other power plants are retired.
Unlike in planned systems, there is no specific entity responsible in Great Britain for deciding when power plants
should be connected or withdrawn; rather market participants decide on the basis of expected profitability, among
other considerations. The theory is that price signals should ensure generation is built at appropriate times,
although the recent Electricity Market Reform introduced a capacity payment to make capacity signals more
explicit. Given this, there is a drastic over-estimate of the cost of backup power in analyses that assume that wind
needs dedicated provision. Additionally, the very low (8%) capacity credit estimates used by Gibson (2011) and
Civitas (Lea, 2012) serve to inflate the amount of backup; Milborrow (2009) notes that other estimates for capacity
credit are in the region of 20%.
There have been a number of system planning studies undertaken in recent years that aim to optimally plan the
GB system with high penetrations of renewables, such as Poyry (2011) for the CCC. The default assumption is that,
in constructing a generation portfolio to meet variable demand, some peaking plant is required. Typically these are
open cycle gas turbines with very low capital cost but high running costs. Analyses for the CCC show that use of
flexibility introduced by storage, demand side response and interconnection, mean requirement for peaking plant
such as OCGT for meeting shortfalls is low, but not eliminated: costs of £30 million/year at 40% GB renewable
penetration equate to ‘backup costs’ of £0.2/MWh. The key point is that provision of full back up of renewable
capacity is not necessary for secure supplies where flexibility is encouraged.
3.3 Transmission
The cost of investment in transmission lines, cables and associated infrastructure is also a key theme, with Gibson
(2011) and Civitas (Lea, 2012) attributing very high transmission costs to wind. In determining a cost of
transmission Gibson (2011) uses the cost of the contentious Beauly-Denny line, and extrapolates to a
reinforcement cost of £31/MWh. While this is, in principle, a reasonable approach, the calculation uses a low
capacity factor for wind and, in the financing calculations there appears to be double counting and the use of a
cost of capital that is much higher than the 4.5% value for a regulated network utility suggested by Ofgem (2012).
Parsons Brinckerhoff (2012) offer lifetime transmission costs for a range of overhead line and cable installations
that can be used to derive indicative costs per MWh for a wind farm connected to one end; for example, 40-year
lifetime costs of £168 million (£2.2 million/km) are estimated for a 75km double circuit overhead line able to carry
3190 MVA (a substantial proportion of this cost is due to transmission losses). Assuming 1 to 3 GW of wind farms
connect to the line, this suggests a range of costs of £1.6 to £5/MWh (with a capacity factor of 28%, variation of
losses with circuit loading ignored and discounting wind output at 6.25%). The lower the use of the line the more
expensive it becomes on a per MWh basis.
Life Cycle Costs and Carbon Emissions of Offshore Wind Power
25
A difficulty in estimating cost of transmission on this basis is that transmission lines generally add to, or uprate, an
existing interconnected system. The power flows are therefore more complex: lines are not loaded to maximum to
ensure stability and post-fault security, and there are often a series of related upgrades. These factors make it
difficult to attribute costs to wind, although more realistic estimates can be gained from full transmission studies.
Mills et al (2009) reviewed an extensive set of US transmission studies for wind connection, and found a median
cost of $300/kW of wind installed (~15% of then wind farm capex at the time) and median unit cost of $15/MWh
wind produced [(~£10/MWh). Similarly the Eastern Interconnection study (EnerNex Corporation, 2011) found
transmission costs to be $15/MWh ($2009). The choice over how much transmission capacity to build can be
determined either by system security considerations, which define the level of redundancy, or on a cost-benefit
basis, where the cost of transmission is compared to the cost of constraints. Constraint costs have been a
particular area of contention in recent years, particularly where payments have been to wind farms. National Grid
estimate that the cost of constraints in 2011/12 was £324million, of which £31million was for wind constraints,
while in 2012/13 constraint costs dropped to was £170million, with £7million for wind. They attribute the reason
for reduced costs to investment in the network. In its analyses, the CCC (Barrs, 2011) suggest that transmission
costs are likely to rise with renewables penetration: wind generation in the north will tend to increase need for
capacity, but where it is closer to the south it may save on the cost of transmission to accommodate non-
renewable plant elsewhere. The CCC estimates the cost of transmission requirements to be between £5 and
£10/MWh (Barrs, 2011).
In considering the cost of transmission expansion, it is important to note that other generation sources will also
require transmission expenditure, not just wind. It is reasonable to say that gas power plants have more choice
over location than wind (Giberson, 2013) or, for that matter, coal and nuclear plants, which require ready access to
cooling water. Many replacement plants choose to locate at existing sites precisely to avoid transmission
expansion (although there may well be requirements to extend or reinforce the gas transmission network to
accommodate gas power plants). Mills et al. (2009) emphasise that transmission expansion typically serves
multiple purposes, and that assigning the full costs of expansion to additional (wind) generation capacity
effectively ignores other benefits. Furthermore, a problem with some analyses is that they ignore the fact that the
GB transmission system, as it exists in present form, was deliberately planned to strategically accommodate given
resources, with costs socialised largely through the nationalised industry. It simply happens that those strategic
assets were nuclear and coal power plants and large scale pumped storage, rather than wind.
3.4 Total ‘System’ Costs
While there are variations in the literature for each of the components of ‘system cost’, there is clear distinction
between these and the overall costs suggested by the four LCOE studies that incorporate ‘system costs’.
Backup costs – Overstated in all cases as a result of a partial understanding of the system;
Transmission costs – Gibson (2011) and Civitas (Lea, 2012) overstate this, although the ATI (Taylor and Tanton, 2012) are in line with other US literature (the ATI do, however, add an extra $10/MWh for transmission losses, despite transmission assessments including loss costs as a key cost);
Balancing costs – The ATI (Taylor and Tanton, 2012) are broadly in line with other literature, while Gibson (2011) and Civitas (Lea, 2012) are high. This aspect has been specifically criticised, and it transpires that the £16/MWh is quoted from PB Power (2006), which in turn references Dale et al. (2004). That study estimates the difference in total costs of a system with 20% wind and that of a gas-only system, and includes overall generation, transmission and distribution costs alongside fuel and balancing costs. The £16/MWh figure is the additional cost per unit of wind produced which equates to £3/MWh per unit of electricity sold.

Life Cycle Costs and Carbon Emissions of Offshore Wind Power
26
Taking the range of credible estimates from the literature for each component of system costs allows an estimate
to of total systems costs to be made for penetrations of up to 40% wind shown in Table 5. A total of £7 to 18/MWh
straddles the £10/MWh cost of intermittency suggested by the Committee on Climate Change (Barrs, 2011), and
would represent around 5 to 10% of baseline levelised cost of offshore wind.
Cost component Range (£/MWh)
Balancing costs 2 – 7
Backup costs 0.2 – 0.5
Transmission costs 5 – 10
Total ‘system’ costs 7 – 18
Table 5 - Range of ‘system’ costs associated with wind power (in £2011).
Ultimately, while the estimates of Gibson (2011), Civitas (Lea, 2012) and others for the system costs of wind are
very overstated, it remains the case that system costs are real. The IEA (2010) suggest that “part of the cost of
such system’s reserves should in principle, be added to the LCOE of intermittent renewables when compared to
other baseload generation sources”. Substantial system costs exist, even in zero wind systems, precisely because
the nature of electricity supply requires backup, balancing and transmission to allow individual, isolated,
generators to contribute.
Key Messages
System costs such as balancing, provision of backup and transmission arise in accommodating wind
energy.
These are relatively small compared to the overall cost of electricity supply or the levelised cost of
wind; the review suggests values of £7 to 18/MWh are credible.
Studies that included system costs in their levelised cost estimates (PBPower, 2004; Gibson, 2011; Lea,
2012; Taylor and Tanton, 2012) tended to systematically overstate them.
There is particular overstatement of the cost of ‘backup’ where it is assumed that dedicated
conventional generation must be constructed for periods when the ’wind is not blowing’; the reality is
that with other generation on the system operating flexibly the requirement for backup is modest.
There is substantial scope for energy storage, demand side response to provide flexibility.

Life Cycle Costs and Carbon Emissions of Offshore Wind Power
27
4 Life Cycle Carbon Emissions
4.1 Carbon, greenhouse gases and emissions savings
Much of the confusion in the existing debate over the life cycle carbon emissions of wind power generation is
thought to arise in a lack of comprehension of the different aspects of the calculation, along with uncertainty over
the terminology. The term ‘carbon emissions’ itself is unclear: it may be a measure of the emissions of all gases
containing carbon, including those that have no global warming potential; it may focus solely on carbon dioxide
and/or methane; or it may include all greenhouse gases (GHGs) identified by the Intergovernmental Panel on
Climate Change (IPCC, 2011). For the purposes of this paper, the term ‘carbon’ is taken to be interchangeable with
‘greenhouse gas’, with carbon emissions measured in grams of carbon dioxide equivalent (g CO2 eq). While this
should include emissions of all greenhouse gases, the implications of only considering one or two in an estimate of
life cycle carbon emissions are discussed later.
Estimates of the life cycle carbon emissions of offshore wind farms are not, in themselves, particularly useful, and
are only really of interest for comparison with other forms of low-carbon generation. Further interpretation is
required to calculate other values that may be more meaningful – the first of these is the lifetime emissions
savings of an offshore wind farm. This is the net reduction of greenhouse gas emissions taking into account both
the life cycle carbon emissions and the lifetime emissions displacement. Estimates of the latter vary widely, as they
are a measure of the displaced emissions resulting from wind power replacing other forms of generation.
Another useful metric is the carbon payback period. This is an estimate of the time for the carbon emissions of an
offshore wind farm to be offset by the displaced emissions. Provided that the carbon payback period is
significantly shorter than the design life, a net reduction in emissions will be achieved. This value is less sensitive
than the lifetime emissions savings to assumptions about design life, annual energy production and any changes in
emissions displacement due to long-term network changes over time.
4.2 Calculation Methodology
The life cycle carbon emissions of wind farms are conventionally calculated using partial process-based Life Cycle
Assessment (LCA), defined by a number of national and international standards (BSI, 2011; ISO, 2006a; ISO, 2006b;
ISO, 2013; The International EPD Cooperation, 2008; WRI and WBCSD, 2011). This involves systematically analysing
the greenhouse gas emissions of each process in each stage of the life cycle of the wind farm, as illustrated by
Figure 1, and described in further detail in Appendix 1.
As the LCA method is designed to be applied to a wide range of goods and services, there is considerable scope for
variations to be introduced to the results by variations in assumptions, methodological choices and data
uncertainty (ISO, 2006a; ISO, 2006b). Figure 11 illustrates the key areas where such variations might be introduced
to estimates of the life cycle carbon emissions of offshore wind power. These can be divided into four categories
(Adams et al., 2013): the first concerns variations in the input data stemming from variations in the wind farm
scenarios considered in different studies - farms built at different times, in different locations, with different
equipment - along with any uncertainty in this input data; the second includes uncertainties in the emissions
factors extracted from life cycle datasets, variations in processes in different countries, and differences in the
scope of GHG emissions included; the third focuses on differences in physical and temporal system boundaries;
and the fourth includes all variations introduced by differences in LCA methodology.

Life Cycle Costs and Carbon Emissions of Offshore Wind Power
28
Figure 11 - Causes of variation in carbon emissions estimates of wind farms (after Adams (2013))
A brief explanation of the terms used in Figure 11 follows:
Uncertainty – Often reported as a probability distribution, this includes potential measurement errors and uncertainties of assumptions; for example, at the construction stage, the design life of a wind farm is an assumption – the actual value might be different by a few years.
Time frame – Wind farms built in different years will have different impacts, as designs, materials and processes evolve.
Location/country/industry – Carbon emissions associated with different processes vary across industries and in different locations. Furthermore, life cycle carbon emissions are affected by transport distances, which are specific to the locations chosen in the given scenario.
Capacity factor – As with LCOE, the capacity factor is an important value in estimating the carbon emissions. It is a measure of the power output of a wind farm, described as a proportion of the maximum possible output. This is typically assumed to be around 30-55% (see Table 6), but will vary according to the wind profile at the given installation location, with DECC (2014) reporting a value of 39% for the UK in 2013.
Scope of emissions – Ideally an estimate of the life cycle carbon emissions will include emissions of all greenhouse gases identified by the IPCC (2007), but often only carbon dioxide, methane and nitrous oxide are included, with many studies focussing solely on CO2 (Vestas, 2006). Alternatively, some studies include the six gases identified by the Kyoto Protocol (The Carbon Trust, 2012).
Scope of analysis – Different studies might set different system boundaries; it should be the point of connection with the grid, as illustrated in Figure 2 in Section 1.2, but some published analyses of onshore wind farms consider only a single turbine, rather than a complete farm (Guezuraga et al., 2012; Tremeac and Meunier, 2009), while studies of offshore wind farms have been found to focus on the entire farm. Furthermore, there is debate over whether the analysis should include the emissions associated with the life cycle of the capital goods, such as vehicles used to transport the turbines (Crawford, 2005; Goedkoop et al., 2008).
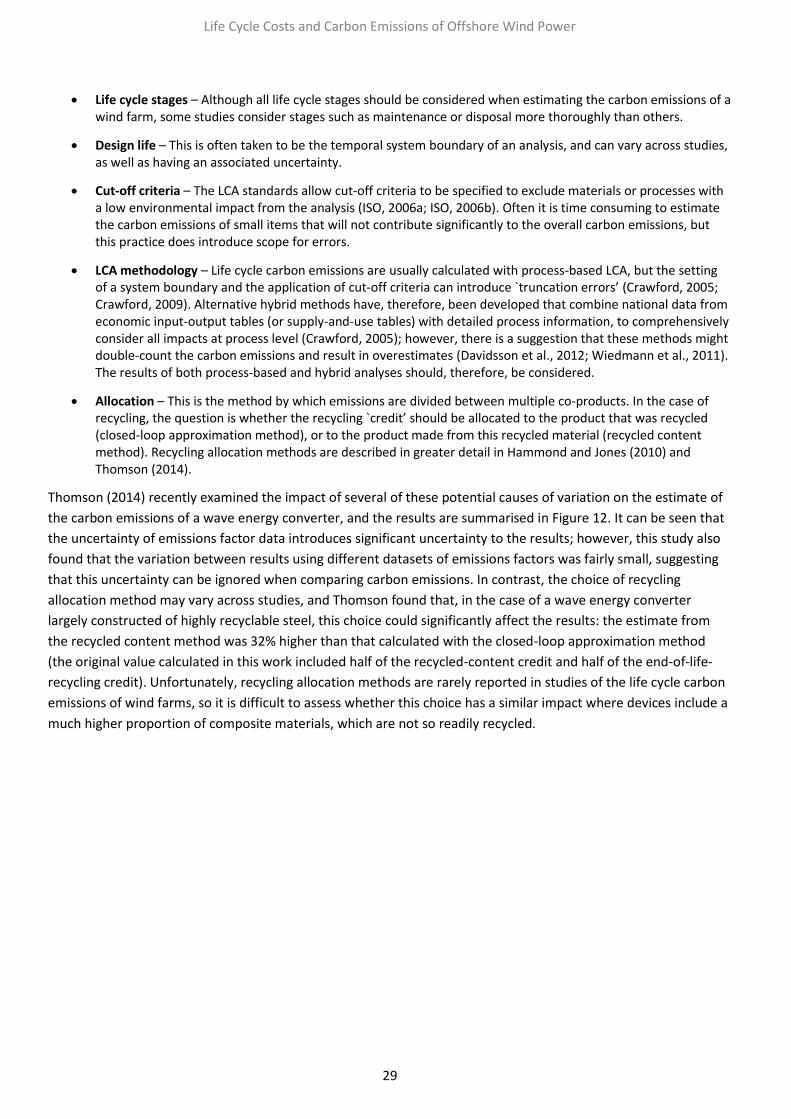
Life Cycle Costs and Carbon Emissions of Offshore Wind Power
29
Life cycle stages – Although all life cycle stages should be considered when estimating the carbon emissions of a wind farm, some studies consider stages such as maintenance or disposal more thoroughly than others.
Design life – This is often taken to be the temporal system boundary of an analysis, and can vary across studies, as well as having an associated uncertainty.
Cut-off criteria – The LCA standards allow cut-off criteria to be specified to exclude materials or processes with a low environmental impact from the analysis (ISO, 2006a; ISO, 2006b). Often it is time consuming to estimate the carbon emissions of small items that will not contribute significantly to the overall carbon emissions, but this practice does introduce scope for errors.
LCA methodology – Life cycle carbon emissions are usually calculated with process-based LCA, but the setting of a system boundary and the application of cut-off criteria can introduce `truncation errors’ (Crawford, 2005; Crawford, 2009). Alternative hybrid methods have, therefore, been developed that combine national data from economic input-output tables (or supply-and-use tables) with detailed process information, to comprehensively consider all impacts at process level (Crawford, 2005); however, there is a suggestion that these methods might double-count the carbon emissions and result in overestimates (Davidsson et al., 2012; Wiedmann et al., 2011). The results of both process-based and hybrid analyses should, therefore, be considered.
Allocation – This is the method by which emissions are divided between multiple co-products. In the case of recycling, the question is whether the recycling `credit’ should be allocated to the product that was recycled (closed-loop approximation method), or to the product made from this recycled material (recycled content method). Recycling allocation methods are described in greater detail in Hammond and Jones (2010) and Thomson (2014).
Thomson (2014) recently examined the impact of several of these potential causes of variation on the estimate of
the carbon emissions of a wave energy converter, and the results are summarised in Figure 12. It can be seen that
the uncertainty of emissions factor data introduces significant uncertainty to the results; however, this study also
found that the variation between results using different datasets of emissions factors was fairly small, suggesting
that this uncertainty can be ignored when comparing carbon emissions. In contrast, the choice of recycling
allocation method may vary across studies, and Thomson found that, in the case of a wave energy converter
largely constructed of highly recyclable steel, this choice could significantly affect the results: the estimate from
the recycled content method was 32% higher than that calculated with the closed-loop approximation method
(the original value calculated in this work included half of the recycled-content credit and half of the end-of-life-
recycling credit). Unfortunately, recycling allocation methods are rarely reported in studies of the life cycle carbon
emissions of wind farms, so it is difficult to assess whether this choice has a similar impact where devices include a
much higher proportion of composite materials, which are not so readily recycled.
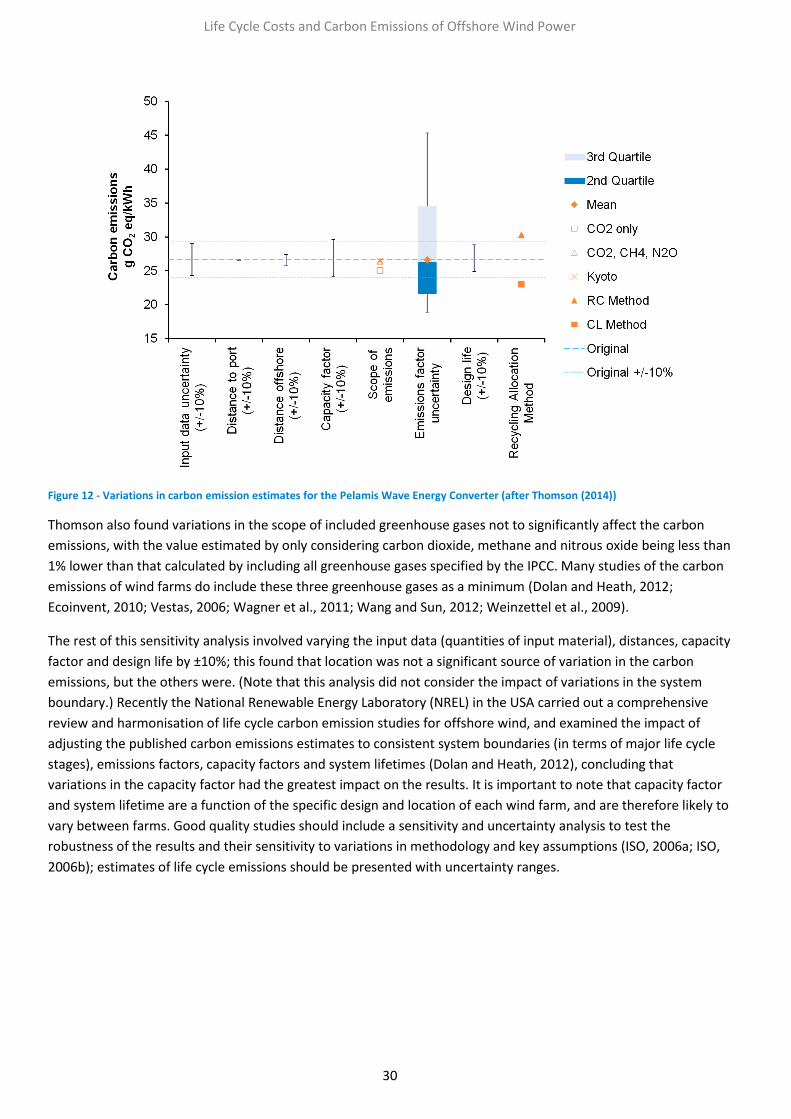
Life Cycle Costs and Carbon Emissions of Offshore Wind Power
30
Figure 12 - Variations in carbon emission estimates for the Pelamis Wave Energy Converter (after Thomson (2014))
Thomson also found variations in the scope of included greenhouse gases not to significantly affect the carbon
emissions, with the value estimated by only considering carbon dioxide, methane and nitrous oxide being less than
1% lower than that calculated by including all greenhouse gases specified by the IPCC. Many studies of the carbon
emissions of wind farms do include these three greenhouse gases as a minimum (Dolan and Heath, 2012;
Ecoinvent, 2010; Vestas, 2006; Wagner et al., 2011; Wang and Sun, 2012; Weinzettel et al., 2009).
The rest of this sensitivity analysis involved varying the input data (quantities of input material), distances, capacity
factor and design life by ±10%; this found that location was not a significant source of variation in the carbon
emissions, but the others were. (Note that this analysis did not consider the impact of variations in the system
boundary.) Recently the National Renewable Energy Laboratory (NREL) in the USA carried out a comprehensive
review and harmonisation of life cycle carbon emission studies for offshore wind, and examined the impact of
adjusting the published carbon emissions estimates to consistent system boundaries (in terms of major life cycle
stages), emissions factors, capacity factors and system lifetimes (Dolan and Heath, 2012), concluding that
variations in the capacity factor had the greatest impact on the results. It is important to note that capacity factor
and system lifetime are a function of the specific design and location of each wind farm, and are therefore likely to
vary between farms. Good quality studies should include a sensitivity and uncertainty analysis to test the
robustness of the results and their sensitivity to variations in methodology and key assumptions (ISO, 2006a; ISO,
2006b); estimates of life cycle emissions should be presented with uncertainty ranges.
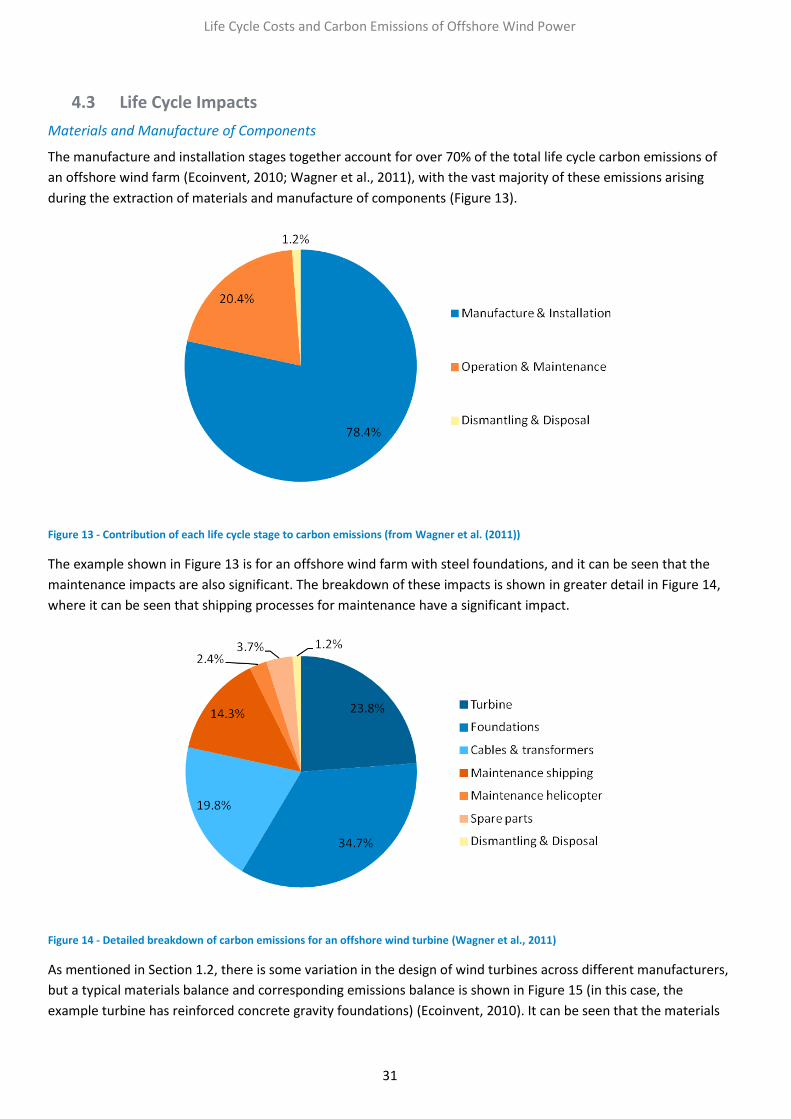
Life Cycle Costs and Carbon Emissions of Offshore Wind Power
31
4.3 Life Cycle Impacts
Materials and Manufacture of Components
The manufacture and installation stages together account for over 70% of the total life cycle carbon emissions of
an offshore wind farm (Ecoinvent, 2010; Wagner et al., 2011), with the vast majority of these emissions arising
during the extraction of materials and manufacture of components (Figure 13).
Figure 13 - Contribution of each life cycle stage to carbon emissions (from Wagner et al. (2011))
The example shown in Figure 13 is for an offshore wind farm with steel foundations, and it can be seen that the
maintenance impacts are also significant. The breakdown of these impacts is shown in greater detail in Figure 14,
where it can be seen that shipping processes for maintenance have a significant impact.
Figure 14 - Detailed breakdown of carbon emissions for an offshore wind turbine (Wagner et al., 2011)
As mentioned in Section 1.2, there is some variation in the design of wind turbines across different manufacturers,
but a typical materials balance and corresponding emissions balance is shown in Figure 15 (in this case, the
example turbine has reinforced concrete gravity foundations) (Ecoinvent, 2010). It can be seen that the materials

Life Cycle Costs and Carbon Emissions of Offshore Wind Power
32
used in the foundations and ground works dominate the mass balance, but contribute relatively little to the total
carbon emissions of this stage; in this example, the turbine tower is made of steel plate, contributing 50% to the
total emissions of material extraction and manufacture.
Figure 15 - Materials balance for a wind farm by mass and carbon emissions
Transport and Installation
In the example shown in Figure 13, the transport and installation stage is included with the impacts of the
manufacturing stage; however, it is likely that these will be relatively high – as they will comprise shipping
operations which, as shown in Figure 14, have a significant impact on carbon emissions. No studies have been
identified that explicitly state the impacts of transport and installation for offshore wind turbines. Furthermore,
the emissions due to impacts on the marine environment and seabed have not been considered in any of the
studies identified in the preparation of this briefing paper.
Operation and Maintenance
As discussed in Section 1.2, most of the carbon emissions that arise during the operational stage of a wind farm
are attributable to maintenance activities - contributing around 20% to the total life cycle impacts of the wind farm
(Figure 13 and Figure 14). The challenge of accessing offshore wind farms means that the carbon emissions
associated with their maintenance are much higher than for their onshore counterparts. Maintenance activities
considered in existing published studies typically include the renovation or replacement of the gearboxes,
generators and transformers.
As discussed in Section 4.2, the assumed operational capacity factor and lifetime of a wind farm can significantly
influence the estimated life cycle carbon emissions. The capacity factor is the average annual power output
described as a proportion of the maximum possible output if the farm is generating at its rated output for the
whole year; in their review of existing carbon emissions estimates for offshore wind farms, (Dolan and Heath,
2012) found the mean assumed capacity factor to be 40%, which is slightly higher than the reported value for 2013
of 39% (DECC, 2014), suggesting that the true carbon emissions of offshore wind in the UK might be a little higher
than the estimates provided by (Dolan and Heath, 2012).

Life Cycle Costs and Carbon Emissions of Offshore Wind Power
33
The operational lifetime of a wind farm will vary, but most turbines have a design life of 20 years (Vestas, 2006),
and farms in the UK are often built on seabed with a fixed-term lease and planning permission of 20 years
(Mathers, 2013), so this is considered a reasonable estimate.
Decommissioning
Typically, it is estimated that the decommissioning stage contributes 1% to the total life cycle carbon emissions of
a wind turbine. The impacts or credits of recycling can, however, introduce some significant variation to carbon
emissions estimates at this stage, due to varying assumptions about the use of recycled materials and the
recyclability of any waste.
As discussed in Section 4.2 and Appendix 1, there are different ways in which the impacts (or credits) of recycling
are dealt with when assessing the life cycle emissions of a wind turbine, as recycled materials may be used in the
initial manufacturing stage, and materials may also be recycled at the end-of-life. Both of these practices may
affect the costs and emissions at both the manufacturing and decommissioning stages, but are open to double-
counting. Furthermore, irrespective of which recycling method is used, assumptions about the end-of-life
recyclability will affect the costs and emissions associated with disposal of the waste materials, as recycled
material will not need to undergo waste treatment. The majority of studies do not explicitly state the emissions
savings due to assumptions about recycling; however, in a study of an onshore turbine this was examined, and it
was found that the inclusion of recycling credit (using the recycled content method) decreased the overall carbon
emissions by 44% (Guezuraga et al., 2012).
4.4 Summary
A range of stakeholders have examined the life cycle emissions of wind power, including (but not limited to)
turbine manufacturers (Vestas, 2006), wind farm operators (Vattenfall, 2013) and academics (Pehnt et al., 2008;
Schleisner, 2000; Wagner et al., 2011). While many robust and reliable studies exist, the quality of those published
does vary considerably - in a recent comprehensive review of the carbon emissions of wind power generation,
researchers at the National Renewable Energy Laboratory (NREL) in the USA identified 175 studies, of which only
41% passed their basic quality screening criteria (Dolan and Heath, 2012). This summary, therefore, only examines
a selection of the most robust and reliable carbon emissions estimates.
These estimates are summarised in Table 6, Figure 16 and Figure 17. It can be seen that there is considerable
variation in these values; however, they are all significantly lower than estimates of the carbon emissions of gas- or
coal-fired conventional generation (typically around 500 and 1000g CO2eq/kWh respectively). The lowest
estimates are published by Vestas and Wang (Vestas, 2006; Wang and Sun, 2012). These low estimates can be
attributed to a high assumed capacity factor, along with particular methodological choices in the analysis, such as:
the exclusion of processes, like transport, that were thought to have negligible impact; the consideration of only
carbon dioxide instead of all greenhouse gases; and the assumption that the emissions due to electricity
consumption in manufacturing are particularly low due to the use of wind power at Vestas factories. In contrast,
the study by Wagner produces a particularly high estimate of the carbon emissions (Wagner et al., 2011). This
study is based on a real wind farm, and applies a particularly conservative maintenance regime, as well as
assuming steel foundations. It is likely that the high carbon emissions estimate is due to a combination of the high
impact of steel relative to concrete, and the significant impact of shipping and helicopter operations for
maintenance.

Life Cycle Costs and Carbon Emissions of Offshore Wind Power
34
Figure 16 - Selection of carbon emissions estimates for different turbine ratings
Figure 17 – Selection of carbon emissions estimates for different assumed capacity factors
Figure 16 and Figure 17 also demonstrate that the variation between studies does not show any strong
relationship between carbon emissions and turbine rating or assumed capacity factor.
In order to develop a better understanding of these variations and provide a more robust estimate of the carbon
emissions of offshore wind, NREL carried out a review and harmonisation of existing studies - the most
comprehensive analysis of the existing body of knowledge on the carbon emissions of wind power to date (Dolan
and Heath, 2012). This study included a systematic review of over 200 published estimates of the carbon emissions
of wind power, to identify the most robust and reliable studies, and then carried out harmonisation to align
methodological inconsistencies, with the aim of enabling comparison between studies while still maintaining
variations introduced by each study's unique perspective; only key areas were harmonised, including capacity
factors, system boundaries and functional units.

Life Cycle Costs and Carbon Emissions of Offshore Wind Power
35
Device Rating (MW)
Capacity factor (%)
Design life (years)
Carbon emissions (g CO2eq/kWh)
Type of Analysis References
Nordic wind farms Mixed 32 (19 to 44)
20 14 Environmental Product Declaration
(Vattenfall, 2013)
Vestas v90 farm 3.0 54.16 20 5.23 Process LCA (Vestas, 2006)
Alpha Ventus wind farm 5 44 20 32 Process LCA (Wagner et al., 2011)
Offshore farm (Vestas v90) 3 54.16 20 5.98 Process LCA (Wang and Sun, 2012)
Floating power plant (Recycled content method) 5 53 20 11.52 Process LCA (Weinzettel et al., 2009)
Floating power plant (Closed loop method) 5 53 20 12.24 Process LCA (Weinzettel et al., 2009)
Single turbine in Baltic Sea 2 30 20 13 Process LCA (Jungbluth et al., 2005)
Offshore wind farm 2 30 20 14.4 Process LCA (Ecoinvent, 2010; IPCC, 2007)
Danish wind farm 0.5 29 20 16.5 Process LCA (Schleisner, 2000)
Mean Mixed Mixed Mixed 13 Review (Dolan and Heath, 2012)
Harmonised mean Mixed 40 20 12 Review and harmonisation (Dolan and Heath, 2012)
Median Mixed Mixed Mixed 12 Review (Dolan and Heath, 2012)
Harmonised median Mixed 40 20 11 Review and harmonisation (Dolan and Heath, 2012)
Table 6 - Carbon emissions estimates for offshore wind power generation (low outliers are highlighted in blue, high outliers in orange)

Life Cycle Costs and Carbon Emissions of Offshore Wind Power
36
The results of this analysis are shown in Figure 18. Note that these statistical results only show the distributions of
existing life cycle carbon emissions estimates, and are not, therefore, indicative of their accuracy, just their
comparability. It is of significance, however, that this study concluded that “the large number of previously
published life cycle GHG emission estimates of wind power systems and their tight distribution suggest that new
process-based LCAs of similar wind turbine technologies are unlikely to differ greatly” (Dolan and Heath, 2012).
Figure 18 - Range of carbon emissions of offshore wind farms, before and after harmonisation (Dolan and Heath, 2012)
This work also found that harmonisation of the capacity factor had the most significant impact on the results,
which will be important for real wind farms with their own, individual, capacity factors. NREL assumed a capacity
factor of 40% for offshore wind farms, and adjusted the published estimates accordingly (Dolan and Heath, 2012).
The following equation may be used to adjust the estimated carbon emissions for a known capacity factor:
where E is the life cycle carbon emissions and cf is the capacity factor.
Despite these variations in estimated carbon emissions of wind power generation, it is significant to note that
these are all significantly lower than for fossil fuelled generation. Figure 19 compares the values presented here
with those gathered by NREL for other types of generation (NREL, 2013a; Warner and Heath, 2012; Whitaker et al.,
2012), with the ranges showing the maximum range of published estimates. There is no overlap between offshore
wind generation and any type of fossil fuelled generation.

Life Cycle Costs and Carbon Emissions of Offshore Wind Power
37
Figure 19 - Comparison of carbon emissions of offshore wind with other types of generation
Key Messages
This report considers only a selection of the most reliable and robust published studies.
Significant variations to carbon emissions estimates are introduced by uncertainties in raw data,
assumed capacity factor and design life, and the way that recycling is dealt with.
There is disagreement over whether process-based analyses or hybrid methods (which use input-
output data) are the most reliable. No hybrid studies have been identified for offshore wind.
The lowest estimates are published by Vestas (2006) and Wang and Sun (2012), due to a high assumed
capacity factor, consideration of carbon dioxide only and low assumed impacts for electricity
consumption.
Wagner et al. (2011) produced the highest estimate of carbon emissions due to high impacts from a
particularly conservative maintenance regime, and higher impacts from steel foundations.
A comprehensive review and harmonisation of published carbon emissions estimates for offshore
wind power published by Dolan and Heath (2012) found that credible estimates of the carbon
emissions for offshore wind range from 7 to 23g CO2eq/kWh.
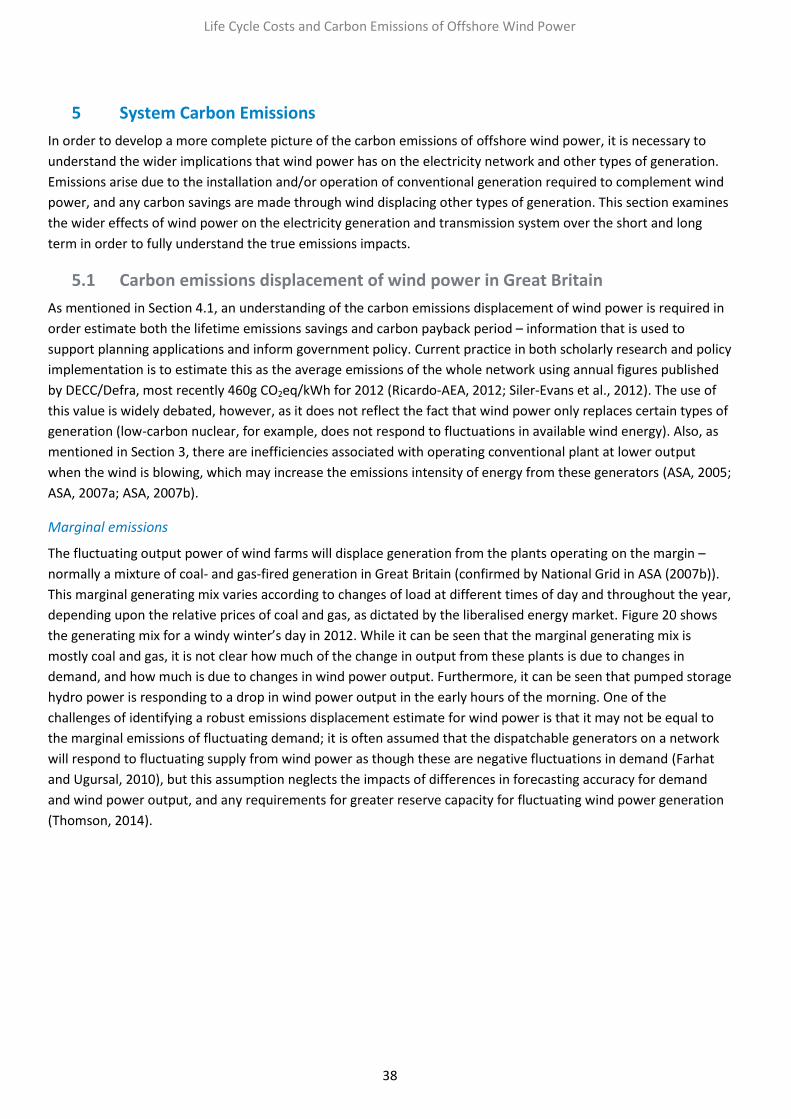
Life Cycle Costs and Carbon Emissions of Offshore Wind Power
38
5 System Carbon Emissions
In order to develop a more complete picture of the carbon emissions of offshore wind power, it is necessary to
understand the wider implications that wind power has on the electricity network and other types of generation.
Emissions arise due to the installation and/or operation of conventional generation required to complement wind
power, and any carbon savings are made through wind displacing other types of generation. This section examines
the wider effects of wind power on the electricity generation and transmission system over the short and long
term in order to fully understand the true emissions impacts.
5.1 Carbon emissions displacement of wind power in Great Britain
As mentioned in Section 4.1, an understanding of the carbon emissions displacement of wind power is required in
order estimate both the lifetime emissions savings and carbon payback period – information that is used to
support planning applications and inform government policy. Current practice in both scholarly research and policy
implementation is to estimate this as the average emissions of the whole network using annual figures published
by DECC/Defra, most recently 460g CO2eq/kWh for 2012 (Ricardo-AEA, 2012; Siler-Evans et al., 2012). The use of
this value is widely debated, however, as it does not reflect the fact that wind power only replaces certain types of
generation (low-carbon nuclear, for example, does not respond to fluctuations in available wind energy). Also, as
mentioned in Section 3, there are inefficiencies associated with operating conventional plant at lower output
when the wind is blowing, which may increase the emissions intensity of energy from these generators (ASA, 2005;
ASA, 2007a; ASA, 2007b).
Marginal emissions
The fluctuating output power of wind farms will displace generation from the plants operating on the margin –
normally a mixture of coal- and gas-fired generation in Great Britain (confirmed by National Grid in ASA (2007b)).
This marginal generating mix varies according to changes of load at different times of day and throughout the year,
depending upon the relative prices of coal and gas, as dictated by the liberalised energy market. Figure 20 shows
the generating mix for a windy winter’s day in 2012. While it can be seen that the marginal generating mix is
mostly coal and gas, it is not clear how much of the change in output from these plants is due to changes in
demand, and how much is due to changes in wind power output. Furthermore, it can be seen that pumped storage
hydro power is responding to a drop in wind power output in the early hours of the morning. One of the
challenges of identifying a robust emissions displacement estimate for wind power is that it may not be equal to
the marginal emissions of fluctuating demand; it is often assumed that the dispatchable generators on a network
will respond to fluctuating supply from wind power as though these are negative fluctuations in demand (Farhat
and Ugursal, 2010), but this assumption neglects the impacts of differences in forecasting accuracy for demand
and wind power output, and any requirements for greater reserve capacity for fluctuating wind power generation
(Thomson, 2014).

Life Cycle Costs and Carbon Emissions of Offshore Wind Power
39
Figure 20 - Stacked demand curve for 9th
December 2012 (Elexon, 2013a)
Efficiency penalties
Conventional dispatchable power stations will operate at part load in response to an increase in wind power
availability, or to provide additional reserve capacity to cope with any sudden drops in wind speed. Another
complexity of estimating the marginal emissions displacement of wind power is that there are significant efficiency
penalties associated with operating these power stations at such reduced outputs, illustrated in Figure 21. The
emissions intensity of these generators, therefore, increases due to the presence of wind generation on the
network (Figure 22). This effect has led to some reports that wind power generation actually results in an increase
in carbon emissions (Lea, 2012; Udo, 2011), but this is incorrect – while the carbon emissions per unit of energy
output does increase, overall the total emissions still decrease with decreasing output (represented by the solid
lines in Figure 23). The effect of the efficiency penalties is to decrease the magnitude of these emissions savings,
and reduce the gradient of the total emissions curve; this is illustrated by the two dotted lines showing the carbon
emissions if it is assumed that the power stations operate consistently at maximum efficiency. As conventional
generators operate at a lower efficiency when they are part loaded, their carbon emissions aren’t reduced by as
much as might be expected, but there is still an emissions saving. Studies of the marginal emissions of networks
around the world have demonstrated that the efficiency penalties do have an impact (Kaffine et al., 2011; Siler-
Evans et al., 2012; Thomson, 2014; Voorspools and D'Haeseleer, 2000), and therefore must be considered in an
accurate estimate of the carbon emissions displacement of wind power.

Life Cycle Costs and Carbon Emissions of Offshore Wind Power
40
Figure 21 - Efficiency penalties of coal and CCGT power stations (Thomson, 2014)
Figure 22 - Change in emissions intensities at part load (Thomson, 2014)
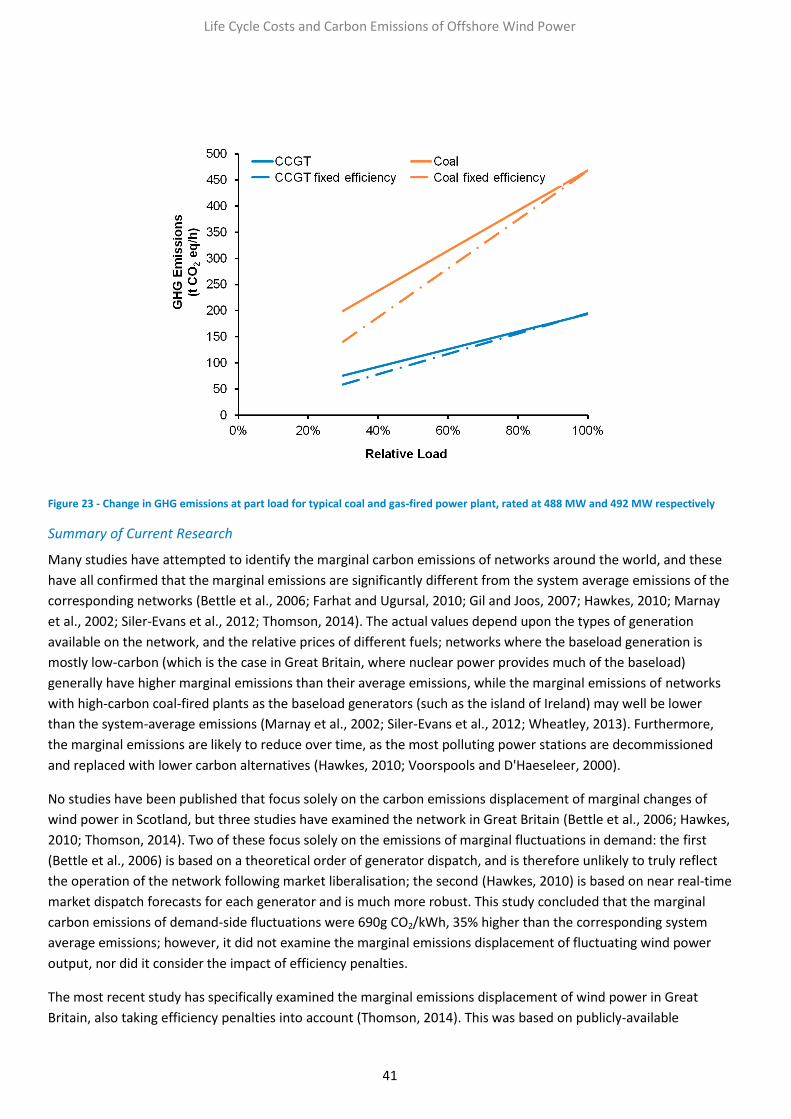
Life Cycle Costs and Carbon Emissions of Offshore Wind Power
41
Figure 23 - Change in GHG emissions at part load for typical coal and gas-fired power plant, rated at 488 MW and 492 MW respectively
Summary of Current Research
Many studies have attempted to identify the marginal carbon emissions of networks around the world, and these
have all confirmed that the marginal emissions are significantly different from the system average emissions of the
corresponding networks (Bettle et al., 2006; Farhat and Ugursal, 2010; Gil and Joos, 2007; Hawkes, 2010; Marnay
et al., 2002; Siler-Evans et al., 2012; Thomson, 2014). The actual values depend upon the types of generation
available on the network, and the relative prices of different fuels; networks where the baseload generation is
mostly low-carbon (which is the case in Great Britain, where nuclear power provides much of the baseload)
generally have higher marginal emissions than their average emissions, while the marginal emissions of networks
with high-carbon coal-fired plants as the baseload generators (such as the island of Ireland) may well be lower
than the system-average emissions (Marnay et al., 2002; Siler-Evans et al., 2012; Wheatley, 2013). Furthermore,
the marginal emissions are likely to reduce over time, as the most polluting power stations are decommissioned
and replaced with lower carbon alternatives (Hawkes, 2010; Voorspools and D'Haeseleer, 2000).
No studies have been published that focus solely on the carbon emissions displacement of marginal changes of
wind power in Scotland, but three studies have examined the network in Great Britain (Bettle et al., 2006; Hawkes,
2010; Thomson, 2014). Two of these focus solely on the emissions of marginal fluctuations in demand: the first
(Bettle et al., 2006) is based on a theoretical order of generator dispatch, and is therefore unlikely to truly reflect
the operation of the network following market liberalisation; the second (Hawkes, 2010) is based on near real-time
market dispatch forecasts for each generator and is much more robust. This study concluded that the marginal
carbon emissions of demand-side fluctuations were 690g CO2/kWh, 35% higher than the corresponding system
average emissions; however, it did not examine the marginal emissions displacement of fluctuating wind power
output, nor did it consider the impact of efficiency penalties.
The most recent study has specifically examined the marginal emissions displacement of wind power in Great
Britain, also taking efficiency penalties into account (Thomson, 2014). This was based on publicly-available

Life Cycle Costs and Carbon Emissions of Offshore Wind Power
42
measured output data combined with some market dispatch forecasts, and found that efficiency penalties did
reduce marginal emissions estimates, but that they remained higher than the corresponding system average
emissions; the marginal emissions displacement of wind power was found to be 560g CO2 eq/kWh for November
2008 to June 2013, 9% higher than the corresponding system average emissions. Significantly, the carbon
emissions associated with marginal changes in wind power output were found to be 7% lower than those for
demand, demonstrating that the network does respond differently to fluctuations in supply or demand. This study
also examined the annual carbon emissions, and found the marginal displacement of wind power to be 550g CO2
eq/kWh for 2012, a value that is 20% higher than the UK-average emissions for that year as reported by the
government (460g CO2 eq/kWh – (Ricardo-AEA, 2012)).
The findings of the study by Thomson (2014) are supported by analyses of similar networks in the USA, which
found similar results using empirical emissions and power output data published by the Environmental Protection
Agency (Kaffine et al., 2011; Siler-Evans et al., 2012); however, other studies have found very different findings.
One such study, recently published by Wheatley for the network in Ireland, found the marginal displacement of
wind power to be 280g CO2/kWh, much lower than the system average emissions of 520g CO2/kWh (Wheatley,
2013). Significantly, while the results of this study are of relevance when considering the marginal displacement of
wind power in the whole of the UK, these findings do not conflict with those of Thomson, as the Irish network is
very different to that in Great Britain and has a much higher penetration of wind power, no nuclear generators,
and coal as the baseload fuel.
There are also several other reports and papers that have gained prominence in the UK media and conflict with
the findings of the Thomson study. One of these is a report published by the think-tank Civitas, which suggests that
wind power is not effective in cutting CO2 emissions (Lea, 2012); firstly by highlighting that conventional
generation may suffer from efficiency penalties (an issue that was addressed in the study by Thomson); and
secondly by referring to a paper that found that fuel consumption of gas-fired plant increases when wind power is
connected to a network (le Pair, 2011b). The latter paper, however, which was published online rather than in a
peer-reviewed journal, has been widely criticised (Barnard, 2013; Carrington, 2012; Goggin, 2012; Hickman, 2012a;
Hickman, 2012b; MarkR, 2012; UKERC, 2012), as it contains flawed assumptions and examines a very simplistic
model that is not representative of any generation network around the world. The simplistic model used by le Pair
assumes that wind power only displaces generation from combined cycle gas turbines (CCGTs) and open cycle gas
turbines (OCGTs), but analyses of the real historical data from grids like that in Great Britain have found that wind
power mostly displaces a combination of CCGT and coal-fired plant, with OCGT output rarely being affected, a
conclusion supported by a statement from National Grid (ASA, 2007b; Kaffine et al., 2011; Thomson, 2014).
Furthermore, a significant variable (demand) has been fixed, which is highly unrealistic.
Even given the limitations of this model, calculation errors in the treatment of the dynamic effects of changing
wind power output on fuel consumption of the CCGT plant, and incorrect assumptions in calculating the impact of
life cycle emissions on the net emissions savings, further invalidate the results. A detailed review of this paper is
included in Appendix 3, and demonstrates that the correction of these errors results in a consistent decrease in
fuel consumption and carbon emissions of the associated gas-fired plants when operating with wind power
generation – completely opposite to le Pair’s own conclusion (le Pair, 2011b).
The carbon emissions displacement of wind power generation in Great Britain can, therefore, be approximated by
the UK-average annual emissions of the entire network, but this will underestimate the positive impacts of wind
power on carbon emissions. Robust studies, such as that published by Thomson (2014), do provide insight into the
true emissions displacement, but these are limited by their reliance on carbon emissions calculated from power
output data, rather than metered emissions data.

Life Cycle Costs and Carbon Emissions of Offshore Wind Power
43
5.2 Long-term impacts of infrastructure changes on carbon emissions and displacement
The review above considers only the carbon displacement in the short-term, on an hourly or minute-by-minute
basis. Over the longer term, there may be additional carbon emissions from the development of other generation
and infrastructure to complement an increased penetration of wind power on the network, as well as changes to
the potential emissions displacement as a result of changes to the generation mix.
As discussed in Section 3, increased penetration of wind farms on the grid are likely to lead to significant upgrades
to the existing network infrastructure, and their variable output will have an impact on the development and
commissioning of new different types of generation required on the rest of the network (the latter is also briefly
alluded to in Section 5.1 and Appendix 3, with regards to open-cycle or closed-cycle gas turbines). It is difficult to
isolate which infrastructure changes are attributable to wind farm developments, and no reliable studies have
been identified that consider this impact on carbon emissions. It is, however, worth noting that the impacts of
transmission losses on emissions have been found to far outweigh the impacts of the construction and
decommissioning of the network infrastructure itself (Harrison et al., 2010).
In contrast, there are many studies that examine the impact of long-term infrastructure changes and an increase in
wind capacity on the system carbon emissions – the average emissions of generation on the whole system. Studies
that examine wind power have focussed on identifying the “carbon abatement potential” of an increase in
installed wind capacity; such studies model possible future scenarios (some including planned developments to
other types of generation) in order to identify the marginal change in average emissions attributable to
incremental increases in wind penetration, including a consideration of the efficiency penalties of cycling or
increased start-up/shut-down of thermal generators (Delarue et al., 2009; Denny and O'Malley, 2006; Valentino et
al., 2012). All of these studies find that average emissions decrease with an increase in wind penetration; however,
the results of such studies cannot be used to estimate the future carbon displacement of wind power generation.
It is likely that large scale infrastructure changes will have a significant impact on the marginal and average
emissions of the National Grid in Great Britain, and therefore on the emissions displacement of wind power.
Thomson examined the trend in average emissions and marginal displacement of wind power from 2008 to 2013,
and found that both of these were significantly affected by a step change in the relative prices of coal and gas
towards the end of 2011, which resulted in a switch from coal to gas as the marginal generator, increasing the
average emissions of the grid and decreasing the marginal displacement of wind power compared to previous
years (see Figure 24) (Thomson, 2014). The marginal displacement estimate for 2012, however, did remain higher
than the average factor published by DECC (Ricardo-AEA, 2012).

Life Cycle Costs and Carbon Emissions of Offshore Wind Power
44
Figure 24 - Forecast trends in emission factor of the UK grid
Such fluctuations in relative prices are difficult to predict, and therefore studies attempting to identify the future
average and marginal emissions of networks have concentrated on either examining historical trends (Marnay et
al., 2002; Siler-Evans et al., 2012), or analysing different possible scenarios (Bettle et al., 2006; Farhat and Ugursal,
2010; Hawkes, 2010; Lund et al., 2010; Voorspools and D'Haeseleer, 2000). There have been several attempts to
forecast the different scenarios towards decarbonisation of the National Grid, and the resulting average emissions
of electricity generation are shown in Figure 24 (CCC, 2012; CCC, 2013; DECC, 2011b; DECC, 2013). These vary in
both the assumed rapidity of decarbonisation, and in the final targets. Furthermore, they do not reflect the change
in marginal emissions, although studies suggest that these will also decrease over time (Bettle et al., 2006;
Hawkes, 2010); however, these studies have been focussed on marginal changes in demand, so do not take into
account the possibility that networks might actively be managed so that wind power replaces the most carbon-
intensive forms of generation, and that the marginal displacement of wind power may be higher.
It is likely that the planned long-term reduction in average carbon emissions of the National Grid will lead to a
long-term reduction in carbon emissions displacement of wind power, in turn increasing the carbon payback
period of wind power generation, and thus the pressure for wind farm construction, maintenance and
decommissioning to have a low carbon footprint.

Life Cycle Costs and Carbon Emissions of Offshore Wind Power
45
Key Messages
Estimates of carbon emissions displacement are currently based on the average emissions of the
whole network – 460g CO2eq/kWh for 2012 (Ricardo-AEA, 2012).
Wind power will not replace all forms of generation equally and on the GB grid marginal emissions
displacement of wind is typically higher than average emissions.
While wind power reduces the efficiency of conventional fossil-fuelled plant, it serves to reduce
emissions savings a by a few percent and does not increase carbon emissions as some suggest (Lea,
2012; Udo, 2011).
An influential report by Civitas (Lea, 2012) suggesting that wind power is not effective at reducing CO2
emissions is based on flawed analysis by le Pair (2011b).
The most reliable recent estimate for the emissions displacement of wind power in Great Britain is
550g CO2eq/kWh for 2012 (Thomson, 2014), some 20% higher than ‘official’ estimates.

Life Cycle Costs and Carbon Emissions of Offshore Wind Power
46
6 Payback Periods and Lifetime Emissions Savings
6.1 Carbon Payback Period
The carbon payback period is the time for the carbon emissions displaced by wind power to equal the life cycle
carbon emissions of the wind farm. In order to achieve a net reduction in GHG emissions, the carbon payback
period should be significantly shorter than the intended lifetime. The payback period can be calculated using the
following equations (Thomson, 2014):
⁄
⁄
where tCpayback is the payback period, Elife is the total lifetime carbon emissions, Dyr is the annual emissions
displacement, D is the emissions displacement per kWh, E is the life cycle carbon emissions per unit of energy
output, Wout is the energy output, and L is the design life. Variations in either the calculated life cycle carbon
emissions or the emissions displacement can introduce variations to the carbon payback period. Table 7 shows
carbon payback estimates for a selection of studies, applying two different estimates of the emissions
displacement of wind power - the UK-average emissions for 2012 (460g CO2 eq/kWh (Ricardo-AEA, 2012)) , and the
marginal emissions displacement of wind power for 2012 (550g CO2 eq/kWh (Thomson, 2014)). The latter values
are illustrated graphically in Figure 25 and Figure 26. It can be seen that carbon payback is achieved in all cases
well within the typical design life, with all estimates falling within the first two years of operation
Figure 25 - Range of carbon payback estimates from selected studies
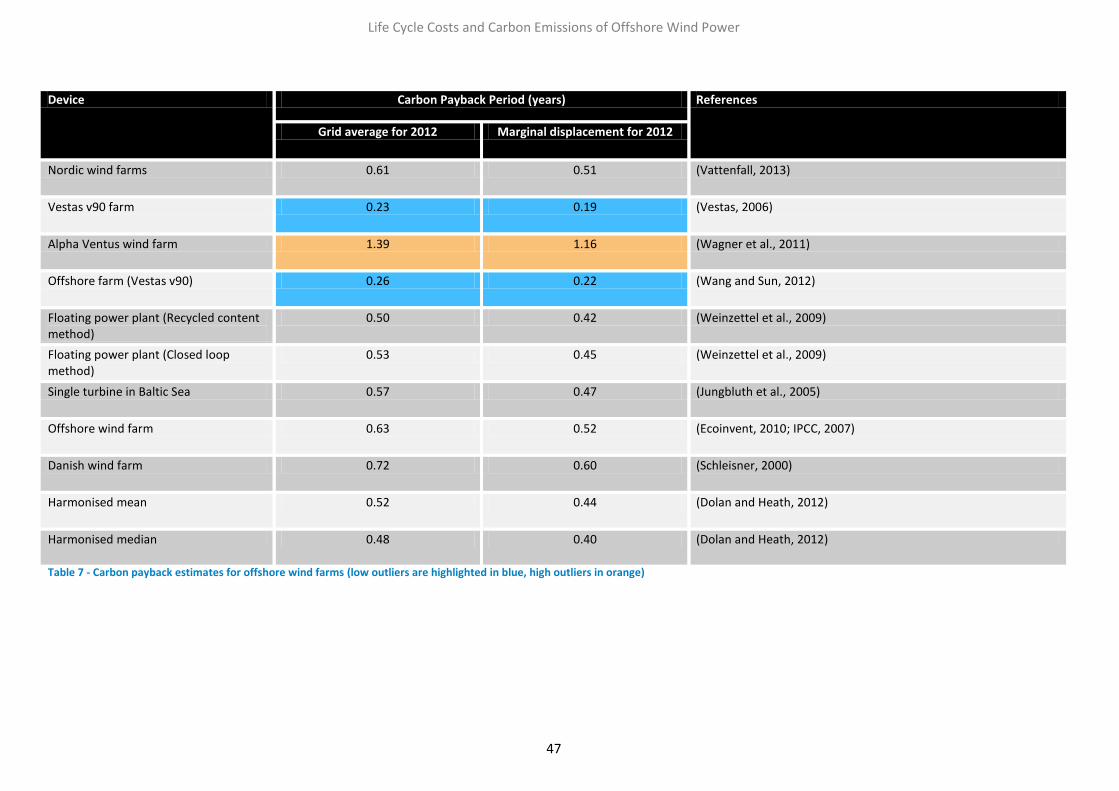
Life Cycle Costs and Carbon Emissions of Offshore Wind Power
47
Device Carbon Payback Period (years) References
Grid average for 2012 Marginal displacement for 2012
Nordic wind farms 0.61 0.51 (Vattenfall, 2013)
Vestas v90 farm 0.23 0.19 (Vestas, 2006)
Alpha Ventus wind farm 1.39 1.16 (Wagner et al., 2011)
Offshore farm (Vestas v90) 0.26 0.22 (Wang and Sun, 2012)
Floating power plant (Recycled content method)
0.50 0.42 (Weinzettel et al., 2009)
Floating power plant (Closed loop method)
0.53 0.45 (Weinzettel et al., 2009)
Single turbine in Baltic Sea 0.57 0.47 (Jungbluth et al., 2005)
Offshore wind farm 0.63 0.52 (Ecoinvent, 2010; IPCC, 2007)
Danish wind farm 0.72 0.60 (Schleisner, 2000)
Harmonised mean 0.52 0.44 (Dolan and Heath, 2012)
Harmonised median 0.48 0.40 (Dolan and Heath, 2012)
Table 7 - Carbon payback estimates for offshore wind farms (low outliers are highlighted in blue, high outliers in orange)
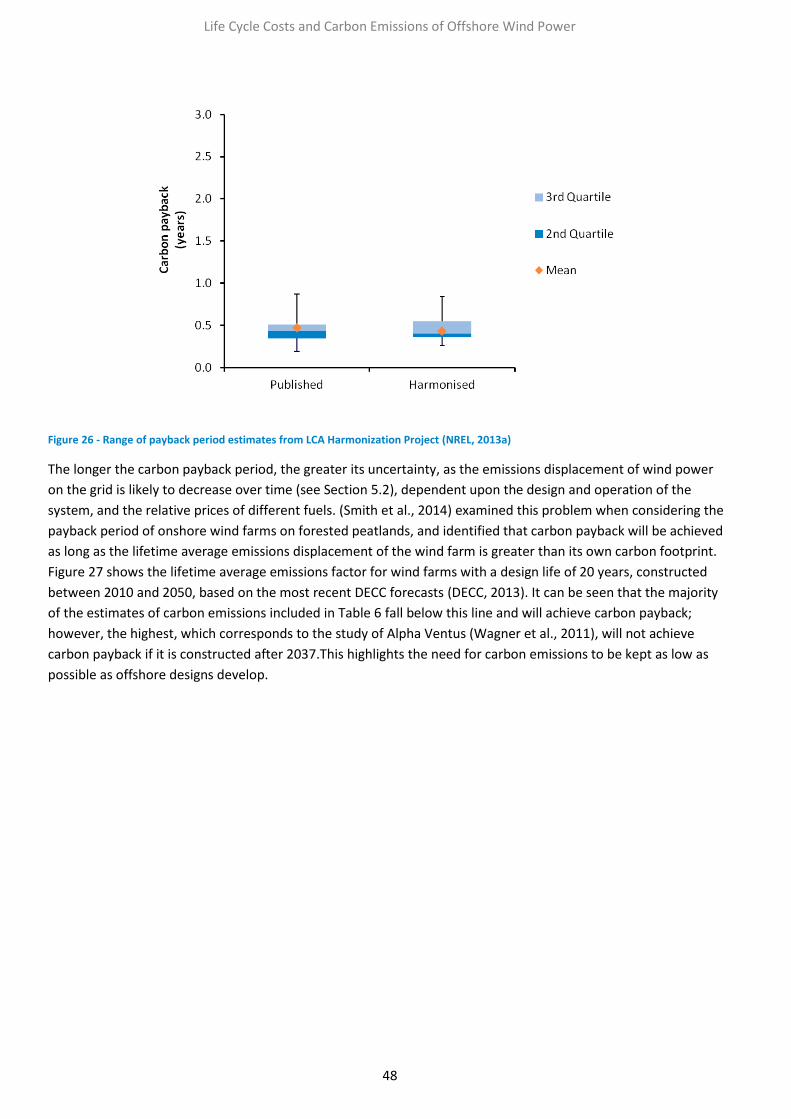
Life Cycle Costs and Carbon Emissions of Offshore Wind Power
48
Figure 26 - Range of payback period estimates from LCA Harmonization Project (NREL, 2013a)
The longer the carbon payback period, the greater its uncertainty, as the emissions displacement of wind power
on the grid is likely to decrease over time (see Section 5.2), dependent upon the design and operation of the
system, and the relative prices of different fuels. (Smith et al., 2014) examined this problem when considering the
payback period of onshore wind farms on forested peatlands, and identified that carbon payback will be achieved
as long as the lifetime average emissions displacement of the wind farm is greater than its own carbon footprint.
Figure 27 shows the lifetime average emissions factor for wind farms with a design life of 20 years, constructed
between 2010 and 2050, based on the most recent DECC forecasts (DECC, 2013). It can be seen that the majority
of the estimates of carbon emissions included in Table 6 fall below this line and will achieve carbon payback;
however, the highest, which corresponds to the study of Alpha Ventus (Wagner et al., 2011), will not achieve
carbon payback if it is constructed after 2037.This highlights the need for carbon emissions to be kept as low as
possible as offshore designs develop.
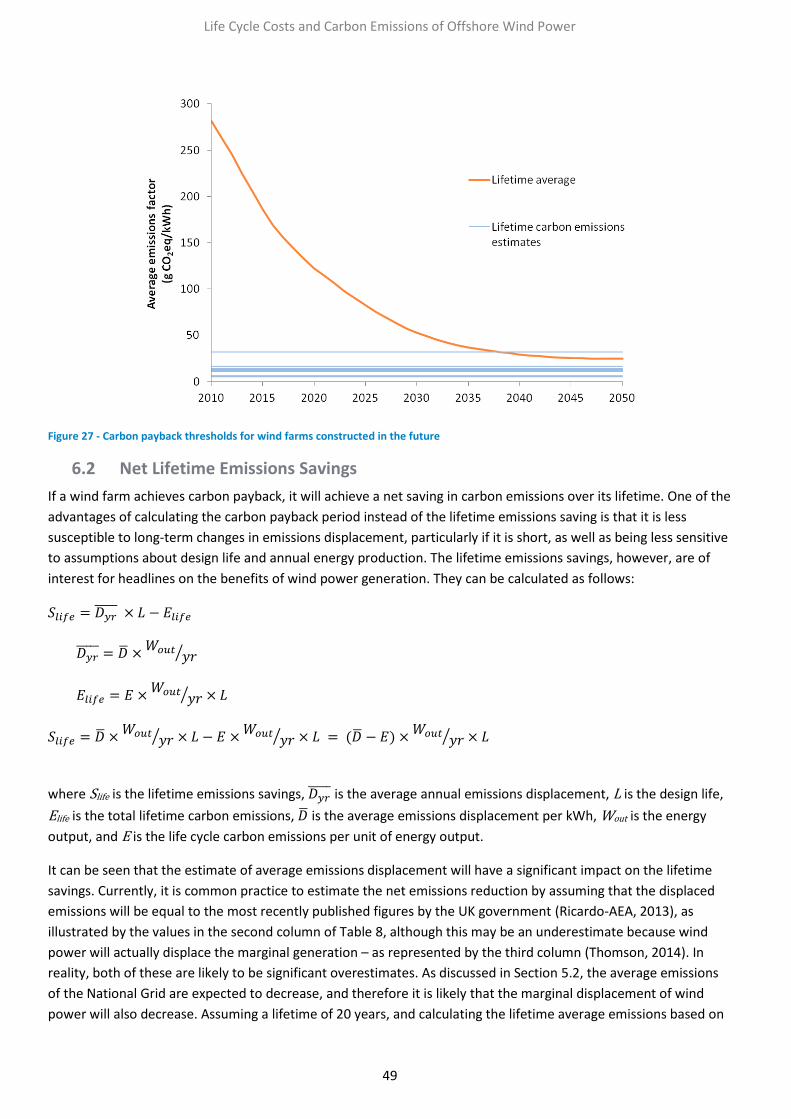
Life Cycle Costs and Carbon Emissions of Offshore Wind Power
49
Figure 27 - Carbon payback thresholds for wind farms constructed in the future
6.2 Net Lifetime Emissions Savings
If a wind farm achieves carbon payback, it will achieve a net saving in carbon emissions over its lifetime. One of the
advantages of calculating the carbon payback period instead of the lifetime emissions saving is that it is less
susceptible to long-term changes in emissions displacement, particularly if it is short, as well as being less sensitive
to assumptions about design life and annual energy production. The lifetime emissions savings, however, are of
interest for headlines on the benefits of wind power generation. They can be calculated as follows:
⁄
⁄
⁄
⁄
⁄
where Slife is the lifetime emissions savings, is the average annual emissions displacement, L is the design life,
Elife is the total lifetime carbon emissions, is the average emissions displacement per kWh, Wout is the energy
output, and E is the life cycle carbon emissions per unit of energy output.
It can be seen that the estimate of average emissions displacement will have a significant impact on the lifetime
savings. Currently, it is common practice to estimate the net emissions reduction by assuming that the displaced
emissions will be equal to the most recently published figures by the UK government (Ricardo-AEA, 2013), as
illustrated by the values in the second column of Table 8, although this may be an underestimate because wind
power will actually displace the marginal generation – as represented by the third column (Thomson, 2014). In
reality, both of these are likely to be significant overestimates. As discussed in Section 5.2, the average emissions
of the National Grid are expected to decrease, and therefore it is likely that the marginal displacement of wind
power will also decrease. Assuming a lifetime of 20 years, and calculating the lifetime average emissions based on

Life Cycle Costs and Carbon Emissions of Offshore Wind Power
50
the latest DECC forecasts (DECC, 2013), the net emissions savings estimates for wind farms constructed in 2015,
2020 and 2030 are shown in columns 3, 4 and 5 respectively. It can be seen that these are considerably lower than
might be expected from current figures, although a net emissions saving is still achieved. The considerable
variation in emissions savings from one carbon footprinting study to the next is largely due to the different sizes of
wind turbine, as illustrated in Figure 28.
Figure 28 - Net emissions savings as a function of turbine rating
Although Figure 28 highlights the uncertainty of estimating the net emissions savings over the entire lifetime of a
wind farm, it also demonstrates that wind power does reduce carbon emissions, and new farms will continue to do
so. An analysis has been carried out on the existing installed wind capacity in Great Britain, using metered output
data, and has shown that the emissions displacement between November 2008 and June 2013 offset all of the
lifecycle carbon emissions of the existing farms, and was responsible for a further emissions reduction of 18 – 20
Mt CO2eq (Thomson, 2014).
Key Messages
In order to achieve a net reduction in carbon emissions, the carbon payback period should be
significantly shorter than the intended wind farm lifetime (typically 20 years).
Harmonised estimates for offshore wind range from 5 months to a year, with outliers being as high as 1
year 5 months, based on 2012 values.
When expected decrease in grid-average emissions is taken into account, almost all current lifecycle
emissions estimates indicate payback will be achieved within the farm lifetime up to construction in
2050, with the exception of the study of Alpha Ventus (Wagner et al. 2011) which has particularly
conservative assumptions.
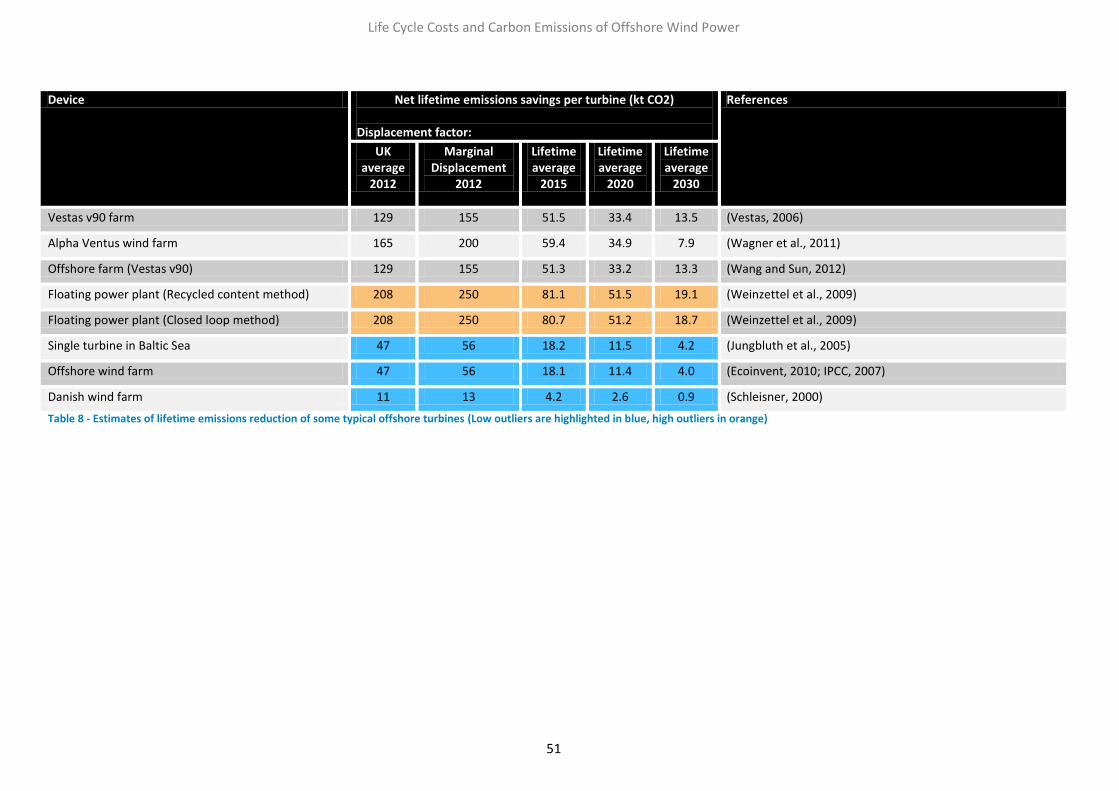
Life Cycle Costs and Carbon Emissions of Offshore Wind Power
51
Device Net lifetime emissions savings per turbine (kt CO2) Displacement factor:
References
UK average
2012
Marginal Displacement
2012
Lifetime average
2015
Lifetime average
2020
Lifetime average
2030
Vestas v90 farm 129 155 51.5 33.4 13.5 (Vestas, 2006)
Alpha Ventus wind farm 165 200 59.4 34.9 7.9 (Wagner et al., 2011)
Offshore farm (Vestas v90) 129 155 51.3 33.2 13.3 (Wang and Sun, 2012)
Floating power plant (Recycled content method) 208 250 81.1 51.5 19.1 (Weinzettel et al., 2009)
Floating power plant (Closed loop method) 208 250 80.7 51.2 18.7 (Weinzettel et al., 2009)
Single turbine in Baltic Sea 47 56 18.2 11.5 4.2 (Jungbluth et al., 2005)
Offshore wind farm 47 56 18.1 11.4 4.0 (Ecoinvent, 2010; IPCC, 2007)
Danish wind farm 11 13 4.2 2.6 0.9 (Schleisner, 2000)
Table 8 - Estimates of lifetime emissions reduction of some typical offshore turbines (Low outliers are highlighted in blue, high outliers in orange)
Life Cycle Costs and Carbon Emissions of Offshore Wind Power
52
7 Conclusions
While levelised cost and life cycle carbon analysis is well established with clear methodologies, there is scope
within these to create quite large variations in headline figures for offshore wind power.
For levelised cost of energy estimates, the most important factors are capital cost of turbines, capacity factor of
offshore wind, and financing assumptions – specifically the discount rate. There are a substantial number of
different ways of expressing these key factors, which makes comparison challenging. Although a full harmonisation
of factors was not carried out in this review, cost estimates were corrected for exchange rate and inflation changes
to allow comparison. There was a modest range of estimates of capital cost, although this review found that
recent studies for DECC and the CCC are broadly comparable, and that UK estimates are average internationally. In
levelised cost estimates there was again a spread, but with UK-focused studies showing costs that were higher, on
average, than international work. This can largely be attributed to the use of simplified LCOE methodologies and
above average discount rates. Several cost estimates were much higher than others, and these were found to be
largely down to the inclusion of ‘system costs’.
It is customary for levelised cost of energy calculations to not include ‘system effects’. The review found that
system costs arising from accommodating wind (balancing, provision of backup and transmission) do exist, but at
relatively modest levels that are not prohibitive when compared to overall costs of delivering electricity supplies,
or the levelised cost of wind power itself. The review found that studies that did include system costs in the
levelised cost analysis tended to systematically overestimate them, and suffered from a number of methodological
flaws. There is no issue methodologically in including system costs, but credible approaches must be applied and
other factors that are also not generally included in LCOE, such as external costs, should also be considered.
At present, the range of levelised costs for offshore wind is substantially above that of nuclear, combined cycle gas
turbines, and onshore wind; however, there are very substantial potential cost reduction opportunities for
offshore wind, although there is some uncertainty as to the extent of reductions that are actually possible.
For life cycle carbon emissions the most important aspects are the materials used in manufacturing, the wind farm
capacity factor, the extent of vessel use for installation and maintenance, the approach to recycling credits, and
the uncertainty in emissions factors. Extensive use was made of a recent harmonisation project which allowed
different studies to be compared. While there is uncertainty associated with estimates of lifecycle emissions,
offshore wind is substantially lower than unabated gas and coal generation, and there are fewer inherent
uncertainties than nuclear.
Lifecycle carbon emissions also generally exclude ‘system effects’ but the literature showed that, although
efficiency penalties associated with operating thermal generation at less than full load exist, the effect is modest.
Offshore wind generation is, therefore, effective at displacing fossil fuelled generation and reducing emissions;
carbon payback periods are typically less than a year. Long term, the expectation is that offshore wind will remain
effective at reducing emissions, even within an electricity system undergoing major decarbonisation.
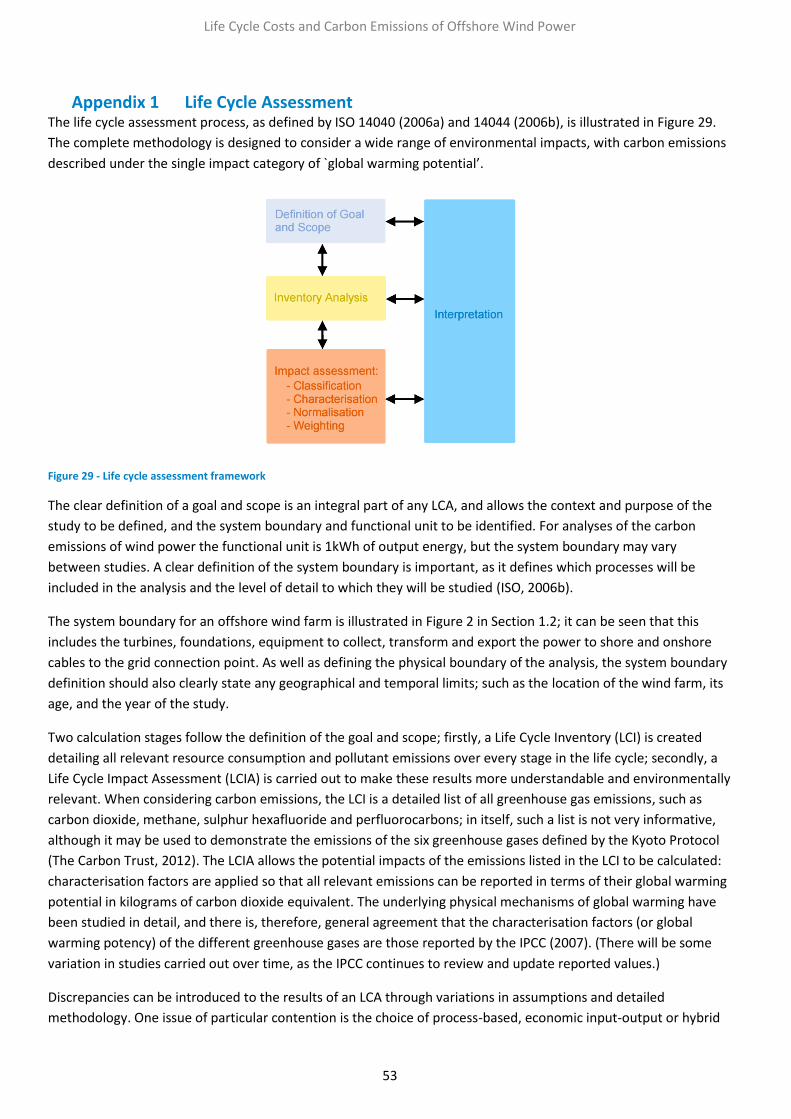
Life Cycle Costs and Carbon Emissions of Offshore Wind Power
53
Appendix 1 Life Cycle Assessment The life cycle assessment process, as defined by ISO 14040 (2006a) and 14044 (2006b), is illustrated in Figure 29.
The complete methodology is designed to consider a wide range of environmental impacts, with carbon emissions
described under the single impact category of `global warming potential’.
Figure 29 - Life cycle assessment framework
The clear definition of a goal and scope is an integral part of any LCA, and allows the context and purpose of the
study to be defined, and the system boundary and functional unit to be identified. For analyses of the carbon
emissions of wind power the functional unit is 1kWh of output energy, but the system boundary may vary
between studies. A clear definition of the system boundary is important, as it defines which processes will be
included in the analysis and the level of detail to which they will be studied (ISO, 2006b).
The system boundary for an offshore wind farm is illustrated in Figure 2 in Section 1.2; it can be seen that this
includes the turbines, foundations, equipment to collect, transform and export the power to shore and onshore
cables to the grid connection point. As well as defining the physical boundary of the analysis, the system boundary
definition should also clearly state any geographical and temporal limits; such as the location of the wind farm, its
age, and the year of the study.
Two calculation stages follow the definition of the goal and scope; firstly, a Life Cycle Inventory (LCI) is created
detailing all relevant resource consumption and pollutant emissions over every stage in the life cycle; secondly, a
Life Cycle Impact Assessment (LCIA) is carried out to make these results more understandable and environmentally
relevant. When considering carbon emissions, the LCI is a detailed list of all greenhouse gas emissions, such as
carbon dioxide, methane, sulphur hexafluoride and perfluorocarbons; in itself, such a list is not very informative,
although it may be used to demonstrate the emissions of the six greenhouse gases defined by the Kyoto Protocol
(The Carbon Trust, 2012). The LCIA allows the potential impacts of the emissions listed in the LCI to be calculated:
characterisation factors are applied so that all relevant emissions can be reported in terms of their global warming
potential in kilograms of carbon dioxide equivalent. The underlying physical mechanisms of global warming have
been studied in detail, and there is, therefore, general agreement that the characterisation factors (or global
warming potency) of the different greenhouse gases are those reported by the IPCC (2007). (There will be some
variation in studies carried out over time, as the IPCC continues to review and update reported values.)
Discrepancies can be introduced to the results of an LCA through variations in assumptions and detailed
methodology. One issue of particular contention is the choice of process-based, economic input-output or hybrid

Life Cycle Costs and Carbon Emissions of Offshore Wind Power
54
methodologies. Process-based LCA is the methodology most clearly described by ISO 14040 and 14044, and
involves systematically analysing the emissions associated with each process involved in the product life cycle (ISO,
2006a; ISO, 2006b).This process is limited by the application of a system boundary, however, and therefore wider
impacts associated with the transport of staff to and from their workplace, or the impacts of ancillary services such
as human resources, legal departments and insurance, are ignored (Baumann and Tillman, 2004). An alternative
option for such analyses is to use economic input-output methodologies, which are usually based on input-output
tables developed from national average statistics that model the financial flows between sectors of the economy
(Crawford, 2005). The challenge of using such data for individual processes, such as the life cycle of a wind farm, is
that they are generally at industry level, so hybrid methods have been developed that combine the detail of
process-based methodologies with data derived from input-output tables. This should encompass all of the
impacts associated with a given process, and thus eliminate any cut-off imposed by the system boundary
(Crawford, 2005; Lenzen and Munksgaard, 2002; Wiedmann et al., 2011); however, there is some suggestion that
double-counting of impacts is a problem, and that the results of hybrid studies may by significant over-estimates
(Davidsson et al., 2012).
Another significant variation in LCA methodology, particularly for process-based analyses, is the choice of recycling
allocation method. The carbon emissions associated with the manufacture of a product, such as a wind turbine,
may be reduced by both using recycled materials in the manufacturing stage, and recycling any waste materials at
the end-of-life. Allocating an emissions reduction, or credit, to the wind turbine for both of these activities may
result in double-counting (waste steel from one wind turbine may be recycled and used in the manufacture of
another wind turbine) (Hammond and Jones, 2010; Thomson, 2014). There are, therefore, two principal recycling
allocation methods recognised by the literature: the recycled content method and the closed-loop approximation
method (ISO, 2013; WRI and WBCSD, 2011). The former allows for recycling credit only to be applied at the
manufacturing stage for the use of recycled materials; at the end-of-life stage the recycling of waste material only
results in avoiding the emissions associated with long-term disposal of this waste. The latter is a method for
considering only the emissions reductions associated with end-of-life recycling, and requires that no credit is given
for recycled material is used in the manufacture of the turbine. (A third method, the 50:50 method, is sometimes
used. This was developed to encourage both the use of recycled material and the practice of designing for greatest
end-of-life recyclability, and simply takes 50% of the credit from the recycled content method, and 50% of the
credit from the closed-loop approximation method (Hammond and Jones, 2010). It was applied in the study by
Thomson (2014), referenced in Section 4.2.)

Life Cycle Costs and Carbon Emissions of Offshore Wind Power
55
Appendix 2 Design of Wind Turbines and Farms The principal components of a wind turbine are illustrated in Figure 3 in Section 1.2. Energy is extracted from the
wind by rotor blades, attached to the hub - this assembly is referred to as the turbine or rotor. The hub is mounted
on the front of the nacelle, with the shaft of the turbine connected to a generator inside the nacelle, normally via a
gearbox that allows the turbine’s speed of 6-30 rpm to be converted to 1500 rpm for the generator. The generator
produces electricity at 400 - 1000V, which is transformed to the local transmission voltage before being
distributed. The nacelle also contains the yaw system, hydraulic systems and cables. The main supporting structure
is the tower, and a gearing system between the nacelle and tower allows the turbine to be automatically turned
towards the prevailing wind (Vattenfall, 2013). For offshore wind turbines, electrical switchgear and a transformer
are usually located in the nacelle (Vestas, 2006). Offshore turbine towers are mounted on a transmission piece,
which includes a landing platform for boats, and is, in turn, fixed to the foundations. Several different types of
offshore foundation exist, and the type used depends upon the turbine size, wind conditions, water depth,
geology, ice, waves and currents (Vattenfall, 2013). The turbines are all connected to an offshore transformer
station (typically consisting of a transformer, platform and foundations) that gathers and transforms the power for
export to shore (Vestas, 2006) - designs of such stations vary widely. The system boundary is typically the point of
connection with the existing onshore network at a substation, and therefore also includes the cable transmission
station where the offshore and onshore cables are connected.
Typical offshore foundations are described as follows:
Monopile - a steel tube that is driven or drilled into the seabed
Gravity foundation - a heavy concrete box, sometimes fitted with a ballast, that stabilises the tower and nacelle by its weight and friction against the seabed
Jacket - steel framework with four legs
Tripod - steel framework with three legs, and a fourth leg centred under the tower (Vattenfall, 2013).
Steel-based offshore foundations will need some form of corrosion protection – often a sacrificial anode, such as
aluminium, is used to provide cathodic corrosion prevention (Vestas, 2006).

Life Cycle Costs and Carbon Emissions of Offshore Wind Power
56
Appendix 3 Review of “Electricity in the Netherlands – Wind turbines increase fossil fuel consumption & CO2 emission”, C. le Pair, 2011
This paper (le Pair, 2011b), published online rather than in a peer-reviewed journal, has had a significant impact on
the wind farm debate in the UK, particularly due to its citation in a report by the think tank Civitas (Lea, 2012). The
analysis is, however, flawed, and is not representative of the situation in Great Britain. A detailed review of this
paper, with reference to the National Grid in Great Britain, is provided here. (Note that the situation in Northern
Ireland is different – as this network has a very different topology.)
A 3.1 Fuel Mix
The first assumption that is used as a basis for much of the analysis within this paper is that, when examining the
generation displaced by wind, “coal and nuclear plants are almost irrelevant … as they cannot be ramped up and
down sufficiently fast to follow wind variations” (le Pair, 2011b). This statement is incorrect for the network in
Great Britain; while coal and nuclear plants cannot be ramped quickly to follow very short-term fluctuations in
wind power output, they are able to follow forecast changes. On the National Grid, it has been observed that it is
not cost-effective to have nuclear power, which has particularly slow ramp rates, from following fluctuations in
demand or wind power output, but coal-fired plants do decrease their output in response to increases in wind
power output. This is supported by the findings of analyses of measured historical data for the British grid and
similar American networks by Thomson (2014) and Kaffine (2011), and also by a statement by National Grid (ASA,
2007b).
A further limitation with comparing this modelled system with wind power in Great Britain is the assumption that
rapid response to wind power fluctuations is provided by OCGT plants. An observation of real metered operational
data from the National Grid has shown that OCGTs are rarely used, typically only over very short periods (observed
to be around 1 hour every 2 or 3 days) to make up shortfalls between demand and supply during the morning
pickup and evening peak (Elexon, 2013a). The annual output of OCGT plants has remained roughly constant from
2009 to 2012, despite a significant increase in installed capacity of wind power, with OCGT meeting only 0.008% of
demand in 2012, compared to 4% from wind power (OCGT generation was 0.20% of the total output from wind
power) (Elexon, 2013a). The assumptions made by le Pair are summarised in Table 9, and it can be seen that these
assume a much greater penetration of OCGT on the network, with OCGT output corresponding to over 70% of that
from the wind farm.
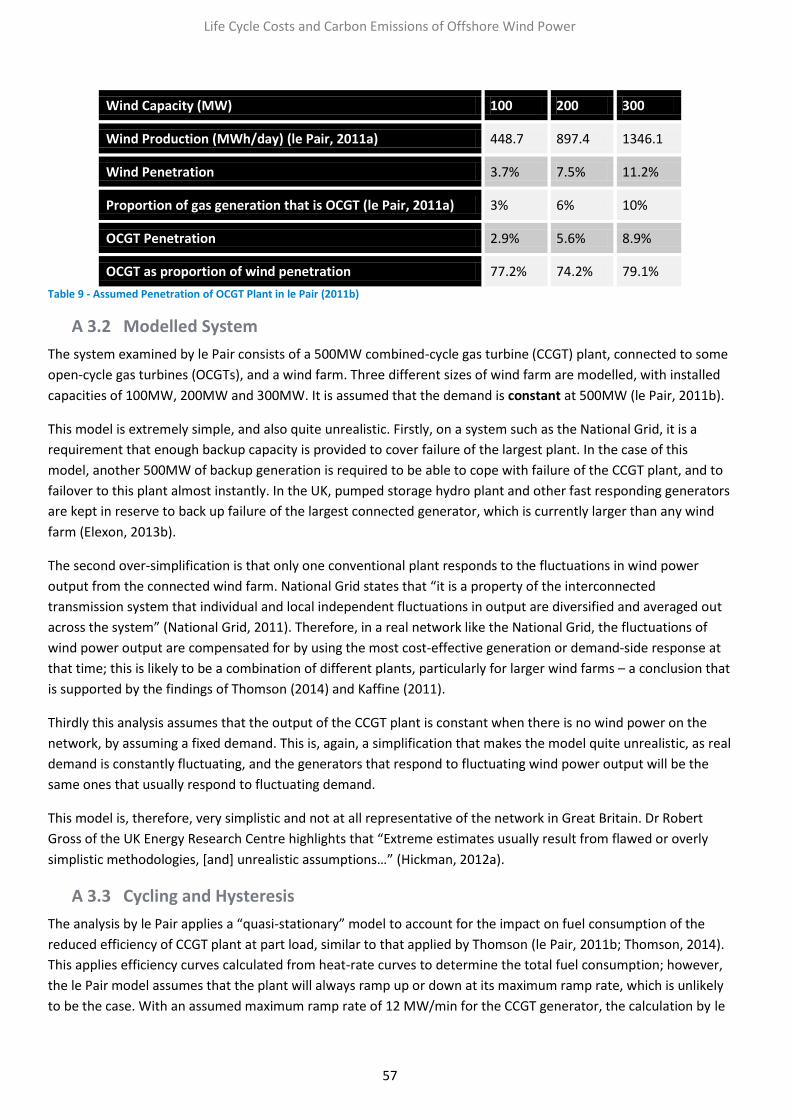
Life Cycle Costs and Carbon Emissions of Offshore Wind Power
57
Wind Capacity (MW) 100 200 300
Wind Production (MWh/day) (le Pair, 2011a) 448.7 897.4 1346.1
Wind Penetration 3.7% 7.5% 11.2%
Proportion of gas generation that is OCGT (le Pair, 2011a) 3% 6% 10%
OCGT Penetration 2.9% 5.6% 8.9%
OCGT as proportion of wind penetration 77.2% 74.2% 79.1%
Table 9 - Assumed Penetration of OCGT Plant in le Pair (2011b)
A 3.2 Modelled System
The system examined by le Pair consists of a 500MW combined-cycle gas turbine (CCGT) plant, connected to some
open-cycle gas turbines (OCGTs), and a wind farm. Three different sizes of wind farm are modelled, with installed
capacities of 100MW, 200MW and 300MW. It is assumed that the demand is constant at 500MW (le Pair, 2011b).
This model is extremely simple, and also quite unrealistic. Firstly, on a system such as the National Grid, it is a
requirement that enough backup capacity is provided to cover failure of the largest plant. In the case of this
model, another 500MW of backup generation is required to be able to cope with failure of the CCGT plant, and to
failover to this plant almost instantly. In the UK, pumped storage hydro plant and other fast responding generators
are kept in reserve to back up failure of the largest connected generator, which is currently larger than any wind
farm (Elexon, 2013b).
The second over-simplification is that only one conventional plant responds to the fluctuations in wind power
output from the connected wind farm. National Grid states that “it is a property of the interconnected
transmission system that individual and local independent fluctuations in output are diversified and averaged out
across the system” (National Grid, 2011). Therefore, in a real network like the National Grid, the fluctuations of
wind power output are compensated for by using the most cost-effective generation or demand-side response at
that time; this is likely to be a combination of different plants, particularly for larger wind farms – a conclusion that
is supported by the findings of Thomson (2014) and Kaffine (2011).
Thirdly this analysis assumes that the output of the CCGT plant is constant when there is no wind power on the
network, by assuming a fixed demand. This is, again, a simplification that makes the model quite unrealistic, as real
demand is constantly fluctuating, and the generators that respond to fluctuating wind power output will be the
same ones that usually respond to fluctuating demand.
This model is, therefore, very simplistic and not at all representative of the network in Great Britain. Dr Robert
Gross of the UK Energy Research Centre highlights that “Extreme estimates usually result from flawed or overly
simplistic methodologies, [and] unrealistic assumptions…” (Hickman, 2012a).
A 3.3 Cycling and Hysteresis
The analysis by le Pair applies a “quasi-stationary” model to account for the impact on fuel consumption of the
reduced efficiency of CCGT plant at part load, similar to that applied by Thomson (le Pair, 2011b; Thomson, 2014).
This applies efficiency curves calculated from heat-rate curves to determine the total fuel consumption; however,
the le Pair model assumes that the plant will always ramp up or down at its maximum ramp rate, which is unlikely
to be the case. With an assumed maximum ramp rate of 12 MW/min for the CCGT generator, the calculation by le

Life Cycle Costs and Carbon Emissions of Offshore Wind Power
58
Pair assumes that a change from 500MW to 400MW in a half hour period would result in the ramp occurring over
8min 20sec, with the output then remaining constant at 400MW for 21min 40sec. In reality, if a generator is
required to change its output it will do so at any ramp rate up to the maximum possible – so may take the full half
hour and ramp at 1.7MW/min. The assumption by le Pair may actually underestimate the true fuel consumption
when ramping down, and, conversely, overestimate the fuel consumption when ramping up, as illustrated by
Figure 30.
Figure 30 - Comparison of different ramp rate assumptions. The fuel consumption is a function of the area under the line, adjusted for changes in efficiency.
Le Pair then expands his analysis to account for the hysteresis effect (which he terms “cycling”) (le Pair, 2011b).
This is the effect that additional fuel is required to change the output of a generator from a low level to a high
level, and less fuel is required when ramping down. This effect has not been considered in the work by Thomson
(2014), although the analysis of similar networks in the USA by Kaffine (2011)was based on measured CO2
emissions data, and therefore will implicitly include it. Le Pair cites private communications that suggest that the
fuel consumption of a CCGT plant that changes its output from 100% to 80% and back to 100% in an hour will
consume 1% more fuel than it would have if the plant had continued running at full load (le Pair, 2011b). He then
goes on to develop a “nett [sic] cycle loss” correction factor to apply to his quasi-stationary model to include this
additional fuel consumption; his quasi-stationary model finds the fuel consumption for a 100% - 80% - 100%
change is 85.2% of the full load fuel consumption, so the correction factor brings this value back to 101% of the full
load fuel consumption (le Pair, 2011a). He argues that this is representative of a real system, as real empirical data
from the Netherlands found that “the actual fuel use of the units doing the regulation and delivering the variable
part of the power needed, nation wide [sic],was always some 0.3 – 0.5% higher than that calculated with the heat
rate curves” (le Pair, 2011b). The fundamental error here is the confusion between the increase in fuel
consumption being a proportion of the full load fuel consumption, or a proportion of the fuel use calculated from
heat-rate curves. The empirical evidence, which shows that the fuel consumption is 0.3 – 0.5% higher than that
calculated from heat-rate curves, suggests that the hysteresis effect should increase the fuel consumption from his
quasi-stationary model by 0.3 – 0.5%: in the case of the 100% - 80% - 100% change, the fuel consumption will be
85.5 – 85.7% of the full load consumption. This figure agrees with observed operation of load-following CCGT
plants. Furthermore, the correction factor applied by le Pair assumes that there is increased fuel consumption
when a plant is both ramping up and ramping down – this doesn’t realistically reflect the dynamics of the plant
operation. The most straightforward approach would simply be to increase the quasi-stationary figures by 0.5% to
account for hysteresis, as shown in Table 10.
Life Cycle Costs and Carbon Emissions of Offshore Wind Power
59
A 3.4 Life Cycle Energy Consumption
Normally the life cycle carbon emissions and the carbon displacement of a wind farm are compared by looking at
the net emissions savings or the carbon payback time; however, in this analysis le Pair has chosen to assume that
the energy consumption associated with construction, installation, grid connection and grid adaptation can be
shown as a decrease in energy production. This is likely to underestimate the carbon impacts, as energy
consumption for steel manufacture, for example, is usually from coal rather than gas.
In order to apply a more conventional methodology to these results the following method has been applied:
1. The annual CO2 emissions displacements were calculated from the fuel saving corrected for the hysteresis effect (see Table 10), to get 73.3kt, 148.7kt and 224.1kt respectively for the 100MW, 200MW and 300MW farms.
2. The life cycle CO2 emissions were calculated based on a capacity factor of 18.7% (derived from information in (le Pair, 2011a)), and two different carbon footprint estimates:
a. From the LCA Harmonization Project, the mean carbon footprint of 12g CO2/kWh was used to calculate the life cycle CO2 emissions per operational year: 2.0kt, 3.9kt and 5.9kt respectively (Dolan and Heath, 2012).
b. From Guezuraga (2012), the carbon footprint assuming construction in China of 38.33g CO2/kWh was applied to give life cycle CO2 emissions per operational year of: 6.3kt, 12.6kt and 18.9kt respectively.
3. The net annual emissions savings were calculated by subtracting the life cycle emissions from the annual emissions displacements.
4. These were then described as a proportion of full load CO2 emissions, assuming that the CO2 emissions from CCGT operation are 480g CO2/kWh – the value quoted by le Pair (2011b).
This methodology found the impacts of life cycle CO2 emissions on the net emissions savings to be much more
optimistic, as shown in Table 10.
A 3.5 Corrected Results and Conclusions
The system modelled by le Pair is not a good representation of the National Grid in Great Britain, and the
corresponding fuel mix; however, it is interesting to examine the performance of this model with more realistic
assumptions.
Insufficient information precluded the re-analysis of the raw data, or correction of the “quasi-stationary” results to
more accurately reflect ramping rates, so the starting point for this re-calculation was to assume that the quasi-
stationary fuel savings are correct for the given model. More robust assumptions, as outlined in Sections A 3.3 and
3.4, are applied to account for the hysteresis effect and life cycle carbon emissions, as shown in Table 10 (note that
two different life cycle impacts are assumed). The impact of operating OCGT plant is not considered, as this is
unrealistic for the National Grid. Despite the simplicity of this model, it can be shown that the correction of
calculation errors results in all scenarios showing a net reduction of carbon emissions.

Life Cycle Costs and Carbon Emissions of Offshore Wind Power
60
Fuel/CO2 Saving (as a proportion of 100% CCGT consumption/emissions)
Wind Capacity (MW)
100 200 300
Quasi stationary results from le Pair (2011b) 3.5% 7.1% 10.7%
Corrected for “cycling”/hysteresis effect 3.48% 7.06% 10.65%
Corrected to account for typical life cycle impacts (Dolan and Heath, 2012)
3.39% 6.88% 10.37%
Corrected to account for pessimistic life cycle impacts (Guezuraga et al., 2012)
3.18% 6.47% 9.75%
Table 10 - Results of le Pair, 2011, adjusted for more robust assumptions
Life Cycle Costs and Carbon Emissions of Offshore Wind Power
61
References
ADAMS, P., BOWS, A., GILBERT, P., HAMMOND, J., HOWARD, D., LEE, R., MCNAMARA, N., THORNLEY, P., WHITTAKER, C. & WHITAKER, J. 2013. Understanding Greenhouse Gas Balances of Bioenergy Systems. SUPERGEN Bioenergy Hub.
ARUP 2011. Review of the generation costs and deployment potential of renewable electricity technologies in the UK. Department of Energy and Climate Change.
ASA 2005. ASA Non-broadcast Adjudication: Renewable Energy Systems Ltd. Advertising Standards Authority.
ASA 2007a. ASA Adjudication on RWE npower plc - February. Advertising Standards Authority.
ASA 2007b. ASA Adjudication on RWE npower plc - October. Advertising Standards Authority.
AWERBUCH, S. & YANG, S. 2008. Using Portfolio Theory to Value Power Generation Investments. Analytical Methods for Energy Diversity and Security, 3, 61-68.
BARNARD, M. 2013. Wind Energy Reduces Green House Gas Emissions [Online]. Barnard on Wind. Available: http://barnardonwind.com/2013/03/05/wind-energy-reduces-green-house-gas-emissions/ [Accessed August 2014].
BARRS, A. 2011. Costs of low-carbon generation technologies - technical annex. Committee on Climate Change.
BAUMANN, H. & TILLMAN, A. M. 2004. The Hitch Hiker's Guide to LCA: An orientation in life cycle assessment methodology and application, Lund, Sweden, Studentlitteratur.
BETTLE, R., POUT, C. H. & HITCHIN, E. R. 2006. Interactions between electricity-saving measures and carbon emissions from power generation in England and Wales. Energy Policy, 34, 3434-3446.
BLANCO, M. I. 2009. The economics of wind energy. Renewable and Sustainable Energy Reviews, 13, 1372-1382.
BOLINGER, M. & WISER, R. 2012. Understanding wind turbine price trends in the U.S. over the past decade. Energy Policy, 42, 628-641.
BSI 2011. PAS 2050:2011 - Specification for the assessment of the life cycle greenhouse gas emissions of goods and services. London: British Standards Institute, Defra, DECC.
CARRINGTON, D. 2012. Analysis reveals folly of betting UK's energy future on cheap gas over wind [Online]. The Guardian. Available: http://www.theguardian.com/environment/2012/feb/29/wind-energy-cheaper-gas-analysis [Accessed August 2014].
CCC 2011. The Renewable Energy Review. Committee on Climate Change.
CCC 2012. Meeting Carbon Budgets - 2012 Progress Report to Parliament. Committee on Climate Change.
CCC 2013. Fourth Carbon Budget Review - technical report - sectoral analysis of the cost-effective path to the 2050 target. Committee on Climate Change.
CRAWFORD, R. H. 2005. Validation of the use of input-output data for embodied energy analysis of the Australian construction industry. Journal of Construction Research, 6, 71-90.

Life Cycle Costs and Carbon Emissions of Offshore Wind Power
62
CRAWFORD, R. H. 2009. Life cycle energy and greenhouse emissions analysis of wind turbines and the effect of size on energy yield. Renewable and Sustainable Energy Reviews, 13, 2653-2660.
CROWN ESTATE 2012. Offshore Wind Cost Reduction Pathways Study. Crown Estate.
DALE, L., MILBORROW, D., SLARK, R. & STRBAC, G. 2004. Total cost estimates for large-scale wind scenarios in UK. Energy Policy, 32, 1949-1956.
DAVIDSSON, S., HÖÖK, M. & WALL, G. 2012. A review of life cycle assessments on wind energy systems. The International Journal of Life Cycle Assessment, 17, 729-742.
DECC 2011a. Load Factors, Renewable electricity in Scotland, Wales, Northern Ireland and the regions of England in 2011. Department of Energy and Climate Change.
DECC 2011b. Valuation of energy use and greenhouse gas emissions for appraisal and evaluation - Tables 1-29: supporting the toolkit and the guidance. Department of Energy and Climate Change.
DECC 2012. Electricity Generation Costs 2012. Department of Energy and Climate Change.
DECC 2013. Valuation of energy use and greenhouse gas emissions for appraisal - Tables 1-20: supporting the toolkit and the guidance. Department of Energy and Climate Change.
DECC 2014. Digest of UK Energy Statistics. Department of Energy and Climate Change.
DELARUE, E. D., LUICKX, P. J. & D'HAESELEER, W. D. 2009. The actual effect of wind power on overall electricity generation costs and CO2 emissions. Energy Conversion and Management, 50, 1450-1456.
DENNY, E. & O'MALLEY, M. 2006. Wind generation, power system operation, and emissions reduction. IEEE Transactions on Power Systems, 21, 341-347.
DENNY, E. & O'MALLEY, M. 2009. The impact of carbon prices on generation-cycling costs. Energy Policy, 37, 1204-1212.
DOLAN, S. L. & HEATH, G. A. 2012. Life Cycle Greenhouse Gas Emissions of Utility-Scale Wind Power. Journal of Industrial Ecology, 16, S136-S154.
ECOINVENT 2010. Ecoinvent database v2.2. Swiss Centre for Life Cycle Inventories.
ELEXON. 2013a. Elexon Portal - Historic Generation by Fuel Type [Online]. Available: www.elexonportal.co.uk [Accessed February 2013].
ELEXON 2013b. Registered BM units. 30th May 2013 ed.
ENERNEX CORPORATION 2011. Eastern Wind Integration and Transmission Study. National Renewable Energy Laboratory.
FARHAT, A. A. M. & UGURSAL, V. I. 2010. Greenhouse gas emission intensity factors for marginal electricity generation in Canada. International Journal of Energy Research, 34, 1309-1327.
FRAUNHOFER ISE 2013. Levelized cost of electricity renewable energy technologies. Germany: Fraunhofer.
GIBERSON, M. 2013. Assessing Wind Power Cost Estimates. PhD, Texas Tech University.

Life Cycle Costs and Carbon Emissions of Offshore Wind Power
63
GIBSON, C. 2011. A Probabilistic Approach to Levelised Cost Calculations for Various Types of Electricity Generation. Institution of Engineers and Shipbuilders in Scotland (IESIS).
GIL, H. A. & JOOS, G. 2007. Generalized Estimation of Average Displaced Emissions by Wind Generation. Power Systems, IEEE Transactions on, 22, 1035-1043.
GOEDKOOP, M., DE SCHRYVER, A., OELE, M., DURKSZ, S. & DE ROEST, D. 2008. Introduction to LCA with SimaPro 7.
GOGGIN, M. 2012. Fact Check: New Dutch Report Misinformed on Wind Power and Emissions [Online]. American Wind Energy Association. Available: http://aweablog.org/blog/post/fact-check-new-dutch-report-misinformed-on-wind-power-and-emissions [Accessed August 2014].
GROSS, R., HEPTONSTALL, P., ANDERSON, D., GREEN, T., LEACH, M. & SKEA, J. 2006. The Costs and Impacts of Intermittency: An assessment of the evidence on the costs and impacts of intermittent generation on the British electricity network. UK Energy Research Centre.
GROSS, R., HEPTONSTALL, P. & BLYTH, W. 2007. Investment in electricity generation: the role of costs, incentives and risks. UK Energy Research Centre.
GROSS, R., HEPTONSTALL, P., GREENACRE, P., CANDELISE, C., JONES, F. & CASTILLO, A. C. 2013. Presenting the Future: An assessment of future costs estimation methodologies in the electricity generation sector. UK Energy Research Centre.
GUEZURAGA, B., ZAUNER, R. & PÖLZ, W. 2012. Life cycle assessment of two different 2 MW class wind turbines. Renewable Energy, 37, 37-44.
HAMMOND, G. & JONES, C. 2010. Inventory of Carbon and Energy (ICE) - Annex A: Methodologies for Recycling. Bath, UK: University of Bath.
HARRISON, G. P., MACLEAN, E. J., KARAMANLIS, S. & OCHOA, L. F. 2010. Life cycle assessment of the transmission network in Great Britain. Energy Policy, 38, 3622-3631.
HAWKES, A. D. 2010. Estimating marginal CO2 emissions rates for national electricity systems. Energy Policy, 38, 5977-5987.
HEPTONSTALL, P., GROSS, R., GREENACRE, P. & COCKERILL, T. 2012. The cost of offshore wind: Understanding the past and projecting the future. Energy Policy, 41, 815-821.
HICKMAN, L. 2012a. Are wind turbines increasing carbon emissions? [Online]. The Guardian. Available: http://www.theguardian.com/environment/blog/2012/jan/09/wind-turbines-increasing-carbon-emissions [Accessed August 2014].
HICKMAN, L. 2012b. Wind myths: Turbines increase carbon emissions [Online]. The Guardian. Available: http://www.theguardian.com/environment/2012/feb/28/wind-turbines-carbon-emissions [Accessed August 2014].
HUGHES, G. 2012. Why is Wind Power So Expensive. Global Warming Policy Foundation.
IEA 2010. Projected Costs of Generating Electricity - 2010 Edition. International Energy Agency.
IPCC. 2007. Lifetimes, radiative efficiencies and direct GWPs relative to CO2 - Table 2.14 (Errata) [Online]. Available: http://www.ipcc.ch/publications_and_data/ar4/wg1/en/errataserrata-errata.html\#table214 [Accessed November 2012].
Life Cycle Costs and Carbon Emissions of Offshore Wind Power
64
IPCC 2011. IPCC Special Report on Renewable Energy Sources and Climate Change Mitigation, Cambridge, United Kingdom and New York, NY, USA, Cambridge University Press.
IRENA 2012. Renewable Energy Cost Analysis - Wind Power. International Renewable Energy Association.
ISO 2006a. BS EN ISO 14040 Environmental management - Life cycle assessment - Principles and framework. UK: British Standards Institute.
ISO 2006b. BS EN ISO 14044 - Environmental management - Life cycle assessment - Requirements and guidelines. UK: British Standards Institute.
ISO 2013. PD ISO/TS 14067:2013 Greenhouse gases - Carbon footprint of products - Requirements and guidelines for quantification and communication. UK: British Standards Institute.
JUNGBLUTH, N., BAUER, C., DONES, R. & FRISCHKNECHT, R. 2005. Life Cycle Assessment for Emerging Technologies: Case Studies for Photovoltaic and Wind Power (11 pp). The International Journal of Life Cycle Assessment, 10, 24-34.
KAFFINE, D. T., MCBEE, B. J. & LIESKOVSKY, J. 2011. Empirical estimates of emissions avoided from wind power generation. United States Association for Energy Economics Dialogue, 19.
KATZENSTEIN, W. & APT, J. 2012. The cost of wind power variability. Energy Policy, 51, 233-243.
LANTZ, E., WISER, R., HAND, M., ARAPOGIANNI, A., CENA, A. & SIMONOT, E. 2012. IEA Wind Task 26: The Past and Future Cost of Wind Energy. NREL for IEA Wind Task 26.
LE PAIR, C. 2011a. Appendix to: Electricity in The Netherlands. Windmills increase fossil fuel consumption & CO2 emission. Details about the calculations. [Online]. Available: http://www.clepair.net/windSchipholappx.html [Accessed January 2014].
LE PAIR, C. 2011b. Electricity in The Netherlands. Wind turbines increase fossil fuel consumption & CO2 emission. [Online]. Available: http://www.clepair.net/windSchiphol.html [Accessed January 2014].
LEA, R. 2012. Electricity Costs: The folly of wind-power. London: Civitas.
LENZEN, M. & MUNKSGAARD, J. 2002. Energy and CO2 life-cycle analyses of wind turbines - review and applications. Renewable Energy, 26, 339-362.
LUND, H., MATHIESEN, B. V., CHRISTENSEN, P. & SCHMIDT, J. H. 2010. Energy system analysis of marginal electricity supply in consequential LCA. International Journal of Life Cycle Assessment, 15, 260-271.
MARKR. 2012. Adding wind power saves CO2 [Online]. Skeptical Science. Available: http://www.skepticalscience.com/wind-carbon.html [Accessed August 2014].
MARNAY, C., FISHER, D., MURTISHAW, S., PHADKE, A., PRICE, L. & SATHAYE, J. 2002. Estimating Carbon Dioxide Emissions Factors for the California Electric Power Sector. Ernest Orlando Lawrence Berkely National Laboratory.
MATHERS, M. 2013. RE: Conversation with Scottish Power.
MILBORROW, D. 2009. Quantifying the impacts of wind variability. Proceedings of the ICE - Energy, 162, 105-111.
MILBORROW, D. 2013. Wind energy costs bring more projects into profitability. Windpower Monthly, 41306.
Life Cycle Costs and Carbon Emissions of Offshore Wind Power
65
MILLS, A. 2009. The Cost of Transmission for Wind Energy: A Review of Transmission Planning Studies. Lawrence Berkeley National Laboratory.
MOTT MACDONALD 2010. UK Electricity Generation Costs Update. Department of Energy and Climate Change.
MOTT MACDONALD 2011. Costs of low-carbon generation technologies. Committee on Climate Change.
MUKORA, A., WINSKEL, M., JEFFREY, H. & MUELLER, M. 2009. Learning curves for emerging energy technologies. Proceedings of the ICE - Energy, 162, 151-159.
NATIONAL GRID 2010. Operating the Electricity Transmission Networks in 2020 - Follow Up Report. National Grid plc.
NATIONAL GRID 2011. National Electricity Transmission System Seven Year Statement. National Grid plc.
NREL. 2013a. LCA Harmonization [Online]. Available: http://en.openei.org/apps/LCA/ [Accessed April 2013].
NREL 2013b. Western Wind and Solar Integration Study Phase 2 Main Report. National Renewable Energy Laboratory.
OFGEM 2012. OFGEM CONSULTS ON £22 BILLION INVESTMENT PLANS TO UPGRADE BRITAIN’S GAS AND HIGH VOLTAGE ELECTRICITY NETWORKS.
OXERA 2011. Discount rates for low carbon and renewable generation technologies. Committee on Climate Change.
PARSONS BRINCKERHOFF 2010. Powering the Nation Update 2010. Parsons Brinckerhoff.
PARSONS BRINCKERHOFF 2011. Electricity Generation Cost Model - 2011 Update Revision 1. Department of Energy and Climate Change.
PARSONS BRINCKERHOFF 2012. Electricity Transmission Costing Study. Parsons Brinckerhoff.
PB POWER 2004. The Cost of Generating Electricity. The Royal Academy of Engineering.
PB POWER 2006. Powering the Nation: A review of the costs of generating electricity. Newcastle: Parsons Brinckerhoff.
PEHNT, M., OESER, M. & SWIDER, D. J. 2008. Consequential environmental system analysis of expected offshore wind electricity production in Germany. Energy, 33, 747-759.
POYRY 2011. Analysing Technical Constraints On Renewable Generation To 2050. Committee on Climate Change.
POYRY 2013. Technology Supply Curves for Low-Carbon Generation. Committee on Climate Change.
RICARDO-AEA 2012. UK Government conversion factors for Company Reporting. Department for Environment Food & Rural Affairs, Department of Energy & Climate Change.
RICARDO-AEA 2013. UK Government conversion factors for Company Reporting. Department for Environment Food & Rural Affairs, Department of Energy & Climate Change.
ROYAL ACADEMY OF ENGINEERING 2014. Wind Energy: Implications of large scale deployment on the GB electricity system. Royal Academy of Engineering.

Life Cycle Costs and Carbon Emissions of Offshore Wind Power
66
SCHLEISNER, L. 2000. Life cycle assessment of a wind farm and related externalities. Renewable Energy, 20, 279-288.
SCHWABE, P. 2011. IEA Wind Task 26: Multi-national Case Study of the Financial Cost of Wind Energy. NREL/IEA.
SILER-EVANS, K., AZEVEDO, I. L. & MORGAN, M. G. 2012. Marginal Emissions Factors for the U.S. Electricity System. Environmental Science and Technology, 46, 4742-4748.
SMITH, J., NAYAK, D. R. & SMITH, P. 2014. Wind farms on undegraded peatlands are unlikely to reduce future carbon emissions. Energy Policy, 66, 585-591.
STRBAC, G., SHAKOOR, A., BLACK, M., PUDJIANTO, D. & BOPP, T. 2007. Impact of wind generation on the operation and development of the UK electricity systems. Electric Power Systems Research, 77, 1214-1227.
TAYLOR, G. & TANTON, T. 2012. The Hidden Costs of Wind Electricity: Why the full cost of wind generation is unlikely to match the cost of natural gas, coal or nuclear generation. Washington, DC: American Tradition Institute: Center for Energy Studies.
TEGEN, S. 2012. 2010 Cost of Wind Energy Review. NREL.
TEGEN, S. 2013. 2011 Cost of Wind Energy Review. NREL.
THE CARBON TRUST 2012. Carbon footprinting - The next step to reducing your emissions, CTV043. London: The Carbon Trust.
THE INTERNATIONAL EPD COOPERATION 2008. EPD - Introduction, intended uses and key programme elements.
THOMSON, R. C. 2014. Carbon and Energy Payback of Variable Renewable Generation. Doctor of Philosophy, University of Edinburgh.
TREMEAC, B. & MEUNIER, F. 2009. Life cycle analysis of 4.5 MW and 250 W wind turbines. Renewable and Sustainable Energy Reviews, 13, 2104-2110.
UDO, F. 2011. Wind energy in the Irish power system [Online]. Available: http://www.clepair.net/IerlandUdo.html [Accessed August 2011].
UKERC. 2012. UKERC contributes to Guardian wind debate [Online]. UK Energy Research Centre. Available: http://www.ukerc.ac.uk/support/article1802-UKERC-contributes-to-Guardian-wind-debate [Accessed August 2014].
VALENTINO, L., VALENZUELA, V., BOTTERUD, A., ZHOU, Z. & CONZELMANN, G. 2012. System-Wide Emissions Implications of Increased Wind Power Penetration. Environmental Science and Technology, 46, 4200-4206.
VATTENFALL 2013. Certified Environmental Product Declaration EPD of Electricity from Vattenfall's Nordic Wind Farms. Stockholm, Sweden: Vattenfall Business Unit Generation Wind.
VESTAS 2006. Vestas Life cycle assessment of offshore and onshore sited wind power plants based on Vestas V90-3.0MW turbines. 2 ed. Randers, Denmark: Vestas Wind Systems A/S.
VOORSPOOLS, K. R. & D'HAESELEER, W. D. 2000. An evaluation method for calculating the emission responsibility of specific electric applications. Energy Policy, 28, 967-980.
WAGNER, H. J., BAACK, C., EICKELKAMP, T., EPE, A., LOHMANN, J. & TROY, S. 2011. Life cycle assessment of the offshore wind farm Alpha Ventus. Energy, 36, 2459-2464.

Life Cycle Costs and Carbon Emissions of Offshore Wind Power
67
WANG, Y. & SUN, T. 2012. Life cycle assessment of CO2 emissions from wind power plants: Methodology and case studies. Renewable Energy, 43, 30-36.
WARNER, E. S. & HEATH, G. A. 2012. Life Cycle Greenhouse Gas Emissions of Nuclear Electricity Generation. Journal of Industrial Ecology, 16, S73-S92.
WEINZETTEL, J., REENAAS, M., SOLLI, C. & HERTWICH, E. G. 2009. Life cycle assessment of a floating offshore wind turbine. Renewable Energy, 34, 742-747.
WHEATLEY, J. 2013. Quantifying CO2 savings from wind power. Energy Policy.
WHITAKER, M., HEATH, G. A., O'DONOUGHUE, P. & VORUM, M. 2012. Life Cycle Greenhouse Gas Emissions of Coal-Fired Electricity Generation. Journal of Industrial Ecology, 16, S53-S72.
WIEDMANN, T. O., SUH, S., FENG, K. S., LENZEN, M., ACQUAYE, A., SCOTT, K. & BARRETT, J. R. 2011. Application of Hybrid Life Cycle Approaches to Emerging Energy Technologies - The Case of Wind Power in the UK. Environmental Science & Technology, 45, 5900-5907.
WISER, R. 2012. 2011 Wind Technologies Market Report. US DoE.
WRI & WBCSD 2011. Greenhouse Gas Protocol: Product Life Cycle Accounting and Reporting Standard, World Resources Institute.
Acknowledgments
The authors and ClimateXChange thank John Barrett for his constructive review of this report.
© University of Edinburgh 2015 on behalf of ClimateXChange
All rights reserved. No part of this publication may be reproduced, stored in a retrieval system, or transmitted in any form or by any means, electronic, mechanical,
photocopying, recording or otherwise, without the prior written permission of the publishers. While every effort is made to ensure that the information given here is
accurate, no legal responsibility is accepted for any errors, omissions or misleading statements. The views expressed in this paper represent those of the author(s) and
do not necessarily represent those of the host institutions or funders.
www.climatexchange.org.uk