life-cycle energy use and greenhouse gas emissions analysis
TRANSCRIPT

Energies 2013, 6, 4897-4923; doi:10.3390/en6094897
energies ISSN 1996-1073
www.mdpi.com/journal/energies
Article
Life-Cycle Energy Use and Greenhouse Gas Emissions Analysis for Bio-Liquid Jet Fuel from Open Pond-Based Micro-Algae under China Conditions
Xunmin Ou 1,2,*, Xiaoyu Yan 3, Xu Zhang 1,2 and Xiliang Zhang 1,2
1 Institute of Energy, Environment and Economy, Tsinghua University, Beijing 100084, China;
E-Mails: [email protected] (X.Z.); [email protected] (X.Z.) 2 China Automotive Energy Research Center, Tsinghua University, Beijing 100084, China 3 Environment and Sustainability Institute, University of Exeter Penryn Campus, Penryn,
Cornwall TR10 9EZ, UK; E-Mail: [email protected]
* Author to whom correspondence should be addressed; E-Mail: [email protected];
Tel.: +86-10-6279-7376; Fax: +86-10-6279-6166.
Received: 29 July 2013; in revised form: 19 August 2013 / Accepted: 12 September 2013 /
Published: 23 September 2013
Abstract: A life-cycle analysis (LCA) of greenhouse gas (GHG) emissions and energy use
was performed to study bio-jet fuel (BJF) production from micro-algae grown in open
ponds under Chinese conditions using the Tsinghua University LCA Model (TLCAM).
Attention was paid to energy recovery through biogas production and cogeneration of heat
and power (CHP) from the residual biomass after oil extraction, including fugitive methane
(CH4) emissions during the production of biogas and nitrous oxide (N2O) emissions during
the use of digestate (solid residue from anaerobic digestion) as agricultural fertilizer.
Analyses were performed based on examination of process parameters, mass balance
conditions, material requirement, energy consumptions and the realities of energy supply
and transport in China (i.e., electricity generation and heat supply primarily based on coal,
multiple transport modes). Our LCA result of the BJF pathway showed that, compared
with the traditional petrochemical pathway, this new pathway will increase the overall
fossil energy use and carbon emission by 39% and 70%, respectively, while decrease
petroleum consumption by about 84%, based on the same units of energy service.
Moreover, the energy conservation and emission reduction benefit of this new pathway
may be accomplished by two sets of approaches: wider adoption of low-carbon process
fuels and optimization of algae cultivation and harvest, and oil extraction processes.
OPEN ACCESS

Energies 2013, 6 4898
Keywords: life-cycle analysis; bio-liquid fuel; algae; China
1. Introduction
1.1. China is Facing Rapidly Increasing Energy Demand and Oil Imports
With global primary energy demand expected to grow at a compound annual growth rate of
1.6% from 2009 to 2035 driven by future global population and economic growth [1], mitigation of
greenhouse gas (GHG) emissions is imperative. China’s energy consumption has expanded quickly by
5.82% annually, underpinning the 10% average annual growth of the national economy during the
1981–2011 period [2]. Currently, China is the largest energy producer and consumer in the World [2].
In 2011, China consumed 1839 million tons of oil equivalents (Mtoe) of coal, 461.8 Mtoe of oil and
117.6 Mtoe of natural gas (NG), representing 49.4%, 11.4% and 4.0% of the World total, respectively [3].
China is also facing energy supply problems due to limited fossil energy resources. Its per capita
reserves of coal, petroleum and NG are 67.0%, 5.4%, and 7.5% of World averages, respectively [4].
China’s dependence on foreign energy sources has been increasing in recent years. In particular, the
share of imported petroleum in the total petroleum consumption has risen from 32% at the beginning
of the 21st century to 58% currently [5].
1.2. Liquid Fuel Shortage in China Due to Transportation Increasing
According to Wang [4], energy demand in China’s transport sector increased from 25 Mtoe in 1980
to 206 Mtoe in 2009 with an average annual growth rate of 7%, making the transport sector the fastest
growing energy-consuming sector in China. Transport is also the fastest growing contributor to
China’s GHG emissions. Petroleum consumption in China transport sector was 223.2 Mtoe in 2010,
with gasoline consumption at 67.6 Mtoe. The transport sector accounted for 35%–40% and 48% of
petroleum consumption in China in 2000 and 2009, respectively, and is expected to rise to more than
50% in 2030, in line with global patterns [6]. Jet fuel demand increased to 19.44 million tons in China
in 2012 with significant growth in air transport infrastructure accompanied by dramatic growth in
aircraft usage [7].
1.3. China is Developing Alternative Fuels on a Large Scale
To curb oil demand, the Chinese government is making great efforts by regulating vehicle fuel
economy and introducing alternative fuels, including coal- and NG-based fuels. For example, China
has been promoting vehicles that operate on gaseous fuels, mainly compressed natural gas and
liquefied petroleum gas, since 1999 [8,9]. China is also urgently developing and utilizing biofuels.
As stated in its Energy Policy White Paper 2012, China will encourage the use of bio-diesel, ethanol
and bio-jet fuel (BJF) [10].

Energies 2013, 6 4899
1.4. Life-Cycle Analysis is a Useful Tool for Policy Decision Making
Life cycle GHG emissions have become critical and necessary information influencing the
implementation of appropriate energy policies in an increasingly GHG-constrained world. Since the
1990s, researchers and institutions have begun to build life-cycle analysis (LCA) models to analyze
energy consumption and GHG emissions. This has resulted in models such as The Greenhouse Gases,
Regulated Emissions and Energy Use in Transportation Model (GREET) and Lifecycle Emissions
Model (LEM) [11–15]. These models are able to evaluate alternative liquid fuels. A number of studies
have been published for North America, Europe and other regions with localized conclusions, based
these or similar models [16–21]. The conclusions are, however, very geographically dependent and
therefore will not necessarily be applicable to other places.
Several LCAs have been performed for algae-based biofuel and biogas pathways, mostly in the
United States and European context. Allen et al. [20] formulated the guidelines for LCA of aviation
fuel in USA. Lardon et al. [21] analyzed life-cycle GHG emissions of algae-based bio-diesel in the
European context and Clarens et al. [22] did a similar analysis for the USA. Campbell et al. [23]
studied bio-diesel production from algae under Australian conditions. Collet et al. [24] examined the
production of biogas from algae in France. The USA has been a global pioneer in algae biofuel
research and engineering applications. With support from the US Department of Energy, the Argonne
National Laboratory (ANL) performed LCA for hypothetical commercial projects [25]. The report of
National Research Council of USA (NRC) [26] presented an extremely thorough review of the
literature and findings up to the year 2012.
China’s biofuel LCA studies [27] are mainly on non-algae based bio-ethanol and bio-diesel
pathways except for the one by Hou et al. [28], which covered an algae-oil pathway. However, the data
for micro-algae cultivation process in this paper are totally cited from studies for other country rather
than China.
1.5. Algae-Based Biofuel: Energy Positive or Not?
In terms of life-cycle energy performance, algal fuels can be better than fossil fuels. However, there
are no firm conclusions yet for this emerging technology. The NRC report [26] found that the energy
return on investment (EROI) of pond-based algae can range from 0.13 to 7.0, based on a literature
review. An EROI figure less than 1 means the energy needed to make a fuel is greater than the energy
contained in the fuel and co-products. The ANL analysis [25] suggested that compared with
conventional diesel, the use of algal bio-diesel may reduce life-cycle energy consumption by 55% and
carbon emission by 45%.
There are few LCA studies on algal BJF, except the PARTNER report [29] which covers life cycle
GHG emissions from alternative BJF, including a simulated open-pond algae pathway. Its results show
that the life cycle GHG emissions for algal BJF range from 16% to 220% of those from conventional
jet fuel (CJF). The main source of variability in these results is due to the emerging nature of the algal
fuel technology and many processes in the production systems are still in the laboratory or pilot phase.
There is much uncertainty in how these technologies will evolve and scale up in the future. Therefore,

Energies 2013, 6 4900
actual life-cycle energy use and GHG emissions could be different from those suggested by existing
LCA studies.
1.6. About This Study
As mentioned earlier, to the best knowledge of the authors there is no relatively in-depth LCA on
algal BJF pathway under Chinese conditions. Therefore, the main objective of this paper is to assess
life-cycle energy use and GHG emissions for algal BJF pathway specific to China in comparison with
CJF, the reference pathway. Meta-analysis in the NRC report [26] suggest the CO2 source and
co-products are critical factors in the GHG balance. We develop our own process models to analyze
the details under Chinese condition for key assumptions on water loss, CO2 source, co-product method
and process fuel type, etc.
2. Method and Data
2.1. Model Description
In this study we used the Well-to-Wake (WTW) analysis module of the Tsinghua China LCA
Model (TLCAM), which has been described in details elsewhere [29–32]. With the help of the
iterative and source-tracing function of this model, all fuels and energy used in all sub-stages can be
traced back to the use of three types of primary fossil energy (coal, natural gas and petroleum).
Upstream emissions can be found in Li et al. [32]. Three key types of GHG—CO2, CH4 and N2O—are
taken into consideration and the 100-year global warming potential in CO2 equivalent (CO2,e) was
calculated according to IPCC guidelines. In this study, a new module was developed to assess the
life-cycle energy and GHG emissions for the algal BJF pathway. In this automated module, when key
assumptions are changed, the final results with the initial changes are tracked and a visual output in the
form of charts and graphs is generated.
2.2. Life-Cycle Stages Covered and System Boundary
As Figure 1 shows, five stages were included in this WTW energy consumption and GHG analysis.
The first four stages are focused on the fuel production process, including the exploitation of raw
resources, feedstock cultivation and transportation, fuel production and transportation, storage and
distribution (TSD). The final stage is fuel combustion.
Some secondary-level energy use and GHG emissions for infrastructure building, labor input,
vehicle and machinery manufacture are not considered as their contribution to the whole life-cycle
results is expected to be small and can be omitted according to international LCA guideline. Both the
transportation of water to the site and water movement onsite is included. CO2 transport to site and
transfer to pond are also included.
The embodied energy of the materials used to construct the containment system in an algae pond is
substantial. This is because the ratio of surface area to volume must be high in order to maximize light
exposure and because the system must be completely isolated from surrounding ecosystems in order to
protect the algae culture from predators as well as to prevent invasion of surrounding areas with
non-native, perhaps genetically modified algae species [33]. In our base case, embodied energy of the

Energies 2013, 6 4901
pond construction materials are not considered, but an alternative scenario will be added in the
sensitivity analysis.
Figure 1. Stages covered and system boundary in this study.
The function unit can be one MJ of algae oil produced and one MJ of jet fuel used, for energy
functional and service functional units, respectively. In this study, there is not obvious difference of
result comparison between energy functional and service functional unit based, due to that the energy
performances of the two pathways (BJF and CJF) can be regarded as identical.
It is indicated that adding Bio-Synthetic Paraffinic Kerosene (Bio-SPK) has a minimal effect on the
fuel consumption of airplanes. Therefore, in the fuel combustion stage, the energy performance for the
two pathways can be regarded as identical. Clearly, comparative analyses of these pathways avoided
the difficulties associated with specific airplane models [29,34].
2.3. Reference Pathway
The energy efficiency of petrochemical jet fuel refining was determined through literature
surveys [29,35] in the China Automotive Energy Research Center (CAERC) report [36], which used

Energies 2013, 6 4902
top-down approach and assumed that the jet fuel-specific refining efficiency can be calculated from
overall refinery efficiency using the equation developed by Wang et al. [37]. The life-cycle results of
this pathway from [36] are summarized in Table 1.
Table 1. Life-cycle energy consumption and GHG emissions of the petrochemical jet fuel
pathway in China [36].
Item Number Unit
Life-cycle fossil energy consumption 1.26 MJ/MJ Including: Coal 0.07 MJ/MJ
Natural gas 0.06 MJ/MJ Petroleum 1.13 MJ/MJ
Life-cycle GHG emissions 93.5 g CO2, e/MJ
2.4. Baseline Algal BJF Pathway
Currently, algal biofuel technologies are under development or in partial technical demonstration.
Existing projects are relatively small and the available data are not sufficiently representative.
Consequently, LCA of this pathway is difficult.
In our study, a hypothetical commercial project is evaluated with some parameters specific to
China (Table 2). The paddle wheel mixed open raceway ponds to cultivate planktonic algae are
assumed to have a size of 100 ha, with flue gas (20% CO2) supplied by nearby power plant under
Chinese conditions [36]. The operation period is set to be 300 days annually.
Innovations that result in reduced resource use along the entire supply chain will remove some of the
existing barriers to the development of large-scale, sustainable, and economically viable algal biofuels.
Algae productivity and lipid content are two key parameters and they are set as 25 g/m2/day and
25% in the baseline case, following Davis et al. [38]. Sensitivity analysis will explore the effects of a
50% reduction and a 100% increase in these values, considering that improvements in algae
productivity and biofuel yield will help reduce resource requirements per unit algal biofuel produced.
Table 2. Key assumptions for algae cultivation system in China.
Item Properties Note
Type of algae cultivation system
Open raceway ponds Selected because of its lower cost and energy consumption than the bioreactor system [26]
Scale of algae farm and CO2 source
A nearby power plant Based on primary bench-scale data and process modeling
in Kadam (2002) [39] which considered a coal power plant with algae biomass using flue gas from the power plants.
CO2 content of flue gas 20 vol % CAERC report [36]
Algae productivity 25 g/m2/day Davis et al. (2011) [38]
Lipid content 25% Davis et al. (2011) [38]
Type of algae oil extraction system
Wet extraction Extraction must be done onsite proximal
to the algae growth pond [40]
The core process model is elaborated in Figure 2. Following the cultivation stage, algae harvesting
and oil extraction are done at the farm. The pathway dewaters the culture in several progressive steps

Energies 2013, 6 4903
including bio-flocculation, dissolved air flotation (DAF) and centrifugation, to manage energy
consumption. Recent work of Vasudevan et al. [40] compared the energy input and GHG emissions of
three kinds of algae lipid extraction technology: dry and wet extraction, and secretion. Wet hexane
extraction is selected in this study because this process can be done onsite proximal to the pond and the
thermal demand during this stage can be met with the CHP heat recovery as discussed later. Dry
extraction is not selected due to the fact that the process of drying the wet biomass to about 10%
moisture required more energy than was available in the harvest algae biomass as stated in [21],
without considering the solar drying methods due to the disadvantages of large land footprint demand
and possible climate constraints. After lipid fractionation process, the algae oil is then sent to a refinery
for Bio-SPK production with jet fuel as the main product.
Figure 2. Baseline algae oil production process.
It is assumed that resources (algae, water, CO2, N, and P) are recycled whenever possible through
the processes at the farm. Inefficiencies in the homogenizer and in recovery during dewatering lead to
flows of biomass, along with the lipid-extracted algae (LEA) after hexane extraction, to the anaerobic
digester. Energy in these residues is partially recovered as biogas through anaerobic digestion (AD)
and converted to electricity and steam by a combined heat and power (CHP) system on site. We
assume certain amount of biogas leakage unavoidable.
In the model, heat and power from the CHP is available for use onsite (e.g., for AD and biogas
cleaning, and algae cultivation and harvesting). Excess power (if available) is exported as co-products
while excess heat is discarded. Electricity from the grid and heat produced onsite from coal with an
energy efficiency of 75% will be used if there are deficits of power and heat for the system. Residue
from biogas production is sold to external parties to replace chemical fertilizers. The details for all
stages will be demonstrated in Section 3.1.
Energies 2013, 6 4904
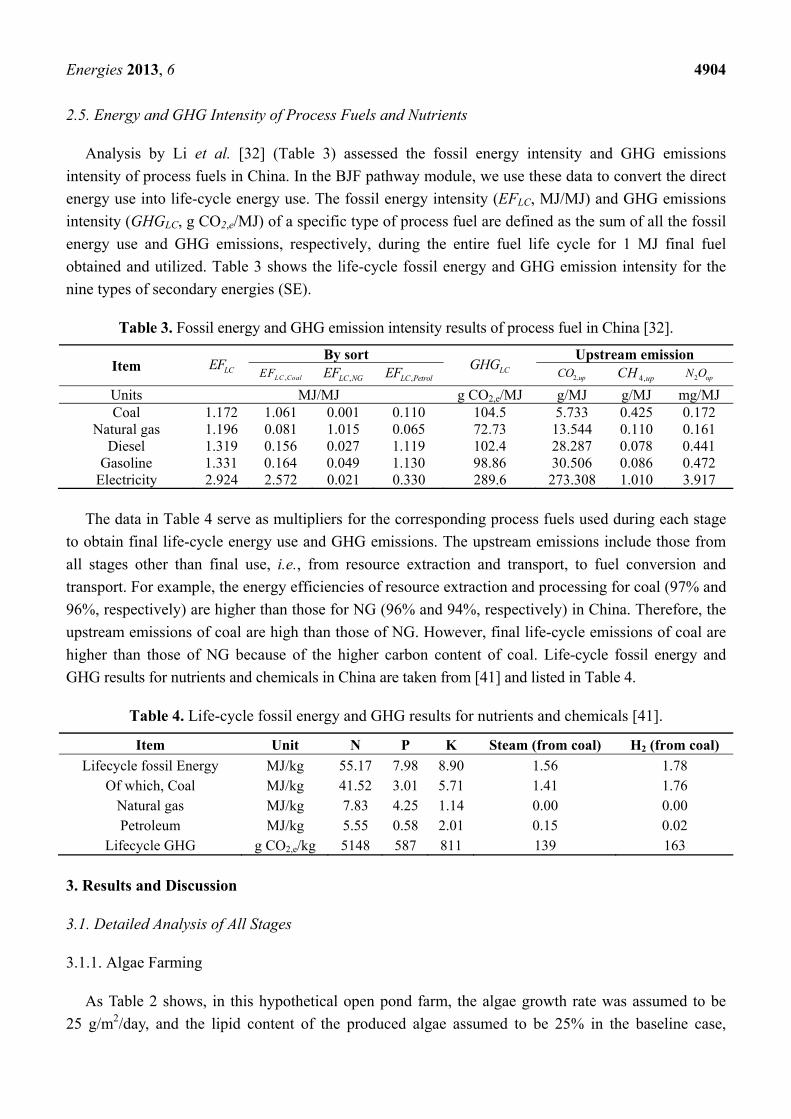
2.5. Energy and GHG Intensity of Process Fuels and Nutrients
Analysis by Li et al. [32] (Table 3) assessed the fossil energy intensity and GHG emissions
intensity of process fuels in China. In the BJF pathway module, we use these data to convert the direct
energy use into life-cycle energy use. The fossil energy intensity (EFLC, MJ/MJ) and GHG emissions
intensity (GHGLC, g CO2,e/MJ) of a specific type of process fuel are defined as the sum of all the fossil
energy use and GHG emissions, respectively, during the entire fuel life cycle for 1 MJ final fuel
obtained and utilized. Table 3 shows the life-cycle fossil energy and GHG emission intensity for the
nine types of secondary energies (SE).
Table 3. Fossil energy and GHG emission intensity results of process fuel in China [32].
Item LCEF By sort
LCGHG Upstream emission
,LC CoalEF ,LC NGEF ,LC PetrolEF 2,upCO 4,upCH 2 upN O
Units MJ/MJ g CO2,e/MJ g/MJ g/MJ mg/MJ Coal 1.172 1.061 0.001 0.110 104.5 5.733 0.425 0.172
Natural gas 1.196 0.081 1.015 0.065 72.73 13.544 0.110 0.161 Diesel 1.319 0.156 0.027 1.119 102.4 28.287 0.078 0.441
Gasoline 1.331 0.164 0.049 1.130 98.86 30.506 0.086 0.472 Electricity 2.924 2.572 0.021 0.330 289.6 273.308 1.010 3.917
The data in Table 4 serve as multipliers for the corresponding process fuels used during each stage
to obtain final life-cycle energy use and GHG emissions. The upstream emissions include those from
all stages other than final use, i.e., from resource extraction and transport, to fuel conversion and
transport. For example, the energy efficiencies of resource extraction and processing for coal (97% and
96%, respectively) are higher than those for NG (96% and 94%, respectively) in China. Therefore, the
upstream emissions of coal are high than those of NG. However, final life-cycle emissions of coal are
higher than those of NG because of the higher carbon content of coal. Life-cycle fossil energy and
GHG results for nutrients and chemicals in China are taken from [41] and listed in Table 4.
Table 4. Life-cycle fossil energy and GHG results for nutrients and chemicals [41].
Item Unit N P K Steam (from coal) H2 (from coal)
Lifecycle fossil Energy MJ/kg 55.17 7.98 8.90 1.56 1.78 Of which, Coal MJ/kg 41.52 3.01 5.71 1.41 1.76
Natural gas MJ/kg 7.83 4.25 1.14 0.00 0.00 Petroleum MJ/kg 5.55 0.58 2.01 0.15 0.02
Lifecycle GHG g CO2,e/kg 5148 587 811 139 163
3. Results and Discussion
3.1. Detailed Analysis of All Stages
3.1.1. Algae Farming
As Table 2 shows, in this hypothetical open pond farm, the algae growth rate was assumed to be
25 g/m2/day, and the lipid content of the produced algae assumed to be 25% in the baseline case,
Energies 2013, 6 4905
and the farm was assumed to operate 300 days a year. Consequently, 1 ha of pond area yields 75 t of
algae biomass (75 = 25 × 300/100) annually.
Algae growth and bio-flocculation account for almost all water movement in the system. Water
movement occurs when the ponds are mixed to keep the algae in suspension, when culture is moved
for settling, when the supernatant is recycled to the pond, and when water lost due to evaporation and
soil leakage is replaced.
An earlier study [41] reported that 2000 W of electric power is required to maintain 30 cm/s stirring
movement for 1 ha of pond area. For the hypothetical farm in the present study, this translates into
a power requirement of 24 kWh/ha/day if the circulation system is run 12 h per day on average.
Therefore, ~96 kWh of electricity is consumed due to water circulation for 1 t of algae biomass
production. This value is higher than the water circulation energy use of 76 kWh/t algae in Murphy and
Allen [33].
When the algae concentration reaches 0.5 g/L, the culture will be pumped to the settling pond for
bio-flocculation. Water recovery from bio-flocculation is assumed to be 100% except for the water that
flows downstream with the algae at 10 g/L of concentration. In this study, water is returned to the culture
pond from settling pond without loss and future work will consider these losses. Therefore, pumping of
3900 tons of water to the settling pond and back to culture pond is required for 1 t of algae biomass
production. A study [42] on detailed process design cost estimation using Computer Assisted Procedure
for Design and Evaluation of Wastewater Treatment Systems (CAPDET) reported that 4.8 × 10⁻⁵ kWh of
electricity is required for pumping 1 L of water at a head of 5 feet. Based on this value, ~195 kWh of
electricity is consumed by water pumping for 1 t of algae biomass production at our farm.
As Murphy and Allen [43] stated, in order to achieve mean daily production rates of
25 g/m2/day, the algae has to be grown in a semi-continuous system. This requires significant volumes
of water to be pumped through very small diameters in a short period of time, requiring significant
amounts of energy. The final result is 1450 kWh/t algae in Murphy and Allen [33], which will be used
for the alternative case in the sensitivity analysis.
The water replenishment rate is about 0.6 cm per operating day considering the average pan
evaporation rate is 0.3~0.4 cm/day in China [44] and water leakage from the pond to the surrounding
soil is 0.11~0.36 cm/day as Murphy and Allen [33] discussed. Base on the water balance in Figure 3,
about 344 t of water is made-up for 1 t of algae biomass production. The energy consumption for fresh
water acquirement in China is ~0.19 kWh for surface water and 0.49 kWh for ground water [34],
which are less than those in USA (0.42 and 1.00 respectively [33]). We use the averages of these
values to calculate the energy consumption for fresh water acquirement. Therefore, ~112 kWh of
electricity is consumed due to fresh water acquirement for 1 t of algae biomass production. In addition,
in our analysis the fresh water intensity of algae production is 340 t/t in the baseline case, less than the
level in USA (780 t/t by Murphy and Allen [33]). So the value in our study (112 kWh/t algae) is much
lower than that for USA (326 kWh/t algae).
In total, ~406 kWh of electricity is consumed due to water movement for 1 t of algae biomass
production. As energy consumption during algae cultivation is primarily for mixing and pumping
water, Murphy and Allen [33] suggested the energy needs for water management could be substantially
higher than current LCA studies indicate. We will test the impact of different water consumption rates
and the associated energy consumption rate in the alternative case.

Energies 2013, 6 4906
Figure 3. Water balance during algae growth and harvesting (ton of water per dry-ton of
algae production).
Pumped Lost
2000 100
1900
Recycled
All value,t/t
Leakage
56
Evaporation
184
Make-up waterPond Settle Facility340
(1) Carbon input and Related Electricity Consumption
The carbon content of the algae biomass was assumed to be approximately 50%. Therefore, the CO2
demand ratio was 1.83. Further assuming a CO2 use efficiency of 0.85, the overall CO2 demand ratio
was 2.16. As shown in Figure 4, recovered CO2 from the CHP system and offsite CO2 are 0.70
(0.70 = 0.19 × 44/12) and 1.45 (1.45 = 0.40 × 44/12) ton of CO2 for 1 t of algae biomass production,
respectively. As stated in section 2.4, in this study, the off-site CO2 demand was met by transporting
flue gas with 20% CO2 vol % from a nearby power plant.
Figure 4. Carbon flows of the algae pathway.
Outgasing 0.19 in CO2
0.09
CH4 leakage
0.50 in alage 0.13 in CH4 0.00
0.06 in CO2 0.01 Remain in soil
0.05 Sludge
in alage 0.11 0.10 Changed to CO2
0.45 in alage 0.02 in alage 0.35 in LEA 0.11 supernatant
0.43 0.08 0.08
in algae in oil
All value,kg C per ton algae
Conversion
elctricity
Growth CHP
DAF AD & Upgrading
Centrifuge Extraction
Carbon from power
0.40
Calculation using GREET [25] showed that 11.6 kWh of electrical energy was required for
transporting 1 t of CO2 (the overall efficiency of the compressors and motors was assumed to be
approximately 50%). In addition, 21.2 kWh of electrical energy was required for injecting 1 t of CO2
into the culture with a pressure drop of 1.5 meter water equivalent (corresponding to transfer sump
depth, the combined efficiency of 0.67).
To sum up, the electricity for carbon input is about 62.7 kWh for 1 t of algae biomass production.
About three quads of them are used for CO2 injection and only one quad is used to transport offsite
flue gas to the algae farm.
According to Jaramillo et al. an additional l80~140 kWh of electricity per ton of compressed CO2 is
consumed to fully capture the CO2 produced in the coal chemical plant. This method will be used to
study sensitivities later.
Energies 2013, 6 4907
(2) Nutrients Input
In our farm, the nutrients were urea and DAP (diammonium phosphate) and about 5% of nitrogen to
volatilization. As analyzed in Figure 5 in Section 3.3, it was determined that the production of 1 g of
algae required 14 mg of N and 6.3 mg of P (both expressed in masses of the pure elements), with
recovered nutrients (42.2 mg of N and 6.3 mg of P), to satisfy the gross nutrient demand per dry gram
of algae (55.5 mg of N and 12.6 mg of P), after 0.7 mg of N loss in volatilization, which based on a
C:N:P composition of 103:10:1 and nutrients are assumed to be consumed stoichiometrically.
3.1.2. Algae Harvesting
DAF is selected as the first step for algae harvest with 90% of algae is retained while the balance is
sent to the anaerobic digester. The second centrifugation process has an efficiency of 95%, and the
residual algae mass was sent for AD too. Therefore, 1.17 g of harvested algae mass was required to
produce 1 g of dewatered algae mass after dewatering processes including DAF and centrifugation.
For the production of 1 dry-gram of dewatered algae mass for oil extraction, there is 1.33 × 10⁻⁴ kWh
and 1.0 × 10⁻³ kWh of electrical energy consumption for DAF process and centrifugation,
respectively [42,45]. While Uduman et al.’s [46] estimate for this number was 10 times higher
(8.0 × 10⁻³ kWh) and Mohn [45] also estimated for this number was eight times higher
(1.67 × 10⁻³ kWh). The sensitivity analysis on this variation of centrifugal method will show us
whether the algae fuel is energy positive or not. We can find the harvest energy is about 1155 kWh of
electricity for 1 t of algae biomass harvested.
In early foundational works like Benemann and Oswald [47], the algae was dried before centrifuge
stage and favored a hot oil extraction to extract oil directly. However, this kind of expensive energy
and cost investment is not selected and the algae biomass is not dried prior to the hexane solvent
extraction in our study as discussed in Section 2.4.
3.1.3. Oil Extraction
Oil is extracted from the dewatered algae mass (20% solid content) by a high-pressure
homogenization process, which was assumed to use 0.2 kWh of electrical energy for processing 1 kg
of dry mass [48]. The disruption efficiency was assumed to be 90%, and the un-homogenized algae
mass entered the LEA for AD. The following process of hexane extraction is assumed to give a lipid
extraction efficiency of 95% and require the following resources (for producing 1 kg of lipid): 6.12 MJ
of heat, 0.54 kWh of electrical energy, and 5.2 g of n-hexane. So the electricity and heat demand are
about 774 kWh and 6120 MJ for 1 t of algae oil produced. There is a concern that phospholipids and
other non-TAGs can account for sizable portions of the lipid fraction. To get the desired neutral lipids,
lipid fractionation processes such as acid addition, water wash and degumming are required to
minimize the phosphors and water content [49]. Although the energy use during this lipid fractionation
stage is negligible (less than 1% that of algae harvest stage), the oil loss of about 2.77% needs to be
considered. The thermal demand during this stage is met with the CHP heat recovery as discussed later.

Energies 2013, 6 4908
3.1.4. AD, Biogas Cleaning and CHP
We assume the LEA undergoes AD to produce energy and recycle nutrients to algae culture. Energy
generation form AD contributes to reducing energy input and hence GHG emissions. Mass balance
analyses indicated that during lipid extraction, the production of 1 t of algae oil was accompanied by
the generation of 4.47 t of mixture of LEA and algae loss from harvest, which was subsequently used
as a raw material for AD.
It was assumed that, the AD raw material consisted of primarily (90%) suspended matter. According
to a previous study on AD [50], 1 g of suspended matter produces 0.33 liters of methane, and 1 t of
solid input yields 2.97 × 10⁵ m3 of methane. Assuming the biogas produced at our farm consisted of
67% methane and 33% CO2, the conversion relationship became: 1 t of solid input producing 287 kg
of biogas. Considering the reality of the AD process and the following biogas cleaning, approximately
2% of CH4 was assumed to be lost via leakage. For 1 kg of solid input, the AD process requires
2.448 MJ of heat or 0.136 kWh of electrical energy. Additionally, for the production of 1 m3 of biogas,
another 0.25 kWh of electrical energy is required for product purification-upgrading [51].
The generated and cleaned biogas was used by CHP to produce heat and electrical energy.
Assuming an overall energy efficiency of 76% and electrical energy generation efficiency of 33%, with
the methane produced from 1 ton of solid is inputted (10,439 MJ) into the CHP process, this system
should produce 956 kWh of electrical energy and 4486 MJ of heat.
Overall, besides the supplying electricity and heat for AD and biogas cleaning, the production of 1 t
of algae lipid is accompanied by the generation of 3336 kWh of electrical energy and 9113 MJ of heat.
These heat and power is available for use onsite (e.g., algae cultivation, harvest and lipid extraction).
3.2. Carbon Balance
Figure 4 shows the carbon flows at each stage of the algal BJF pathway. About 2.16 tons of CO2 is
transferred into the pond with ~15% of outgas. After the DAF, centrifuge and lipid extraction stages,
only 16% of carbon in the algae is re-carbonated into the oil. The remaining 84% is allocated to the
AD process “products”: biogas (CH4 and CO2) cleaned for the CHP, leaked CH4, sludge and
supernatants. The last two “products” are assumed to have equal amount of the rest of carbon other
than in biogas and leaked CH4. It was further assumed that 8% of carbon in the sludge was
sequestrated into the soil while the other 92% gradually released as CO2 over a long period. About
38% of carbon in the algae biomass will be in the recyclable CO2 contained in the flue gas of the onsite
CHP system, and they are equal to about half of the external CO2 supplied. It was found that only ~23%
of carbon in the external flue gas supplied can be re-carbonated into the oil (~20%) and sequestrated into
the soil (~3%).
3.3. Nutrients Balance
Based on a C:N:P composition of 103:10:1, nutrients are assumed to be consumed stoichiometrically.
It is also assumed the volatilization rate of nitrogen fertilizers is ~5%. As Figure 5 shows, 14 mg of N
and 6.3 mg of P with recovered nutrients (42.2 mg of N and 6.3 mg of P) is required to satisfy the
gross nutrient demand per dry gram of algae (56.2 mg of N and 12.6 mg of P), with 0.7 mg of N lost in

Energies 2013, 6 4909
volatilization. There are 55.5 mg of N and 12.6 mg of P (for 1 g of algae produced) entering AD to
form sludge and liquid.
80% of N was recovered through supernatant recycling but 5% of the recovered N was lost via
leakage. It was assumed that 50% of the P in the liquid phase was recovered with the other 50% left in
the sludge. Therefore, the sludge contains 11.1 mg of N and 6.3 mg of P, and the liquid contained
44.4 mg of N and 6.3 mg of P (for 1 g of algae produced). Nutrients in the liquid were subsequently
recycled with N partially recycled and P totally recycled. Overall, the recovery rates of N and P are
75% and 50%, respectively.
Figure 5. N and P flows of the algae pathway.
N P
0.0007 0
N P N P N P
0.014 0.0063 0.0562 0.0126 0.0422 0.0063
N P N P
0.0555 0.0126 0.0444 0.0063
N P N P
0.0111 0.0063 0.0022 0
All value,g per dry-gram alage
New nutrients
Residue in Digester
Digester Solids
Digester Supermatant
Lost in return
Loss of new nutrient
Algae in pond Net Covered to Culture
3.4. Non-CO2 GHG Emissions
There are two potential sources for CH4 emissions in the algae pathway, the AD process and
biogas clean-up. Based on a literature review [52], we assume a total fugitive CH4 loss of 2% for
this pathway.
The N2O emission from the N-containing sludge was ignored because chemical fertilizers replaced
by the biogas residue are associated with the same issue.
3.5. Direct Energy Demand
The direct heat and power demand for the baseline case is shown in Table 5.

Energies 2013, 6 4910
Table 5. Direct energy and CO2 demand for process on site in basic case.
Item Unit Direct energy demand CO2 demand
Process Process input Thermal (MJ) Electrical (kWh) Thermal (MJ) Electrical (kWh) per kg algae per kg of algae lipid
Growth – per kg algae per kg algae per kg of algae lipid per kg of algae lipid 2.16 11.80
water circulation 2.00 kW per ha – 0.096 – 0.53 – –
water pumping 3.90 t per kg algae – 0.195 – 1.07 – –
water replenishment 0.60 cm per day – 0.116 – 0.63 – –
Off-site CO2 transport to onsite – – – 0.017 – 0.09 1.45 7.95
Off-site CO2 transfer into pond – – – 0.031 – 0.17 1.45 7.95
Recovered CO2 transfer into pond – – – 0.015 – 0.08 0.70 3.85
Harvest 1.17 kg algae/kg dewatered algae – per kg dewatered algae
– per kg of algae lipid
– – 1.16 5.41
Lipid extraction 4.68 kg dewatered
algae/kg lipids
per kg lipids per kg lipids per kg of algae lipid per kg of algae lipid – –
6.12 0.77 6.12 0.77
Anaerobic digester 4.47 kg feed/kg lipids per kg feed per kg feed per kg of algae lipid per kg of algae lipid
– – 2.45 0.14 10.95 0.61
Biogas cleanup 0.297 cubic meter/kg feed – per cubic meter
– per kg of algae lipid
– – 0.25 0.33
Total direct demand on site – – – – 17.07 9.69 – –
Recovered on site (CHP) 76% CHP efficiency per MJ CH4 per MJ CH4 per kg of algae lipid per kg of algae lipid
– – 35.8 MJ/cubic meter 0.43 0.09 20.45 4.36
Imported externally – – – – −3.38 5.33 – –

Energies 2013, 6 4911
Some relationships between them are listed as follows:
(1) Algae Dewatering and Oil Extraction
The biomass recovery efficiencies of the first and second dewatering processes were 90% and 95%
(the remnant of the dewatering processes processed by AD). Correspondingly, the conversion from
harvested algae to dewatered algae was 1 t of algae harvested yielding 0.86 t of dewatered algae
(0.86 = 0.9 × 0.95), with the conversion rate being 1.17 kg algae/kg dewatered algae.
The lipid content of harvested algae was assumed to be 25% in baseline case. The lipid destruction
and oil recovery efficiencies during the first and second lipid extraction processes were assumed to be
90% and 95%, respectively. Therefore, the conversion from harvested algae to algae lipid was 1 t of
algae biomass yielding 0.21 t of algae lipid (0.21 = 0.25 × 0.9 × 0.95), with the conversion rate being
4.68 kg algae biomass/kg lipids. It is noted that a further 2.77% of oil will be lost during the final
degumming stage for lipid fractionation and this loss will be accounted for in the jet fuel production
process for the convenience of calculation method in this study.
(2) Mass Relationship between the AD Raw Material and Algae Oil Product
Mass balance calculations indicated that the mass of lipid-extracted algae (LEA) entering the AD
process was (theoretically) 4.47 times the mass of the algae lipid (4.47 = 5.47 − 1). In practice, this is
only 3.68 times the algae lipid mass. Moreover, some of the algae mass resulting from dewatering
processes also entered AD. Combining these, the mass entering AD was 4.47 times the algae lipid mass.
(3) External CO2 Input
The total demand for CO2 was 2.16 kg CO2/kg algae, or 11.80 kg CO2/kg algae lipid. However,
a considerable fraction of CO2 could be recovered (3.85 kg CO2/kg algae lipid) from the AD and CHP
processes. Consequently, 8.81 kg of external CO2 was required for 1 kg of algae lipid produced.
3.6. Jet Fuel Production
There are various technologies to produce aviation biofuel currently and two of them have been
included in the ASTM D7566 standard: the hydrotreating process and the Fischer-Tropsch (FT)
synthesis process [36]. In this study, the extracted algae oil is assumed to be processed into jet fuel
using the UOP Renewable Jet Process technique. This kind of hydro-treated renewable jet fuel has
similar compositions and combustion properties to petrochemical synthetic paraffinic kerosene (SPK).
In July 2011, the ASTM gave final approval for blending of SPK from Hydro-processed Esters and
Fatty Acids (HEFA) up to 50 vol% in aviation fuels, thus facilitating a commercial pathway to
sustainable aviation fuels.
The overall energy efficiency of converting algae oil to jet fuel is ~85% according to [36], which is
consistent with the data provided in a 2010 report [32] and is therefore used in this study. Beside the
algae oil (0.90 MJ) as the main input, 0.15 MJ of NG, 0.12 MJ of H2, and 0.004 MJ of electricity are
also required to produce 1 MJ of fuel product. The main fuel product is jet fuel (about 50% of total
output), with a small amount of naphtha and biodiesel co-produced. In this study, the method used in
dealing with these co-products is energy allocation.

Energies 2013, 6 4912
3.7. Co-Products, Oil and Fuel Transportation
Transportation of co-products, algae oil, and final jet fuel is summarized in Table 6. AD digestate
solids (assuming 30 wt % solids in water) are transported by medium heavy-duty truck over a distance
of 100 km for field application. Algae oil is transported by rail over a distance of 1000 km to reach a
refinery facility. The transportation modes and distributions for final BJF exactly match those used for
CJF pathway.
Table 6. Co-products, oil and fuel transportation information [53].
Product/Intermediate Mode Energy Intensity (MJ/t km,
backhaul of the vehicle includes when appropriate)
Fuel mix (%)
Distance (km)
Digestate solids transported to fields
Medium heavy-duty truck
1.36 Diesel (100%)
100
Algae oil transported to fuel production
Railway 0.07 Residue oil
(100%) 500
Fuel transported to terminal
Railway 0.07 Residue oil
(100%) 1000
Fuel distributed to airport
Heavy heavy-duty truck
0.68 Diesel (100%)
50
3.8. Energy and GHG Emissions Results
3.8.1. Energy Returns on Investment for Algae Oil
As Figure 6 shows, the EROI of algae oil is ~2.0 when only direct energy is accounted for. This
is towards the pessimistic end of the range of 0.13 to 7.0 from the literature review in the NRC
report [29].
Figure 6. Energy flows from algae cultivation to oil production with recycle process.
Energies 2013, 6 4913
However, the EROI is only ~0.80 when the upstream energy is also accounted for. This figure is
less than 1, meaning that the energy needed to produce the algae oil is greater than the energy
contained in the algae oil and co-products.
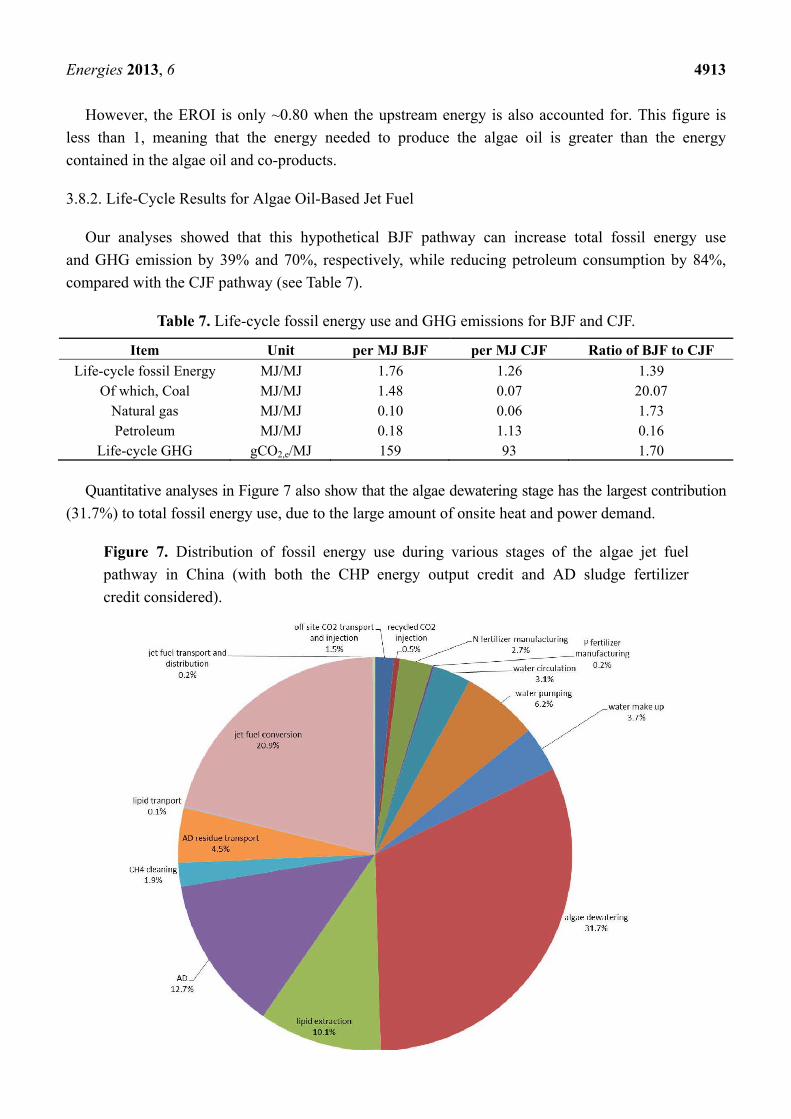
3.8.2. Life-Cycle Results for Algae Oil-Based Jet Fuel
Our analyses showed that this hypothetical BJF pathway can increase total fossil energy use
and GHG emission by 39% and 70%, respectively, while reducing petroleum consumption by 84%,
compared with the CJF pathway (see Table 7).
Table 7. Life-cycle fossil energy use and GHG emissions for BJF and CJF.
Item Unit per MJ BJF per MJ CJF Ratio of BJF to CJF
Life-cycle fossil Energy MJ/MJ 1.76 1.26 1.39 Of which, Coal MJ/MJ 1.48 0.07 20.07
Natural gas MJ/MJ 0.10 0.06 1.73 Petroleum MJ/MJ 0.18 1.13 0.16
Life-cycle GHG gCO2,e/MJ 159 93 1.70
Quantitative analyses in Figure 7 also show that the algae dewatering stage has the largest contribution
(31.7%) to total fossil energy use, due to the large amount of onsite heat and power demand.
Figure 7. Distribution of fossil energy use during various stages of the algae jet fuel
pathway in China (with both the CHP energy output credit and AD sludge fertilizer
credit considered).

Energies 2013, 6 4914
Jet fuel production stage takes the second position (21.0%), due to heat and power demand and
chemical use. The third largest contribution (17.9%) is from the algae growth stage, which mainly
involved fertilizer manufacturing, CO2 transport and injection, water pumping, circulation and
freshwater making-up, and grid electricity consumption. The oil extraction stage also consumes about
10.1% of total fossil energy use in this pathway. Transport of both the oil and fuel has a very small
contribution (0.1%–0.2%) to the total fossil energy use. To achieve the CHP energy output credit and
AD sludge fertilizer credit (about 60% and 3% of total fossil energy use in this pathway, respectively),
penalties of fossil energy use in AD, biogas cleaning and AD residue transport are also significant
(12.7%, 1.9 and 4.5% of total fossil energy use, respectively).
As shown in Figure 8, even with the GHG credits resulted from the CHP heat and electricity
generation and the fertilizer production from AD sludge, the life-cycle GHG emissions remained high.
This is due to the massive emissions from the algae growth and harvesting, oil extraction and jet fuel
conversion stages as well as energy consumption and CH4 leakage during AD stage. About half of the
life-cycle emissions (95.3 g CO2,e per MJ) is from the algae harvesting stage. Algae cultivation, oil
extraction and jet fuel conversion stages are the other large contributing stages: 54.2, 31.2 and 35.1 g
CO2,e per MJ, respectively. Both the oil and the fuel transport stages have very small emissions, which
are 0.2 and 0.3 g CO2,e per MJ, respectively.
Figure 8. Life-cycle GHG emissions for all stages in the algae jet fuel pathway in China
(the CO2 emission from fuel combustion is offset by the intake for algae cultivation).
54.2
95.3
31.2
0.2
35.1
0.3216.3
61.7
118.3
159.2
93.5
0
50
100
150
200
250
300
Alga
e gr
owth
Alga
e ha
rves
t
Lipi
d ex
trac
tion
lipid
tran
port
jet f
uel c
onve
rsio
n
jet f
uel t
rans
port
and
dis
trib
utio
n
Emiss
ions
bef
ore
co-p
rodu
cts c
redi
t and
pena
lity
pena
lties
of C
HP a
nd A
D sl
udge
use
Cred
it of
CHP
and
AD
sludg
e us
e
Life
cyc
le re
sult
of B
JF
Life
cyc
le re
sult
of C
JF
g CO
2,e
/ M
J jet
fuel
4.61.4
8.50.4
9.318.8
11.2
off site CO2 transport and injectionrecycled CO2 injection
N fertilizer manufacturingP fertilizer manufacturing
water circulationwater pumpingwater make up
39.15.9
12.26.3
0.0
ADCH4 cleaning
AD residue transportCH4 leakage
N2O effect
112.1
3.4
5.1
CHP
Carbon Sequestion
Fertilizer credit
When looking into the algae growth stage, water movement related activities (water pumping,
circulation and freshwater making-up) contribute half of the emissions, ~39 g CO2,e per MJ, followed

Energies 2013, 6 4915
by fertilizer manufacturing related emissions of 8.9 g CO2,e per MJ. CO2 transport and injection related
emissions are only about 6 g CO2,e per MJ.
The GHG emissions of algae BJF are ~216.3 g CO2,e per MJ when the credits and the penalties of
CHP and AD sludge are not considered. The energy generated by the CHP system onsite results in a
credit of ~118.3 g CO2,e per MJ when this system supply all of the heat and some of electricity demand
for algae cultivation and oil extraction.
The displaced fertilizer credit (5.1 g CO2,e per MJ) originates from the AD sludge serving as
nitrogen fertilizer to avoid chemical fertilizer production. There is also a credit (3.4 g CO2,e per MJ)
from sequestration of carbon in the digestate solids.
The AD stage requires heat and power to produce biogas for use in the CHP after clean-up. The
emissions are 39.1 and 5.9 g CO2,e per MJ for the AD stage and biogas clean-up process, respectively.
The emissions from transporting the wet digestate solids contributed 12.2 g CO2,e per MJ. The fugitive
CH4 emissions contribute 6.2 g CO2,e per MJ, due to subsequent handling of the digestate and biogas
clean-up for the CHP. In this study, the direct N2O emissions due to AD sludge as fertilizer are not
considered as the replaced chemical nitrogen fertilizers are expected to have the same emissions.
3.9. Sensitivity Analysis
A sensitivity analysis is performed to examine the effects of some key parameters on the life-cycle
results. The details of the low-emission, high-emission and alternative cases are shown in Table 8.
Table 8. Details of the low-emission, high-emission and alternative cases in this study.
Parameter Unit Cases
Baseline case Low case High case
Lipid content wt% 25 50 1.25
Fresh water energy use – China current situation Not counted in Similar to US
situation in [34]
CO2 acquire energy use – Flue gas (20 vol%) Not counted in As pure CO2:
140 kWh/t [54]
Algae productivity g/m2/day 2.5 5 1.25
Energy use for algae harvest kWh per kg algae About 1.2 About half
that in base case
About 10 time that
in base case
Energy use for lipid extraction per kg lipid 6 MJ of heat and
0.5 kWh of electricity
2 MJ of heat and
0.1 kWh of electricity
12 MJ of heat and
1.0 kWh of electricity
CH4 yield L/g-TS 0.3 0.4 0.2
CHP electrical efficiency % 33 38 28
Fraction of N recovered to
culture % 75 65 85
– – Baseline case Alternative case
Water pumping to/from pond kWh per kg algae 195
(calculated by authors) 1450(situation in [34])
Recovered energy by CHP – Yes No
Embodied energy in pond
construction materials – No
Yes. Energy embodied in materials is about
30% that of biomass produced [34].

Energies 2013, 6 4916
As Figure 9 shows, energy use for algae harvesting, energy use for water pumping and the lipid
content are the three parameters with the highest impacts on life-cycle results.
Figure 9. Sensitivity Analysis for algae baseline case: (a) Life cycle fossil energy use and
(b) Lifecycle GHG emissions.
(a)
(b)
3.10. Better Scenario Discussion
The baseline scenario is modified with some key changes to improve the BJF pathway significantly,
in order to achieve better energy and GHG performance of substituting CJF on a large scale.
A set of changes are assumed in a better scenario:
• It is obvious that the overall GHG emissions of this pathway can be greatly improved if the
electricity and heat generation can be sourced from low-carbon fuels. Some potential
improvements in the life cycle of algae-based fuel pathway are also assumed to be achieved in
this future case. For example, more renewable electricity and cleaner power will be available in
the future to change the coal-dominant power system in China currently;
• Because energy consumption during algae harvesting has a significant impact on the final result,
it is also assumed that great efforts will be made to decrease the energy-intensity of algae

Energies 2013, 6 4917
harvesting to half that of the current level. This parameter in the future case will be reduced to
only 10% of the assumed value in the baseline scenario;
• In addition, biogas yield from the LEA flow into the digester can be increased and thereby
improve the LCA results further. This parameter in the future case will be increased by 33%
from the assumed level in the baseline scenario;
• Based on the fact that the contributions of the stirring, pumping, water replenishment, algae
dewatering, and even algae oil extraction to the overall GHG emissions (per unit jet fuel
product) depend on the lipid content of the algae. The lipid content is assumed be increased
from 25% to 50%, to substantially reduce emissions for this pathway.
The final results of this scenario suggest ~50% and 60% reductions in GHG emissions and
fossil energy use, respectively; will be achieved as shown Figure 10. The two largest contributors
to the reduction are the low-carbon electricity system and lower energy use for algae harvesting,
both accounting for ~40% of the reduction. The other two parameters each contributed 10% of
the reduction.
Figure 10. Life cycle analysis results for BJF in better case: (a) Life-cycle fossil energy
use and (b) Life-cycle GHG emissions.
(a) (b)
3.11. Comparative Study
Table 9 compares our LCA results with those from other studies. It can be seen that this study
has relatively pessimistic results. For example, the ratio of life-cycle GHG emissions for BJF to
CJF is 1.66 in the baseline case, worse than the mean value (1.44) from a literature review by
Hantler et al. [55].
The following reasons explain the differences between this and other studies: (1) China’s
coal-dominant energy mix; (2) onsite monitoring of China’s nitrogen fertilizer issues including
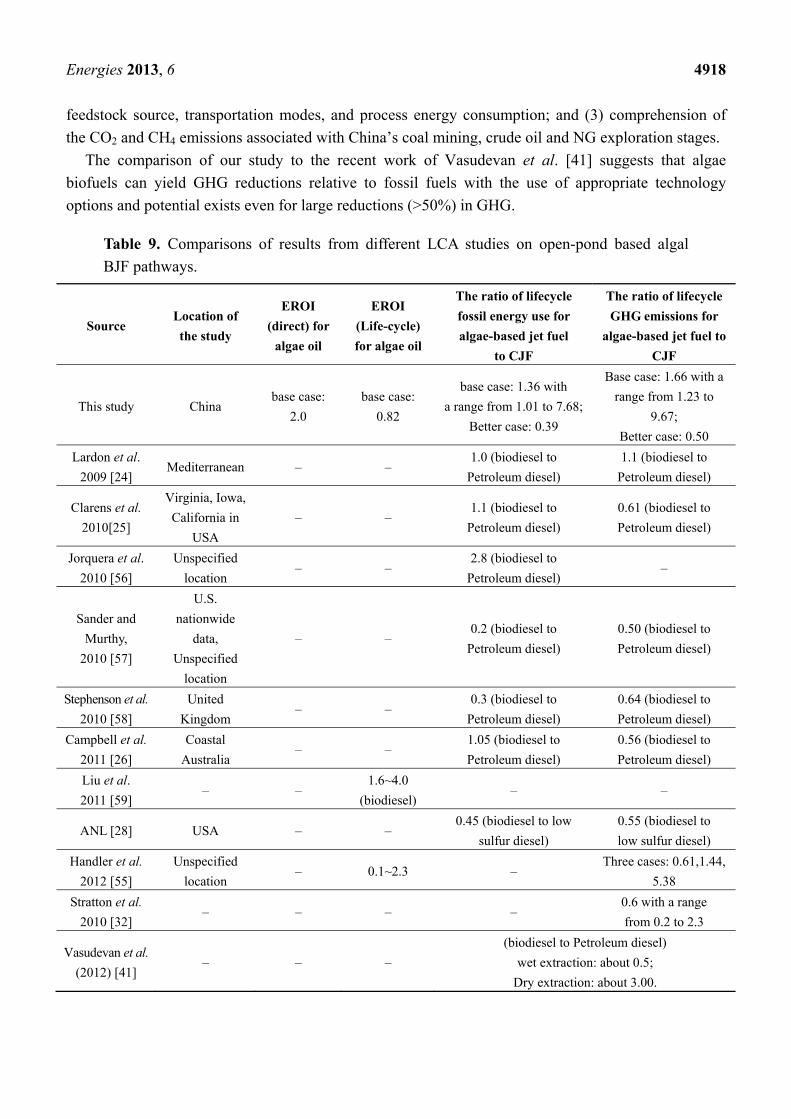
Energies 2013, 6 4918
feedstock source, transportation modes, and process energy consumption; and (3) comprehension of
the CO2 and CH4 emissions associated with China’s coal mining, crude oil and NG exploration stages.
The comparison of our study to the recent work of Vasudevan et al. [41] suggests that algae
biofuels can yield GHG reductions relative to fossil fuels with the use of appropriate technology
options and potential exists even for large reductions (>50%) in GHG.
Table 9. Comparisons of results from different LCA studies on open-pond based algal
BJF pathways.
Source Location of
the study
EROI
(direct) for
algae oil
EROI
(Life-cycle)
for algae oil
The ratio of lifecycle
fossil energy use for
algae-based jet fuel
to CJF
The ratio of lifecycle
GHG emissions for
algae-based jet fuel to
CJF
This study China base case:
2.0
base case:
0.82
base case: 1.36 with
a range from 1.01 to 7.68;
Better case: 0.39
Base case: 1.66 with a
range from 1.23 to
9.67;
Better case: 0.50
Lardon et al.
2009 [24] Mediterranean – –
1.0 (biodiesel to
Petroleum diesel)
1.1 (biodiesel to
Petroleum diesel)
Clarens et al.
2010[25]
Virginia, Iowa,
California in
USA
– – 1.1 (biodiesel to
Petroleum diesel)
0.61 (biodiesel to
Petroleum diesel)
Jorquera et al.
2010 [56]
Unspecified
location – –
2.8 (biodiesel to
Petroleum diesel) –
Sander and
Murthy,
2010 [57]
U.S.
nationwide
data,
Unspecified
location
– – 0.2 (biodiesel to
Petroleum diesel)
0.50 (biodiesel to
Petroleum diesel)
Stephenson et al.
2010 [58]
United
Kingdom – –
0.3 (biodiesel to
Petroleum diesel)
0.64 (biodiesel to
Petroleum diesel)
Campbell et al.
2011 [26]
Coastal
Australia – –
1.05 (biodiesel to
Petroleum diesel)
0.56 (biodiesel to
Petroleum diesel)
Liu et al.
2011 [59] – –
1.6~4.0
(biodiesel) – –
ANL [28] USA – – 0.45 (biodiesel to low
sulfur diesel)
0.55 (biodiesel to
low sulfur diesel)
Handler et al.
2012 [55]
Unspecified
location – 0.1~2.3 –
Three cases: 0.61,1.44,
5.38
Stratton et al.
2010 [32] – – – –
0.6 with a range
from 0.2 to 2.3
Vasudevan et al.
(2012) [41] – – –
(biodiesel to Petroleum diesel)
wet extraction: about 0.5;
Dry extraction: about 3.00.
Energies 2013, 6 4919
4. Concluding Remarks
Our life-cycle study suggests that compared with the traditional petrochemical pathway, the algae
jet fuel pathway will increase overall fossil energy use and GHG emission by 39% and 70%,
respectively, while decreasing petroleum consumption by 84%. Energy conservation and emission
reduction might be achieved for this new pathway by two approaches: wider adoption of low-carbon
process fuels and optimization of algae cultivation and harvesting, and lipid extraction processes.
Several barriers to the commercialization of this new biofuel pathway include algae strain selection
and engineering system:
• Algae strain selection is one of the key bottlenecks for high lipid content algae cultivation in an
open and wide system. Moreover, some strains should be selected to maximize the final algae
lipid productivity based on the trade-off between algae biomass productivity and lipid content;
• Innovative design and technology integration should be introduced into this new pathway to
decrease energy use and costs as some traditional processes (e.g., centrifugation and drying) are
very energy-intensive.
For illustration purposes the size of the algae farm in this study is set at 100 ha. A much larger land
area is required in practical operations. For example, about 100 farms with a size of 100 ha are needed
to supply 50% of the energy use for a regular airport in China.
Resource requirements are very significant if this pathway is developed on a large scale. If 50% of
total jet fuel consumption in 2012 is to be supplied by this pathway, 1.5% of total croplands and 10%
of total water withdraw for crops in China will be needed. As for nutrients, the demand for N and P
will be 1.2 and 0.5 million tons, respectively. This will also have a notable impact (2%–3%) on the
Chinese fertilizer market. Given the long-term phosphorous scarcity with global food security
implications [60,61], limitations of phosphorous supply for algae farming cannot be overlooked even
though China has a substantial advantage over many other countries due to its phosphorous resources.
Whether the water make-up by freshwater can be replaced by saline, brackish or waste water that
contain abundant nutrients for algae growth, is another important area for research. In addition, CO2
source availability should be assessed in details with regard to transportation mode and distance, even
though the CO2-rich flue gas of power plants and chemical factories is abundant.
Acknowledgments
The project is co-supported by the China National Natural Science Foundation (Grant No.
71041028, 71103109), and the CAERC program (Tsinghua/GM/SAIC-China). The authors would like
to thank the reviewers for their generous help.
Conflicts of Interest
The authors declare no conflict of interest.

Energies 2013, 6 4920
References
1. International Energy Agency (IEA). World Energy Outlook 2011; IEA: Paris, France, 2011.
2. National Bureau of Statistics of China. China Statistics 2012; China Statistics Press: Beijing,
China, 2012.
3. British Petroleum (BP). BP Statistical Review of World Energy 2012. Available online:
http://bp.com/statisticalreview (accessed on 26 November 2012).
4. Wang, Q.Y. China Energy Data 2011 [in Chinese]; China Automotive Energy Research Center
(CAERC): Beijing, China, 2011.
5. China Energy Research Society. China Energy Development Report 2013 [in Chinese]; China
Electric Power Press: Beijing, China, 2013.
6. China Automotive Energy Research Center (CAERC). China Automotive Energy Outlook 2012
[in Chinese]; Scientific Press: Beijing, China, 2012.
7. Yan, X.; Crookes, R.J. Reduction potentials of energy demand and GHG emissions in China’s
road transport sector. Energy Policy 2009, 37, 658–668.
8. Yan, X.; Crookes, R.J. Energy demand and emissions from road transportation vehicles in China.
Prog. Energy Combust. Sci. 2010, 36, 651–676.
9. Delluchi, M.A. A Lifecycle Emissions Model (LEM); Institute of Transportation Studies: Davis,
CA, USA, 2003.
10. Wang, M.Q.; Santini, D. Magnitude and value of electric vehicles emissions reduction for
six driving cycles in four US cities with varying air quality problems. Transp. Res. Rec. 1993,
1416, 33–42.
11. Delluchi, M.A. A Revised Model of Emissions of GHG from the Use of Transportation Fuels and
Electricity; Institute of Transportation Studies: Davis, CA, USA, 1997.
12. Wang, M.Q. Development and Use of GREET 1.6 Fuel-Cycle Model for Transportation Fuels and
Vehicle Technologies; Center for Transportation Research, Argonne National Laboratory:
Argonne, IL, USA, 2001.
13. Wang, M.; Wu, Y.; Elgowainy, A. Operating Manual for GREET Version 1.7. Available online:
http://greet.anl.gov/publications.html (accessed on 26 November 2012).
14. Wang, M.Q.; Weber, T. Well-to-Wheels Energy Use and GHG Emissions of Advanced
Fuel/Vehicles System—North American Analysis; Center for Transportation Research, Argonne
National Laboratory: Argonne, IL, USA, 2001.
15. China Automotive Technology and Research Center (CATARC) and General Motor.
Well-to-Wheels Analysis of Energy Consumption and GHG Emissions of Multi Vehicle Fuel in
Future China; CATARC: Beijing, China, 2007.
16. Nguyen, T.L.T.; Gheewala, S.H.; Garivait, S. Full chain energy analysis of fuel EtOH from cane
molasses in Thailand. Appl. Energy 2008, 85, 722–734.
17. Yan, X.; Boies, A.M. Quantifying the uncertainties in life cycle greenhouse gas emissions for UK
wheat ethanol. Environ. Res. Lett. 2013, 8, 015024:1–015024:12.
18. Yan, X.; Tan, D.K.Y.; Inderwildi, O.R.; Smith, J.A.C.; King, D.A. Life cycle energy and
greenhouse gas analysis for agave-derived bioethanol. Energy Environ. Sci. 2011, 4, 3110–3121.

Energies 2013, 6 4921
19. Shirvani, T.; Yan, X.; Inderwildi, O.R.; Edwards, P.; King, D.A. Life cycle energy and
greenhouse gas analysis for algae-derived biodiesel. Energy Environ. Sci. 2011, 4, 3773–3778.
20. Allen, D.T.; Allport, C.; Atkins, K. Framework and Guidance for Estimating Greenhouse Gas
Footprints of Aviation Fuels; Air Force Research Laboratory: Wright-Patterson, OH, USA, 2009.
21. Lardon, L.; Helias, A.; Sialve, B.; Stayer, J.; Bernard, O. Life-cycle assessment of biodiesel
production from microalgae. Environ. Sci. Technol. 2009, 43, 6475–6481.
22. Clarens, A.F.; Resurreccion, E.P.; White, M.A.; Colosi, L.M. Environmental life cycle
comparison of algae to other bioenergy feedstocks. Environ. Sci. Technol. 2010, 44, 1813–1819.
23. Campbell, P.K.; Beer, T.; Batten, D. Life cycle assessment of biodiesel production from
microalgae in ponds. Bioresour. Technol. 2011, 102, 50–56.
24. Collet, P.; Hélias, A.; Lardon, L.; Ras, M.; Goy, R.A.; Steyer, J.P. Life-cycle assessment of
microalgae culture coupled to biogas production. Bioresour. Technol. 2011, 102, 207–214.
25. Frank, E.D.; Han, J.; Wang, M.Q. Life-Cycle Analysis of Algal Lipid Fuels with the GREET
Model; Energy Systems Division, Argonne National Laboratory: Argonne, IL, USA, 2011.
26. National Research Council of the National Academies (NRC). Sustainable Development of Algal
Biofuels in the United States; The National Academies Press: Washington, DC, USA, 2012.
27. Yan, X.; Crookes, R.J. Life cycle analysis of energy use and greenhouse gas emissions for road
transportation fuels in China. Renew. Sustain. Energy Rev. 2009, 13, 2505–2514.
28. Hou, J.; Zhang, P.; Yuan, X.; Zheng, Y. Life cycle assessment of biodiesel from soybean, jatropha
and microalgae in China conditions. Renew. Sustain. Energy Rev. 2011, 15, 5081–5091.
29. Stratton, R.W.; Wong, H.M.; Hileman, J.I. Life Cycle Greenhouse Gas Emissions from
Alternative Jet Fuels; MIT Press: Cambridge, MA, USA, 2010.
30. Ou, X.; Zhang, X.; Chang, S. Energy consumption and GHG emissions of six biofuel pathways by
LCA in (the) People’s Republic of China. Appl. Energy 2009, 86, S197–S208.
31. Ou, X.; Chang, S.; Zhang, X. Alternative fuel buses currently in use in China: Life-cycle fossil
energy use, GHG emissions and policy recommendations. Energy Policy 2010, 38, 406–418.
32. Li, X.; Ou, X.; Zhang, X. Life-cycle fossil energy consumption and greenhouse gas emission
intensity of dominant secondary energy pathways of China in 2010. Energy 2013, 50, 15–23.
33. Murphy, C.F.; Allen, D.T. Energy-Water Nexus for Mass Cultivation of Algae. Environ. Sci.
Technol. 2011, 45, 5861–5868.
34. UOP A Honeywell Company. Green Jet Fuel. Available online: http://www.uop.com/
processing-solutions/biofuels/green-jet-fuel/ (accessed on 26 November 2012).
35. Hu, X.; Li, Z.; Fu, X. Liquid Biofuels: From Fossil to Biomass [in Chinese]; Chemical Industry
Press: Beijing, China, 2012.
36. China Automotive Energy Research Center (CAERC). Aviation Fuel Life Cycle Analysis in
China; CAERC: Beijing, China, 2013.
37. Wang, M.; Lee, H.; Molburg, J. Allocation of energy use in petroleum refineries to petroleum
products: Implications for life-cycle energy use and emission inventory of petroleum transportation
fuels. Int. J. Life Cycle Assess. 2004, 9, 34–44.
38. Davis, R.; Aden, A.; Pienkos, P.T. Techno-economic analysis of autotrophic microalgae for fuel
production. Appl. Energy 2011, 88, 3524–3531.

Energies 2013, 6 4922
39. Kadam, K.L. Environmental implications of power generation via coal-microalgae cofiring.
Energy 2002, 27, 905–922.
40. Vasudevan, V.; Stratton, R.W.; Pearlson, M.N.; Jersey, G.R.; Beyene, A.G.; Weissman, J.C.;
Rubino, M.; Hileman, J.I. Environmental performance of algal biofuel technology options.
Environ. Sci. Technol. 2012, 46, 2451–2459.
41. Lundquist, T.J. Realistic Technology and Engineering Assessment of Algae Biofuel Production;
Energy Biosciences Institute: Berkeley, CA, USA, 2010.
42. Harris, R.W. Process Design and Cost Estimating Algorithms for the Computer Assisted
Procedure for Design and Evaluation of Wastewater Treatment Systems; U.S. Environmental
Protection Agency: Washington, DC, USA, 1982.
43. Ren, G.; Guo, J. Chang in pan evaporation and influential factors over China: 1965–2000
[in Chinese]. J. Nat. Resour. 2006, 21, 31–44.
44. Hu, G.; Ou, X.; Zhang, Q.; Karplus, V.J. Analysis on energy-water nexus by Sankey diagram:
The case of Beijing. Desalin. Water Treat. 2013, 51, 4183–4193.
45. Mohn, F.H. Experiences and Strategies in the Recovery of Biomass from Mass Cultures of
Microalgae. In Algae Biomass; Elsevier: Oxford, UK, 1980; pp. 547–571.
46. Uduman, N.; Qi, Y.; Danquah, M.K.; Forde, G.M.; Hoadley, A. Dewatering of Microalgal
Cultures: A Major Bottleneck to Algae-Based Fuels. J. Renew. Sustain. Energy 2010, 2,
012701:1–012701:15.
47. Benemann, J.R.; Oswald, W.J. Systems and Economic Analysis of Microalgae Ponds for
Conversion of CO2 to Biomass; Pittsburgh Energy Technology Center: Pittsburgh, PA, USA, 1996.
48. Environmental Protection Agency (EPA). Emerging Technologies for Bio Solids Management;
EPA: Washington, DC, USA, 2006.
49. Klein-Marcuschamer, D.; Turner, C.; Allen, M.; Gray, P.; Dietzgen, R.G.; Gresshoff, P.M.;
Hankamer, B.; Heimann, K.; Scott, P.T.; Stephens, E.; et al. Technoeconomic analysis of renewable
aviation fuel from microalgae, Pongamia pinnata, and sugarcane. Biofuels Bioprod. Biorefin.
2013, 7, 416–428.
50. Ras, M. Experimental study on a coupled process of production and anaerobic digestion of
Chlorella vulgaris. Bioresour. Technol. 2011, 102, 200–206.
51. Petersson, A.; Wellinger, A. Biogas Upgrading Technologies: Developments and Innovations;
IEA: Paris, France, 2009.
52. Flesch, T.K.; Raymond, L.; Desjardins, D.W. Fugitive CH4 Emissions from an Agricultural
Biodigester. Biomass Bioenergy 2011, 9, 3927–3935.
53. Ou, X.; Zhang, X. Life-Cycle Analysis of Automotive Energy Pathways in China [in Chinese];
Tsinghua University Press: Beijing, China, 2011.
54. Jaramillo, P.; Samaras, C.; Wakeley, H.; Meisterling, K. Greenhouse gas implications of using
coal for transportation: Life cycle assessment of coal-to-liquids, plug-in hybrids, and hydrogen
pathways. Energy Policy 2009, 37, 2689–2695.
55. Handler, R.M.; Canter, C.E.; Kalnes, T.N.; Lupton, F.S.; Kholiqov, O.; Shonnard, D.R.; Blowers, P.
Evaluation of environmental impacts from microalgae cultivation in open-air raceway ponds:
Analysis of the prior literature and investigation of wide variance in predicted impacts. Algal Res.
2012, 1, 83–92.
Energies 2013, 6 4923
56. Jorquera, O.; Kiperstok, A.; Sales, E.A.; Embiruau, M.; Ghirardi, M.L. Comparative energy
life-cycle analyses of microalgal biomass production in open ponds and photobioreactors.
Bioresour. Technol. 2010, 101, 1406–1413.
57. Sander, K.; Murthy, G.S. Life cycle analysis of algae biodiesel. Int. J. Life Cycle Assess. 2010, 15,
704–714.
58. Stephenson, A.L.; Kazamia, E.; Dennis, J.S. Life-cycle assessment of potential algal biodiesel
production in the United Kingdom: A comparison of raceways and air-lift tubular bioreactors.
Energy Fuels 2010, 24, 4062–4077.
59. Liu, X.; Clarens, A.F.; Colosi, L.M. Algae biodiesel has potential despite inconclusive results to
date. Bioresour. Technol. 2012, 104, 803–806.
60. Cordell, D.; Dragnet, J.-O.; White, S. The Story of phosphorus: Global food security and food for
thought. Glob. Environ. Chang. 2009, 19, 292–305.
61. Vaccari, D.A.; Strigul, N. Extrapolating phosphorus production to estimate resource reserves.
Chemosphere 2011, 84, 792–797.
© 2013 by the authors; licensee MDPI, Basel, Switzerland. This article is an open access article
distributed under the terms and conditions of the Creative Commons Attribution license
(http://creativecommons.org/licenses/by/3.0/).