life insurance ownership and demographic...
TRANSCRIPT

IPBJ Vol. 8(2), 51-65 (2016) 51
LIFE INSURANCE OWNERSHIP AND DEMOGRAPHIC BACKGROUND
OF ALOR SETAR CITY FOLK IN KEDAH
Tan Suang Sin
School of Economics, Finance and Banking
Universiti Utara Malaysia
Lim Chee Chee*
School of Economics, Finance and Banking
Universiti Utara Malaysia
*Corresponding author: [email protected]
ABSTRACT
This is a preliminary study conducted to examine the relationship between life insurance
ownership and the demographic background of Alor Setar city folk. A non-probability
convenience sampling technique was used to collect data from early February to mid March
2015. A total of 200 sets of structured questionnaires were distributed. After filtering out not
completely filled up questionnaires and outliers from the returning 140 sets, only 108 cases were
subject to binary logistic regression analysis. The major findings of this study show that ethnicity
and income have a significant relationship with life insurance ownership among Alor Setar city
folk. Life insurance policyholders are more likely to be Chinese who has higher income as
compared to Malay and low income earners. Other demographic variables (i.e. gender, age,
education, marital status and number of dependents) are found to have no significant
relationship with life insurance ownership among Alor Setar city folk. The study has proposed
that intensive promotions of Takaful family and micro-insurance be made targeting at the Malay
and low income earners. It is also suggested that future study with a bigger sample size be
conducted to cover wider areas in order to obtain more reliable findings and to enable the
generalization of findings.
Keywords: life insurance, demographic, binary logistic regression analysis

IPBJ Vol. 8(2), 51-65 (2016) 52
1.0 INTRODUCTION
Life insurance plays an important role in providing financial security to individuals and their
family. The predominant purpose of purchasing life insurance is to protect individuals against
any unforeseen financial risks which would be suffered by them and their family members due to
adverse events (e.g. the premature death of breadwinner). However, life insurance ownership
among Malaysians is still considered not as favorable as expected.
Two types of life insurance are sold in Malaysia, namely conventional life insurance and Islamic
life insurance (i.e. family Takaful). According to the Monthly Statistical Bulletin (November
2015) of Bank Negara Malaysia, the market penetration rates of conventional life insurance
(measured by the total number of life insurance policies in force divided by total population)
fluctuated over years hovering around 40% (i.e. 2010 at 40.4%, 2011 at 39.6% and 2014 at
41.0%). On the other hand, family Takaful business has been growing at a faster pace as
compared to conventional life insurance business (Bank Negara Malaysia, 2015). In 2010, the
market penetration rate of family Takaful (measured by the total number of Takaful certificates
in force divided by total population) was 10.6%. In 2014, the rate has increased to 13.4%.
According to the Performance Management and Delivery Unit (PEMANDU) (2013), it has been
tasked with the role, as outlined in Economic Transformation Programme (ETP), to increase
Malaysia’s life insurance market penetration rate (both conventional and Takaful) to 75% by
2020. However, in 2014, the life insurance market penetration rate (both conventional and
Takaful) of Malaysia was only at 54.4% as compared to Japan at 119.5% (Life Insurance
Association of Japan, 2015), Hong Kong at 149.3% (Office of Commissioner of Insurance,
2015), South Korea at 165.6% (Korea Life Insurance Association, 2014) and Singapore at
239.6% (Monetary Authority of Singapore, 2014). This implies that the conventional life
insurance and family Takaful markets of Malaysia still remain largely untapped. As such, more
studies are required to examine the profiles (e.g. demographic background) of those who have
owned life insurance (i.e. existing policyholders) so that necessary actions can be taken to
encourage those who have not owned life insurance (i.e. prospective policyholders) to purchase
life insurance. In line to fill the aforementioned gap, a project has been undertaken to examine
life insurance ownership and the demographic background of individuals at the major cities of
Kedah, Penang, Perlis and Perak in the northern regions of Malaysia. To start off, a study has
been conducted at Alor Setar and this paper will report the findings of this preliminary study.
This paper is structured as follows: Section 2 reviews past studies that have examined the
relationship between demographic variables and life insurance ownership, Section 3 states the
objectives of this study, Section 4 describes the research methodology, Section 5 provides and
discusses the results, and Section 6 concludes the findings of this study.
IPBJ Vol. 8(2), 51-65 (2016) 53
2.0 LITERATURE REVIEW
Past studies have investigated demographic variables (e.g. age, gender, marital status, education,
number of dependents, ethnicity and income) to examine whether they have a significant
relationship with the purchase (ownership) of life insurance. A brief review of related past
studies is provided below.
Baek and DeVaney (2005) have examined the purchase (ownership) of term life insurance
(which is a non cash value life insurance) and cash value life insurance in U.S. Their data are
obtained from the Survey of Consumer Finance for the year 2001. Their study examines the
demographic background of household heads who owned term life insurance and cash value life
insurance.
Their findings on term life insurance ownership show that the household heads tend to be those
who have married and a White. The likelihood to own term life insurance increases when the
household heads’ age rises until they become much older. There is a greater tendency to own
term life insurance among household heads in the second, third and fourth (higher) income tax
brackets (between $35,151 and $288,350) relative to those in the first (being the lowest) income
tax bracket (between $0 and $35,150). However, the education level and number of children of
household heads are found to be not significant factors of term life insurance ownership.
On the other hand, their findings on cash value life insurance ownership show that the household
heads tend to be those who have married, and who are either younger or older as compared to
those middle-aged. Household heads who have some college education are found to be more
likely to own cash value life insurance as compared to those who have education level of less
than high school. Household heads who are in the fifth (being the highest) income tax bracket
($288,351 or more) have a greater tendency to own cash value life insurance relative to those in
the first (being the lowest) income tax bracket (between $0 and $35,150). However, the
household heads who are a White have a low tendency to own cash value life insurance.
Meanwhile, the number of children of household heads is found to have no significant
relationship with cash value life insurance ownership.
Another related study on life insurance ownership in U.S. has been conducted by Gutter and
Hatcher (2008). Their data are obtained from the Survey of Consumer Finance for the year 2004.
The major findings of their study show that the probability of owning life insurance increases
with the increase in total household earnings and the age of household head. Their findings also
show that household heads who have completed high school education are more likely to own
life insurance than those who do not complete high school education. Household size and the
presence of a child are not significant factors of life insurance ownership. Although their study
has reported that there is a slight difference between African-American and White citizens in life
insurance ownership, the finding is not statistically significant.
Yet another related study on life insurance ownership in U.S., Frees and Sun (2010) have
examined the ownership of term life insurance and whole life insurance among household heads
in U.S. Their data are acquired from the Survey of Consumer Finance for the year 2004. Their
findings on term life insurance ownership show that there is a greater tendency for household

IPBJ Vol. 8(2), 51-65 (2016) 54
heads who earn higher income, who are better educated and whose household has a higher
average age to own term life insurance. Meanwhile, for whole life insurance ownership, none of
the demographic variables (i.e. income, education and age) examined are found to be significant.
One more related study on life insurance ownership in U.S., Kim, DeVaney and Kim (2012)
have examined two different types life insurance (i.e. term life insurance and cash value life
insurance) owned by American households in different income groups (ranging from low to
moderate). Their data is gathered through self-administrated questionnaires distributed to the
households with an annual household income not more than $80,000.
Their findings on household income show that it has a positive and significant relationship with
term life insurance ownership. Further analysis shows that relative to the households in the
lowest income group (earning less than $20,000 annually), the likelihood for the households in
other higher income groups to own term life insurance is shown to rise at varying degrees of
intensity: (i) five times greater for households in the income group earning between $40,001 and
$60,000 annually, (ii) more than four times for households in the income group earning between
$60,001 and $80,000 annually, and (iii) approximately three times greater for households in the
income group earning between $20,001 and $40,000 annually. In contrast, household income is
found to have no significant relationship with cash value life insurance ownership.
On the other hand, their findings on the age of household head show that it is positively and
significantly related to cash value life insurance ownership only. Meanwhile, for the marital
status of household head, household size and the education level of household head, they are
found to have no significant relationship with both term and cash value life insurance ownership.
Outside of U.S., Ćurak, Džaja and Pepur (2013) have conducted a study on life insurance
consumption (ownership) in the Republic of Croatia. The sample of their study consists of 95
respondents residing in the Republic of Croatia. Their findings on age show that individuals in
different age groups act differently on the purchase of life insurance. In their study, most
respondents in the age groups of 31-43 years old (69%) and 44-56 years old (72%) have
purchased life insurance. Almost half (47%) of the respondents in the age group of 57-69 years
old have purchased life insurance whilst only 20% of the respondents in the age group of 70
years old and above have purchased life insurance. Meanwhile, their findings on education show
that it has a positive and significant relationship with life insurance ownership, i.e. more highly
educated individuals tend to own life insurance. About 94% of the respondents with a university
degree have purchased life insurance. However, other demographic variables (i.e. gender, marital
status and number of dependents) examined in their study do not show significant relationship
with life insurance ownership.
There are a few past studies that have examined the relationship between demographic factors
and life insurance ownership in Malaysia. The studies of Tan, Wong and Law (2009), Loke and
Goh (2012) and Annamalah (2013) do not differentiate between conventional life insurance and
family Takaful. Their pool of life insurance comprises both conventional life insurance and
family Takaful. The study of Gustina and Abdullah (2012) is a comparative study whilst the
study of Sherif and Shaairi (2013) focuses on family Takaful only.

IPBJ Vol. 8(2), 51-65 (2016) 55
Tan, Wong and Law’s (2009) study examines life insurance ownership by randomly distributing
structured questionnaires to individuals throughout Malaysia. Their findings reveal that annual
household income and age have a positive and significant relationship with life insurance
ownership. However, number of children is found to be negatively and significantly related to
life insurance ownership. The finding on number of children does not provide support to
expected utility theory which states that individuals with a higher bequest motive (proxied by
number of dependents) would tend to have a greater tendency to purchase life insurance
(Campbell, 1980; Zhu, 2007). This unexpected finding has been explained by Tan, Wong and
Law (2009) that it could possibly due to Malaysians still have a strong cultural belief that their
children will fulfill their filial duties to take care of elderly parents. Thus, individuals with many
children tend to have less desire to buy life insurance. Meanwhile, for other demographic
variables, marital status, gender and education are found to be not significant factors of life
insurance ownership.
Loke and Goh’s (2012) study examines life insurance ownership of individuals in Penang. Their
data are gathered by randomly distributing self-administered questionnaires to individuals in
shopping malls, commercial areas and offices from mid March to mid April 2011. Their findings
show that income has a positive and significant relationship with life insurance ownership. The
likelihood to own life insurance increases by more than six times for high income group (earning
greater than RM6,000 monthly) relative to lower-middle income group (earning between
RM2,000 and RM4,000 monthly). Individuals in the age group of 20-29 years old have a lower
tendency to own life insurance as compared to those in the age group of 30-39 years old. Single
individuals are found to be less likely to own life insurance as compared to married individuals.
The likelihood to own life insurance is higher among the Chinese and Indian as compared to the
Malay. Number of dependents and gender are found to be not significantly related to life
insurance ownership. Contrary to expectation, their findings show that those who have tertiary
education are less likely to buy life insurance as compared to individuals who do not have
tertiary education. Loke and Goh (2012) have explained that the unexpected finding could
possibly due to Malaysian individuals with higher education (i.e. tertiary education) are more
interested in different types of financial instruments as wealth creation products instead of life
insurance.
Annamalah’s (2013) study examines life insurance ownership among married couples in
Malaysia. The study was conducted from 2012 to 2013 by distributing self-administered
questionnaires to household heads in the family. The major findings of the study show that
income and education are positively and significantly related to life insurance ownership.
However, age, ethnicity and number of children are found to be not significant factors.
Gustina and Abdullah’s (2012) comparative study examines the ownership of conventional life
insurance and family Takaful in Malaysia. Premium / contribution amount per policyholder /
participant is used to proxy life insurance ownership. Their data for the period from 1990 to 2009
are obtained from Bank Negara Malaysia and Department of Statistics Malaysia. Their major
findings show that income is the predominant factor influencing the ownership of conventional
life insurance, while education level is the most important factor influencing the ownership of
family Takaful. Although income is found to have a positive and significant relationship with
both the ownership of conventional life insurance and family Takaful, education level is found to

IPBJ Vol. 8(2), 51-65 (2016) 56
have a positive and significant relationship with the ownership of family Takaful only. Their
findings further show that religion (measured by the ratio of Muslim population to total
population) has a positive and significant relationship with the ownership of family Takaful
(only). This finding is important and it suggests that family Takaful serves as an alternative to
conventional life insurance for a country with a significant Muslim population.
Sherif and Shaairi’s (2013) study examines the ownership of family Takaful in Malaysia. Total
annual contribution amount is used to proxy life insurance ownership. Their data for the period
from 1986 to 2010 are obtained from Bank Negara Malaysia and Department of Statistics
Malaysia. Their major findings show that income, education level, dependency ratio and religion
(measured by total Muslim population) have a positive and significant relationship with the
ownership of family Takaful. A high dependency ratio implies there is more number of
dependents, so it stimulates the ownership of family Takaful. Their findings on income,
education level and religion provide support to the findings of Gustina and Abdullah (2012).
Based on the findings of past studies above, they can be summarized as below:
(a) Most studies have found that age is positively and significantly related to life insurance
ownership (Gutter and Hatcher, 2008; Tan, Wong and Law, 2009; Frees and Sun, 2010;
Kim, DeVaney and Kim, 2012).
(b) Past studies have consistently found that gender is not a significant factor of life
insurance ownership (Tan, Wong and Law, 2009; Loke and Goh, 2012; Ćurak, Džaja and
Pepur, 2013).
(c) Many past studies have found education to have a significant positive relationship with
life insurance ownership (Gutter and Hatcher, 2008; Frees and Sun, 2010; Gustina and
Abdullah, 2012; Annamalah, 2013; Ćurak, Džaja and Pepur, 2013; Sherif and Shaairi,
2013).
(d) The findings on the relationship between marital status and life insurance ownership are
inconclusive. Two past studies show that married individuals are more likely to own life
insurance (Baek and DeVaney, 2005; Loke and Goh, 2012) but the other three past
studies show that marital status is an insignificant factor of life insurance ownership (Tan,
Wong and Law, 2009; Kim, DeVaney and Kim, 2012; Ćurak, Džaja and Pepur, 2013).
(e) Most past studies have found that number of dependents is not a significant determinant
of life insurance ownership (Baek and DeVaney, 2005; Gutter and Hatcher, 2008; Kim,
DeVaney and Kim, 2012; Loke and Goh, 2012; Annamalah, 2013; Ćurak, Džaja and
Pepur, 2013).
(f) The findings on ethnicity are mixed. In the context of multi-ethnic country, the study of
Baek and DeVaney (2005) has found that ethnicity has a significant relationship with life
insurance ownership in U.S. but it is otherwise in the study of Gutter and Hatcher (2008).
Meanwhile, the study of Loke and Goh (2012) has found that there is a significant
relationship between ethnicity and life insurance ownership in Malaysia. Non-Malay
citizens are found to be more likely to own life insurance as compared to Malay citizens.
(g) The findings of most past studies show that income has a positive and significant
relationship with life insurance ownership (Baek and DeVaney, 2005; Gutter and Hatcher,
2008; Tan, Wong and Law, 2009; Frees and Sun, 2010; Gustina and Abdullah, 2012;

IPBJ Vol. 8(2), 51-65 (2016) 57
Kim, DeVaney and Kim, 2012; Loke and Goh, 2012; Annamalah, 2013; Sherif and
Shaairi, 2013).
Based on the review of past studies, the following remarks can be drawn:
(i) The findings of most past studies show that age, education and income have a significant
positive relationship with life insurance ownership.
(ii) Gender and number of dependents are consistently found to not have a significant
relationship with life insurance ownership.
(iii) The findings on marital status and ethnicity are mixed. Some past studies show that they
have a significant relationship with life insurance ownership but some other studies show
otherwise.
3.0 RESEARCH OBJECTIVES
This study is a preliminary investigation to examine life insurance ownership and the
demographic background of Alor Setar city folk in Kedah. The major objective of this study is to
examine the relationship between demographic variables and life insurance ownership. In
specific, this study is to examine whether:
a) age has a positive relationship with life insurance ownership;
b) education has a positive relationship with life insurance ownership;
c) income has a positive relationship with life insurance ownership;
d) gender has a relationship with life insurance ownership;
e) number of dependents has a (positive) relationship with life insurance ownership;
f) marital status has a relationship with life insurance ownership; and
g) ethnicity has a relationship with life insurance ownership.
4.0 RESEARCH METHODOLOGY
This section describes data collection, questionnaire design and the methods of analysis of this
study.
4.1 Data Collection
This study employed non-probability convenience sampling to collect its data. Non-probability
convenience sampling is a quick, inexpensive and convenient sampling method. This sampling
method will enable a preliminary study to try out its questionnaire in an economical manner with
less time consumed. As such an improved version of the questionnaire can be used in a
subsequent study which covers a wider area that adopts probability sampling method to draw its
samples that are representative of the population be conducted.
Data collection was conducted from early February to mid March 2015 in Alor Setar, Kedah.
Kedah is a northern state of Peninsular Malaysia, while Alor Setar is the second largest city in
Kedah. The units of analysis of this study are individuals approached at their work places and
residences. A total of 200 sets of structured questionnaires have been distributed, 140 sets were

IPBJ Vol. 8(2), 51-65 (2016) 58
being returned. However, only 112 sets were found to be completely filled up. After screening
for outliers, four cases deemed to have unacceptably large values of standardized residual
(ZResid) were being removed from the sample. Thus, only 108 cases are available for further
analysis.
4.2 Questionnaire Design
The questionnaire contains questions asking about life insurance ownership of the respondents
and their demographic characteristics such as gender, age, marital status, education level, number
of dependents, ethnicity and monthly income level. First, the respondents are asked a question of
“Do you own life insurance?” which has a binary choice of “yes” or “no” in order to find out
their life insurance ownership status. Next, for demographic information, the respondents are
required to indicate their (i) gender (either male or female), (ii) ethnicity (either Malay, Chinese
or Indian), (iii) marital status (either married or unmarried), (iv) education level (either
completed secondary / high school, obtained a bachelor’s degree, a master’s degree, or other
academic qualifications) and (v) monthly income level (either low income [earning less than
RM2,000], low-middle income [earning between RM2,000 and RM4,000], high-middle income
[earning between RM4,001 and RM6,000] and high income [earning more than RM6,000]).
Meanwhile, for age and number of dependents, the respondents are required to state their age and
number of persons in the family who depend on their financial support respectively.
4.3 Methods of Analysis
Binary logistic regression analysis is used to examine the relationship between demographic
variables (i.e. age, gender, marital status, education, number of dependents, ethnicity and income)
and life insurance ownership. Binary logistic regression analysis is employed by this study
because its outcome variable (i.e. life insurance ownership) is a non-metric variable with only
two choices of “yes” and “no”. Binary logistic regression analysis is preferred as compared to
discriminant analysis because the former does not require strict assumptions of multivariate
normality and equal variance-covariance matrices across groups (Hair et al, 2010). As such the
issue of whether the findings obtained are robust or not will not arise when the above
assumptions are not met. Besides that, the explanatory variables (i.e. demographic variables) of
binary logistic regression analysis (similar to multiple regression analysis) can be either
categorical or continuous, or a combination of both (Pallant, 2013).
Binary logistic regression analysis uses probability scores as its predicted values for outcome
variable (i.e. life insurance ownership). Its function is as shown below:
ii Xa
p
pLog
1
Where
p = The probability of respondents owning life insurance
(1 − p) = The probability of respondents not owning life insurance
p
pLog
1= The log of odds that respondents owned life insurance

IPBJ Vol. 8(2), 51-65 (2016) 59
βi = The respective coefficients of explanatory variables (i.e. demographic variables)
Xi = Explanatory variables (i.e. demographic variables) of the regression
ε = The stochastic disturbance term of the regression
Binary logistic regression analysis is sensitive to outliers, so it is important to subject individual
cases for diagnostic in order to detect outliers so that unrepresentative cases are removed before
further analysis is conducted. In general, cases with standardized residual (ZResid) values above
2.5 or less than -2.5 should be examined with care as these cases are clear outliers (Pallant, 2013).
In order to ensure that the estimated model is free from collinearity problem, multicollinearity
diagnostic test is performed by examining the two collinearity statistics of tolerance and variance
inflation factor (VIF) of the variables. As the rule of thumb, tolerance values less than 0.10 or
VIF values above 10 indicate the presence of multicollinearity (Pallant, 2013).
Next, the Omnibus Tests of Model Coefficients and Hosmer and Lemeshow Test are used to
examine the overall goodness of fit of the estimated model (Pallant, 2013). The estimated model
is regarded as a good fit model when the result of Omnibus Tests of Model Coefficients shows
that the estimated model is significantly better than the baseline model, and the result of Hosmer
and Lemeshow Test shows that the predicted values of the estimated model are not significantly
different from the observed values. Further, the “-2 Log Likelihood” (-2LL) statistic (which
represents the unexplained variance in the outcome variable, i.e. life insurance ownership) is
used to judge whether the estimated model is a better fit model relative to other estimated models
(Hair et al, 2010). A smaller -2LL value would reflect that the estimated model is a better fit
model relative to other estimated models.
On the other hand, the Cox & Snell and Nagelkerke R-squared values of the estimated model are
used to determine how much variations in the outcome variable (i.e. life insurance ownership)
can be explained by the explanatory variables (i.e. demographic variables) (Pallant, 2013).
Meanwhile, the overall correct percentage is used to gauge the percent of cases for which the
outcome variable (i.e. life insurance ownership) is correctly predicted by the estimated model
(Pallant, 2013).
5.0 DISCUSSION OF RESULTS
This section presents and discusses the results of this study. First, it describes the sample of this
study. Next, it provides the results of the estimated binary logistic regression model. Then,
discussions are made with regard to the goodness of fit of the estimated model, and the
relationship between demographic variables and life insurance ownership.
5.1 Descriptive Statistics
This study has 108 cases in its sample. Male respondents (50.9%) are slightly more than female
respondents (49.1%). More than half of the respondents (63.9%) are married and the remaining
36.1% are unmarried. About 58.3% of the respondents have completed secondary school, 30.6%
have a bachelor’s degree, 7.4% have a master’s degree and 3.7% have acquired other academic
qualifications (e.g. diploma, teaching or other private certifications). Chinese respondents
comprise 52.8%, while 38.9% are Malay and only 8.3% are Indian. About 31.5% of the
respondents have low monthly income, 40.8% have low-middle monthly income, 15.7% have

IPBJ Vol. 8(2), 51-65 (2016) 60
high-middle monthly income and 12.0% have high monthly income. About 59.3% of the
respondents owned life insurance, while 40.7% do not own any life insurance. The respondents
in the study are aged between 18 and 64 years old. Meanwhile, the number of family members
who depend on the respondent’s financial support ranged from none to eight persons. (Refer to
Table 1.)
Table 1
Descriptive statistics (n = 108)
Demographic Characteristic
(Categorical variable)
Attribute Frequency Percent
(%)
Gender Male 55 50.9
Female 53 49.1
Marital status Married 69 63.9
Unmarried 39 36.1
Education level Secondary / high school 63 58.3
Bachelor’s degree 33 30.6
Master’s degree 8 7.4
Other academic qualifications 4 3.7
Ethnicity Chinese 57 52.8
Malay 42 38.9
Indian 9 8.3
Income level Low (< RM2,000) 34 31.5
Low-middle (RM2,000-RM4,000) 44 40.8
High-middle (RM4,001-RM6,000) 17 15.7
High (> RM6,000) 13 12.0
Ownership of life insurance Yes 64 59.3
No 44 40.7
Demographic characteristic
(Continuous variable)
Average Minimum Maximum
Age 37 18 64
Number of dependents 2 0 8
5.2 Estimated Binary Logistic Regression Model and its Goodness of Fit
Table 2 presents the results of the estimated binary logistic regression model in panel A and the
results on the goodness of fit of the estimated model in panel B. To start off, this section
highlights and discusses the goodness of fit of the estimated model. Then, it moves on to discuss
the relationship between demographic variables and life insurance ownership.

IPBJ Vol. 8(2), 51-65 (2016) 61
Table 2
Estimated Model showing the relationship between demographic variables and life insurance
ownership and its goodness of Fit (n = 108)
A. Estimated Model
Variable
B
S.E. Wald
Exp(B)
95% C.I. for
Exp(B)
Lower Upper
Male -0.344 0.680 0.256 0.709 0.187 2.688
Age 0.105 0.054 3.733 1.110 0.998 1.235
Married -1.348 1.190 1.283 0.260 0.025 2.677
Bachelor’s degree 0.635 0.829 0.587 1.888 0.372 9.582
Master’s degree 0.119 1.126 0.011 1.126 0.124 10.223
Others academic qualifications -1.228 3.125 0.154 0.293 0.001 133.751
Number of dependents 0.246 0.217 1.294 1.279 0.837 1.956
Chinese 3.611 ** 0.915 15.589 37.019 6.164 222.328
Indian 0.910 1.102 0.682 2.484 0.287 21.517
Low-middle income 2.961 ** 1.013 8.550 19.318 2.655 140.583
High-middle income 4.668 ** 1.609 8.418 106.510 4.548 2494.339
High income 0.891 1.480 0.362 2.437 0.134 44.291
Constant -6.816 1.922 12.577 0.001
Note: ** indicates significant at 1% level
B. Goodness of Fit of Estimated Model
Omnibus Tests of Model Coefficients, Chi-square (df = 12, p-value = 0.000) 80.393
Hosmer and Lemeshow Test, Chi-square (df = 8, p-value = 0.981) 1.994
-2 Log Likelihood 65.601
Cox & Snell R-Squared 0.525
Nagelkerke R-Squared 0.708
Overall Correct Percentage 84.3%
The estimated model is free from collinearity problem. No variables in the model have a
tolerance value less than 0.10 or a VIF value above 10. From the panel B of Table 2, the result of
Omnibus Tests of Model Coefficients is significant (Chi-square value = 80.393, df = 12, p-value
= 0.000). This shows that the estimated model is significantly better than the baseline model. The
result of Hosmer and Lemeshow Test is not significant (Chi-square value = 1.994, df = 8, p-
value = 0.981). This indicates that the predicted outcomes for life insurance ownership (from the
estimated model) are not significantly different from the observed samples of life insurance
ownership. Further, the estimated model which has excluded four outlier cases (with n = 108) is
a better fit model relative to the estimated model which does not remove the outlier cases (with n
= 112) as the former model (65.601) has a smaller -2LL value than the latter model (92.656). On
the other hand, the demographic variables collectively are able to explain 52.5% (Cox & Snell R-
squared value) to 70.8% (Nagelkerke R-squared value) of the variance in life insurance
ownership. Further, the estimated model can correctly predict 84.3% of the cases. (In other
words, life insurance ownership of 91 cases [out of a total of 108] in this study is correctly
IPBJ Vol. 8(2), 51-65 (2016) 62
predicted.) Hence, based on all the above results, the estimated model is regarded to be a good fit
model.
From the panel A of Table 2, the results show that only two (i.e. ethnicity and income) among
the seven demographic variables examined are found to have a significant relationship with life
insurance ownership. The findings on ethnicity show that the Chinese (B = 3.611, p-value =
0.000) in Alor Setar tends to own life insurance. The results show that the Chinese is 37 times
more likely to own life insurance as compared to the Malay. This finding provides support to the
finding of Loke and Goh (2012) whose study has found that the Chinese (in Penang) tends to
own life insurance as compared to the Malay. The finding of significantly more Chinese than
Malay owning life insurance could be due to the fact that the Malay in Malaysia is a Muslim and
the teachings of Islam hinder Muslim from purchasing (conventional) life insurance because
(conventional) insurance contains the elements of Al-gharar (uncertainty), Al-maisir (gambling)
and Al-riba (interest) that contravene the decrees of Shariah laws. Besides that, a Muslim
believes that his or her life is in the God’s hands. Thus, they are less inclined to own life
insurance. The findings on income show that the individuals in both the low-middle (B = 2.961,
p-value = 0.003) and high-middle (B = 4.668, p-value = 0.004) income groups in Alor Setar tend
to own life insurance. The results show that these two income groups are 19 times and 107 times
respectively more likely to own life insurance relative to the low income group. These results
validate the findings of past studies that the likelihood to own life insurance increases at higher
income levels (Gutter and Hatcher, 2008; Tan, Wong and Law, 2009; Frees and Sun, 2010;
Gustina and Abdullah, 2012; Annamalah, 2013; Sherif and Shaairi, 2013) at different degrees of
intensity (Baek and DeVaney, 2005; Kim, DeVaney and Kim, 2012; Loke and Goh, 2012).
When the income level has increased, the purchasing power of the individuals will also increase.
Hence, the purchase of life insurance becomes more possible.
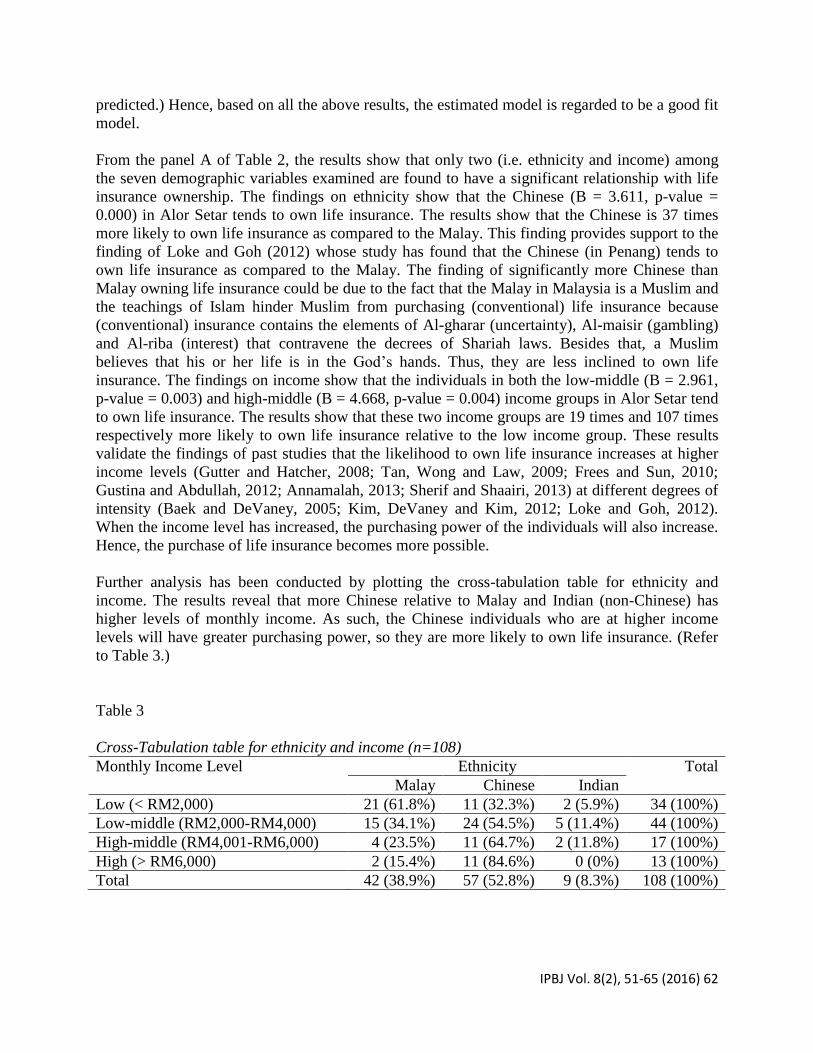
Further analysis has been conducted by plotting the cross-tabulation table for ethnicity and
income. The results reveal that more Chinese relative to Malay and Indian (non-Chinese) has
higher levels of monthly income. As such, the Chinese individuals who are at higher income
levels will have greater purchasing power, so they are more likely to own life insurance. (Refer
to Table 3.)
Table 3
Cross-Tabulation table for ethnicity and income (n=108)
Monthly Income Level Ethnicity Total
Malay Chinese Indian
Low (< RM2,000) 21 (61.8%) 11 (32.3%) 2 (5.9%) 34 (100%)
Low-middle (RM2,000-RM4,000) 15 (34.1%) 24 (54.5%) 5 (11.4%) 44 (100%)
High-middle (RM4,001-RM6,000) 4 (23.5%) 11 (64.7%) 2 (11.8%) 17 (100%)
High (> RM6,000) 2 (15.4%) 11 (84.6%) 0 (0%) 13 (100%)
Total 42 (38.9%) 57 (52.8%) 9 (8.3%) 108 (100%)
IPBJ Vol. 8(2), 51-65 (2016) 63
Other demographic variables, namely gender, age, marital status, education and number of
dependents, have failed to show any significant relationship with life insurance ownership
among Alor Setar city folk. The insignificant findings on gender (Tan, Wong and Law, 2009;
Loke and Goh, 2012; Ćurak, Džaja and Pepur, 2013), marital status (Tan, Wong and Law, 2009;
Kim, DeVaney and Kim, 2012; Ćurak, Džaja and Pepur, 2013) and number of dependents (Baek
and DeVaney, 2005; Gutter and Hatcher, 2008; Kim, DeVaney and Kim, 2012; Loke and Goh,
2012; Annamalah, 2013; Ćurak, Džaja and Pepur, 2013) in this study have provided further
support to the findings of past studies.
The findings on age and number of dependents, although insignificant, they have displayed the
expected positive sign. When individuals grow older, they go through different life events at
different stages of their lives and eventually come to the time when they feel that life insurance is
needed to provide protection for their dependents from declining income as a result of their
untimely death, or (in line with expected utility theory) to fulfil their bequest motives of leaving
money behind when they die.
Gender is also found to be insignificant. However, its relationship with life insurance ownership
should be further explored in future study because male and female individuals show various
distinct differences. In general, females have a longer life expectancy than males. Moreover, the
social roles of women have changed in the present days when they can easily gain access to
education and are able to secure a job. It is not surprised that women can also be the breadwinner
of the family.
Marital status and education are also found to have no significant relationship with life insurance
ownership. The results for marital status unexpectedly show that married individuals are less
likely to own life insurance. The possible explanation might be that married individuals could
have experienced financial constrains in view of the costs of living have increased dramatically
over the years. As such, their priority is not life insurance but to spend their income on basic
needs and to pay for necessities expenses (e.g. food, education for children, mortgage,
transportation and so on). On the other hand, for education, the results show that individuals who
have a bachelor’s degree or a master’s degree are more likely to own life insurance. Individuals
who have attained higher education are more aware of the importance of life insurance as part of
their personal financial management, so they are more likely to own life insurance as compared
to those who have lower levels of education.
At this stage, it is still too early to conclude that these demographic variables do not have a
significant relationship with life insurance ownership. The insignificant findings of these
demographic variables might be due to the major setback of this study, i.e. its small sample size
(which is reflected by the wide confidence intervals as shown in the “95% CI for Exp(B)”
column in Table 2). Binary logistic regression analysis uses maximum likelihood as its
estimation technique by which it requires a larger sample size as compared to multiple regression
analysis. According to Hair et al. (2010), a sample size greater than 400 is preferable and each
variable is required to have at least 10 observations per estimated parameter. Therefore, a larger
sample size will be needed for better results in future study.

IPBJ Vol. 8(2), 51-65 (2016) 64
6.0 CONCLUSIONS
Life insurance market penetration rate (both conventional and Takaful) of Malaysia is still
considered low and almost half (45.6%) of the population is still uninsured. Therefore, the life
insurance market of Malaysia has not been fully tapped yet. Therefore, this study has been
conducted around Alor Setar (as a preliminary study) to investigate the demographic background
of individuals and their life insurance ownership to identify the demographic variables that have
a significant relationship with life insurance ownership. By doing so, appropriate actions can be
taken to encourage those who have not owned life insurance to purchase it.
The major findings of this study show that ethnicity and income have a significant relationship
with life insurance ownership. Life insurance policyholders in Alor Setar are more likely to be
Chinese who has higher levels of income as compared to Malay and low income earners. Life
insurance is mostly purchased by the Chinese who is more financially capable.
For the case of Malaysia, the Malay being Muslim is hesitant to purchase (conventional) life
insurance due to their Islamic teachings and beliefs. As family Takaful can serve as an
alternative to conventional life insurance for a country with a significant Muslim population,
Takaful products which are Shariah compliance could be promoted to the Malay in encouraging
greater life insurance ownership among them. On the other hand, in order to raise life insurance
ownership among low income earners, an affordable life insurance product should be promoted
to them so that low income will no longer become an excuse that will restrain them from owning
life insurance. For example, micro-insurance with low premium payments (which has been
available in Malaysia since 2010) could be proposed to this targeted group.
Other demographic variables (i.e. gender, age, education, marital status and number of
dependents) are found to have no significant relationship with life insurance ownership among
Alor Setar city folk. As this study is confined to Alor Setar only and has a small sample size, it is
suggested that future study be conducted to cover a wider range of areas and to include many
respondents (a greater sample size) in order to obtain more reliable findings and to enable the
generalization of findings.
7.0 REFERENCES
Annamalah, S. (2013). Profiling and purchasing decision of life insurance policies among
married couples in Malaysia. World Applied Sciences Journal, 23(3), 296-304.
Baek, E., & DeVaney, S. A. (2005). Human capital, bequest motives, risk and the purchase of
life insurance. Journal of Personal Finance, 4(2), 62-84.
Bank Negara Malaysia. (2015). Monthly Statistical Bulletin November 2015. Retrieved from
http://www.bnm.gov.my/index.php?ch=en_publication_catalogue&pg=en_publication_m
sb&mth=11&yr=2015&lang=en.
Campbell, R. A. (1980). The demand for life insurance: An application of the economics of
uncertainty. Journal of Finance, 35(5), 1155-1172.
Ćurak, M., Džaja, I., & Pepur, S. (2013). The effect of social and demographic factors on life
insurance demand in Croatia. International Journal of Business and Social Science, 4(9),
65-72.

IPBJ Vol. 8(2), 51-65 (2016) 65
Frees, E. W., & Sun, Y. (2010). Household life insurance demand: A multivariate two-part
model. North American Actuarial Journal, 14(3), 338-354.
Gustina, & Abdullah, N. I. (2012). Analysis of demand for family takaful and life insurance: A
comparative study in Malaysia. Journal of Islamic Economic, Banking and Finance, 8(4),
67-86.
Gutter, M. S., & Hatcher, C. B. (2008). Racial differences in the demand for life insurance.
Journal of Risk and Insurance, 75(3), 677-689.
Hair, J. F. Jr., Black, W. C., Babin, B. J., & Anderson, R. E. (2010). Multivariate Data Analysis:
A Global Perspective (7th ed.). Upper Saddle River, New Jersey: Pearson Education.
Kim, H., DeVaney, S. A., & Kim, J. (2012). Which low- and moderate- income families
purchase life insurance? Family and Consumer Science Research Journal, 40(3), 295-312.
Korea Life Insurance Association. (2014). Annual Report 2014. Retrieved from
http://www.klia.or.kr/eng/consumer/consumer_01.do?bCd=&bIdx=0.
Life Insurance Association of Japan. (2015). Overview of life insurance industry in Japan.
Retrieved from http://www.falia.or.jp/assets/pdf/japan_risk/201512Overview_of_Life_
Ins.pdf.
Loke, Y. J., & Goh, Y. Y. (2012). Purchase decision of life insurance policies among Malaysians.
International Journal of Social Science and Humanity, 2(5), 415-420.
Monetary Authority of Singapore. (2014). Insurance Statistics 2014. Retrieved from
http://www.mas.gov.sg/Statistics/Insurance-Statistics/Annual-Statistics/Insurance-
Statistics-2014.aspx.
Office of Commissioner of Insurance. (2015). Annual Report 2015. Retrieved from
http://www.oci.gov.hk/press/index_01.html.
Pallant, J. (2013). SPSS Survival Manual: A Step by Step Guide to Data Analysis Using IBM
SPSS (5th ed.). New York, NY: McGraw-Hill.
Performance Management and Delivery Unit (PEMANDU). (2013). EPP 5: Insuring most, if not
all of our population. Retrieved from http://etp.pemandu.gov.my/Financial_Services-@-
Financial_ Services _-_EPP_5-;_Insuring_Most,_If_Not_All,_of_Our_Population.aspx.
Sherif, M., & Shaairi, N. A. (2013). Determinants of demand on family takaful in Malaysia.
Journal of Islamic Accounting and Business Research, 4(1), 26-50.
Tan, H. B., Wong, M. F., & Law, S. H. (2009). The effect of consumer factors and firm
efficiency on Malaysian life insurance expenditure. International Journal of Business and
Society, 10(1), 59-73.
Zhu, Y. (2007). One-period model of individual consumption, life insurance and investment
decisions. Journal of Risk and Insurance, 74(3), 613-636.