life sciences innovation as a catalyst for economic development:
TRANSCRIPT

Life Sciences Innovation as a Catalyst for
Economic Development:The Role of the Massachusetts Life Sciences Center
AuthorsBarry Bluestone
Alan Clayton-Matthews
EditorKathleen Clute, The Boston Foundation
The Kitty and Michael Dukakis Center for
Urban and Regional Policy, Northeastern University
March 2013
24128_Spectrum Text.indd 1 3/14/13 11:29 AM
In 2003, a distinguished group of university leaders, educators and business representatives came together for a unique and unprecedented summit, spearheaded by Harvard Business School professor Michael Porter and hosted by the presidents of MIT and Harvard, Susan Hockfield and Drew Gilpin Faust. This was the same year those two universities played a major role in the international team that cracked the human genome.
The summit’s purpose was to discuss the state’s life sciences “super cluster,” meaning all of the many sectors that are involved in the life sciences. Everyone attending agreed that strengthening the life sciences was not only smart and played to our state’s strengths, it was crucial to our future global competitiveness. It could mean jobs for hundreds of thousands and billions added to the Massachusetts economy.
While the summit was stimulating, there was no established vehicle to build on the momentum that it generated. And so, in 2005, the Boston Foundation provided a grant of $125,000 to create the Massachusetts Life Sciences Collaborative. The Organizing Committee for the new group included the leaders of all of the Boston area’s major universities, teaching hospitals, life-sciences companies and venture-capital firms.
In March of 2007, Governor Deval Patrick spoke at one of the Collaborative’s meetings about the importance of the life sciences to the Commonwealth. He previewed an announcement he would make publicly later that year about the creation of a new Massachusetts Life Sciences Initiative, which represented a 10-year, $1 billion investment to enhance and strengthen the state’s leadership in the life sciences.
The Boston Foundation was honored to play a major convening role in bringing together the stakeholders for those early discussions. And now we are proud to publish this first report on the Massachusetts Life Sciences Initiative and the work of the quasi-public agency charged with carrying out its mission.
We have published many reports researched by the lead author of this report, Barry Bluestone, Director of the Kitty and Michael Dukakis Center for Urban Affairs at Northeastern. Reports from the Dukakis Center are always thorough and compelling, but not all of them carry good news. This one does, especially when it comes to economic impact. The $56.6 million Massachusetts awarded in tax incentives to life sciences firms between 2009 and 2011 has created 2,500 jobs, which should generate more than $266 million in wages and salaries during the next five years. In fact, the Commonwealth’s life sciences super cluster has risen to number one in the nation in terms of per capita employment, with close to 14,300 jobs for every one million residents.
These jobs are not just for workers with advanced degrees: at least one in five require no more than a two-year associate’s degree and another 48 percent require just a bachelor’s degree. For the Boston Foundation, this confirms our deep investment in supporting the full education pipeline and the importance of preparing college students for well-paying jobs in a field that will only grow.
Estimating the economic impact of this life sciences super cluster is within our grasp. Evaluating its broader value to society is daunting because of the almost limitless potential it has for improving the lives and well-being of people here in Massachusetts and around the world.
Paul S. Grogan President & CEO
Preface
24128_Spectrum Text.indd 2 3/14/13 11:29 AM

3L i f e S c i e n c e s I n n o v a t i o n a s a C a t a l y s t f o r E c o n o m i c D e v e l o p m e n t
Executive Summary . . . . . . . . . . . . . . . . . . . . . . . . . . . . . . . . . . . . . . . . . . . . . . . . . . . . . . . . . . . . . . . . . . . . . . . . . . . . . . . . . . . . . . . . . . . . 5The Life Sciences Super Cluster and the MLSC . . . . . . . . . . . . . . . . . . . . . . . . . . . . . . . . . . . . . . . . . . . . . . . . . . . . . . . . . . . . . . . . . . . 5Special Features of the Massachusetts Life Sciences Center . . . . . . . . . . . . . . . . . . . . . . . . . . . . . . . . . . . . . . . . . . . . . . . . . . . . . . . 6New vs. Old Growth Theory . . . . . . . . . . . . . . . . . . . . . . . . . . . . . . . . . . . . . . . . . . . . . . . . . . . . . . . . . . . . . . . . . . . . . . . . . . . . . . . . . . . 6Has the MLSC Been Successful? . . . . . . . . . . . . . . . . . . . . . . . . . . . . . . . . . . . . . . . . . . . . . . . . . . . . . . . . . . . . . . . . . . . . . . . . . . . . . . 7The Unique Growth Pattern of Regional Life Sciences Clusters . . . . . . . . . . . . . . . . . . . . . . . . . . . . . . . . . . . . . . . . . . . . . . . . . . . . . 7The Massachusetts Life Sciences: A Record of Output and Employment Growth . . . . . . . . . . . . . . . . . . . . . . . . . . . . . . . . . . . . . . . 9Why Has the MLSC Been so Successful at Building the Life Sciences Ecosystem? . . . . . . . . . . . . . . . . . . . . . . . . . . . . . . . . . . . . 11Conclusions . . . . . . . . . . . . . . . . . . . . . . . . . . . . . . . . . . . . . . . . . . . . . . . . . . . . . . . . . . . . . . . . . . . . . . . . . . . . . . . . . . . . . . . . . . . . . . . 11
Introduction . . . . . . . . . . . . . . . . . . . . . . . . . . . . . . . . . . . . . . . . . . . . . . . . . . . . . . . . . . . . . . . . . . . . . . . . . . . . . . . . . . . . . . . . . . . . . . . . . . 13
CHAPTER ONE: About the Massachusetts Life Sciences Center . . . . . . . . . . . . . . . . . . . . . . . . . . . . . . . . . . . . . . . . . . . . . . . . . . . . 15
CHAPTER TWO: The Size and Scope of Public Tax Expenditures and Public Subsidies . . . . . . . . . . . . . . . . . . . . . . . . . . . . . . 19
CHAPTER THREE: Industrial Policy: Pros and Cons . . . . . . . . . . . . . . . . . . . . . . . . . . . . . . . . . . . . . . . . . . . . . . . . . . . . . . . . . . . . . . . 21New vs. Old Growth Theory . . . . . . . . . . . . . . . . . . . . . . . . . . . . . . . . . . . . . . . . . . . . . . . . . . . . . . . . . . . . . . . . . . . . . . . . . . . . . . . . . . 21Public Investment in R&D . . . . . . . . . . . . . . . . . . . . . . . . . . . . . . . . . . . . . . . . . . . . . . . . . . . . . . . . . . . . . . . . . . . . . . . . . . . . . . . . . . .22The Trend in Federal R&D Spending . . . . . . . . . . . . . . . . . . . . . . . . . . . . . . . . . . . . . . . . . . . . . . . . . . . . . . . . . . . . . . . . . . . . . . . . . . . 23The Role of R&D Investment at the State Level . . . . . . . . . . . . . . . . . . . . . . . . . . . . . . . . . . . . . . . . . . . . . . . . . . . . . . . . . . . . . . . . . 24
CHAPTER FOUR: The Emergence of the Massachusetts Biotechnology Super Cluster . . . . . . . . . . . . . . . . . . . . . . . . . . . . . . 27
CHAPTER FIVE: The Massachusetts Life Sciences Center . . . . . . . . . . . . . . . . . . . . . . . . . . . . . . . . . . . . . . . . . . . . . . . . . . . . . . . . .29
CHAPTER SIX: Output and Employment in the Massachusetts Life Sciences Super Cluster . . . . . . . . . . . . . . . . . . . . . . . . . .33Life Sciences Employment Trends: Massachusetts vs. the United States . . . . . . . . . . . . . . . . . . . . . . . . . . . . . . . . . . . . . . . . . . . . 35The Development of the Life Sciences “Ecosystem” . . . . . . . . . . . . . . . . . . . . . . . . . . . . . . . . . . . . . . . . . . . . . . . . . . . . . . . . . . . . . . 39
CHAPTER SEVEN: The Key Role of the MLSC: What We Learned from the Interview Data . . . . . . . . . . . . . . . . . . . . . . . . . . . . 39The Unique Growth Pattern of Regional Life Sciences Clusters . . . . . . . . . . . . . . . . . . . . . . . . . . . . . . . . . . . . . . . . . . . . . . . . . . . .40The MLSC “Modus Operandi” . . . . . . . . . . . . . . . . . . . . . . . . . . . . . . . . . . . . . . . . . . . . . . . . . . . . . . . . . . . . . . . . . . . . . . . . . . . . . . . . 42The Long-Term Impact of the Commonwealth’s Life Sciences Initiative. . . . . . . . . . . . . . . . . . . . . . . . . . . . . . . . . . . . . . . . . . . . . .48Assessment of the MLSC Staff . . . . . . . . . . . . . . . . . . . . . . . . . . . . . . . . . . . . . . . . . . . . . . . . . . . . . . . . . . . . . . . . . . . . . . . . . . . . . . .48
Conclusions . . . . . . . . . . . . . . . . . . . . . . . . . . . . . . . . . . . . . . . . . . . . . . . . . . . . . . . . . . . . . . . . . . . . . . . . . . . . . . . . . . . . . . . . . . . . . . . . . . . 51
Endnotes . . . . . . . . . . . . . . . . . . . . . . . . . . . . . . . . . . . . . . . . . . . . . . . . . . . . . . . . . . . . . . . . . . . . . . . . . . . . . . . . . . . . . . . . . . . . . . . . . . . . . .53
Contents
24128_Spectrum Text.indd 3 3/14/13 11:29 AM

4 U n d e r s t a n d i n g B o s t o n
24128_Spectrum Text.indd 4 3/14/13 11:29 AM

5L i f e S c i e n c e s I n n o v a t i o n a s a C a t a l y s t f o r E c o n o m i c D e v e l o p m e n t
Executive Summary
This report provides an up-to-date, independent evaluation of the $1 billion, 10-year Massachusetts Life Sciences Initiative and the Massachusetts Life Sciences Center (MLSC) charged with the responsibility of carry-ing out its mission. The initiative was established in July 2008 by Governor Deval Patrick’s Administration and the Legislature to encourage the growth of discovery and production in the life sciences, including biotech-nology, pharmaceuticals, medical diagnostics, medi-cal devices and bioinformatics in the Commonwealth. Based on the region’s existing comparative advantage in life sciences research and development (R&D) emanat-ing from the laboratories of its leading universities and medical institutions, this substantial infusion of public funds was undertaken with the ambitious goal of making this cluster of industry sectors the most success-ful in the world.
This evaluation comes at a propitious time, given the state of fiscal affairs in the Commonwealth and the nation. Virtually every unit of government is scrutiniz-ing the use of each tax dollar to ensure that public reve-nue is being spent effectively and efficiently. Put simply, our goal in this evaluation was to gather as much data as possible to assess whether the Commonwealth’s size-able commitment of public resources is paying off in the form of a life sciences “super cluster” capable of attract-ing massive amounts of investment dollars, generating well-paying jobs for Massachusetts residents and yield-ing additional tax revenue for the Commonwealth.
The Life Sciences Super Cluster and the MLSCAfter it was created, the MLSC sought to develop as a key element of its strategy the creation of a collaborative “ecosystem” encompassing all aspects of the state’s life sciences. It would do this by encouraging the develop-ment of a dense, highly connected community of schol-ars, entrepreneurs, industry leaders, venture capitalists and government officials who were all dedicated to the success of this sector. Unlike many narrowly focused state economic development initiatives, the Center has
chosen to guide its investments with a broad range of strategic priorities geared to enhance all aspects of the life sciences cluster. These include:
n funding translational research that converts new discoveries into marketable products and services
n investing in promising new technologies
n ensuring worker skill acquisition that aligns with the needs of life sciences industries
n creating new infrastructure with shared resources to accelerate life sciences innovation
n building partnerships among segments of the local and international life sciences communities
To accomplish these goals, the Center relies on a portfo-lio of seven distinct programs. These include:
Cooperative Research Grants to support industry-spon-sored research at universities in order to facilitate scien-tific discoveries that lead to medical applications. These grants match industry contributions dollar for dollar.
Internship Challenge Program to provide funds for interns working at start-up and smaller Massachusetts life sciences companies.
New Investigator Grants to spur innovative research and advance the careers of new investigators working on cutting-edge research at academic research centers in Massachusetts.
Life Sciences Accelerator Loan Program to make loans available to early-stage companies and help leverage additional sources of capital.
Small Business Matching Grant (SBMG) Program to provide matching support to firms on the verge of commercializing new technologies developed with Phase II or Post-Phase II federal Small Business Innovation Research (SBIR) awards or federal Small Business Technology Transfer (STTR) grants.
Life Sciences Tax Incentive Program to offer a combina-tion of 10 competitively awarded tax incentives avail-able to companies that meet specified hiring goals.
24128_Spectrum Text.indd 5 3/14/13 11:29 AM

6 U n d e r s t a n d i n g B o s t o n
Capital Projects Fund to provide capital for equip-ment and supplies for high schools in Gateway Cities, vocational/technical schools, and community colleges; and for capital projects at academic/research institu-tions, business incubators, and other not-for-profit organizations.
Between 2008 and June 30, 2012, the Center directly invested or committed more than $300 million in state funds that have leveraged more than $1 billion in third-party investments by private businesses, the federal government and foundations, according to the MLSC FY2012 Report. Table 1 provides a breakdown of these investments.
Special Features of the Massachusetts Life Sciences CenterOur analysis revealed that, aside from its extraordinarily broad mandate, there are other factors that make the MLSC quite different from most government subsidy programs.
First, the MLSC operates under a Board of Directors that includes state government officials, but also industry CEOs, leaders from academia and medicine, bioscience researchers and others who have great knowledge of the life sciences.
Second, MLSC accelerator loans and other investments are reviewed by a panel of more than 200 specialists who advise the Center’s Scientific Advisory Board (SAB), which itself is dominated by academic researchers, industry scientists, and private venture-capital experts who together can judge both the scientific and economic
potential of an MLSC investment. Accelerator loans are also reviewed by private venture-capital experts who can assess the economic potential of recipient firms.
And third, the Center insists on accountability in terms of private sector investment matches. The Center also retains the power (and has utilized it) to “claw back” tax incentives if and when specific job creation goals are not reached by grant recipients.
We discovered from our interviews with life sciences executives, trade association leaders and members of the MSLC Scientific Advisory Board that the high level of professionalism associated with the Center’s expert-based review process has resulted in MLSC invest-ments that appear to have a high rate of return for the Commonwealth. We will return to this point, but must first touch upon a finding even more important than the measured rates of return to specific MLSC programs.
New vs. Old Growth TheoryTo properly assess the value of the Life Sciences Initia-tive and the MLSC, it is useful to place its activities in the context of economic growth theory. What is now known as the “old growth theory” suggests that economic pros-perity springs from the accumulation of ever greater stocks of the fundamental ingredients of production: capital, labor and natural resources. Those countries that find ways of increasing investment in plant and equip-ment, adding to labor supply and extracting more natural resources are the ones that will become more affluent.
While not completely discounting this approach to growth, a “new growth theory” has evolved that places technological progress at the very epicenter of growth dynamics—even more important than capital, labor and resource inputs. Advances in technology and interdepen-dencies between new ideas and new investment provide the basis for entire new industries and products that generate additional wealth and raise living standards.
Innovation-based growth is so powerful because it avoids the classic problem of diminishing returns on any given investment. With this type of growth, once the fixed cost of creating a new technology has been incurred, the formula can be used over and over again at little or no cost. As such, there can be increasing returns paying enormous dividends to society.
Moreover, the new innovation-based growth theory
TABLE 1
Distribution of MLSC Investments by Dollar Amount (June 2008–June 2012)
Capital Projects (12) $186,950,000
Company Grants and Accelerator Loans (31) $22,907,000
Academic Research Grants (35) $23,346,344
Tax Incentives (56) $56,595,093
Interns Funded for Workforce Development (884) $6,903,164
Equipment and Supply Grants for Schools (32) $3,333,675
Other Grants/Business Plan Competitions $1,540,000
TOTAL $301,575,276
Source: Massachusetts Life Sciences Center, 2013
24128_Spectrum Text.indd 6 3/14/13 11:29 AM

7L i f e S c i e n c e s I n n o v a t i o n a s a C a t a l y s t f o r E c o n o m i c D e v e l o p m e n t
posits a strong reciprocity among the rate of skill acqui-sition by workers, investments in new capital and new inventions. Thus, programs that combine incentives for innovation along with resources to augment human capital should fuel rapid economic growth more than anything else society can do to promote prosperity.
What is special about the Massachusetts Life Sciences Initiative is that it focuses explicitly on increasing the rate of innovation by encouraging more research and develop-ment (R&D) in the life sciences and helping small firms in this super cluster convert basic research into marketable products and services. New growth theory posits that this activity is the very fountain of economic growth.
Has the MLSC Been Successful?Unfortunately, keeping score on the success of innova-tion is difficult. Instead of a more-or-less certain return to a given infusion of capital under the old growth theory, under the new growth theory, innovation tends to deliver stronger long-term growth but it is “lumpy, discontinu-ous, and nonlinear.” There can be a long gap between the time a new innovation is first incorporated into produc-tion and the time that it pays off in terms of increased productivity, output and jobs. In the short term, it can be discouraging, as investments in fundamental innovation usually have little immediate payoff. It will take decades to realize the full benefits to humanity and the economy from the advances now being made in drug discovery, medical diagnostics and medical devices.
What we can do is measure the short-term direct benefits of MLSC investments and consider the views of experts as to whether the Center has indeed played a critical role in creating a life sciences “ecosystem” that attracts investment and generates jobs in this sector.
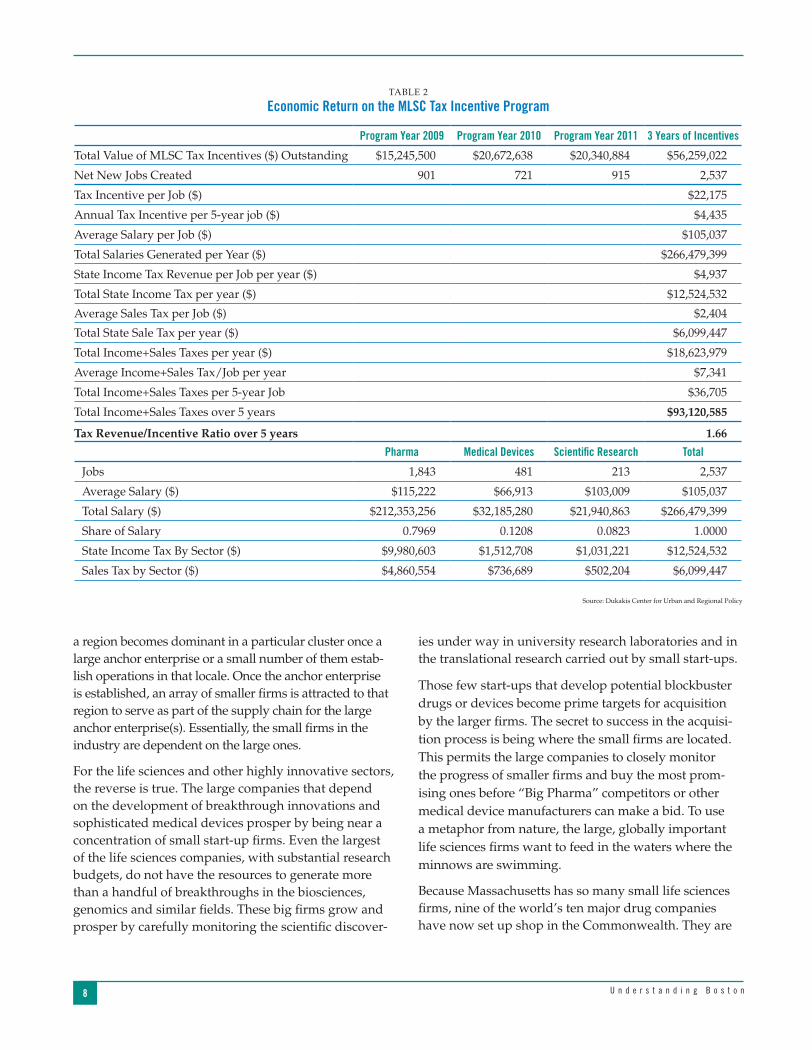
Short-Term BenefitsAs for the short-term benefits, we conducted a cost-bene-fit analysis of the Center’s tax incentive program. Accord-ing to our analysis based on MLSC data, the total value of tax incentives outstanding to Massachusetts life sciences firms as of June 30, 2012 was $56.6 million. Our best esti-mate is that a little over 2,500 jobs were created as a result of these incentives. Given the average $105,000 salary of these jobs, we predict they will generate more than $266 million in wages and salaries during the next five years. If
our analysis proves correct, these workers will pay more than $93 million in state personal income and sales taxes during that period. As such, assuming all of these jobs were directly related to the tax incentives and that these jobs last at least five years, every dollar of tax incentive will repay $1.66 to state coffers, as Table 2 reveals. This is an outstanding rate of return.
What is more, our analysis suggests that these jobs will go to a broad array of workers, not just those with advanced degrees. As Figure 1 reveals, more than one in five jobs in life sciences firms require no more than a two-year associ-ate’s degree and nearly another half (48%) require no more than a bachelor’s degree. Thus, the short-term benefits of MLSC tax incentives seem to have heavily outweighed the costs and the job benefits are broadly shared.
The Unique Growth Pattern of Regional Life Sciences ClustersThe most important benefits stemming from MLSC activi-ties, however, will come in the future. This is due to the unique growth pattern of highly innovative sectors like the life sciences. The regional concentration of life-sciences companies happens in a very different manner than in other industries. In the case of traditional industrial sectors such as auto, aircraft engine, financial services and the like,
Less than 2 years beyond HS4%
HS or Less15%
Ph.D.7%
ProfessionalDegree
3%
M.A. / M.S.19%
B.A.48%
Associate Degree4%
FIGURE 1
Education Distribution of New Hires by 2010 MLSC Tax Incentive Awardees
Source: Dukakis Center for Urban and Regional Policy
24128_Spectrum Text.indd 7 3/14/13 11:29 AM
8 U n d e r s t a n d i n g B o s t o n
ies under way in university research laboratories and in the translational research carried out by small start-ups.
Those few start-ups that develop potential blockbuster drugs or devices become prime targets for acquisition by the larger firms. The secret to success in the acquisi-tion process is being where the small firms are located. This permits the large companies to closely monitor the progress of smaller firms and buy the most prom-ising ones before “Big Pharma” competitors or other medical device manufacturers can make a bid. To use a metaphor from nature, the large, globally important life sciences firms want to feed in the waters where the minnows are swimming.
Because Massachusetts has so many small life sciences firms, nine of the world’s ten major drug companies have now set up shop in the Commonwealth. They are
a region becomes dominant in a particular cluster once a large anchor enterprise or a small number of them estab-lish operations in that locale. Once the anchor enterprise is established, an array of smaller firms is attracted to that region to serve as part of the supply chain for the large anchor enterprise(s). Essentially, the small firms in the industry are dependent on the large ones.
For the life sciences and other highly innovative sectors, the reverse is true. The large companies that depend on the development of breakthrough innovations and sophisticated medical devices prosper by being near a concentration of small start-up firms. Even the largest of the life sciences companies, with substantial research budgets, do not have the resources to generate more than a handful of breakthroughs in the biosciences, genomics and similar fields. These big firms grow and prosper by carefully monitoring the scientific discover-
TABLE 2
Economic Return on the MLSC Tax Incentive Program
Program Year 2009 Program Year 2010 Program Year 2011 3 Years of Incentives
Total Value of MLSC Tax Incentives ($) Outstanding $15,245,500 $20,672,638 $20,340,884 $56,259,022
Net New Jobs Created 901 721 915 2,537
Tax Incentive per Job ($) $22,175
Annual Tax Incentive per 5-year job ($) $4,435
Average Salary per Job ($) $105,037
Total Salaries Generated per Year ($) $266,479,399
State Income Tax Revenue per Job per year ($) $4,937
Total State Income Tax per year ($) $12,524,532
Average Sales Tax per Job ($) $2,404
Total State Sale Tax per year ($) $6,099,447
Total Income+Sales Taxes per year ($) $18,623,979
Average Income+Sales Tax/Job per year $7,341
Total Income+Sales Taxes per 5-year Job $36,705
Total Income+Sales Taxes over 5 years $93,120,585
Tax Revenue/Incentive Ratio over 5 years 1.66
Pharma Medical Devices Scientific Research Total
Jobs 1,843 481 213 2,537
Average Salary ($) $115,222 $66,913 $103,009 $105,037
Total Salary ($) $212,353,256 $32,185,280 $21,940,863 $266,479,399
Share of Salary 0.7969 0.1208 0.0823 1.0000
State Income Tax By Sector ($) $9,980,603 $1,512,708 $1,031,221 $12,524,532
Sales Tax by Sector ($) $4,860,554 $736,689 $502,204 $6,099,447
Source: Dukakis Center for Urban and Regional Policy
24128_Spectrum Text.indd 8 3/14/13 11:29 AM

9L i f e S c i e n c e s I n n o v a t i o n a s a C a t a l y s t f o r E c o n o m i c D e v e l o p m e n t
that Big Pharma has come to swim in this pond. In addition, Big Pharma benefits from the Center’s invest-ments in workforce development, shared infrastructure resources and cooperative research projects between industry and academia. The result has been extraordi-nary output and employment growth.
The Massachusetts Life Sciences: A Record of Output and Employment GrowthThe numbers are, indeed, impressive. As of 2012, according to the Massachusetts Biotechnology Council (MassBio), 1,198 life sciences companies were operating in New England and employing 103,006 workers. More than half of these firms are located in Massachusetts. Of all the Massachusetts firms listed in the 2012 MassBio directory, about half (514) are medical device companies; 232 are drug development firms; 147 are contract research and manufacturing enterprises and 146 produce research products and instrumentation for the life sciences.
The rapid growth in employment in the life sciences in Massachusetts provides a strong indication of how rapidly this sector is expanding. As Figure 2 reveals, the life sciences far outpaced all other industry sectors between 2001 and 2011.
investing billions in plant and equipment and creat-ing thousands of additional jobs. These include Pfizer, Novartis, Johnson & Johnson, GlaxoSmithKline, Sanofi (which absorbed Genzyme), AstraZeneca, Abbott Labo-ratories, Merck and Bristol-Myers Squibb.
And here is the key to understanding the central role of the MLSC: While the large firms can easily exist without the MLSC’s direct investments, the small life-sciences ventures need the Center to provide them with accelera-tor loans, research and development funds, and interns who can help them translate their ideas into commer-cially viable products. While the private venture capi-tal market may provide some funds for this purpose, venture capitalists often demand a quicker return than can be obtained from this sector, which often has long lag times between initial research, proof of concept and a final product approved by the U.S. Food and Drug Administration.
In this environment, the MLSC has become an impor-tant investment partner for smaller life sciences firms that grow out of local research universities and medical centers. By providing funds for translational research and development, the MLSC can help keep these grow-ing companies in the Commonwealth instead of losing them to investment funds in other regions. To revert to metaphor again, it’s because these minnows stay here
Source: BLS, Author’s Analysis
FIGURE 2
Massachusetts Employment Growth by Industry Sector 2001–2011
-40%
-30%
-20%
-10%
0%
10%
20%
30%
40%
Total Non-Farm
ManufacturingInformation Services
ConstructionFinancial Services
Trade, Trans., Utilities
Prof. & Business Svcs.
Other Services
Leisure & Hospitality
Education & Health
Life Sciences
27.3%
20.6%
10.4%
4.2%2.1%
-5.6%
-10.7%
-22.5%-25.4%
-34.3%
-3.9%
24128_Spectrum Text.indd 9 3/14/13 11:29 AM
10 U n d e r s t a n d i n g B o s t o n
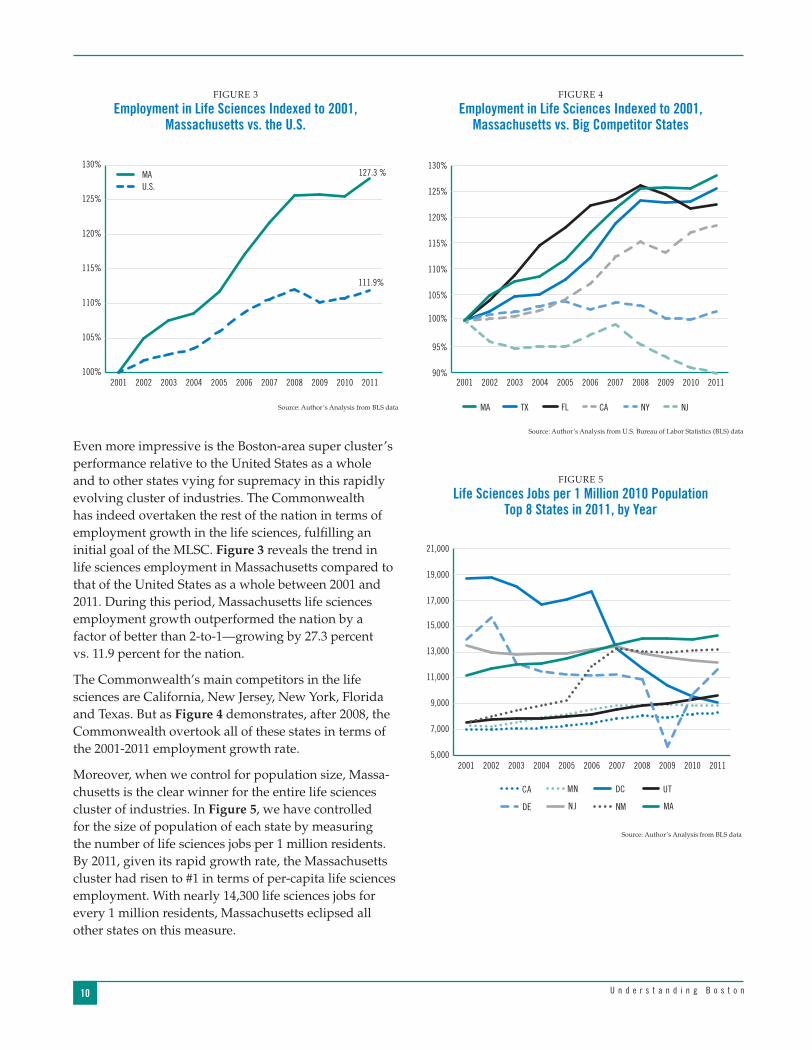
Even more impressive is the Boston-area super cluster’s performance relative to the United States as a whole and to other states vying for supremacy in this rapidly evolving cluster of industries. The Commonwealth has indeed overtaken the rest of the nation in terms of employment growth in the life sciences, fulfilling an initial goal of the MLSC. Figure 3 reveals the trend in life sciences employment in Massachusetts compared to that of the United States as a whole between 2001 and 2011. During this period, Massachusetts life sciences employment growth outperformed the nation by a factor of better than 2-to-1—growing by 27.3 percent vs. 11.9 percent for the nation.
The Commonwealth’s main competitors in the life sciences are California, New Jersey, New York, Florida and Texas. But as Figure 4 demonstrates, after 2008, the Commonwealth overtook all of these states in terms of the 2001-2011 employment growth rate.
Moreover, when we control for population size, Massa-chusetts is the clear winner for the entire life sciences cluster of industries. In Figure 5, we have controlled for the size of population of each state by measuring the number of life sciences jobs per 1 million residents. By 2011, given its rapid growth rate, the Massachusetts cluster had risen to #1 in terms of per-capita life sciences employment. With nearly 14,300 life sciences jobs for every 1 million residents, Massachusetts eclipsed all other states on this measure.
FIGURE 3
Employment in Life Sciences Indexed to 2001, Massachusetts vs. the U.S.
100%
105%
110%
115%
120%
125%
130%
20112010200920082007200620052004200320022001
127.3 %
111.9%
MAU.S.
Source: Author’s Analysis from BLS data
FIGURE 4
Employment in Life Sciences Indexed to 2001, Massachusetts vs. Big Competitor States
90%
95%
100%
105%
110%
115%
120%
125%
130%
TX FL NYCA NJMA
20112010200920082007200620052004200320022001
Source: Author’s Analysis from U.S. Bureau of Labor Statistics (BLS) data
FIGURE 5
Life Sciences Jobs per 1 Million 2010 PopulationTop 8 States in 2011, by Year
5,000
7,000
9,000
11,000
13,000
15,000
17,000
19,000
21,000
CA MN DC UT
DE NJ NM MA
20112010200920082007200620052004200320022001
Source: Author’s Analysis from BLS data
24128_Spectrum Text.indd 10 3/14/13 11:29 AM

11L i f e S c i e n c e s I n n o v a t i o n a s a C a t a l y s t f o r E c o n o m i c D e v e l o p m e n t
States singled out the Massachusetts Life Sciences Tax Incentive Program for its focus on annual cost controls and its reliance on scientific merit in making awards.
Still another informant noted that the MLSC is success-ful because its leadership is committed to working “at the speed of business” and therefore has become a valued partner in the expansion of the industry.
ConclusionsAll of our research suggests that the state will benefit from fully funding the remaining five years of the initiative in order to maintain the lead the life sciences super cluster has established in the Commonwealth. This is particularly important as other states ramp up their investments in hopes of creating their own life sciences ecosystems to entice the small and large firms Massa-chusetts has successfully attracted. California, Maryland, New Jersey, New York, Minnesota and Florida are not resting on their laurels, but continue to spend state funds on their own life sciences industries.
Over time, it should be possible for the Center to reach out to the private sector to help fund more of its initia-tives, as it has done with the newly established Massa-chusetts Neuroscience Consortium. This consortium, established in September 2012, combines the efforts of the MLSC with seven global biopharmaceutical compa-nies to jointly fund pre-clinical neuroscience research at Massachusetts academic and research institutions. Based on this model and with the plethora of larger, profitable firms coming to the state to expand their operations, one could imagine the Center funding more of its internships with private funds and having for-profit companies contribute to other programs (STEM: science, technology, engineering and math education, for example), allowing the Center to focus even more of its resources on accelerator loans and tax incentives for firms undertaking translational research.
We should also note that the success of the MLSC has lessons for other quasi-public entities in the Common-wealth. We can mention five of them here:
1. Long-term success in the use of tax incentives and business loans is most likely to occur when funds are focused on a cluster of firms and a set of technol-ogies in a given industry, helping to create an indus-trial ecosystem which can attract new companies to the state.
With this growth dynamic at work, Massachusetts appears well positioned to continue to attract new investment in the life sciences super cluster. In a 2011 analysis of the established life sciences clusters world-wide, the commercial developer Jones Lang LaSalle concluded that Boston had become the #1 region for the life sciences. The report noted the Boston area’s concen-tration of high-tech research and hospital/medical employment, its many science and engineering graduate students, its plentiful funding from the National Insti-tutes of Health and venture capitalists, its investment in R&D as a percentage of state GDP and its research facili-ties. Boston had a composite score of 7, ranking it #1 overall. New York/New Jersey was #2 with a composite score of 24, followed by the Bay Area and Los Angeles in California, each with a score of 25. Boston remained #1 in the developer’s 2012 report, while San Diego, the San Francisco Bay area, Raleigh-Durham, N.C., and Philadel-phia overtook New York/New Jersey and Los Angeles.
Why Has the MLSC Been So Successful at Building the Life Sciences Ecosystem?According to our interviews, the Center’s successful record of investments in the life sciences is grounded in its reliance on a Scientific Advisory Board (SAB) along with a large panel of experts to guide the Center’s Board of Directors in determining which firms show the great-est promise. This approach to distributing public funds has created credibility within the super cluster and its ecosystem. Over and over again, we heard adjectives like “rigorous” and “diligent” when our informants described the processes MLSC uses in selecting award-ees and providing a platform for collaboration.
The interviews we carried out also suggested that the Center itself is being run quite effectively and efficiently and in a highly professional manner. Virtually all of our informants praised the management team and expressed special appreciation for the leadership’s refusal to permit political considerations to trump scientific merit. Because the Scientific Advisory Board (SAB) selects awardees, “There is not an ounce of boondoggle in this agency,” one informant told us. Another observed that the MLSC has “lots of moving parts” and all of them are working well. Several of the interviewees observed that the Center remains responsive to industry needs, meets its deadlines and stays focused on its mission. In its report on creating fiscally sound state tax incentives, the Pew Center on the
24128_Spectrum Text.indd 11 3/14/13 11:29 AM

12 U n d e r s t a n d i n g B o s t o n
2. The use of expert panels to determine the awarding of loans assures that these funds will be well utilized. “Claw-back” provisions protect the taxpayers by requiring firms to repay funds advanced by the Commonwealth if they fail to meet hiring goals.
3. A focus on encouraging firms in their early stage innovation activity is central to promoting economic growth and prosperity.
4. Helping fund workforce development efforts for critical industries as part of the mandate of the quasi-public entity helps ensure a pipeline of skilled work-ers for the industry and this itself helps attract new firms to the region.
5. Taking a “portfolio” approach to the entire range of activities in the life sciences—from investments in small innovative firms to helping train the future workforce to underwriting infrastructure—helps sustain the “ecosystem,” undergirding a virtuous cycle of discovery, innovation, investment, and employment opportunity.
In the end, we applaud the Governor and the Legisla-ture for their foresight in creating the Massachusetts Life Sciences Center and the $1 billion Life Sciences Initia-tive and we tip our hat to the MLSC for carrying out its public responsibilities in a most effective and efficient manner. The programs in place are fulfilling the goals set out in the original legislation and the Center’s lead-ership has ensured that these programs work to the full benefit of the Commonwealth and its residents.
24128_Spectrum Text.indd 12 3/14/13 11:29 AM

13L i f e S c i e n c e s I n n o v a t i o n a s a C a t a l y s t f o r E c o n o m i c D e v e l o p m e n t
The Massachusetts Life Sciences Initiative, conceived by Governor Deval Patrick’s Administration and passed into law by the Massachusetts Legislature in July 2008, is a bold 10-year, $1 billion investment in the future of the state’s economy. Based on the region’s existing compara-tive advantage in the life sciences emanating from the laboratories of its leading universities and medical institutions, this substantial infusion of public funds was squarely aimed at making this cluster of industry sectors—including biotechnology, pharmaceuticals, medical diagnostics, medical devices, and bioinformat-ics—the most successful in the world. The Massachu-setts Life Sciences Center (MLSC), founded two years earlier, was charged with the responsibility of imple-menting this bold experiment in public-private sector collaboration. If effective, the initiative was expected to boost investment and jobs in this evolving industrial sector, generating increased household income and tax revenue for the state.
In 2012, at the near halfway point of that 10-year initia-tive, the Dukakis Center for Urban and Regional Policy at Northeastern University was invited by the MLSC to measure the progress of the life sciences sector in Massachusetts and to carry out an evaluation of the Center’s activities. We agreed to conduct such a study, but only under the condition that we would have full access to MLSC records, that our investigation would not be censored in any way by the MLSC staff, and that the staff of the Dukakis Center would have absolute control over the content of the final evaluation report. As a result, this report is being published by the Boston Foundation as part of its Understanding Boston series.
For the past year, Barry Bluestone, Director, and Alan Clayton-Matthews, Senior Research Associate at the Northeastern center, have carried out this evalua-tion. Both of us are economists who have extensive experience in industry studies and in program evalua-tion. Neither of us, however, was an expert on the life sciences sector when this evaluation project was first launched.
Introduction
In the course of this research, we immersed ourselves in literature about the components of the life sciences industry cluster and about the role of public invest-ment in innovation and economic growth. We analyzed existing employment data on each of the life sciences industries in the state; reviewed all of the annual reports of the MLSC; attended meetings of the MLSC Board of Directors where decisions over tax incentives and awards were made; and conducted lengthy interviews with leading executives of life sciences companies located in the state, industry trade association leaders, and members of the MLSC Scientific Advisory Board. This report is based on all of the data gathered over the year.
We began this research fully agnostic about what we might ultimately find, given the checkered record across the country of state industrial policy aimed at assist-ing other industries. But what we have found, based on our research, is that the Commonwealth’s life sciences initiative is meeting, if not exceeding, the goals first established in 2008 by the Governor and the Legislature. Moreover, our interviews with key informants led us to the conclusion that the Massachusetts Life Sciences Center is executing its responsibilities in an effective, efficient, and professional manner. The initiative and the MLSC has performed exceptionally well in creating an ecosystem within which the cluster has prospered.
Moreover, we have concluded that the Center’s mission, administration, and performance provide important lessons that can be applied to other state agencies charged with encouraging economic development.
This research could not have been carried out without the assistance of the staff of the MLSC and the many industry executives and experts who provided us with data and candid answers to our probing questions. We thank them all for their time and the information they afforded us.
24128_Spectrum Text.indd 13 3/14/13 11:29 AM

14
24128_Spectrum Text.indd 14 3/14/13 11:29 AM

15L i f e S c i e n c e s I n n o v a t i o n a s a C a t a l y s t f o r E c o n o m i c D e v e l o p m e n t
CHAPTER ONE
About the Massachusetts Life Sciences Center
growth. This has diminished tax revenue just when the swelling cost of health care and public pensions is generating structural deficits.3 Without additional tax revenue from more vigorous growth, these potential deficits will require either raising taxes or cutting public services, or both.
In this new economic environment, virtually every unit of government is being forced to husband its resources and scrutinize its spending to assure that every tax dollar is spent effectively and efficiently. As such, it is not surprising that the nation, the Commonwealth, and most of its municipalities are considering ways to cut “unnecessary” or “wasteful” spending. At the same time, they want to preserve essential public programs that meet critical social needs and improve the targeting of incen-tives to the private sector to accelerate economic growth.
A prime target in this new era of public scrutiny is the extensive set of “subsidies” and “tax expenditures” that governments have traditionally used to encourage specific types of consumption or investment. Every tax dollar that a government agency transfers to a private business or individual in the form of a subsidy means a dollar less that can be used in the short-term for other purposes. Every dollar that a business or individual saves on its taxes is an “uncollected” dollar—a tax expenditure—that could have been used to pay for one or another public service.4 Because of the short-run “oppor-tunity costs” attached to every dollar spent, there is a growing demand to ensure that public dollars are not being wasted on programs that have little payoff. Each program must be judged on whether the long-term gain from issuing a tax incentive, government grant, loan guarantee, or subsidy outweighs the short-term cost to the treasury.
Adding to the demand for more accountability has been a recent series of high-profile cases of “failed” govern-ment incentive programs. Solyndra, a manufacturer of solar photovoltaic systems, became the poster child for “misspent” federal funds during the last presidential campaign when it filed for bankruptcy after receiving
In June 2006, the Massachusetts Legislature created a new quasi-public agency, the Massachusetts Life Sciences Center (MLSC), to promote the life sciences within the Commonwealth. It was tasked with “invest-ing in life sciences research and economic develop-ment . . . by making financial investments in public and private institutions.”1 Its mandate was broad: to encourage basic research, development, and commer-cialization in the biosciences; ensure the preparation of a skilled workforce to meet the needs of the state’s biosci-ence industry cluster, and build stronger collaboration between the sectors of the local and international life sciences community.2
A year later, in May 2007, Governor Deval Patrick revealed an ambitious plan for a 10-year, $1 billion public initiative to enhance the Commonwealth’s exist-ing competitive advantage in this rapidly evolving and critically important sector of the U.S. economy. This would provide the funding for a major expansion in the activities of the Life Sciences Center. In June 2008, the legislature enacted the Governor’s Massachusetts Life Sciences Initiative with the aspiration of building on the existing strengths of the state’s research univer-sities, its world-renowned health care sector, and its emerging private sector life sciences firms to promote the Commonwealth as the foremost center for the life sciences in the world.
With such a large commitment of state resources, how close has the Center come to meeting this goal? Has it helped attract life sciences companies to the Commonwealth, boosted R&D in the private life sciences arena, created job opportu-nities for Massachusetts workers and increased the state’s revenue base by boosting employment, household income, and corporate profits?
This analysis of the MLSC comes at a propitious time. Massachusetts, along with most of its cities and towns—not to mention the nation as a whole—faces growing fiscal constraints. The economic recession that officially began in late 2007 and officially ended in 2009 has given way to an extended period of sluggish economic
24128_Spectrum Text.indd 15 3/14/13 11:29 AM

16 U n d e r s t a n d i n g B o s t o n
stances should states use tax abatements, subsidies, and other inducements to encourage investment and create jobs in the private sector?7
As the Massachusetts Life Sciences Initiative approaches the halfway mark in its 10-year legislative life, it is alto-gether appropriate that this report attempt to ascertain whether, and to what extent, the Massachusetts Life Sciences Initiative has already produced tangible positive gains for the Commonwealth, and whether maintaining the initiative will likely produce even greater long-term benefits for the state’s residents and taxpayers.
For the purposes of this report, we define the Life Sciences cluster as consisting of sixteen (16) specific 6-digit NAICS industry sectors as shown in Table 1.8 These include two research and development industries, two laboratory industries, two medical distribution
$535 million in U.S. Energy Department loan guaran-tees.5 The same was true when A123, a manufacturer of lithium ion batteries for electric cars, went bankrupt after receiving a $130 million federal grant to build a plant in Michigan. It was, according to a series of Washington Post reports, the fifth clean-energy firm the current Washington administration subsidized with loans or grants that filed for bankruptcy protection. During the campaign, Republicans claimed both Solyn-dra and A123 were prime examples of “cronyism” in President Obama’s stimulus program.6
Closer to home was the failure of Curt Shilling’s 38 Studios video-game firm. It closed its doors and laid off all of its employees after Rhode Island lured it from Massachusetts with a $75 million loan guarantee. This case raised anew an old question. Under what circum-
TABLE 1
Life Sciences Sectors
Group NAICS Title
1 325411 Medicinal and Botanical Manufacturing
1 325412 Pharmaceutical Preparation Manufacturing
1 325413 In-Vitro Diagnostic Substance Manufacturing
1 325414 Biological Product (except Diagnostic) Manufacturing
2 334510 Electromedical and Electrotherapeutic Apparatus Manufacturing
2 334516 Analytical Laboratory Instrument Manufacturing
2 334517 Irradiation Apparatus Manufacturing
3 339112 Surgical and Medical Instrument Manufacturing
3 339113 Surgical Appliance and Supplies Manufacturing
3 339114 Dental Equipment and Supplies Manufacturing
4 423450 Medical, Dental, and Hospital Equipment and Supplies Merchant Wholesalers
4 424210 Drugs and Druggists’ Sundries Merchant Wholesalers
5 541711 Research and Development in Biotechnology
5 541712 Research and Development in Physical, Engineering, and Life Sciences (except Biotechnology)
6 541380 Testing Laboratories
6 621511 Medical Laboratories
Source: Battelle and the Biotechnology Industry Organization (June 2012)
24128_Spectrum Text.indd 16 3/14/13 11:29 AM

17L i f e S c i e n c e s I n n o v a t i o n a s a C a t a l y s t f o r E c o n o m i c D e v e l o p m e n t
sectors, and ten different manufacturing industries.9 The cluster also includes the life sciences depart-ments in universities and medical institutions in the Commonwealth.10
As of 2012, according to the Massachusetts Biotechnol-ogy Council (MassBio), there were 1,198 life sciences companies operating in New England employing 103,006 workers, the vast majority of these firms located in Massachusetts. More than one-third of these New England firms were founded after 2004 and 80 percent are relatively small with sales under $100 million a year. More than two out of five of these firms (43%) have annual sales of less than $5 million. Of all the Massachu-setts firms listed in the 2012 MassBio directory, about half (514) are medical device companies; 232 are drug development firms; 147 are contract research and manu-facturing enterprises; and 146 produce research prod-ucts and instrumentation for the life sciences.11
24128_Spectrum Text.indd 17 3/14/13 11:29 AM

24128_Spectrum Text.indd 18 3/14/13 11:29 AM
19L i f e S c i e n c e s I n n o v a t i o n a s a C a t a l y s t f o r E c o n o m i c D e v e l o p m e n t
percent of the state budget or $345 per capita. Of this total, more than a third ($786 million) take the form of corporation income tax credits, rebates, or reductions. Another $130 million is paid out by the state treasury in the form of cash grants, loans, or loan guarantees.
The Times reporters listed a group of 94 Massachusetts companies that received nearly $165 million in grants, tax incentives, and subsidies between 1994 and 2011. Of this total, 26 were life sciences companies account-ing for $48.7 million or nearly 30 percent of the total. Among the companies receiving these funds were Vertex Pharmaceuticals, Organogenesis, Shire Human Genetics Therapies, Sanofi, and Cubist Pharmaceuti-cals. The company receiving the largest state subsidy, however, was Liberty Mutual, an insurance company. Between 2006 and 2009 alone, the Massachusetts Film Office doled out nearly $150 million in tax credits to film companies.17
States like Alaska, West Virginia, Texas, and Michigan spend two to three times as much per capita as Massa-chusetts on such business incentives, but other states including New Hampshire ($30), North Carolina ($69), California ($112), South Carolina ($194), New York ($210), Florida ($212), Oregon ($226), Connecticut ($241), and Ohio ($281) spend less.
Obviously, in a time of tight fiscal budgets, such expen-ditures of tax revenue need to be carefully evaluated as elements of what is known as “industrial policy”— government support of private business.
To assure that this assessment of the Massachusetts Life Sciences Center is placed in proper context, we need to begin by considering the ways in which government can encourage private sector economic development in an efficient and effec-tive way. In doing this, we need to pay particular attention to understanding the role of government-induced innovation in spurring economic growth.This foray into these theoretical issues will provide us with guidance as to what types of government tax expenditures and subsidies are more likely to yield positive benefits for society and thereby help us to assess the value of the MLSC.
CHAPTER TWO
The Size and Scope of Public Tax Expenditures and Public Subsidies
To begin our assessment, it is useful to put the Common-wealth’s $1 billion investment in the life sciences into perspective. According to the Congressional Research Service, at the federal level there are over 200 separate tax expenditures which taken altogether are projected to cost the U.S. Treasury more than $1.1 trillion in FY2014.12 The bulk of these take the form of exemptions, deductions, and exclusions from the personal income tax such as the mortgage interest deduction. These tax provisions are intended to encourage such “virtuous” behavior as home ownership, charitable contributions, and family saving.13
While paling in comparison to these personal tax expenditures, federal corporate subsidies cost the Treas- ury almost $100 billion a year, according to research conducted by the Cato Institute.14 A full quarter of these go to farmers in the form of agricultural subsidies and crop insurance, but other subsidies underwrite applied research and development under way at defense contrac-tors, energy companies, housing developers, airlines, AMTRAK, universities and research labs, the National Institutes of Health, NASA, and small businesses.15 In searching for ways in 2013 to cut federal spending in order to reduce federal deficits, one can be certain that some, if not many, of these tax expenditures and subsidies will be reviewed for possible modification or elimination.
States and municipalities have also provided the private sector with billions in tax expenditures and subsidies. In a recent series of articles, a trio of New York Times inves-tigative reporters found that across the nation, states, counties, and cities dole out over $80 billion in “business incentives” each year.16 The key industries receiving such tax preferences and subsidies are manufacturing; agri-culture; the oil, gas, and mining industries; and the film industry. Technology companies like Twitter and Face-book, according to the Times report, are not far behind.
The Times analysts collected data on all 50 states. In their review of Massachusetts, they found 48 state programs that provide nearly 1,500 grants or incentive packages to specific companies. The total annual cost to state and municipal governments for these programs was reported to be at least $2.26 billion, equal to seven
24128_Spectrum Text.indd 19 3/14/13 11:29 AM

24128_Spectrum Text.indd 20 3/14/13 11:29 AM

21L i f e S c i e n c e s I n n o v a t i o n a s a C a t a l y s t f o r E c o n o m i c D e v e l o p m e n t
CHAPTER THREE
Industrial Policy: Pros and Cons
private businesses bring these innovations to the stage where they can be effective in the marketplace.”21 In brief, well-placed public funds in the private sector can yield large long-term gains at relatively modest short-term cost.
But what makes for “well-placed” public funds? A good part of the answer lies in whether the funds contrib-ute significantly to a growing economy and increasing numbers of jobs.
New vs. Old Growth TheoryIn economics, there are two fundamentally different views about what contributes most to growth. What is now known as the “old growth theory” suggested that economic prosperity emanates from the accumulation of ever greater stocks of the fundamental ingredients of production: capital, labor, and natural resources. Those countries that find ways of increasing investment in plant and equipment, adding to labor supply, and extracting more natural resources are the ones that will become more affluent. Just consider the United States or Saudi Arabia versus poor countries in Africa or South-east Asia. Clearly, without capital, labor, and natural resources, output cannot be produced.
While not completely discounting this approach to growth, a “new growth theory” has evolved that “places technological progress at the very epicenter of growth dynamics, rather than capital investment per se.”22 Advances in technology and interdependencies between new ideas and new investment provide the basis for entire new industries and products that create new wealth and raise living standards. “In the new model, technology provides the engine for sustained growth in the face of the diminishing productivity associated with additions to the stock of physical and human capital.”23
In addition to avoiding diminishing returns, innovation-based growth has an additional salutary feature relative to other ingredients in the growth equation: Once the fixed cost of creating a technology has been incurred,
For decades, economists have debated the role of govern-ment in the promotion of private industry. At various times in our history, the federal government has helped to establish industries that went on to be central to our economy. The growth of the nation’s aircraft industry was aided by the U.S. Post Office, which subsidized airlines with lucrative air-mail contracts in the early days of air travel. In the aftermath of Sputnik, the federal govern-ment invested billions of research dollars into perfecting solid state guidance systems and software for rockets and missiles, helping to create what today is our high-tech universe of cell phones, the Internet, iPads, GPS devices, and a dizzying array of gadgets based on the integrated circuit and the software that runs them.
Yet, as a recent Center for Economic and Policy Research working paper put it, “For the past generation, the dominant view among economists was that giving busi-nesses a free hand—that is, little regulation and low taxes—was the most important contribution govern-ments could make to encourage productive investments. The corollary to this view was that, as much as possible, overall investments in the economy should be under-taken by the private sector, as opposed to any sort of government entity.”18
The argument against a public “industrial policy” is that governments are not capable of “picking winners” and therefore too often waste tax dollars. The conservative Cato Institute claims that government subsidies inevi-tably distort economic activity and “create even larger failures than might have existed in the marketplace.”19 By aiding some businesses, others are placed at a disad-vantage either by reason of having to pay higher taxes or having to compete with subsidized firms. Hence, divert-ing resources from businesses preferred by the market to those preferred by policy makers leads to losses for the overall economy.”20
The argument for public investment in the private sector is that rather than “crowding out” private capital, public investments actually “crowd in” private investment and can be used to “incubate new technologies and help
24128_Spectrum Text.indd 21 3/14/13 11:29 AM

22 U n d e r s t a n d i n g B o s t o n
but it was not until the 1990s that the full productivity premium of the computer generation was finally real-ized.28 It will take decades to realize the full benefits to humanity and the economy from the advances now being made in drug discovery, medical diagnostics, and medical devices.
Unfortunately, in an era of intense concern over short-term deficits, it is often hard to marshall the patience needed to invest sufficiently in technological innovation or the firms that create it. As a corollary, investments made today in research and development (R&D) are often risky propositions from the perspective of the short-term balance sheet. Yet without massive infusions in R&D, continuous breakthrough innovation cannot occur. Nowhere is this truer than in the life sciences.
Public Investment in R&DWorldwide, no country spends more than the United States on R&D, and this investment has played an impor-tant role in the nation’s economic development, at least since World War II.29 According to the Battelle Institute, total R&D spending in the U.S. reached $436 billion in 2012, of which about 29 percent ($126 billion) was supplied by the federal government while 64 percent ($280 billion) was provided by private industry. The remainder came from foundations and other non-profits ($14.5 billion), university-owned funds ($12.3 billion), and a tiny amount from state and local governments ($3.8 billion).30
Despite its smaller share of overall R&D funding rela-tive to the private sector, the importance of the federal government in spurring innovation should not be under-estimated. Without government investment, it is likely that private firms would underinvest in R&D, particu-larly basic research. The reason is that the social rate of return to investment in basic research often exceeds the private rate. Unlike investments in tangible capital such as machinery, the ideas flowing from R&D are, in the words of economists, “nonrival” and not fully “appropri-able.” Nonrival means that my learning of a new innova-tion does not prevent you from using it. When returns are not fully appropriable, the original innovator cannot gain all the profit that flows from the eventual applica-tion, especially the commercialization, of the new process or product.31 In this case, firms will often wait for others to do the innovating. As Federal Reserve Bank Chair-
the formula can be used over and over again at little or no cost. Indeed, this spillover property is taken to be the defining characteristic of technology. As Paul Romer, one of the founders of new growth theory puts it, “The idea behind the transistor, the principles behind internal combustion, the organizational structure of the modern corporation, the concepts of double-entry bookkeep-ing—all these pieces of information and many more like them have the property that it is technologically possible for everybody and every firm to make use of them at the same time without additional costs.”24 As such, instead of diminishing returns to investment, there can be increasing returns.
Moreover, the new growth theory posits a strong reci-procity between the rate of skill acquisition among workers and the growth dividend society obtains from new capital and new inventions. Thus, programs that combine incentives for innovation along with resources to augment human capital should, according to this theory, fuel rapid economic growth more than anything else society can do to promote prosperity.
But here is the rub. Keeping score on the success of innovation is difficult. Instead of a more or less certain return to a given infusion of capital under the old growth theory, innovation under the new growth theory tends to deliver faster and stronger long-term growth, but it is “lumpy, discontinuous, and nonlin-ear.”25 There can be long lags between the time a new innovation is first incorporated into production and the time that it pays off in terms of increased produc-tivity, output, and jobs. The introduction of the steam engine in the mid-18th century did not pay off in terms of improved productivity until the early 19th century.26 In the short term, it can be discouraging, as invest-ments in fundamental innovation usually have little immediate payoff.
To be productive, innovation needs to be perfected and diffused, and this takes time. According to a study of 265 major and minor innovations over the past couple of centuries, it took a typical new innovation forty-one years, on average, to move from the 10 percent to the 90 percent diffusion level.27 The diesel locomotive, for example, was clearly superior to the steam locomotive, yet twenty years after the first diesel was introduced in 1925, there were still nearly ten steam locomotives in service for every diesel-powered engine. The first inte-grated computer circuits were introduced in the 1960s,
24128_Spectrum Text.indd 22 3/14/13 11:29 AM

23L i f e S c i e n c e s I n n o v a t i o n a s a C a t a l y s t f o r E c o n o m i c D e v e l o p m e n t
over $140 billion by 2009. In FY 2013, under pressure to reduce federal spending, total federal R&D spending once again declined.34
As Figure 2 demonstrates, virtually all of this growth in non-defense federal R&D spending has been in the health field, mainly through the National Institutes of Health. While federally sponsored health research only accounted for about seven percent of total non-defense federal R&D spending in 1965, by 2013 it accounted for more than half (52%). Much of this basic public invest-ment is going into the life sciences, and of all fifty states, Massachusetts trails only California in NIH funding. In 2011, California institutions received $3.5 billion in NIH funding; those in Massachusetts received $2.5 billion.35 Yet, on a per capita basis, the Commonwealth swamps all other states in NIH funding, obtaining four times as much as the Golden State.
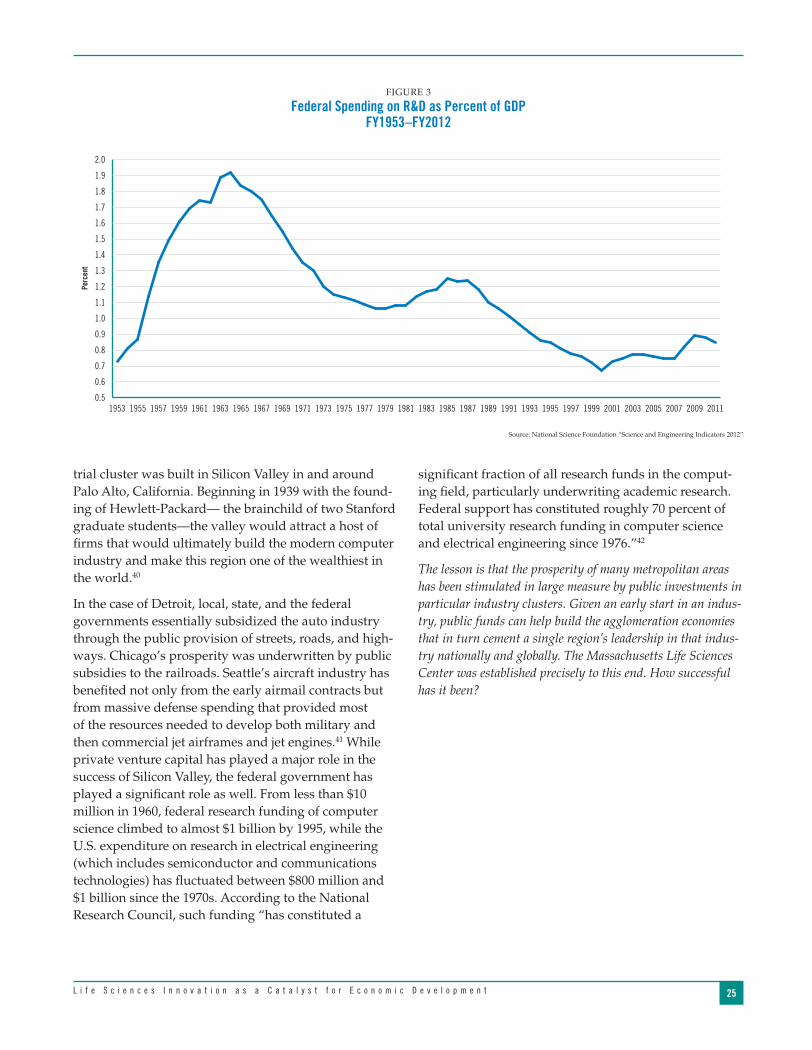
This growth in federally sponsored R&D seems impres-sive, but as a share of the nation’s Gross Domestic Prod-uct (GDP), the federal government’s role is roughly half of what it was in the early 1960s (see Figure 3). Spending rose rapidly in the 1950s and 1960s, surpassing 1.9 percent of GDP in 1964, up from just 0.7 percent in the early 1950s.36 Much of this was in direct response to the Soviet Union’s launching of Sputnik and President John F. Kennedy’s goal of sending a man to the moon before 1970. After reaching its nadir of just 0.67 percent in 2000, it has slowly climbed back to 0.85 percent today.37
man Ben Bernanke recently reminded an audience at a Washington, D.C. conference, “James Watson and Francis Crick received a minute fraction of the economic benefits that have followed from their discovery of the structure of DNA.”32 Without government-sponsored basic research, society loses out on innovation.
Public sector R&D also encourages private sector R&D spending. Research reveals that there is a strong posi-tive correlation between the trajectory of private R&D spending in a given year following public expenditures a year earlier.33
The Trend in Federal R&D SpendingGiven (1) the importance of innovation as the prime driver of economic prosperity, (2) the role of R&D in promoting innovation, and (3) the fact that without public funding of R&D total research investment would be suboptimal because of the inability of private inves-tors to fully appropriate its monetary benefit, how much has the federal government invested in this vital factor?
As Figure 1 reveals, federal spending on defense and nondefense R&D (in inflation-adjusted FY2012 dollars) rose sharply between 1953 and 1965 from less than $15 billion to more than $80 billion before dipping back to just over $60 billion in 1976. Spending was back to more than $100 billion by 1989 and remained flat through 2001. It rose sharply after that, increasing to
Source: American Association for the Advancement of Science
FIGURE 1
Federal Spending on Defense and Nondefense R&DOutlays for the conduct of R&D, FY 1953–2013, billions of constant FY 2012 dollars
$0
$20
$40
$60
$80
$100
$120
$140
$160
2013200920052001199719931989198519811977197319691965196119571953
Nondefense R&DDefense R&D
Billi
ons
24128_Spectrum Text.indd 23 3/14/13 11:29 AM

24 U n d e r s t a n d i n g B o s t o n
cluster. Such locational advantages are called agglomera-tion economies and refer to the benefits, savings, or cost reductions resulting from the clustering of economic activities.38 The clustering of such industries can give rise to an “industrial climate” or “ecosystem” that is self-perpetuating as the result of a regional congregation of specialized facilities, labor pools, education and train-ing institutions, and specialized legal, accounting, and financial services.
Such agglomeration economies explain the economic success of most metropolitan areas. In New York City, for example, the cluster of financial industries and advertising is responsible for much of the growth in wealth. The birth of the early auto industry in and around Detroit in the early part of the 20th century would ultimately allow Detroit to take advantage of agglomeration economies and blossom into the world’s “Motor City” by the end of World War II. By 1949, the median family income of Detroiters was higher than that of any other city in America except Chicago (whose residents enjoyed a 1949 median family income exactly one dollar higher), and 29 percent above the national figure.39 Chicago’s prosperity was built on being the transportation hub for America. Seattle became the center for jet aircraft production.
In the postwar period, the most successful new indus-
As we have seen, new growth theory suggests that our nation’s prosperity is intimately tied to the rate of innova-tive activity. If innovation slows down, growth will suffer. Hence, the big question is whether the United States can maintain its rate of innovation activity into the future and thereby sustain economic prosperity and full employment.
The Role of R&D Investment at the State LevelAs noted above, states have historically played a minor role in funding research and development. Their $3.8 billion spent in FY2012 amounted to less than 1 percent of total spending on R&D and no more than 3 percent of government-sponsored R&D. Indeed, given that the full benefits from basic research cannot be easily appropri-ated by the funder, it might seem foolish that an individ-ual state would spend its own revenue on investments that can be appropriated by entities in other states.
So why should a state invest anything in R&D?
Invested in the appropriate industries, public funds can help encourage the growth of an industrial cluster in a given region that, once incubated, can maintain a self-sustaining locational advantage that provides a magnet for new private investment in the region’s
Source: American Association for the Advancement of Science
FIGURE 2
Trends in Nondefense R&D by Function, FY 1953–2013Outlays for the conduct of R&D, billions of constant FY 2012 dollars
$0
$10
$20
$30
$40
$50
$60
$70
2013200920052001199719931989198519811977197319691965196119571953
OtherEnergyNatural Resources/Environment
General Science
Health
Space
Billi
ons
24128_Spectrum Text.indd 24 3/14/13 11:29 AM
25L i f e S c i e n c e s I n n o v a t i o n a s a C a t a l y s t f o r E c o n o m i c D e v e l o p m e n t
significant fraction of all research funds in the comput-ing field, particularly underwriting academic research. Federal support has constituted roughly 70 percent of total university research funding in computer science and electrical engineering since 1976.”42
The lesson is that the prosperity of many metropolitan areas has been stimulated in large measure by public investments in particular industry clusters. Given an early start in an indus-try, public funds can help build the agglomeration economies that in turn cement a single region’s leadership in that indus-try nationally and globally. The Massachusetts Life Sciences Center was established precisely to this end. How successful has it been?
trial cluster was built in Silicon Valley in and around Palo Alto, California. Beginning in 1939 with the found-ing of Hewlett-Packard— the brainchild of two Stanford graduate students—the valley would attract a host of firms that would ultimately build the modern computer industry and make this region one of the wealthiest in the world.40
In the case of Detroit, local, state, and the federal governments essentially subsidized the auto industry through the public provision of streets, roads, and high-ways. Chicago’s prosperity was underwritten by public subsidies to the railroads. Seattle’s aircraft industry has benefited not only from the early airmail contracts but from massive defense spending that provided most of the resources needed to develop both military and then commercial jet airframes and jet engines.41 While private venture capital has played a major role in the success of Silicon Valley, the federal government has played a significant role as well. From less than $10 million in 1960, federal research funding of computer science climbed to almost $1 billion by 1995, while the U.S. expenditure on research in electrical engineering (which includes semiconductor and communications technologies) has fluctuated between $800 million and $1 billion since the 1970s. According to the National Research Council, such funding “has constituted a
Source: National Science Foundation “Science and Engineering Indicators 2012”
FIGURE 3
Federal Spending on R&D as Percent of GDP FY1953–FY2012
0.5
0.6
0.7
0.8
0.9
1.0
1.1
1.2
1.3
1.4
1.5
1.6
1.7
1.8
1.9
2.0
201120092007200520032001199919971995199319911989198719851983198119791977197519731971196919671965196319611959195719551953
Perc
ent
24128_Spectrum Text.indd 25 3/14/13 11:29 AM

24128_Spectrum Text.indd 26 3/14/13 11:29 AM
27L i f e S c i e n c e s I n n o v a t i o n a s a C a t a l y s t f o r E c o n o m i c D e v e l o p m e n t
CHAPTER FOUR
The Emergence of the Massachusetts Biotechnology Super Cluster
(SBIR) to support basic research; foundation support from private nonprofits; and, on the for-profit side, angel and venture capital (VC) investors who provide funds for translating basic research into new products and services. The cluster is also supported by public and private customers for its end products, which at times are subsidized through tax expenditures and subsidies.
The talent pool for this sector ranges from creators and craftspeople who play the role of principal investiga-tors on research grants and contracts, entrepreneurs who form new firms to commercialize the output of the sector and workers who range from those with just a high school diploma to those with Ph.Ds.
To be successful, the cluster must also enjoy a legal system that protects intellectual property through patents and licenses and IP enforcement in the courts.
Long-term success for the cluster also requires a diverse set of “tradable agglomerating” companies comprised of new innovative enterprises that can power future
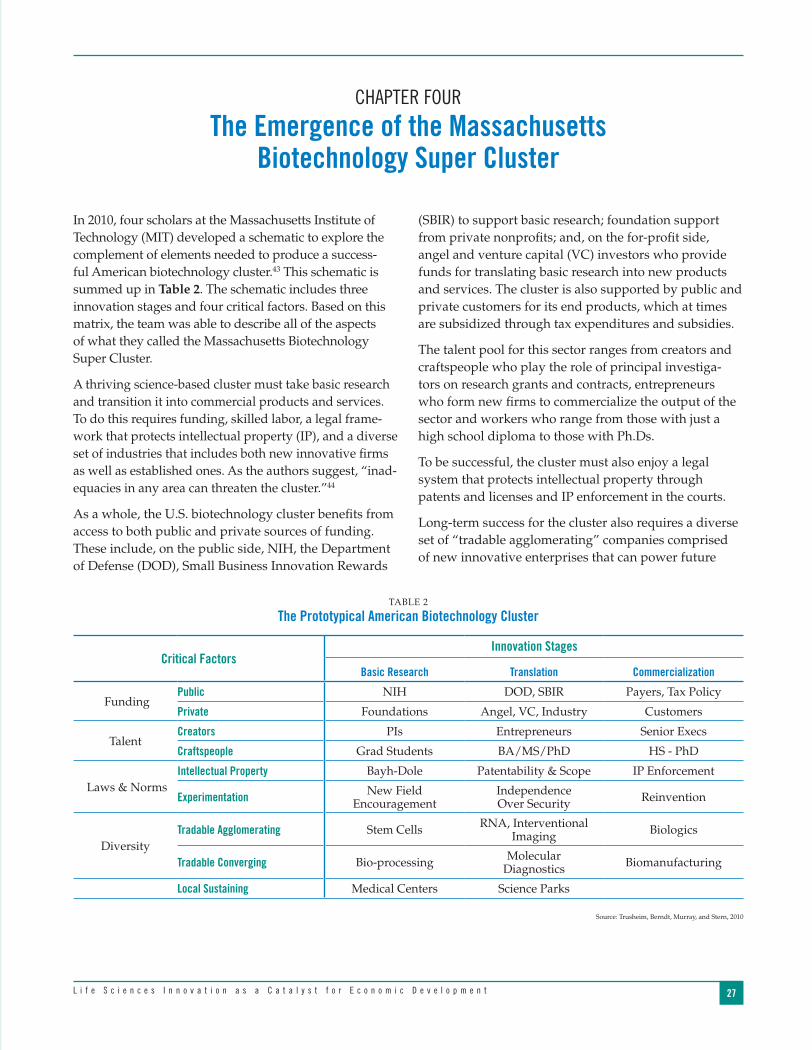
In 2010, four scholars at the Massachusetts Institute of Technology (MIT) developed a schematic to explore the complement of elements needed to produce a success-ful American biotechnology cluster.43 This schematic is summed up in Table 2. The schematic includes three innovation stages and four critical factors. Based on this matrix, the team was able to describe all of the aspects of what they called the Massachusetts Biotechnology Super Cluster.
A thriving science-based cluster must take basic research and transition it into commercial products and services. To do this requires funding, skilled labor, a legal frame-work that protects intellectual property (IP), and a diverse set of industries that includes both new innovative firms as well as established ones. As the authors suggest, “inad-equacies in any area can threaten the cluster.”44
As a whole, the U.S. biotechnology cluster benefits from access to both public and private sources of funding. These include, on the public side, NIH, the Department of Defense (DOD), Small Business Innovation Rewards
TABLE 2
The Prototypical American Biotechnology Cluster
Critical FactorsInnovation Stages
Basic Research Translation Commercialization
FundingPublic NIH DOD, SBIR Payers, Tax Policy
Private Foundations Angel, VC, Industry Customers
TalentCreators PIs Entrepreneurs Senior Execs
Craftspeople Grad Students BA/MS/PhD HS - PhD
Laws & NormsIntellectual Property Bayh-Dole Patentability & Scope IP Enforcement
Experimentation New Field Encouragement
Independence Over Security Reinvention
DiversityTradable Agglomerating Stem Cells RNA, Interventional
Imaging Biologics
Tradable Converging Bio-processing Molecular Diagnostics Biomanufacturing
Local Sustaining Medical Centers Science Parks
Source: Trusheim, Berndt, Murray, and Stern, 2010
24128_Spectrum Text.indd 27 3/14/13 11:29 AM
28 U n d e r s t a n d i n g B o s t o n
pharmaceutical giant, Roche—the world’s third-largest biopharma firm—has not moved into Massachusetts.46
According to a separate comprehensive analysis of the global life sciences cluster completed in 2011, the commercial developer Jones Lang LaSalle concluded that Boston had become the #1 region for the biosciences based on its concentration of high tech research and hospital/medical employment, its number of scientific and engineering graduate students, its level of NIH and venture-capital funding, its investment in R&D as a percentage of state GDP, and its thousands of square feet of academic and research institute facilities. Boston had a composite score of 7 ranking it #1 overall. New York/New Jersey was #2 with a composite score of 24, followed by the Bay Area and Los Angeles each with a score of 25.47
growth through the development of breakthrough prod-ucts, “tradable converging” firms which remain glob-ally competitive in existing products, and a set of local entities including medical centers and science parks that provide local services to the cluster.
A good deal of this requires a collaborative form of industrial policy with both the federal and state govern-ment playing major roles in the emergence of the cluster. In the 1950s, the federal government continued its fund-ing of R&D in the biosciences as part of its Cold War strategy. The VC model was invented and the first high-tech firms founded. In the 1970s, the federal government declared a “War on Cancer” with NIH funding, while the first recombinant DNA experiments were undertaken in university laboratories and private research firms.
In 1980, the Bayh-Dole Act was adopted, giving univer-sities IP ownership of the output from federally funded research while the first recombinant DNA products hit the market. In the Commonwealth, the Massachusetts Biotechnology Council was created in 1985, one of the first in the nation. In the 1990s, the first genomics companies were founded, led initially by Millennium Pharmaceuticals (established by a former Genentech executive).
Much of this early work came to fruition in the first decade of the 21st Century. During this period, the human genome was sequenced and the George W. Bush administration committed itself to doubling the NIH budget.
Here in the Commonwealth, a final piece of the cluster puzzle was put in place with the founding of the MLSC, followed by the state’s funding of the Life Sciences Initiative to help cement the region’s lead in this impor-tant cluster and maintain that lead into the future. With all of the other parts of the matrix in place in Massachu-setts, the state became a magnet for Big Pharma.
By the end of the first decade of the 21st Century, Massa-chusetts was home to 9 of the top 10 major drug compa-nies in America, surpassing New Jersey. Pfizer, Novartis, GlaxoSmithKline, Genzyme’s successor Sanofi, Astra-Zeneca, Abbot Laboratories, Merck and Bristol-Myers Squibb had all committed to operations in the Bay State. The largest of these big firms, in order of employment, are Genzyme (Sanofi), Pfizer, Biogen Idec, Novartis, Shire, Thermo Fisher Scientific, EMD Millipore, Vertex, Parexel International, and Hologic.45 Only the Swiss
24128_Spectrum Text.indd 28 3/14/13 11:29 AM

29L i f e S c i e n c e s I n n o v a t i o n a s a C a t a l y s t f o r E c o n o m i c D e v e l o p m e n t
CHAPTER FIVE
The Massachusetts Life Sciences Center
Life Sciences Accelerator Program—Provides financ-ing of up to $1 million for early-stage companies to help leverage additional sources of capital.
Small Business Matching Grant (SBMG) Program—Provides matching support capped at $500,000 per company to firms on the verge of commercializing new technologies developed using Phase II or Post-Phase II Small Business Innovation Research (SBIR) awards or Small Business Technology Transfer (STTR) grants from the federal government.
Life Sciences Tax-Incentive Program—Issues a combi-nation of 10 competitively awarded tax incentives available to companies that meet specified hiring goals. These include:
n A refundable 10% investment tax credit49
n A refundable in-state research tax credit
n A refundable job creation tax credit (50+ jobs)
n A refundable FDA user fee credit
n Extension of net operating losses to 15 years
n Deduction of orphan drug clinical testing
n Elimination of the sales factor throwback provision
n Special sales tax exemption
n Life sciences research credit for out-of-state costs
n Construction sales tax exemption
Capital Projects Fund—Provides capital for equipment and supplies for high schools in Gateway Cities, vocational/technical schools, and community colleges; and for capital projects in academic/research institu-tions, business incubators, and other not-for-profit organizations in the Commonwealth.
Between 2008 and June 30, 2012, the Center had directly invested or committed over $300 million that has lever-aged more than $1 billion in third-party investment, according to the MLSC’s report for fiscal year 2012. If none of that investment would have been made in Massachusetts in the absence of the MLSC commit-
What role does the MLSC play in the MIT schematic? Beginning with its creation, the MLSC took as its stra-tegic mission the role of pulling together all of the parts of the matrix into a life sciences ecosystem, creating a dense, highly connected community of scholars, entre-preneurs, industry leaders, venture capitalists, and government officials dedicated to the success of the life sciences super cluster in the Commonwealth. Unlike many state economic development initiatives, the Center has a broad range of strategic priorities geared to enhance all aspects of the life sciences cluster. These include:
n funding translational research—research that converts basic research into marketable products and services
n investing in promising new technologies
n ensuring worker skill acquisition that aligns with the needs of the life sciences industries
n creating new infrastructure from shared resources that accelerates innovation
n building partnerships between sectors of the local and international life sciences communities
To accomplish these goals, the Center relies on a portfo-lio of seven distinct programs.48 These include:
Cooperative Research Grants—Supports industry-sponsored research at universities and facilitates scien-tific discoveries that lead to medical applications. These grants of $250,000 per year for up to two years match industry contributions dollar for dollar.
Internship Challenge Program—Provides up to $7,200 in funds for interns working at Massachusetts compa-nies with fewer than 100 employees and fewer than 250 globally.
New Investigator Grants—Spurs innovative research and advances the careers of new investigators who are working on cutting-edge research at Massachusetts academic research centers with grants of $100,000 per year for up to three years.
24128_Spectrum Text.indd 29 3/14/13 11:29 AM

30 U n d e r s t a n d i n g B o s t o n
Examples of infrastructure activity as listed in MLSC’s FY2012 report include:
n $5 million in support of the construction of the Joslin Center’s Translational Center for the Cure of Diabetes
n $10 million to the Dana Farber Cancer Institute to support the expansion of its $20 million Molecular Cancer Imaging Facility
n $5 million to the Boston Museum of Science for the construction of its “Hall of Human Life,” which helped leverage $11 million in private financing
n $14.6 million to the University of Massachusetts Dart-mouth to build its new Massachusetts Biomanufac-turing Center in Fall River
n $10 million to UMass Lowell to equip laboratories within its new Emerging Technologies and Innova-tion Center
n $14.3 million to help build the Framingham Waste-water and Pumping Station that will allow bioscience firms to operate in that community
Examples of accelerator loans awarded in FY2012 to provide working capital to early stage life sciences companies include:
n $750,000 to Allurion of Wellesley for developing a novel medical device for inducing weight loss in obese patients
n $750,000 to Alcyone Lifesciences, Inc. for the devel-opment of a micro-catheter for treating neurological conditions
n $245,000 to Strohl Medical for the creation of a medi-cal device for accelerating the treatment of stroke victims
Subsequent to receiving accelerator loans, early stage firm recipients have raised more than $100 million in either private or public funding to grow their firms or in acquisition proceeds. Already six firms that have received accelerator loans have paid them off early, permitting the MLSC to construct a revolving fund, thus expanding the resources the Center has for this purpose.
In addition to the accelerator loans, the MLSC has begun a Small Business Matching Grant Program (SBMG), which complements funds received by firms from NIH, the National Science Foundation (NSF), and DOD. In 2012, the Center awarded a $500,000 grant to Firefly BioWorks, Inc. of Cambridge after full review by the
ments, each dollar of taxpayer money spent by the Center resulted in the attraction of $3.40 in additional, outside investment creating a public-private investment fund of more than $1.3 billion.50
There are four factors that make the MLSC quite differ-ent from most government subsidy programs:
n Instead of simply providing tax benefits to a few private firms to lure them to the Commonwealth, the MLSC has a portfolio of investment tools that include direct investments in life sciences companies; grants to academic organizations and medical centers and grants for “shovel ready” public and non-profit sector capital projects that help influence the location deci-sions of life sciences companies.
n The MLSC operates under a Board of Directors that includes state government officials, industry CEOs, leaders from academia and medicine, bioscience researchers and others who have great knowledge of the life sciences.
n Investments are reviewed by a panel of more than 200 experts who send their recommendations to the Center’s Scientific Advisory Board, which itself is dominated by academic researchers, industry scien-tists and private venture capital experts who together can judge the scientific and economic potential of an MLSC investment.
n The Center insists on accountability in terms of private sector investment matches and specific job creation goals and retains the power to “claw back” tax incentives and other investments when these goals are not reached by grant recipients.51
In the four-year period between June 2008 and June 2012, the Center invested nearly $190 million in 12 capital proj-ects, provided 31 company grants and loans worth nearly $23 million, issued 35 academic research grants with a value in excess of $23 million and 56 tax incentives (still outstanding) valued at close to $57 million, invested $7 million to fund 884 interns as part of the Center’s mission to help develop the life sciences workforce, provided more than $3.3 million in equipment and supply grants to schools and spent $1.5 million on other grants includ-ing the funding of business plan competitions. As of June 30, 2012 the Center was managing a portfolio of approxi-mately 200 grants, loans, and tax incentives.52
24128_Spectrum Text.indd 30 3/14/13 11:29 AM

31L i f e S c i e n c e s I n n o v a t i o n a s a C a t a l y s t f o r E c o n o m i c D e v e l o p m e n t
This comprehensive approach to an entire industry cluster differs significantly from other federal, state, and local incentive programs that target a single company or, at best, a single industry.
We can now ask: “Has this approach, and the investments made through the MLSC, paid off?”
We begin to answer this question by tracking output and employment in the life sciences cluster and consider the results in terms of the creation of the Center in 2006.
But given what we have learned about the role of innovation in spurring economic growth, we can ask a more fundamental question. “Has the creation of the Center and the Life Sciences Initiative paid off in terms of nurturing a rich ‘ecosystem’ within which the entire life sciences super cluster can flourish now and in the future, providing a platform for further growth in economic opportunity for Massachusetts residents?”
MLSC Scientific Advisory Board. The company has already been able to launch its first commercially viable product for help in diagnosing cancer, neurological disorders, and other diseases.
Examples of matching grants for academic research include:
n $5.1 million in grants to early career investigators working in research institutions within the Common-wealth which have in turn helped generate over $13 million in federal government, foundation, and private company research grants
n $4.8 million in cooperative research grants (between 2008 and 2011) to encourage industry-sponsored research at Massachusetts institutions, resulting in more than $8.6 million in research grants from other sources
Examples of the $20.6 million in 2011 program tax incen-tives to 26 life sciences companies include $3 million to Shire HGT, Inc.; $2.45 million to Vertex; $2.3 million to AVEO Pharmaceuticals; and $1.84 million to Biogen Idec MA, Inc. Smaller tax incentives of less than $500,000 went to such firms as Blueprint Medicines Corporation in Cambridge and T2 Biosystems, Inc. in Lexington. Under the Life Sciences Act, the Department of Reve-nue has the authority to “claw back” incentives from companies that the Center determines have not met the minimum job creation thresholds in their tax-incentive agreements.
In addition, the MLSC Internship Challenge Program has placed more than 1,000 interns in more than 290 companies across the state where host companies provide dedicated mentors to help expand the pool of prospective life sciences workers for the future. Those college students receiving MLSC internships are majoring in biology, engineering, chemistry, business, computer science and physics and end up interning in companies that produce medical devices, pharmaceu-tical products, diagnostic services, and biotechnology research. In FY2012, the Center also awarded $180,000 to four programs to encourage science, technology, engineering and math (STEM) education, especially for women and minorities.
Table 3 provides a summary of the investments made by the MLSC between June 2008, when the Life Sciences Initiative funding first became available, and June 2012.
TABLE 3
Distribution of MLSC Investments by Dollar Amount June 2008–June 2012
Capital Projects (12) $186,950,000
Company Grants and Accelerator Loans (31) $22,907,000
Academic Research Grants (35) $23,346,344
Tax Incentives (56) $56,595,093
Interns Funded for Workforce Development (884) $6,903,164
Equipment and Supply Grants or Schools (32) $3,333,675
Other Grants/Business Plan Competitions $1,540,000
Total $301,575,276
Source: Massachusetts Life Sciences Center, 2013
24128_Spectrum Text.indd 31 3/14/13 11:29 AM

24128_Spectrum Text.indd 32 3/14/13 11:29 AM
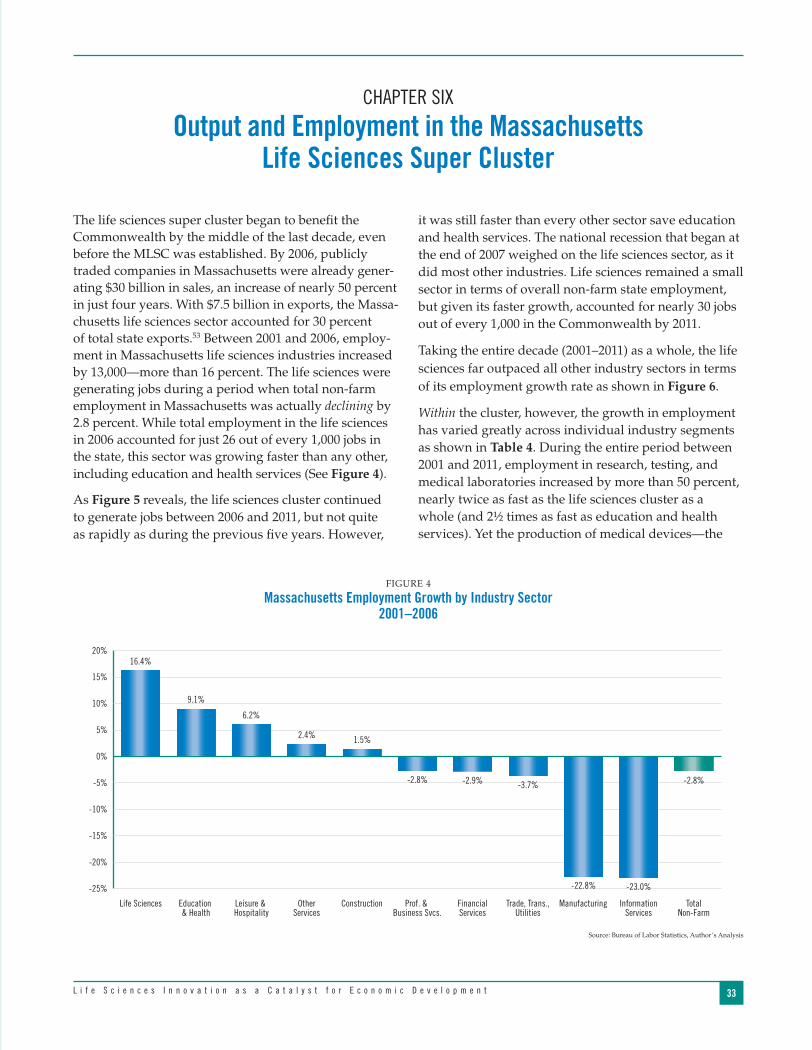
33L i f e S c i e n c e s I n n o v a t i o n a s a C a t a l y s t f o r E c o n o m i c D e v e l o p m e n t
CHAPTER SIX
Output and Employment in the Massachusetts Life Sciences Super Cluster
The life sciences super cluster began to benefit the Commonwealth by the middle of the last decade, even before the MLSC was established. By 2006, publicly traded companies in Massachusetts were already gener-ating $30 billion in sales, an increase of nearly 50 percent in just four years. With $7.5 billion in exports, the Massa-chusetts life sciences sector accounted for 30 percent of total state exports.53 Between 2001 and 2006, employ-ment in Massachusetts life sciences industries increased by 13,000—more than 16 percent. The life sciences were generating jobs during a period when total non-farm employment in Massachusetts was actually declining by 2.8 percent. While total employment in the life sciences in 2006 accounted for just 26 out of every 1,000 jobs in the state, this sector was growing faster than any other, including education and health services (See Figure 4).
As Figure 5 reveals, the life sciences cluster continued to generate jobs between 2006 and 2011, but not quite as rapidly as during the previous five years. However,
it was still faster than every other sector save education and health services. The national recession that began at the end of 2007 weighed on the life sciences sector, as it did most other industries. Life sciences remained a small sector in terms of overall non-farm state employment, but given its faster growth, accounted for nearly 30 jobs out of every 1,000 in the Commonwealth by 2011.
Taking the entire decade (2001–2011) as a whole, the life sciences far outpaced all other industry sectors in terms of its employment growth rate as shown in Figure 6.
Within the cluster, however, the growth in employment has varied greatly across individual industry segments as shown in Table 4. During the entire period between 2001 and 2011, employment in research, testing, and medical laboratories increased by more than 50 percent, nearly twice as fast as the life sciences cluster as a whole (and 2½ times as fast as education and health services). Yet the production of medical devices—the
FIGURE 4
Massachusetts Employment Growth by Industry Sector 2001–2006
Source: Bureau of Labor Statistics, Author’s Analysis
-25%
-20%
-15%
-10%
-5%
0%
5%
10%
15%
20%
TotalNon-Farm
InformationServices
ManufacturingTrade, Trans.,Utilities
FinancialServices
Prof. & Business Svcs.
ConstructionOtherServices
Leisure & Hospitality
Education & Health
Life Sciences
16.4%
9.1%
6.2%
2.4% 1.5%
-2.8% -2.9% -3.7%
-22.8% -23.0%
-2.8%
24128_Spectrum Text.indd 33 3/14/13 11:29 AM

34 U n d e r s t a n d i n g B o s t o n
What is notable, however, is that the employment growth rate actually increased in the second period (2006–2011) for both the pharmaceutical industry and
key manufacturing segment of the life sciences cluster —remained nearly constant over this period, increasing by just 0.2 percent.
FIGURE 5
Masssachusetts Employment Growth by Industry Sector 2006–2011
Source: Bureau of Labor Statistics, Author’s Analysis
-30%
-25%
-20%
-15%
-10%
-5%
0%
5%
10%
15%
Total Non-Farm
ConstructionManufacturingFinancial Services
Information Services
Trade, Trans., Utilities
Prof. & Business Svcs.
Other Services
Leisure & Hospitality
Life SciencesEducation & Health
10.6%9.2%
4.0%1.8%
0.4%
-3.8% -4.5%
-8.1%
-15.1%
-23.7%
-1.1%
FIGURE 6
Massachusetts Employment Growth by Industry Sector 2001–2011
Source: Bureau of Labor Statistics, Author’s Analysis
-40%
-30%
-20%
-10%
0%
10%
20%
30%
40%
Total Non-Farm
ManufacturingInformation Services
ConstructionFinancial Services
Trade, Trans., Utilities
Prof. & Business Svcs.
Other Services
Leisure & Hospitality
Education & Health
Life Sciences
27.3%
20.6%
10.4%
4.2%2.1%
-5.6%
-10.7%
-22.5%-25.4%
-34.3%
-3.9%
24128_Spectrum Text.indd 34 3/14/13 11:29 AM

35L i f e S c i e n c e s I n n o v a t i o n a s a C a t a l y s t f o r E c o n o m i c D e v e l o p m e n t
employment trends reveal that the Commonwealth has indeed overtaken the rest of the nation in terms of employment growth in the life sciences, fulfilling the initial goal of the MLSC.
Figure 7 reveals the trend in life sciences employment in Massachusetts compared to that of the nation as a whole between 2001 and 2011. During this period, Massachu-setts life sciences employment growth outperformed the nation by a factor of better than 2-to-1—growing by 27.3 percent vs. 11.9 percent for the nation.
Figure 8, which indexes employment growth to 2007, reveals how the Commonwealth’s life sciences cluster grew at a faster clip than the nation’s, surpassing the nation and now remaining firmly ahead of it in terms of employment growth.
medical device manufacturing, despite recession condi-tions nationally and regionally. Indeed, all four sectors in Table 4 exhibited increased employment during this difficult economic period.
Life Sciences Employment Trends: Massachusetts vs. the United StatesThe capacity of the Commonwealth’s life sciences to create jobs at a faster pace during the past decade than all other major Massachusetts industries is one indica-tor of the successful development of this sector. Even more important is how the state’s life sciences have performed relative to the country as a whole and other states vying for supremacy in this rapidly evolving cluster of industries. The data we have gathered on
FIGURE 7
Employment in Life Sciences Indexed to 2001, Massachusetts vs. the U.S.
Source: Author’s Analysis from BLS data
100%
105%
110%
115%
120%
125%
130%
20112010200920082007200620052004200320022001
127.3 %
111.9%
MAU.S.
FIGURE 8
Employment in Life Sciences Indexed to 2007, Massachusetts vs. the U.S.
Source: Author’s Analysis from BLS data
80%
85%
90%
95%
100%
105%
110%
20112010200920082007200620052004200320022001
105.2 %
101.4%
MAU.S.
TABLE 4
Employment Change by Life Sciences Cluster Segment
2001 2006 2011 % Δ2001–2006 % Δ2006–2011 % Δ2001–2011
Drugs & Pharma 7,794 7,944 8,537 1.9% 7.5% 9.5%
Medical Devices & Equipment 22,835 21,645 22,882 –5.2% 5.7% 0.2%
Research, Testing, & Medical Labs 34,849 47,072 52,819 35.1% 12.2% 51.6%
Bioscience-Related Distribution 9,607 10,877 11,377 13.2% 4.6% 18.4%
Total 75,085 87,538 95,615 16.6% 9.2% 27.3%
Source: Bureau of Labor Statistics, Author’s Analysis
24128_Spectrum Text.indd 35 3/14/13 11:29 AM

36 U n d e r s t a n d i n g B o s t o n
the life sciences super cluster. In 2011, the Common-wealth boasted more than 28,000 jobs, exceeding second place California (22,600) and third place Pennsylvania (11,200).54 Since 2007, this particular sector grew faster in the Commonwealth than in any other state, adding more than 3,500 jobs.
When we control for population size, Massachusetts is the clear winner for the entire life sciences cluster of industries. In Figure 10, we have controlled for the size of population of each state by measuring the number of life sciences jobs per 1 million residents. In 2001, the District of Columbia actually had the highest per capita number of life sciences jobs, presumably because of the physical presence of the National Institutes of Health. Delaware ranked second followed by New Jersey. California actually lagged Minnesota, Utah, and New Mexico on this measure. Massachusetts ranked #4.
But by 2011, given its rapid growth rate, the Massachu-setts cluster had risen to #1 in terms of per capita life sciences employment. With nearly 14,300 life sciences jobs per 1 million people, Massachusetts had eclipsed New Jersey (12,171) and continued to far outstrip California (8,300).
The Commonwealth’s main competitors in the life sciences include California, New Jersey, New York, Florida, and Texas. But as Figure 9 demonstrates, after 2008 the Commonwealth overtook all of these states in terms of its 2001–2011 employment growth rate. Florida’s nascent life sciences sector had been growing faster, but has fallen behind the Bay State during the past four years. Texas has been trying to catch up, but still trails Massachusetts. Over the decade, California’s life sciences employment grew by just 18.4 percent compared with the Commonwealth’s 27.3 percent. The growth rate in New York has been anemic, adding only 2 percent to its life sciences workforce while New Jersey, once the pharmaceutical capital of the nation, has seen its life sciences cluster decline sharply since 2007.
Even with Massachusetts’s #1 position in the life sciences employment growth rate, it is not surprising that other states still have a larger absolute number of life sciences jobs. Of the top six states, Massachusetts ranked 5th in 2011, as Table 5 reveals. California leads the pack with nearly 310,000 life sciences jobs.
Yet even as a much smaller state in total population, Massachusetts now leads all other states in the number of jobs in the vital biotechnology R&D sector within
FIGURE 9
Employment in Life Sciences Indexed to 2001, Massachusetts vs. Big Competitor States
Source: Author’s Analysis from BLS data
90%
95%
100%
105%
110%
115%
120%
125%
130%
TX FL NYCA NJMA
20112010200920082007200620052004200320022001
FIGURE 10
Life Sciences Jobs per 1 Million 2010 PopulationTop 8 States in 2011, by Year
Source: Author’s Analysis from BLS data
5,000
7,000
9,000
11,000
13,000
15,000
17,000
19,000
21,000
CA MN DC UT
DE NJ NM MA
20112010200920082007200620052004200320022001
24128_Spectrum Text.indd 36 3/14/13 11:30 AM
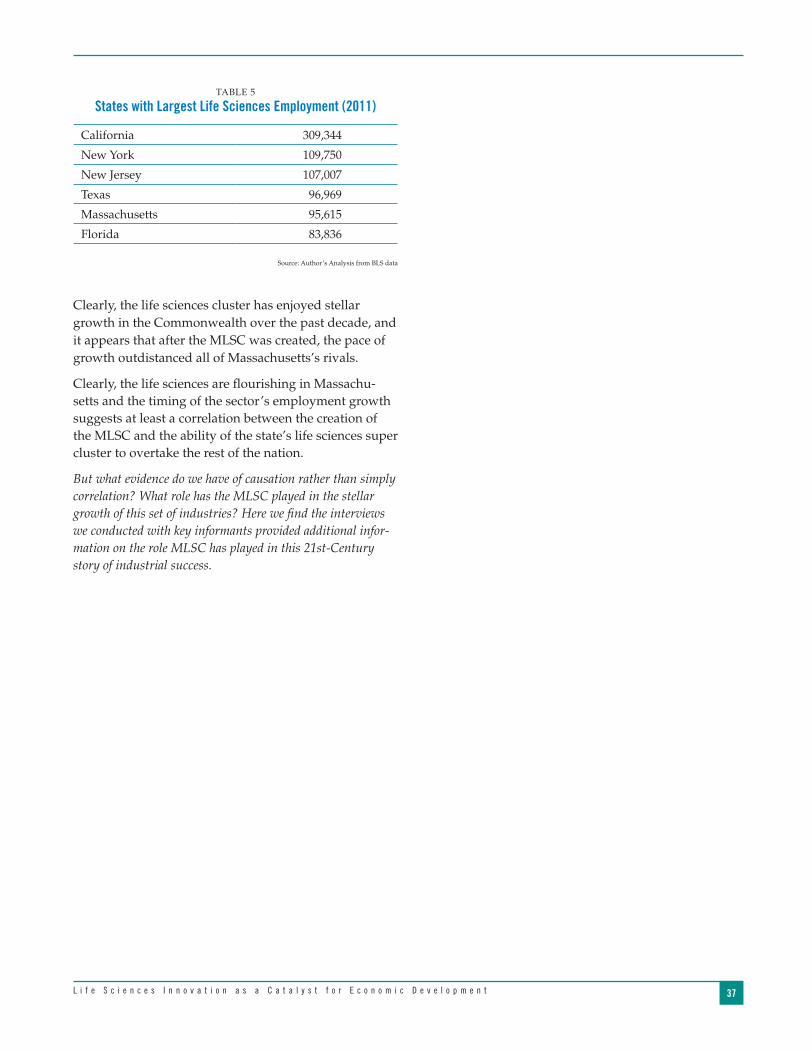
37L i f e S c i e n c e s I n n o v a t i o n a s a C a t a l y s t f o r E c o n o m i c D e v e l o p m e n t
Clearly, the life sciences cluster has enjoyed stellar growth in the Commonwealth over the past decade, and it appears that after the MLSC was created, the pace of growth outdistanced all of Massachusetts’s rivals.
Clearly, the life sciences are flourishing in Massachu-setts and the timing of the sector’s employment growth suggests at least a correlation between the creation of the MLSC and the ability of the state’s life sciences super cluster to overtake the rest of the nation.
But what evidence do we have of causation rather than simply correlation? What role has the MLSC played in the stellar growth of this set of industries? Here we find the interviews we conducted with key informants provided additional infor-mation on the role MLSC has played in this 21st-Century story of industrial success.
TABLE 5
States with Largest Life Sciences Employment (2011)
California 309,344
New York 109,750
New Jersey 107,007
Texas 96,969
Massachusetts 95,615
Florida 83,836
Source: Author’s Analysis from BLS data
24128_Spectrum Text.indd 37 3/14/13 11:30 AM

24128_Spectrum Text.indd 38 3/14/13 11:30 AM

39L i f e S c i e n c e s I n n o v a t i o n a s a C a t a l y s t f o r E c o n o m i c D e v e l o p m e n t
community of life sciences institutions including univer-sities, research hospitals, small start-up bioscience firms, medical device manufacturers, and Big Pharma. These stakeholders all interact on a regular basis to assist each other in the promotion of their activities. The ecosystem includes the nurturing of small firms through the MLSC’s accelerator-loan and tax-incentive programs, assistance to the life sciences research labs in the state’s public higher education system, the provi-sion of funds for student interns in relevant fields, and countless opportunities for executives, scientists, and industry employees to meet and explore opportuni-ties for expanding the life sciences super cluster in the Commonwealth. The Center has been critical, according to our key informants, in helping to build a “platform” for the entire sector and cultivate a “collaborative gene” among all of its separate parts.
As one recent example of this role, the MLSC helped create the Massachusetts Neuroscience Consortium, announced at the 2012 BIO International Convention in Boston. With charter sponsors including Abbott Labs, Biogen Idec, EMD Serono, Janssen Research & Develop-ment LLC, Merck, Pfizer, and Sunovion Pharmaceu-ticals, Inc., the consortium provides an arrangement whereby companies that normally compete with each other collaborate on funding preclinical neuroscience research under way at academic and research institu-tions throughout the state. With leadership provided by the MLSC, each of the founding sponsors has pledged $250,000 toward this effort, and the Center will admin-ister the funds.55 The research results will be shared with all participants and all companies and academic researchers will have access to any tools developed as a result of these investigations. Without the Center play-ing this convening role, it is unlikely that such a consor-tium would have come into existence.
The Center has also been responsible for helping to nurture international cooperation among life sciences firms and academic institutions. The Center provided a $300,000 grant to the Northern Ireland Massachusetts Connection (NIMAC) for a new multinational research
CHAPTER SEVEN
The Key Role of the MLSC: What We Learned from the Interview Data
To obtain a firsthand view of what part the MLSC may have played in the emergence of the Commonwealth’s life sciences ecosystem, we conducted a series of “key informant interviews” with executives in the industry, with leaders of related trade associations, and with a number of scientists who have an intimate knowledge of the range of activities of the Center. In order to obtain an honest and unbiased assessment of the $1 billion initia-tive itself and the functioning of the Center, we assured each of our informants strict confidentiality. Interviews were carried out with executives in both large and small companies in the industry, with those mostly devoted to research and development, and with those whose companies are now involved with the manufacture of scientific and medical products.
While we probed on many fronts, we asked each infor-mant to consider a fundamental “counterfactual”: Would the life sciences in Massachusetts be much different from what they are today if the MLSC had never been created and the state had not committed long-term funding to assist the array of universities, research institutes, and companies that make up the life sciences super cluster? What we learned provided us with a vital and deeper understanding of the critical role the MLSC has played.
Here are our key findings.
The Development of the Life Sciences “Ecosystem”The leaders of large firms told us that given the scale of their operations, the MLSC plays at best a minor direct role in their own development, but an immense indirect role that helped to attract them to Massachusetts. The term that surfaced in virtually all of our interviews is “ecosystem,” and that the MLSC has been central to the creation of the life sciences ecosystem that has made the Commonwealth more attractive than competing regions.
According to our interviews, the MLSC has indeed been instrumental in bringing together a tight-knit
24128_Spectrum Text.indd 39 3/14/13 11:30 AM

40 U n d e r s t a n d i n g B o s t o n
panoply of small start-up firms. The reason for this is that despite their substantial research budgets, even the largest of the life sciences companies do not have the resources to generate more than a handful of break-through innovations in the biosciences, genomics, and other sophisticated fields. These large firms grow and prosper by carefully monitoring the scientific discover-ies under way in university research laboratories and in the translational research carried out by small start-up firms. Those few start-ups that end up with potential blockbuster drugs or devices become prime targets for acquisition by the larger firms. Only a fraction of the long-term revenue generated by Big Pharma and the largest biotech and medical device companies has its origin in their own research labs. The majority comes from the absorption of successful smaller firms.
The secret to success in the acquisition process is being where the small firms are located. This permits the large firms to closely monitor the progress of smaller firms and buy the most promising ones before other Big Pharma or other competitors can make a bid. To use a metaphor from nature, the large, globally important life sciences firms want to feed in the waters where the minnows are swimming.
Pfizer, for one, has moved operations into Cambridge from other locations for this purpose.56 In 2010, it announced that Cambridge would become one of Pfiz-er’s worldwide research and development hubs, and it relocated approximately half of the current employees from its BioTherapeutics R&D organization to Kendall Square. A year later, Pfizer announced plans to move two existing research units, Cardiovascular Medicine (CVMed) and Neuroscience from Groton, Connecticut, to Cambridge, leasing 180,000 square feet of lab and office space from MIT to house these two research units.
In June 2011, Pfizer opened the Boston Centers for Ther-apeutic Innovation (CTI), an entrepreneurial network of partnerships with leading academic medical centers. According to the company, “these partnerships reduce the time and cost of drug discovery and development by accessing leading translational researchers.”57 Boston is also the global headquarters for the CTI network, which has established partnerships in New York City and San Francisco. The richness of the Massachusetts life sciences ecosystem prompted Pfizer to expand still further in the Commonwealth, with the company’s newest building in Cambridge scheduled to be completed in 2013.
study on non-invasive procedures to detect pre-malig-nant lesions. Finland and Catalonia have joined NIMAC as well. MLSC is also helping to develop alliances between Massachusetts companies and Israeli firms through the Massachusetts-Israel Innovation Partner-ship (MIIP). The Center has contributed $300,000 to this effort so far, funding two Massachusetts firms working in partnership with Israeli firms. A second round of funding for this program is pending.
All of these efforts are part of building an ever larger life sciences ecosystem based in the Commonwealth.
The Unique Growth Pattern of Regional Life Sciences ClustersThe most important lesson we derived from our inter-views, however, was the unique growth pattern of the life sciences cluster. The regional concentration of life-sciences companies happens in a very different manner than in other industries. In the case of traditional industrial sectors such as auto, aircraft engine, financial services and the like, a region becomes dominant in a particular cluster once a large anchor enterprise or a small number of them establish operations in that locale. Once the anchor enterprise is established, an array of smaller firms is attracted to that region to serve as part of the supply chain for the large anchor enterprise(s).
Once Detroit became home to Henry Ford’s car company and General Motors and Chrysler built huge auto assembly facilities in Michigan, hundreds of small parts plants, design studios, and small engineering facilities opened their doors nearby in order to easily serve the industry’s “Big Three.” The same is true of the aircraft engine industry in New England dominated by Pratt & Whitney in East Hartford, Connecticut, and General Electric’s Aircraft Engine facility in Lynn-Everett, Massachusetts. These massive facilities attracted hundreds of aircraft engine parts suppliers to New England, making the region one of the core jet-engine manufacturing centers in the United States. Essentially, the small firms in the industry are dependent on the large ones.
For the life sciences, the reverse is true. For companies that crucially depend on the development of break-through innovations and sophisticated medical devices, the large firms prosper by reason of being proximate to a
24128_Spectrum Text.indd 40 3/14/13 11:30 AM

41L i f e S c i e n c e s I n n o v a t i o n a s a C a t a l y s t f o r E c o n o m i c D e v e l o p m e n t
The lack of easy access to VC funds has worried small life sciences firms about the “valley of death”—the gap in funding needed to move basic research into commercial products. In this environment, the MLSC has become an important investment partner for smaller life sciences firms, providing them with funds for trans-lational research and development. These smaller firms may grow out of local research universities and medi-cal complexes, but they can then turn to the MLSC for investment assistance. This tends to help keep them in the Commonwealth instead of losing them to invest-ment funds in other regions.
In a number of cases, we found that smaller companies were being lured to relocate to other states, but accord-ing to their executives, the MLSC moved quickly to narrow the interregional cost differential and keep these firms in the Commonwealth. They did this through tax incentives and investment credits. And because these “minnows” stay here, Big Pharma has come from all over the world to swim in this pond. By helping to attract small life sciences companies to Massachusetts as well as incubating new ones begun in the state, the MLSC has created a well-stocked fishing ground for Big Pharma. In 2012 alone, a large array of small- and medium-sized domestic and international firms chose to establish operations in Massachusetts, including Era7 Bioinformatics, Algeta U.S., QServe, Scivax USA, Repro-CELL, Inc., Human Metabolome Technologies, Inc., Alacrita, Arrayjet, ARGO Medical Technologies, BioAx-one, BioSurplus, Promedior, and KeraFAST.
By the end of 2012, nine of the ten major drug compa-nies in the world had set up shop in Massachusetts.61 To house these firms, 3.4 million square feet of biotech-related office and laboratory space is now under construction across Massachusetts with massive build-ings now being completed for Pfizer and Novartis. This adds to the 2.4 million square feet of commercial lab space erected between 2007 and 2011.62 The other Big Pharma firms with major investments in Massachusetts are Johnson & Johnson, GlaxoSmithKline, Sanofi (which absorbed Genzyme), AstraZeneca, Abbott Laborato-ries, Merck, and Bristol-Myers Squibb. A decade ago, none of these global firms had a significant presence or any presence at all in the state, according to Mass Bio, the state’s life sciences trade group.63 Only Roche, the Swiss company and third largest biopharmaceutical firm in the world, has yet to establish a presence in the Commonwealth.
Over the past three years, Massachusetts is the only state where Pfizer has added jobs, not California, Connecti-cut, New Jersey, or New York. As an executive of this company told us in one interview, “Innovation between the big, the small, and the in-between is what makes the industry succeed.” Another Pfizer executive noted that while his company has not taken a dollar from the MLSC, the Center has helped the firm by creating a “mentality” about the life sciences that has permeated the state right down to the local level, making it possible to speed local permitting and rezoning where necessary.
Executives at Sanofi-Aventis SA, which acquired Genzyme in 2011 in a $20 billion deal, have relied on the MLSC to “act as a bridge” between the company and such research institutions as the Cummings School of Veterinary Medicine at Tufts University and the Univer-sity of Massachusetts Medical Complex in Worcester. Like Pfizer, Sanofi is expanding in Cambridge in order to have a “front row seat” for acquisitions.58
And here is the key to understanding the central role of the MLSC. While the large firms can easily exist without the MLSC, the small life sciences firms need the Center to provide them with accelerator loans, research and development funds, and interns who can help them translate their ideas into what could be commercially viable products. While the private venture capital market may provide some funds for this purpose, venture capital often requires a quicker return than can be obtained from this industry, which often has long lag times between initial research, proof of concept, and a final FDA-approved product.
In 2012, according to data gathered by Pricewater-houseCoopers, venture capital investments in biotech and health-care startups fell to their lowest level since 1995.59 Investment in biotech firms in the Boston area dropped to $869 million in 2012, a 24 percent reduc-tion from 2011 levels. Regulatory uncertainty facing the health-care industry is making this “a more challenging time for life sciences companies to raise money,” accord-ing to Terry McGuire, general partner of Polaris Venture Partners, a Waltham-based VC firm with about half its portfolio invested in health-care companies.60 Another reason biotech investments may be dwindling is that new software companies are on the rise and the return on investments in these firms tends to be much more “capital-efficient,” paying off relatively rapidly.
24128_Spectrum Text.indd 41 3/14/13 11:30 AM

42 U n d e r s t a n d i n g B o s t o n
It should be noted that other states that have created similar life sciences initiatives have had a less-than-stellar record of maintaining a process free of political consid-erations. In early 2013, the Texas Legislature essentially defunded the state’s Cancer Prevention and Research Institute (CPRIT), which had been established by refer-endum in 2007. This followed the resignation of the agency’s chief scientific officer, along with many of the institute’s high-profile grant reviewers, in protest over how the independent peer review system had been disre-spected.64 According to the chair of the MLSC’s Scientific Advisory Board, here in the Commonwealth the Center has been scrupulous in following the recommendations of the Center’s Board of Directors and the SAB.
This has apparently contributed to the Center’s excep-tional record of assisting firms that ultimately succeed and grow. Accountability measures implemented by the Center have also contributed to the success of the Center’s tax program. As Table 6 reveals, the Center had
With this growth dynamic at work, Massachusetts appears well positioned to continue to attract new investment in the life sciences cluster.
The MLSC “Modus Operandi”In the course of this study, many of those interviewed commented on the protocols that the MLSC follows in carrying out its activities. According to these sources, the Center’s success in funding firms is grounded in its reliance on a Scientific Advisory Board (SAB) to guide the Center’s Board of Directors in determining which firms show the greatest promise of economic and scien-tific success. The Center has established a competitive process for securing assistance and the SAB has made certain that the process is transparent. Over and over again, we heard in our interviews words like “rigorous” and “diligent” when describing the processes MLSC uses in selecting awardees.
TABLE 6
Firms Receiving Tax Incentive Funding (Program Years 2009-2011)—Active Awards
Hiring Goal
Hiring Actual
% of Goal
Hiring Potential
2009 Shire 150 153 102% 153
2009 Cubist 58 60 103% 60
2009 Biogen 50 235 470% 235
2009 Merrimack 50 53 106% 53
2009 Lightlab 29 32 110% 32
2009 Constellation 26 21 81% 26
2009 Sepracor 25 108 432% 108
2009 InfraReDX 21 25 119% 25
2009 OmniGuide 18 10 56% 18
2009 Organogenesis 15 26 73% 26
2009 Dyax 15 23 153% 23
2009 Still River 10 18 180% 18
2009 Nova 10 25 250% 25
2009 Infinity 18 14 78% 18
2009 STD Med 10 54 540% 54
2010 Shire 150 141 94% 150
2010 Sanofil 100 101 101% 101
2010 Vertex 90 136 151% 136
2010 NX Stage 50 27 54% 50
2010 Merrimack 50 37 74% 50
24128_Spectrum Text.indd 42 3/14/13 11:30 AM

43L i f e S c i e n c e s I n n o v a t i o n a s a C a t a l y s t f o r E c o n o m i c D e v e l o p m e n t
TABLE 6
Firms Receiving Tax Incentive Funding (Program Years 2009-2011)—Active Awards (continued)
Hiring Goal
Hiring Actual
% of Goal
Hiring Potential
2010 Ironwood 37 56 151% 56
2010 Instrumentation Laboratory 30 30 100% 30
2010 Valeritas 18 10 56% 18
2010 Organogenesis 17 44 259% 44
2010 Bluebird 10 13 130% 13
2010 Bind 10 8 80% 10
2010 NormOxys 10 –5 –50% 10
2010 LeMaitre 19 43 226% 43
2010 Foundation Medicine 40 25 63% 40
2010 Lightlab 14 45 321% 45
2010 Nova 10 10 100% 10
2011 Shire 100 100
2011 Vertex 100 100
2011 AVEO Pharma 94 94
2011 Biogen Idec 75 75
2011 Ironwood 75 75
2011 DePuy Othopaedics 50 50
2011 Momenta Pharma 50 50
2011 PerkinElmer 50 50
2011 Organogenesis 35 35
2011 Aegerion Pharma 27 27
2011 Lightlab 26 26
2011 Cell Signaling Tech 20 20
2011 Quanterix Corp 19 19
2011 NinePoint Medical 15 15
2011 Pharmalucence 12 12
2011 Metamark Genetics 11 11
2011 New England Biolabs 10 10
2011 Nova 10 10
2011 T2Biosystems 10 10
2011 Boston Heart Diagnostics 31 31
2011 Ra Pharma 10 10
2011 Blueprint Medicines 15 15
2011 PAREXEL International 32 32
2011 Moderna Therapeutics 13 13
2011 Courtagen Life Sciences 13 13
2011 Knome 12 12
2009–2011 Awardees 1,160 1,578 136%* 2,639**
Source: Massachusetts Life Sciences Center
* Proportion of hiring goal for 2009–2010 active awardees only; no data available on 2011 awardees at this time
** Minimum total jobs created if, on average, all firms meet or exceed hiring
24128_Spectrum Text.indd 43 3/14/13 11:30 AM

44 U n d e r s t a n d i n g B o s t o n
of the program. The outstanding amount of the tax incentive awards as of June 30, 2012 amounts to $15.25 million. Fifteen firms received tax incentive awards in that year totaling $15.25 million. They ranged in size from $6.3 million to Shire Human Genetic Therapies to $121,000 to STD Med, Inc. In 2009, these firms had a base headcount of 5,427. The target headcount associ-ated with these awards was 5,932—an increase of 505 hires. By the end of 2011, 12 of these firms had met or exceeded their hiring targets.
What adds to the efficiency of these awards is a “claw-back” feature requiring firms that fail to meet their approved hiring goals to return to the Center the funds they were provided. A number of firms have done just that when they were unable to meet their specified mini-mum job-creation targets.
31 outstanding tax incentive packages from the 2009 and 2010 programs as of June 30, 2012.
In a number of cases, hiring targets were exceeded by a factor of four or greater. In only one case did a firm receiving an award actually reduce its staff. As of June 30, 2012, the currently active 31 awards from the 2009/2010 program have produced 1,578 new jobs, exceeding the aggregate hiring goal of 1,160 by 36 percent. Adding in the 2011 program awards for which we do not yet have data on hiring, the potential number of new hires could exceed 2,600 if all firms, on average, meet or exceed hiring goals.
As noted above, the accelerator loan program is also meeting with success, with six of the 20 firms that received such loans already repaying them in full.
Table 7 provides additional data on the outstanding awards to firms from the 2009 program, the first year
TABLE 7
Annual Report: 2009 Tax Incentive Program Results—for annual reporting period ending December 31, 2011
Per Agreement Actual 2011 Actual
$ Award Provided
Base Hdct Adds Targeted
12/31/2011 Hdct
Actual Growth
(from base)
% of Adds
(from base)
Achieved or exceeded
target
COMPANY
Active awards
1 Shire Human Genetic Therapies, Inc. $6,277,057 986 150 1136 1280 294 196% Yes
2 Cubist Pharmaceuticals, Inc. $1,740,000 355 58 413 415 60 103% Yes
3 Biogen Idec MA, Inc. $1,500,000 1899 50 1949 2134 235 470% Yes
4 Merrimack Pharmaceuticals, Inc. $1,500,000 124 50 174 214 90 180% Yes
5 LightLab Imaging, Inc. $188,951 64 29 93 141 77 266% Yes
6 Constellation Pharmaceuticals, Inc. $513,252 41 26 67 62 21 81% No
7 Sepracor Inc. / Sunovion $750,000 601 25 626 709 108 432% Yes
8 Infraredx, Inc. $630,000 60 21 81 85 25 119% Yes
9 OmniGuide, Inc. $ 540,000 62 18 80 72 10 56% No
10 Infinity Pharmaceuticals, Inc. $ 540,000 172 18 190 186 14 78% No
11 Organogenesis Inc. $ 245,240 241 15 256 311 70 467% Yes
12 Dyax Corp. $ 100,000 94 15 109 117 23 153% Yes
13 Mevion (formerly Still River Systems), Inc. $ 300,000 73 10 83 91 18 180% Yes
14 Nova Biomedical Corporation $ 300,000 498 10 508 533 35 350% Yes
15 STD Med, Inc. $ 121,000 157 10 167 211 54 540% Yes
TOTALS $ 15,245,500 5427 505 5932 6,561 1,134
Source: Massachusetts Life Sciences Center
24128_Spectrum Text.indd 44 3/14/13 11:30 AM

45L i f e S c i e n c e s I n n o v a t i o n a s a C a t a l y s t f o r E c o n o m i c D e v e l o p m e n t
Based on estimates from the Massachusetts Department of Revenue, we estimate that, on average, the added workers employed by these firms paid more than $4,900 in income taxes to the Commonwealth and $2,400 in sales taxes.65 Assuming that each of these jobs lasts on average just five years, the added state revenue gener-ated by these workers over that period is close to $37,000 per worker or a total of $93 million in tax revenue.
Compared with the total cost of the incentive program, each dollar in awards will generate $1.66 to the state in added tax revenue. This represents an extraordinary rate of return on this public investment.
Based on wage and salary data from the companies receiving tax-incentive awards between 2009 and 2011, we carried out an economic analysis of the cost and benefit of this MLSC program. The results are found in Table 8. Our analysis suggests that as of June 30, 2012, the Center had $56.3 million in outstanding tax incen-tives. Altogether, the firms receiving these incentives added more than 2,500 jobs by 2012. The vast majority (1,843) of these were in pharmaceutical firms with the remainder generated by medical device companies (481) and scientific research enterprises (213). The average annual salary of these jobs exceeded $105,000. As such, these new jobs generated a total of over $266 million in wages and salaries each year.
TABLE 8
Economic Return on the MLSC Tax Incentive Program
Program Year 2009
Program Year 2010
Program Year 2011
3 Years of Incentives
Total Value of MLSC Tax Incentives ($) $15,245,500 $20,672,638 $20,340,884 $56,259,022
Net New Jobs Created 901 721 915 2,537
Tax Incentive per Job ($) $22,175
Annual Tax Incentive per 5-year job ($) $4,435
Average Salary per Job ($) $105,037
Total Salaries Generated per Year ($) $266,479,399
State Income Tax Revenue per Job per year ($) $4,937
Total State Income Tax per year ($) $12,524,532
Average Sales Tax per Job ($) $2,404
Total State Sale Tax per year ($) $6,099,447
Total Income+Sales Taxes per year ($) $18,623,979
Average Income+Sales Tax/Job per year $7,341
Total Income+Sales Taxes per 5-year Job $36,705
Total Income+Sales Taxes over 5 years $93,120,585
Net State Revenue Gain (5 years) ($) $36,860,872
Ratio of Tax Revenue/Incentive over 5 years 1.66
Pharma Medical DevicesScientific Research Total
Jobs 1,843 481 213 2,537
Average Salary ($) $115,222 $66,913 $103,009 $105,037
Total Salary ($) $212,353,256 $32,185,280 $21,940,863 $266,479,399
Share of Salary 0.7969 0.1208 0.0823 1.0000
State Income Tax By Sector ($) $9,980,603 $1,512,708 $1,031,221 $12,524,532
Sales Tax by Sector ($) $4,860,554 $736,689 $502,204 $6,099,447
Source: Dukakis Center for Urban and Regional Policy
24128_Spectrum Text.indd 45 3/14/13 11:30 AM

46 U n d e r s t a n d i n g B o s t o n
FIGURE 11
Education Distribution of New Hires by 2010 MLSC Tax Incentive Awardees
Source: Dukakis Center for Urban and Regional Policy
Less than 2 years beyond HS4%
HS or Less15%
Ph.D.7%
ProfessionalDegree
3%
M.A. / M.S.19%
B.A.48%
Associate Degree4%
FIGURE 13
Education Distribution—Medical Devices
Source: Dukakis Center for Urban and Regional Policy
Some college,no degree16%
Less than HS graduate6%
HS graduate20%
Ph.D.2%
Professional degree2%
M.A. / M.S.16%
B.A.26%
Less than B.A.: 54%
Associate Degree12%
FIGURE 14
Education Distribution—Diagnostics, Tools, and Related Products and Services
Source: Dukakis Center for Urban and Regional Policy
Some college,no degree11%
Less than HS graduate1%
HS graduate6%
Ph.D.23%
Professionaldegree
2%
M.A. / M.S.19%
B.A.35%
Less than B.A.: 21%
Associate Degree3%
FIGURE 12
Education Distribution—Pharma
Source: Dukakis Center for Urban and Regional Policy
Some college,no degree12%
Less than HS graduate3% HS graduate
4%Ph.D.20%
Professionaldegree
3%
M.A. / M.S.22% B.A.
33%
Less than B.A.: 22%
Associate Degree3%
Of course, it is possible that these firms would have generated some or perhaps even many of these jobs with-out the MLSC award. But given the importance of the life-sciences ecosystem created in the Commonwealth, at least partly as a result of Center activity, it is reason-able to suggest that many of these jobs and their associ-
ated tax revenue would not have been created without the help of the Center. Moreover, our estimates do not consider any “multiplier” effects. The added spending of these new hires in the Commonwealth helped gener-ate additional jobs as these workers spent money in the state, creating jobs in a wide range of industries.
24128_Spectrum Text.indd 46 3/14/13 11:30 AM

47L i f e S c i e n c e s I n n o v a t i o n a s a C a t a l y s t f o r E c o n o m i c D e v e l o p m e n t
educated workers, these firms need laboratory techni-cians and clerical staff, and they employ a range of other workers in occupations that require a good deal less education. Figure 11, based on these hiring data, reveals that less than a third (29%) of those working in the life sciences have a Master’s degree, professional degree, or Ph.D. Nearly half (48%) have the B.A. or B.S. as their highest level of education, while nearly a quarter (23%) of the workforce has no more than an associate’s degree, often from a community college.
Using national data from the 2010 American Community Survey (ACS) available from the U.S. Census Bureau, we were able to estimate the education distribution for the individual sectors within the life sciences super cluster. As Figures 12–15 demonstrate, the proportion of work-ers in each of the cluster segments needing less than a B.A. (or B.S.) ranges from 21 percent in diagnostics, tools, and related products and services and 22 percent in pharmaceutical firms to more than half in medi-cal devices. According to these national estimates, the total workforce in the super cluster requiring less than a 4-year college degree is 30 percent, a bit higher than the 23 percent in Massachusetts. Essentially, with such a highly educated workforce in the Commonwealth, firms here are able to insist on somewhat higher educational credentials for their employees.
What adds to the value of the life sciences labor market in the Commonwealth are the high wages paid in this sector. As Table 9 reveals, based on an analysis of Census data, the average annual wage in the state’s
A concern that one might have about the employment generated by the life sciences super cluster is that the jobs created all go to the most educated workers in the state, leaving behind those who have not had the benefit of a college degree or post-graduate education. But based on the hiring records of a number of firms in the industry, it turns out that like other industries, life sciences firms need to hire workers who have a range of skills. In addition to Ph.D. scientists and other highly
FIGURE 15
Education Distribution—Life Sciences Cluster Pharma/Medical Devices/Diagnostics, Tools,
and Related Products and Services
Source: Dukakis Center for Urban and Regional Policy
Some college,no degree13%
Less than HS graduate4% HS graduate
8%Ph.D.16%
Professionaldegree
2%
M.A. / M.S.20%
B.A.32%
Less than B.A.: 30%
Associate Degree5%
TABLE 9
Estimated Annual Earnings for Life Sciences Workers (2006–2010)
Pharma Medical Devices Scientific R&D Total
Less than High School graduate $35,142 $51,685 $36,702
HS graduate $42,966 $33,250 $71,418 $44,225
Some college, no degree $62,745 $46,684 $61,816 $55,386
Associate’s degree $96,171 $61,400 $53,712 $61,285
Bachelor’s $95,147 $98,853 $85,080 $92,033
Master’s $102,851 $114,019 $102,045 $105,143
Professional school degree $150,264 $118,399 $182,999 $161,195
Doctorate $171,596 $249,332 $112,626 $134,195
Total $102,961 $78,498 $96,379 $91,805
Source: Dukakis Center Analysis of American Community Survey (Census) data
24128_Spectrum Text.indd 47 3/14/13 11:30 AM

48 U n d e r s t a n d i n g B o s t o n
The big question is whether Massachusetts can continue to lead the nation in the evolution of this critical indus-try or whether other regions of the country will be able to capture this industry and the jobs that go with it. Massachusetts was once the premier textile center of the nation until the south captured much of the industry in the early part of the 20th century. The Commonwealth led in the development of the commercial computer industry in the 1970s and 1980s with the growth of Digi-tal Equipment Corporation (DEC), Data General, Prime Computer, and Wang, but lost out to Silicon Valley in California and companies like Dell in Texas. Today, other states including New Jersey, California, New Mexico, Utah, and Minnesota are all vying to expand their life sciences clusters.The state’s concentration of globally prominent “eds and meds” has clearly been critical to the evolution of the life sciences in the Commonwealth.
One area where the MLSC might wish to pay more attention in the years to come is the medical-device industry. As noted earlier in this report, employment in this component of the life sciences cluster has been stag-nant. According to our interviews, other states includ-ing Indiana, Michigan and Minnesota are targeting this sector with state funding. Unlike Big Pharma, which can be more patient in the marketplace and worry less about cost pressures, medical-device firms need to move quickly in the market to commercialize their products and they need to be vigilant about reducing costs. To the extent that the MLSC can assist these firms, Massachu-setts could remain a center for this sector and employ-ment growth could ensue.
But overall, based on the state’s continued commitment to the life sciences, we fully expect to see further growth in the size of private-sector investments in the state’s life sciences industries and further increases in employment opportunity.
Assessment of the MLSC StaffThe interviews we carried out also suggested that the Center itself is being run quite effectively and efficiently and in a highly professional manner. Virtually all of our informants praised the management team and especially appreciated the leadership’s reliance on peer review and its refusal to permit political considerations to trump scientific merit. As one expert informant noted, the MLSC has “lots of moving parts” and all of them are working well and the Center remains responsive to
life sciences varies from $78,500 in medical devices to nearly $103,000 in the pharmaceutical industry.66 Those with a Ph.D. earn, on average, nearly $250,000 in the medical-device sector and well over $100,000 in other sectors within the cluster. But even those who have not completed high school average nearly $37,000 a year, the equivalent of more than $18.00 an hour. High school graduates average more than $44,000 and those with an associate’s degree, more than $61,000.
Compared with other industries, the life sciences provide some of the highest paying jobs in the Commonwealth. With an average annual salary of nearly $92,000, this sector rewards its workforce with higher pay than those who work in manufacturing as a whole, construction, real estate, education, government, health care, and transportation. The average salary in the life sciences industries in the Commonwealth exceeds the all-industry Massachusetts average by 68 percent.67
The Long-Term Impact of the Commonwealth’s Life Sciences InitiativeBased on all of the data we collected about the MLSC and its activities, the analysis we conducted on the expansion of the life sciences industries in the Common-wealth, and the information we gleaned from the interviews, our overall conclusion is that because of its unique comprehensive approach to an entire industry super cluster and its reliance on scientific peer-reviewed procedures for awarding grants, the Commonwealth has reaped a substantial return on its life sciences initia-tive investment. Moreover, given the number of firms that have been attracted to the state, in large measure because of the ecosystem the Center has helped nurture, the benefits from the state’s investment in this initiative are likely to pay off bountifully in the years to come.
Many of our informants for this report noted that by 2018, when the $1 billion Life Sciences Initiative sunsets, the state will still need an agency that encourages inno-vation among smaller life sciences firms. Innovation, they note, must be a continuous process for the region to remain prosperous. This will be particularly important as China, India, Singapore, and other foreign countries compete for a share of this expanding super cluster by offering massive incentives to life sciences start-ups.
24128_Spectrum Text.indd 48 3/14/13 11:30 AM

49L i f e S c i e n c e s I n n o v a t i o n a s a C a t a l y s t f o r E c o n o m i c D e v e l o p m e n t
industry needs, meeting deadlines, and staying focused on its mission. As another informant put it, with the reliance on the Scientific Advisory Board (SAB) to select awardees, “there is not an ounce of boondoggle in this agency.” In its report on creating fiscally sound state tax incentives, the Pew Center on the States singled out the Massachusetts Life Sciences Tax Incentive Program for its focus on annual cost controls and its reliance on scientific merit in making awards.68
Still another informant noted that the MLSC is success-ful because its leadership is committed to working “at the speed of business” and therefore has become a valued partner in the expansion of the industry.
24128_Spectrum Text.indd 49 3/14/13 11:30 AM

24128_Spectrum Text.indd 50 3/14/13 11:30 AM
51L i f e S c i e n c e s I n n o v a t i o n a s a C a t a l y s t f o r E c o n o m i c D e v e l o p m e n t
4. Helping fund workforce development efforts for critical industries as part of the mandate of the quasi-public helps assure a pipeline of skilled workers for the industry and this itself helps attract new firms to the region.
5. Taking a “portfolio” approach to the entire range of activities in the life sciences—from investments in small innovative firms to helping train the future workforce to underwriting infrastructure—helps sustain the “ecosystem,” undergirding a virtuous cycle of discovery, innovation, investment, and employment opportunity.
In the end, we applaud the Governor and the Legisla-ture for their foresight in creating the Massachusetts Life Sciences Center and the $1 billion Life Sciences Initia-tive. The structure put in place is fulfilling the goals set out in the original legislation and the Center’s leader-ship has continually assured that the structure works effectively and efficiently.
Conclusions
All of our research suggests that the state will benefit from fully funding the remaining five years of the initia-tive in order to maintain the lead the life sciences have established in the Commonwealth. This is particularly important as other states ramp up their investments in hopes of creating their own life-sciences ecosystems to entice the small and large firms Massachusetts has successfully attracted. California, Maryland, New Jersey, New York, Minnesota, and Florida are not resting on their laurels, but continue to spend state funds on their own life-sciences industries.
Over time, it should be possible for the Center to reach out to the private sector to help fund more of its initia-tives, as it has done with the Massachusetts Neurosci-ence Consortium. With the plethora of larger, profitable firms coming to the state to expand their operations, one could imagine the Center funding more of its intern-ships with private funds and having private firms contribute to other programs (STEM education, for example), allowing the Center to focus even more of its funding on accelerator loans and tax incentives for firms undertaking translational research.
We should also note that the success of the MLSC has lessons for other quasi-public entities in the Common-wealth. We can mention five of them here:
1. Long-term success in the use of tax incentives and business loans is most likely to occur when funds are focused on a cluster of firms and a set of technolo-gies in a given industry, helping to create an indus-trial ecosystem which can attract new companies to the state.
2. The use of expert panels to determine the awarding of loans assures that these funds will be well utilized. “Claw-back” provisions protect the taxpayers by requiring firms to repay funds advanced by the Commonwealth if they fail to meet hiring goals.
3. The focus on encouraging firms in their early-stage innovation activity is central to promoting economic growth and prosperity.
24128_Spectrum Text.indd 51 3/14/13 11:30 AM

24128_Spectrum Text.indd 52 3/14/13 11:30 AM
53L i f e S c i e n c e s I n n o v a t i o n a s a C a t a l y s t f o r E c o n o m i c D e v e l o p m e n t
Endnotes
Chapter One1. The Massachusetts Life Sciences Center, “About the Center,” www.masslifesciences.com/mission.html.
2. Massachusetts Life Sciences Center, Fiscal Year (FY) 2012 Annual Report, “Outpacing the Competition,” Cover Letter, September 28, 2012.
3. According to an analysis prepared by the Massachusetts Budget and Policy Center, the Commonwealth faces at least a $1.2 billion deficit in FY2014. This is based on current tax rates and expected spending. See Massachusetts Budget and Policy Center, “A Preview of the FY2014 Budget,” January 10, 2013.
4. Following on the early work of Stanley Surrey who served as Assistant Secretary of the U.S. Treasury for Tax Policy, the Congressional Budget and Impoundment Act of 1974 (CBA) defines tax expenditures as “those revenue losses attributable to provisions of the Federal tax laws which allow a special credit, a preferential rate of tax, or a deferral of tax liability.” See Stanley Surrey, Pathways to Tax Reform: The Concept of Tax Expenditures (Cambridge, MA.: Harvard University Press, 1974); U.S. Congress, Congressional Budget Act of 1974.
5. Joe Stephens and Carol D. Leonnig, “Solyndra: Politics Infused Obama Energy Program,” Washington Post, December 25, 2011.
6. Carol D. Leonnig, “Battery Firm backed by Federal Stimulus Money files for Bankruptcy,” Washington Post, October 16, 2012.
7. Jason Schwartz, “End Game,” Boston Magazine, August 2012.
8. The specific life sciences industry sectors used in this report are based on the non-agricultural 6-digit NAICS (North American Industry Classification System) as reported in the Battelle/Bio State Bioscience Industry Development 2012 Report produced jointly by the Battelle Institute, the Biotechnology Industry Organization (BIO), and MPM Public Affairs Consulting, Inc. (June 2012).
9. This set of NAICS industries omits perhaps 50 percent of the growth in life sciences jobs in Massachusetts because it omits life sciences in research in hospitals and universities. These jobs are not counted in the Battelle report because the NAICS industrial coding system cannot distinguish between research jobs in hospitals and other jobs in hospitals such as physicians and nurses, and life sciences research jobs in universities and other jobs such as English and social science professors.
10. It is important to note that because we could not break out faculty, staff, and students involved in the life sciences departments and research institutes from all others employed at universities and hospitals, this report does not include an analysis of the educational attainment, earnings, and occupations for those working in these institutions. Clearly, if we could have done this, our estimates of the number of those employed in the life sciences in Massachusetts would be much greater.
11. Massachusetts Biotechnology Council, “The Complete Guide to the 2012 New England Life Sciences Industry,” p. 4.
12. Jane G. Gravelle and Thomas L. Hungerford, “The Challenge of Individual Income Tax Reform: An Economic Analysis of Tax Base Broadening,” Congressional Research Service, 7-5700, March 22, 2012.
24128_Spectrum Text.indd 53 3/14/13 11:30 AM

54 U n d e r s t a n d i n g B o s t o n
Chapter Two13. The largest of these include the exclusion from taxable income of employer contributions for medical insurance premiums and medical care; the net exclusion of contributions to 401(k) pension plans, Individual Retirement Accounts (IRAs), and Keogh plans; the deductibility of home mortgage interest on owner-occupied homes, the deductibility of charitable contributions, and the preferential tax rates on long-term capital gains.
14. Tad DeHaven, “Corporate Welfare in the Federal Budget,” Policy Analysis No. 703, Cato Institute, July 25, 2012.
15. Ibid., Table 1, pp. 3–5.
16. See Louise Story, Tiff Fehr and Derek Watkins “As Companies Seek Tax Deals, Governments Pay High Price,” New York Times, December 1, 2012, p. 1; “Lines Blur as Texas Gives Industries a Bonanza,” New York Times, December 2, p. 2; “Michigan Town Woos Hollywood, but End Up with a Bit Part,” New York Times, December 3, p. 1.
17. MA Film Office, “Mass Film Tax Credit by the Numbers,” http://www.mafilm.org/mass-film-tax-credit-by-the-numbers
Chapter Three18. Robert Pollin and Dean Baker, “Public Investment, Industrial Policy and U.S. Economic Renewal,” Center for Economic and Policy Research, Working Paper Series Number 211, December 2009, p. 2.
19. DeHaven, op. cit., p. 6.
20. DeHaven, op.cit., p. 6
21. Pollin and Baker, op. cit., p. 3
22. Barry Bluestone and Bennett Harrison, Growing Prosperity: The Battle for Growth with Equity in the 21st Century (New York: Houghton Mifflin Company and The Century Foundation, 2000), p. 207.
23. Bluestone and Harrison, op. cit., p. 207.
24. Paul Romer, “The Origins of Endogenous Growth,” Journal of Economic Perspectives, Vol. 8, No. 1 (Winter 1994).
25. Bluestone and Harrison, op. cit., p. 210.
26. See Jeremy Greenwood, “The Third Industrial Revolution,” Paper prepared for the American Enterprise Institute, October 25, 1996.
27. See B. Jovenovic and S. Lach, “Product Innovation and the Business Cycle,” International Economic Review, February 1997.
28. See a series of papers by Erik Brynjolfsson and Lorin M. Hitt including “Computers and Productivity Growth: Firm-Level Experience,” MIT Sloan School of Management, January 1997; “Information Technology as a Factor of Production: The Role of Differences among Firms,” Economics of Innovation and New Technology, Vol. 3, No. 4 (1995); and “Paradox Lost: Firm-Level Evidence on the Returns to Information Systems Spending,” Management Science, Vol. 42, No. 4 (April 1996).
29. Battelle Institute, “2012 Global R&D Funding Forecast,” R&D Magazine, December, 2011.
30. Battelle Institute, op.cit, p 6.
31. Bluestone and Harrison, op.cit., p. 216.
32. Ben S. Bernanke, “Promoting Research and Development: The Government’s Role,” Remarks before the Conference on New Building Blocks for Jobs and Economic Growth,” Washington, D.C., May 16, 2011.
33. See Martin Bailey, “Trends in Productivity Growth,” in Jeffrey C. Fuhrer and Jane Sneddon (eds.), Technology and Growth: Conference Proceedings, Federal Reserve Bank of Boston, Conference Series No. 40, June 1996.
24128_Spectrum Text.indd 54 3/14/13 11:30 AM

55L i f e S c i e n c e s I n n o v a t i o n a s a C a t a l y s t f o r E c o n o m i c D e v e l o p m e n t
34. Matt Hourihan, “The Federal R&D Budget: Process and Perspectives,” Presentation before the AAAS Leadership Seminar in Science and Technology Policy, American Association for the Advancement of Science, November 12, 2012.
35. MassBio “Biopharma Industry Snapshot, 2012,” p. 22 based on data from the National Institutes of Health and the U.S. Census.
36. Congressional Budget Office, “Federal Support for Research and Development,” June 2007.
37. National Science Board, Science and Engineering Indicators 2012 (Washington, D.C.: National Science Foundation, January 2012).
38. See Economic Geography Glossary, http://faculty.washington.edu/krumme/gloss/a.html.
39. Steven J. K. Walters, “Unions and the Decline of U.S. Cities, Cato Journal, Vol. 30, No. 1 (Winter 2010), p. 119.
40. For a fascinating history of Silicon Valley, see the three-part series on National Public Radio, The Birth of Silicon Valley produced by Laura Sydell. These include “A Rare Mix Created Silicon Valley’s Startup Culture” (April 4, 2012); “America’s Magnet for Innovation and Investments” (April 5, 2012); and “Intel Legends Moore and Grove: Making It Last” (April 6, 2012).
41. IEEE History Center, “A Brief History of the U.S. Federal Government and Innovation (Part III): World War II and Beyond (1945-1987) (Washington, D.C.: Institute of Electrical and Electronic Engineers, n.d.).
42. See National Research Council, Funding a Revolution: Government Support for Computing Research, (Washington, D.C. 1999), pp. 2–3.
Chapter Four43. This section is based on Mark R. Trusheim, Ernst R. Berndt, Fiona Murray, and Scott Stern, “American Entrepreneurial Chaos or Collaborative Industrial Policy: The Emergence of the Massachusetts Biotechnology Super-Cluster,” Contributed Paper for the 2nd Conference on Corporate R&D (European Commission, 2010).
44. Trustheim, Berndt, Murray, and Stern, op.cit., p. 13.
45. MassBio “Biopharma Industry Snapshot, 2012,” p. 23 based on MassBio membership reports and the Boston Business Journal Book of Lists, 2012.
46. See Greg Turner, “Boston is a Big Force in Pharma, Boston Herald, December 14, 2012.
47. Jones, Long LaSalle, “Life Sciences Cluster Report: Global 2011,” p. 16. Boston ranked #1 on each component of the composite score with the exception of venture capital funding where it ranked #2.
Chapter Five48. MassBio, “Massachusetts Life Sciences Incentives,” Fact Sheet, September 2012.
49. “Refundable” tax credits are payments made to a taxpayer by the Internal Revenue Service or the Commonwealth’s Department of Revenue. Such payments can offset other tax liabilities or in the case of no tax liability are a form of “negative” tax.
50. Massachusetts Life Sciences Center, Fiscal Year (FY) 2012 Annual Report, p. 4.
51. According to an MLSC memo to the Secretary of Administration and Finance, “The MLSC Tax Incentive Program has enforcement mechanisms, including strict monitoring and reporting requirements for recipient companies. Within 30 days of the end of each calendar year following the award, awardees are required to provide an annual report to the Center that permits the Center to determine whether the awardee’s job targets have been met. The statute provides for ‘clawback’ provisions for companies that are found not to be fulfilling their job creation commitments to the state. Companies that fail to achieve at least 70% of their job targets at the end of any annual reporting period are subject to an investigation to determine the cause of this ‘material variance.’” In cases where it is found that the company cannot meet its requirements, the Center
24128_Spectrum Text.indd 55 3/14/13 11:30 AM
56 U n d e r s t a n d i n g B o s t o n
notifies the Massachusetts Department of Revenue so that the department can initiate claw-back procedures to recover the tax value any award provided. If a company has met at least 70% of its goal, the Center may permit the company a second year to fully meet this requirement before notifying the DOR. See memo to Jay Gonzales, Secretary, Executive Office for Administration and Finance from Susan Windham-Bannister, President and CEO of the Massachusetts Life Sciences Center, August 27, 2012.
52. Massachusetts Life Sciences Center, Fiscal Year (FY) Annual Report, op. cit., p. 6.
53. UMass Donahue Institute, Growing Talent: Meeting the Evolving Needs of the Massachusetts Life Sciences Industry (Cambridge, MA.: Massachusetts Life Sciences Center and Massachusetts Biotechnology Council, 2008), p. 15.
54. U.S. Bureau of Statistics, Quarterly Census of Employment and Wages as reported in MassBio “Biopharma Industry Snapshot, 2012,” p. 4. These statistics are for NAICS Code 541711.
Chapter Seven55. See D.C. Denison, “Drugmakers, Mass. Form Consortium,” The Boston Globe, June 20, 2012, p. B1.
56. Pfizer: Science at our Core, “R&D Locations: Cambridge, MA.” http://www.pfizer.com/research/rd_works/ cambridge.jsp.
57. Pfizer: Science at our Core, op. cit.
58. See Jeanne Whalen and Mimosa Spencer, “Sanofi wins Long-Sought Biotech Deal,” Wall Street Journal, February 17, 2011.
As a case in point, on January 29th, 2013 Sanofi announced the launch of LeGoo, a biopolymer gel that allows surgeons to temporarily stop blood flow during surgery without the use of clamps, elastic loops or other conventional occlusion devices that may risk trauma to blood vessels. LeGoo was developed by Pluromed, a young company that was one of the first to receive a loan through the Center’s Accelerator Loan Program in 2009. The Accelerator Loan provided support for Pluromed at a critical stage in the development of LeGoo. Pluromed repaid its loan with interest to the Center following its acquisition by Sanofi.
59. See Michael B. Farrell, “Startup Funding Declines Across US,” The Boston Globe, January 18, 2013, p. B5.
60. Michael B. Farrell, “Startup Funding Declines Across US,” op. cit., p. B9.
61. See Greg Turner, “Boston is a Big Force in Pharma,” Boston Herald, December 13, 2012.
62. MassBio “Biopharma Industry Snapshot,” 2012, p. 9.
63. Greg Turner, “Boston is a Big Force in Pharma,” op.cit.
64. Monya Baker, “Texas Cancer Institute gets no Funds for new Grants in Proposed Budget,” Nature.com, January 16, 2013.
65. According to estimates prepared by the Mass DOR from recent annualized tax revenue data, state income tax revenues in the Commonwealth average 4.7% of wage and salary income and sales tax revenues average 48.7% of income tax revenues.
66. These estimates are based on data for 2010 from the American Community Survey (ACS).
67. See Barry Bluestone, et. al, Staying Power II: A Report Card on Manufacturing in Massachusetts 2012, Dukakis Center for Urban and Regional Policy, September 2012, Table 1.10, p. 32 based on data from the U.S. Bureau of Labor Statistics, Quarterly Census of Employment and Wages.
68. “Avoiding Blank Checks: Creating Fiscally Sound State Tax Incentives, Pew Center on the States, December 2012, Table 1, p. 5 and p. 14.
24128_Spectrum Text.indd 56 3/14/13 11:30 AM