life-time energy yield of pv modules - npl.co.uk · - degradation of pv modules - reliability and...
TRANSCRIPT
Life-time Energy Yield of PV Modules
Jiang Zhu, Ralph GottschalgApplied Photovoltaics Research Group
Centre for Renewable Energy Systems Technology (CREST)
Wolfson School of Mechanical, Electrical and Manufacturing Engineering
Loughborough University

Outline
• Key impact on life-time energy yield- degradation of PV modules- reliability and durability
• Power degradation ≠ energy degradation- stresses- device responses
• Need for LEP and ALET- modelling- accelerated testing
• Summary

‘Value’ of life-time energy yield
0.5
0.6
0.7
0.8
0.9
1
1.1
YieldVariability
• The generated kWh equate to income
• Variability in energy yield comes out as a ‘performance risk’
• Typical module energy related impacts• Rating: ~±3%
• Device specific Power-to-Energy: ~±5%
• Degradation: 0.1-3% per year (>30% over life-time)
• System effects may be more important but data not available
• Looking at these impacts: degradation poses the biggest risk

Reliability and warranties
• Graph to right: Literature
analysis of reported
degradation rates.
• PV warranties are sort of
linear (linear with
exception of first year)
• Everything below the line
is a warranty case.
• But no consideration of
how this gets there.
Warranty assumption
Clear impact on RoI: ~30% of
systems will fail
In terms of LEP: only relevant
until ‘legal dust’ settles

Importance of durability
• Durability is the shape of the degradation
• Considering three shapes • Exponential (decay)
• Linear (first order fatigue)
• Inverse exponential (multi-stage, activation)
• Simplified calculations for 20 years
• Difference is nearly ±7.5% on LTE
• Enough to change investment decisions!
0
0.2
0.4
0.6
0.8
1
1.2
0 5 10 15 20
Rela
tive P
ow
er
Lo
ss
Years of Operation
Exponential Ageing
Linear Ageing
Inverse Exponential Ageing
0.85
0.9
0.95
1
1.05
1.1
E L IRela
tive E
nerg
y
Gen
era
tio
n
Ageing shape
Beyond current certification
• Certification testing in power is currently being done to
enable the manufacturer to sell product
• The EPC thinks passing this is sufficient due diligence
• Financier mistakenly believes this ensures that the
modules (or any other component) will achieve the
promised lifetime/degradation warranties
• Not testing for life-time energy yield poses a significant
risk to the RoI for the owner – i.e. end user
Take-away
Degradation poses the biggest risk
Durability is important for user
(but not really the manufacturer)
Life-time energy prediction (LEP) should be done
as part of due diligence
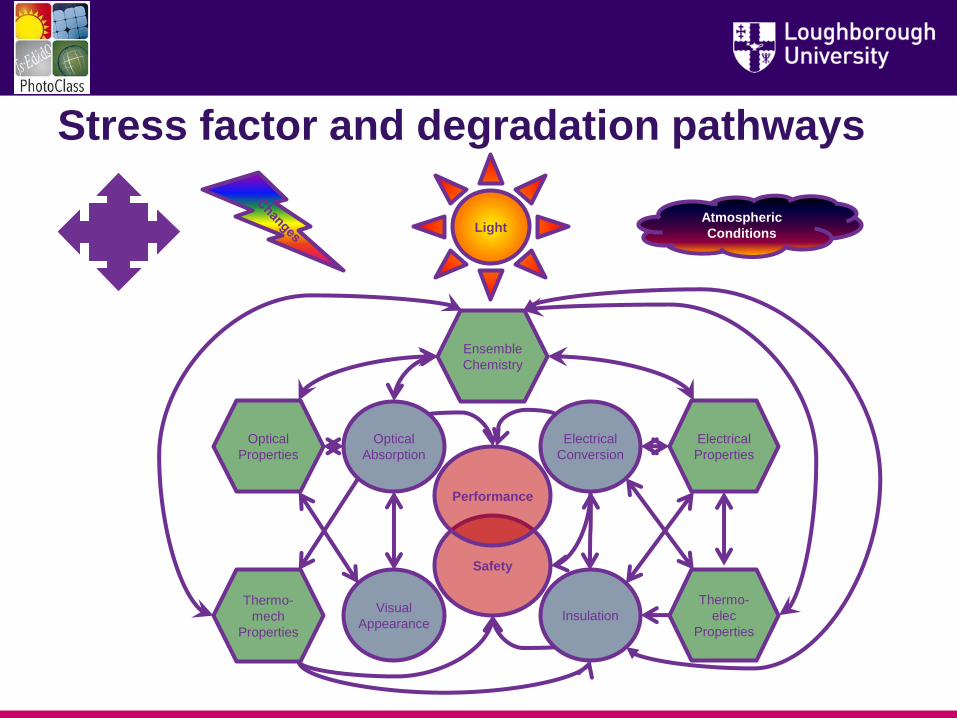
Stress factor and degradation pathways
Safety
Performance
InsulationVisual
Appearance
Optical
Absorption
Electrical
Conversion
Electrical
Properties
Optical
Properties
Ensemble
Chemistry
Thermo-
elec
Properties
Thermo-
mech
Properties
Atmospheric
ConditionsLightElectri
c field

Impact of degradation on power
0 5 10 15 20 25 30-5
-4.5
-4
-3.5
-3
-2.5
-2
-1.5
-1
-0.5
0
V (V)
I (A
)
0 5 10 15 20 25 30-5
-4.5
-4
-3.5
-3
-2.5
-2
-1.5
-1
-0.5
0
V (V)
I (A
)
0 5 10 15 20 25 30-5
-4.5
-4
-3.5
-3
-2.5
-2
-1.5
-1
-0.5
0
V (V)
I (A
)
0 5 10 15 20 25 30-5
-4.5
-4
-3.5
-3
-2.5
-2
-1.5
-1
-0.5
0
V (V)
I (A
)
Degradation in Isc Degradation in Rs
Degradation in Rp Degradation in Voc
Degradation in Isc (photocurrent)
Browning
cracking
Degradation in shunt resistance
PID
Hot spots
Pressure (flexible)
Degradation in series resistance
Corrosion
Loss of contacts
Degradation in Voc (diode)
Chemical changes
PID
Impurities
• Different degradation mechanisms affect behaviour differently
• Same 20% power loss, but different degradation modes

Impact of degradation on energy
Isc Rs
RpVoc
• Same 20% power loss, but different degradation modes
• Different impact at different G-T levels

Example: Significant different energy yields
Temperate climateTropical climate
• Module dependent
• Site dependent
Tropical Location Temperate
-20% PMPP -20%
-17.60% RS -8.30%
-27.10% RP -53.30%
-20.20% IPH -20.40%
-23.60% Diode -21.10%
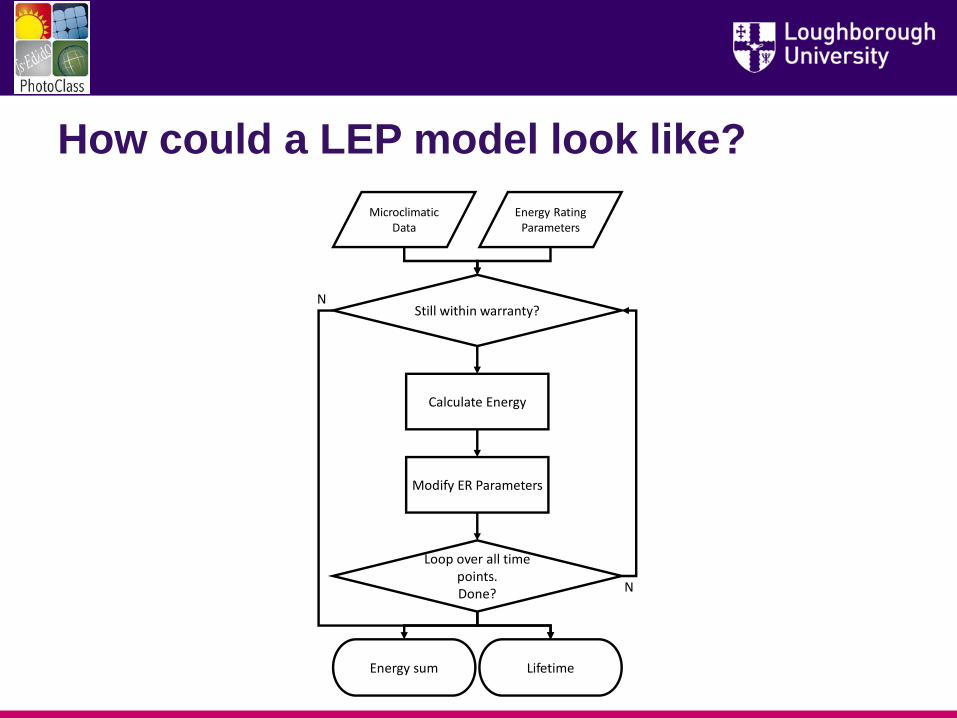
How could a LEP model look like?
Microclimatic Data
Energy Rating Parameters
Loop over all time points.Done?
Calculate Energy
Modify ER Parameters
Still within warranty?
Energy sum Lifetime
N
N
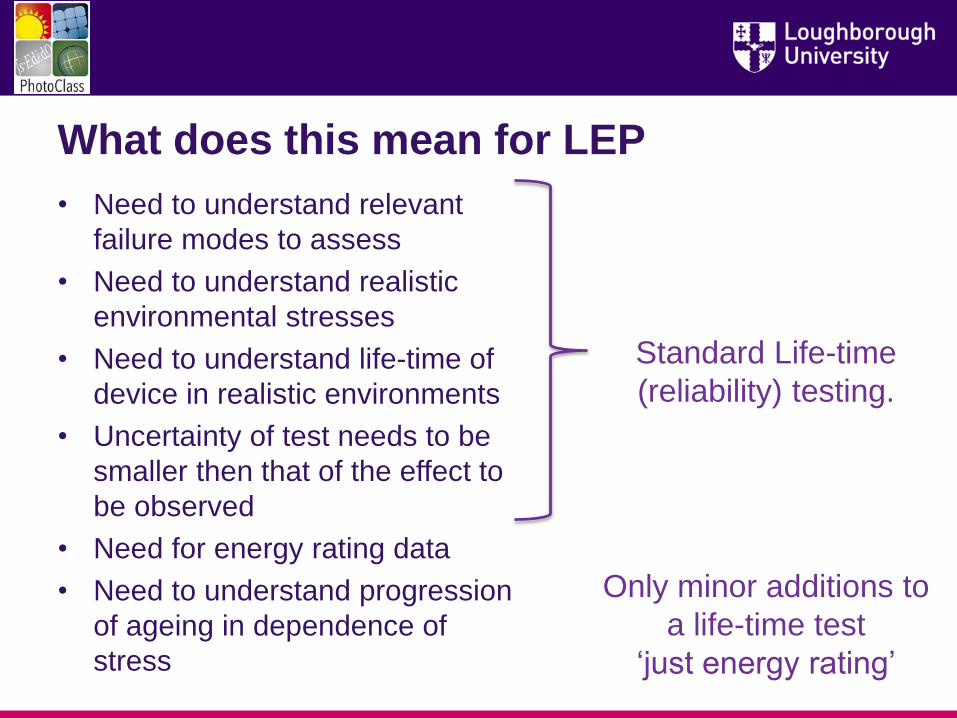
What does this mean for LEP
• Need to understand relevant
failure modes to assess
• Need to understand realistic
environmental stresses
• Need to understand life-time of
device in realistic environments
• Uncertainty of test needs to be
smaller then that of the effect to
be observed
• Need for energy rating data
• Need to understand progression
of ageing in dependence of
stress
Standard Life-time
(reliability) testing.
Only minor additions to
a life-time test
‘just energy rating’

ALET - drive same mechanism and reduce
uncertainty
• Testing needs to be in an acceptable time
frame
- ‘real life testing’ does not work
- testing uncertainty lowers with increasing
testing time
• Acceleration-Greed results in more
expensive tests as the wrong failure mode
may be accelerated
• Appropriate number of testing samples
- current testing of two repeats tends to
underestimate failure rate
• Compromise: acceleration – uncertainty –
sample number0%
5%
10%
15%
20%
25%
30%
35%
10% 15% 20% 25% 30% 35% 40%
Pro
ba
bilit
y o
f fa
ilin
g a
ce
rtif
ica
tio
n t
es
t
Sample failure rate of distribution
testing: 2 samplesfail: one failure after retesting
Adhesive and cohesive failure

Progression of degradation
• Energy modelling requires • Irradiance and temperature response
appropriate for the model used
• Potentially changes in SR, AoI and Tmod if relevant
• The specifics of energy modelling measurements need to match up specifics of the model used. However, IEC61853 delivers data which allows extraction for all models available.
• LEP requires the same for a given time point (i.e. the current state of the device)
• ALET is thus a life-time test where an Energy Rating instead of a power rating is carried out at pre-set control points
Module temperature [oC]
Eff
ective irr
adia
nce [
W/m
2]
0.10.1
0.20.2
0.3
0.3 0.3 0.3
0.4
0.4 0.40.4
0.5
0.5 0.50.5
0.6
0.6 0.60.6
0.7
0.7 0.7 0.7
0.8
0.80.8
0.8
0.9
0.9
0.90.9
1
1
11
1
1.1
1.1
1.1
1.11.1
1.2
1.2
1.2
1.2
15 20 25 30 35 40 45 50 55 60
100
200
300
400
500
600
700
800
900
1000
1100
Module temperature [oC]
Eff
ective irr
adia
nce [
W/m
2]
0.10.10.10.2
0.2 0.2 0.2
0.3
0.3 0.3 0.3
0.4
0.4 0.40.4
0.5
0.5 0.50.5
0.6
0.6 0.6 0.6
0.7
0.7
0.7 0.7
0.8
0.8 0.80.8
0.8
0.8
0.9
0.9 0.9 0.9
0.9
0.9
1
11
1
1
1.1
1.1
1.1
1.1
1.2
1.2
1.2
1.2
15 20 25 30 35 40 45 50 55 60
100
200
300
400
500
600
700
800
900
1000
1100
1st year
5th year
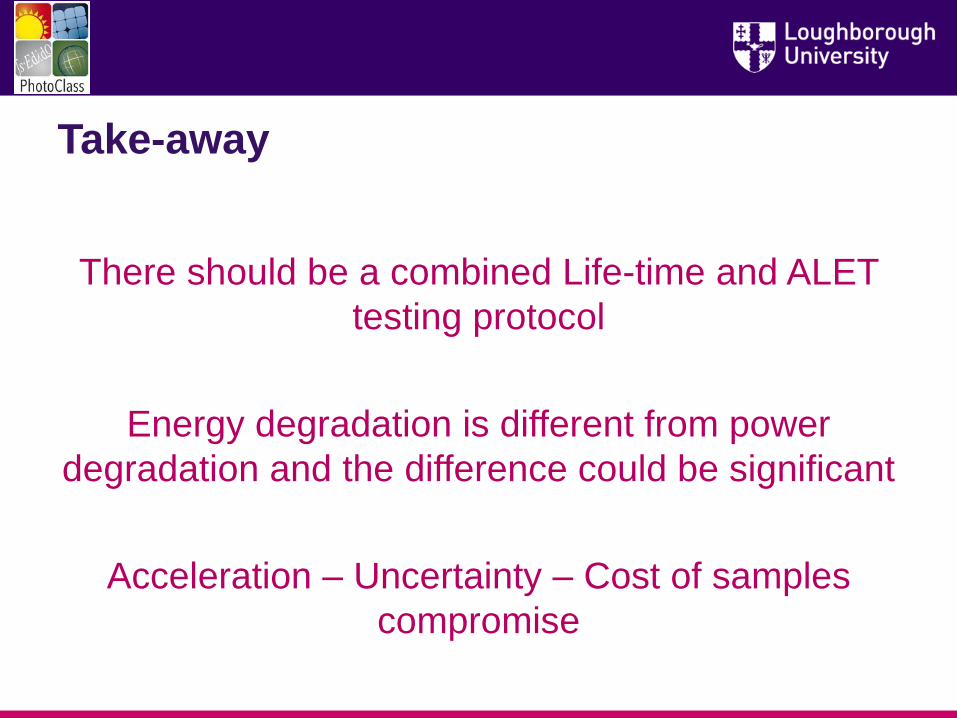
Take-away
There should be a combined Life-time and ALET
testing protocol
Energy degradation is different from power
degradation and the difference could be significant
Acceleration – Uncertainty – Cost of samples
compromise
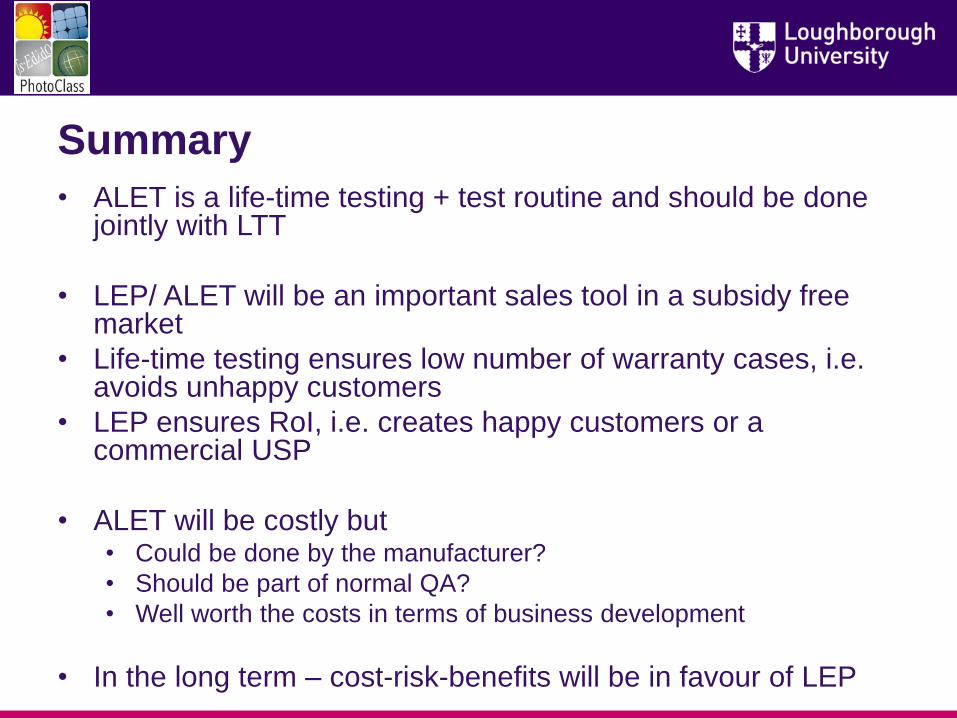
Summary
• ALET is a life-time testing + test routine and should be done jointly with LTT
• LEP/ ALET will be an important sales tool in a subsidy free market
• Life-time testing ensures low number of warranty cases, i.e. avoids unhappy customers
• LEP ensures RoI, i.e. creates happy customers or a commercial USP
• ALET will be costly but• Could be done by the manufacturer?
• Should be part of normal QA?
• Well worth the costs in terms of business development
• In the long term – cost-risk-benefits will be in favour of LEP

Thank you for your attention!