lifemode group: upscale avenues 2c pacific heightsdownloads.esri.com/esri_content_doc/dbl/us/... ·...
TRANSCRIPT

TAPESTRYSEGMENTATION
TM
esri.com/tapestry
Households: 889,400
Average Household Size: 3.17
Median Age: 42.7
Median Household Income: $93,300
LifeMode Group: Upscale Avenues
Pacific Heights
WHO ARE WE?Pacific Heights is one of the smaller markets (with less than 1 percent of households), composed of upscale neighborhoods in the urban periphery of metropolitan areas, along the Pacific Coast in California, in Hawaii, and in the Northeast. This market includes the highest percentage of Asian and multiracial populations; many of them born outside the US. This is a family market, distinguished by married-couple families, with and without children, some in multigenerational households. They own their homes, mainly high-priced single-family homes, with a higher proportion of town houses. Workers are generally employed in white collar occupations such as business, computer, architecture, and engineering roles. Median household income and net worth are much higher than the US. These trendy residents buy nice food and clothing, as well as the latest gadgets. They keep up with family overseas with frequent phone calls and foreign travel.
OUR NEIGHBORHOOD• These are diverse, densely populated neighborhoods in the urban periphery of metropolitan areas.
• Homes are primarily owner occupied and older, most built 1950–1979 (57%).
• Two-thirds of homes are single family; 14% are townhouses (Index 244).
• Nearly 70% of owned homes are valued at over $500,000 (Index 492).
• Percentage of vacant housing units at 4.1% is one of the lowest (Index 36).
• About 61% of households are composed of married couple families, with or without children under 18 years, with a higher ratio of adult children living at home (Index 157).
• Two-thirds of households own 1 or 2 vehicles, but 28% own 3 or more (Index 141).
SOCIOECONOMIC TRAITS• Education completed: Over 67% of residents have some college education; 41% have a bachelor’s degree or higher (Index 131).
• Labor force participation rate is average at 62%; unemployment rate is lower at 4.1%.
• Salaries account for most of the household income among these professionals, but investment income adds to their affluence.
• Financially conservative, these consumers tend to opt for low-risk investments.
• They keep up-to-date with the latest styles and trends, as well as the latest technology.
Note: The Index represents the ratio of the segment rate to the US rate multiplied by 100. Consumer preferences are estimated from data by GfK MRI.
2C
TAPESTRYSEGMENTATION
TM
esri.com/tapestry
LifeMode Group: Upscale Avenues
Pacific Heights2C
85+80–8475–7970–7465–6960–6455–5950–5445–4940–4435–3930–3425–2920–2415–1910–14
5–9<5
8% 4% 0 4% 8%
Male Female
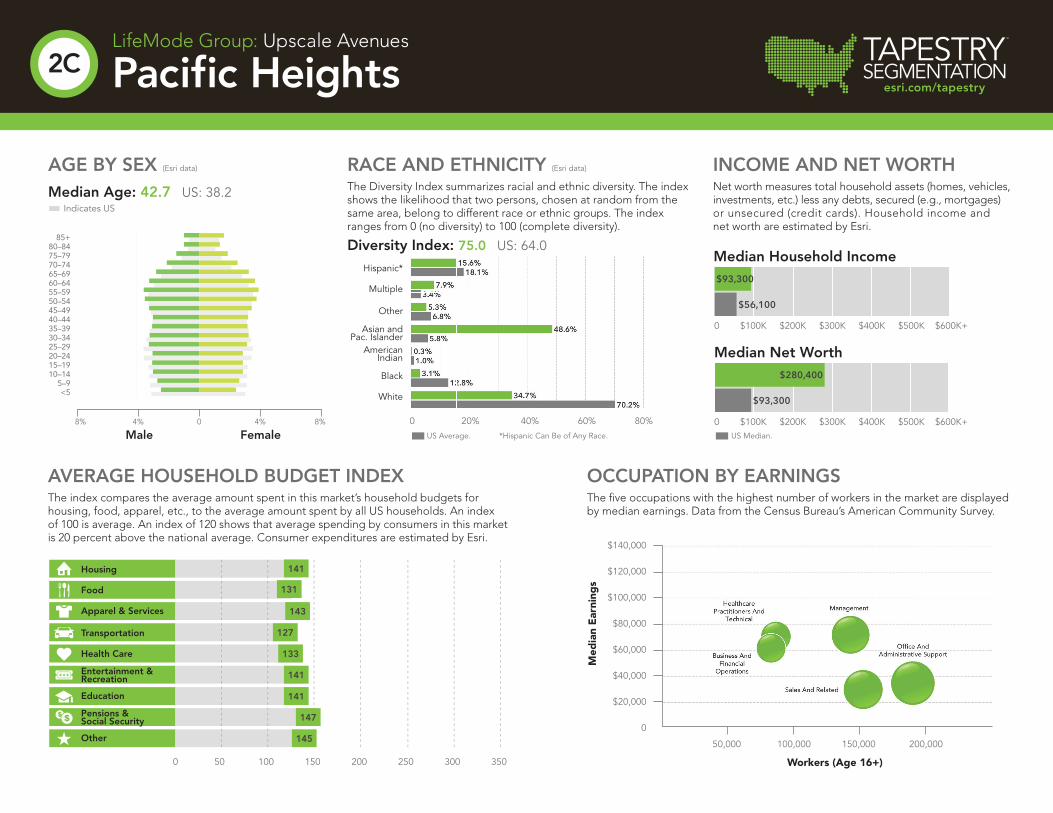
Median Household Income
Median Net Worth
$56,100
$93,300
$93,300
$280,400
$0 $100,000 $200,000 $300,000 $400,000 $500,000 $600,000
EsriMedianHHIncome
EsriMedianNetWorth
Series2 Series1
$56,100
$93,300
$93,300
$280,400
$0 $100,000 $200,000 $300,000 $400,000 $500,000 $600,000
EsriMedianHHIncome
EsriMedianNetWorth
Series2 Series1
Housing
Food
Apparel & Services
Transportation
Health Care
Entertainment &Recreation
Education
Pensions &Social Security
Other
!"!# $!"%# $&"!# $&"%#$'"!# $'"%# $("!# $("%# $)"!# $
!"#$%&'$%()*
!"#$%&'$%+),
!"#$%&'$%-()-*
!"#$%&'$%-+)-, $
!"#$%&'$%.().*
!"#$%&'$%.+)., $
!"#$%&'$%/()/*$
!"#$%&'$%/+)/, $
!"#$%&'$%*()**$
!"#$%&'$%*+)*, $
!"#$%&'$%+()+*$
!"#$%&'$%++)+, $
!"#$%&'$%0()0*$
!"#$%&'$%0+)0, $
!"#$%&'$%1()1*$
!"#$%&'$%1+)1, $
!"#$%&'$%2()2*$
!"#$%&'$%2+3
&'$%45%6$7%) !"#$
6$89$:. 6$89$:-
!"!# $ !"%# $ &"!# $ &"%#$ '"!# $ '"%# $ ("!# $ ("%# $ )"!# $ )"%# $
!"#$%"&'("&)*+
!"#$%"&'("&,*-
!"#$%"&'("&.) *.+
!"#$%"&'("&., *.-
!"#$%"&'("&/) */+
!"#$%"&'("&/, */-
!"#$%"&'("&0)*0+
!"#$%"&'("&0,*0-
!"#$%"&'("&+)*++
!"#$%"&'("&+,*+-
!"#$%"&'("&,) *,+
!"#$%"&'("&,, *,-
!"#$%"&'("&1)*1+
!"#$%"&'("&1,*1-
!"#$%"&'("&2)*2+
!"#$%"&'("&2,*2-
!"#$%"&'("&3)*3+
!"#$%"&'("&3,4
56$78&9:8%"
;"7:"</ ;"7:"<.
INCOME AND NET WORTHNet worth measures total household assets (homes, vehicles, investments, etc.) less any debts, secured (e.g., mortgages)or unsecured (credit cards). Household income andnet worth are estimated by Esri.
OCCUPATION BY EARNINGSThe fi ve occupations with the highest number of workers in the market are displayedby median earnings. Data from the Census Bureau’s American Community Survey.
AVERAGE HOUSEHOLD BUDGET INDEXThe index compares the average amount spent in this market’s household budgets for housing, food, apparel, etc., to the average amount spent by all US households. An indexof 100 is average. An index of 120 shows that average spending by consumers in this marketis 20 percent above the national average. Consumer expenditures are estimated by Esri.
AGE BY SEX (Esri data)
Median Age: 42.7 US: 38.2 Indicates US
RACE AND ETHNICITY (Esri data)
The Diversity Index summarizes racial and ethnic diversity. The index shows the likelihood that two persons, chosen at random from the same area, belong to different race or ethnic groups. The index ranges from 0 (no diversity) to 100 (complete diversity).
Diversity Index: 75.0 US: 64.0
Hispanic*
Multiple
Other
Asian andPac. Islander
AmericanIndian
Black
White
$140,000
$120,000
$100,000
$80,000
$60,000
$40,000
$20,000
0
50,000 20 100,000 40 150,000 60 200,000 0
*Hispanic Can Be of Any Race.
0 20% 40% 60% 80%
0 $100K $200K $300K $400K $500K $600K+
0 $100K $200K $300K $400K $500K $600K+US Average. US Median.
Med
ian
Ear
ning
s
Workers (Age 16+)0 50 100 150 200 250 300 350
141
131
143
127
133
141
141
147
145
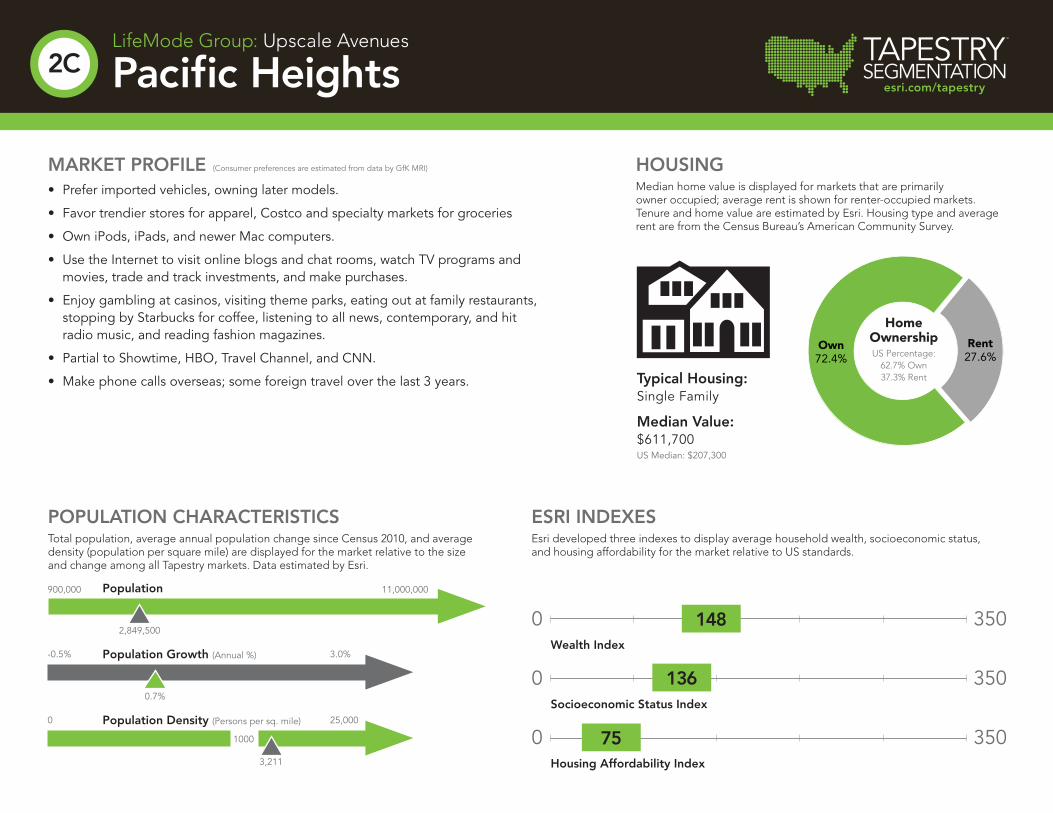
Own72.4%
Rent27.6%
ChartTitle
Own Rent
HomeOwnershipUS Percentage:
62.7% Own 37.3% Rent
Population
Population Growth (Annual %)
Population Density (Persons per sq. mile)
350
350
350
0
0
0
900,000
-0.5%
0
11,000,000
3.0%
25,000
2,849,500
0.7%
3,211
1000
Wealth Index
Socioeconomic Status Index
Housing Affordability Index
148
136
75
TAPESTRYSEGMENTATION
TM
esri.com/tapestry
MARKET PROFILE (Consumer preferences are estimated from data by GfK MRI)
• Prefer imported vehicles, owning later models.
• Favor trendier stores for apparel, Costco and specialty markets for groceries
• Own iPods, iPads, and newer Mac computers.
• Use the Internet to visit online blogs and chat rooms, watch TV programs and movies, trade and track investments, and make purchases.
• Enjoy gambling at casinos, visiting theme parks, eating out at family restaurants, stopping by Starbucks for coffee, listening to all news, contemporary, and hit radio music, and reading fashion magazines.
• Partial to Showtime, HBO, Travel Channel, and CNN.
• Make phone calls overseas; some foreign travel over the last 3 years.
ESRI INDEXESEsri developed three indexes to display average household wealth, socioeconomic status, and housing affordability for the market relative to US standards.
POPULATION CHARACTERISTICSTotal population, average annual population change since Census 2010, and average density (population per square mile) are displayed for the market relative to the size and change among all Tapestry markets. Data estimated by Esri.
LifeMode Group: Upscale Avenues
Pacific Heights2C
HOUSINGMedian home value is displayed for markets that are primarily owner occupied; average rent is shown for renter-occupied markets. Tenure and home value are estimated by Esri. Housing type and average rent are from the Census Bureau’s American Community Survey.
Typical Housing:Single Family
Median Value:$611,700US Median: $207,300

High
Low
TAPESTRYSEGMENTATION
TM
esri.com/tapestry
SEGMENT DENSITYThis map illustrates the density and distribution of the Pacific Heights Tapestry Segment by households.
LifeMode Group: Upscale Avenues
Pacific Heights2C
For more information1-800-447-9778
Copyright © 2020 Esri. All rights reserved. Esri, the Esri globe logo, Tapestry, @esri.com, and esri.com are trademarks, service marks, or registered marks of Esri in the United States, the European Community, or certain other jurisdictions. Other companies and products or services mentioned herein may be trademarks, service marks, or registered marks of their respective mark owners.
G826513ESRI2C1/20ms