lifetime income illustrations: preparing for participant
TRANSCRIPT

Josh Cohen, Managing Director, Head of Institutional Defined
Contribution, PGIM Institutional Relationship Group
Yanela Frias, President, Prudential Retirement
Summer 2021
Lifetime income illustrations:Preparing for participant reactions

Table of Contents
Introduction ..........................................................................................3
Calculating lifetime income disclosures .....................................................4
Observations .........................................................................................5
How much will income projections change year to year? ..............................7
Conclusion ......................................................................................... 14

With passage of the SECURE Act in late 2019, Congress sent a
message that defined contribution (DC) retirement savings plans
must do a better job of helping workers generate income throughout
their retirement years. A key component of that message was a
requirement that plans provide participants with a projection each
year illustrating how much lifetime income their account could
generate once they stop working.
These income illustrations will go a long way toward reframing the discussion around
DC plans from a singular savings goal to future retirement income. It also will send
participants looking for help with meeting their income goals.
In our last paper on the evolution of DC plans, “What Gets Measured, Gets Managed,”
we looked at why lifetime income disclosures will be a catalyst for evolving DC plans
into true retirement income plans. In this report, we take a deeper dive into lifetime
income illustrations. We look at how they must be calculated, and share a few
examples of how they might make retirement plan participants more aware of their
income challenges and opportunities. Finally, we share new survey data showing how
participants might react to their lifetime income projections.
3
Calculating lifetime income disclosures
In accordance with the SECURE Act, the Department of Labor issued an Interim
Final Rule in September 2020 spelling out how lifetime income disclosures must be
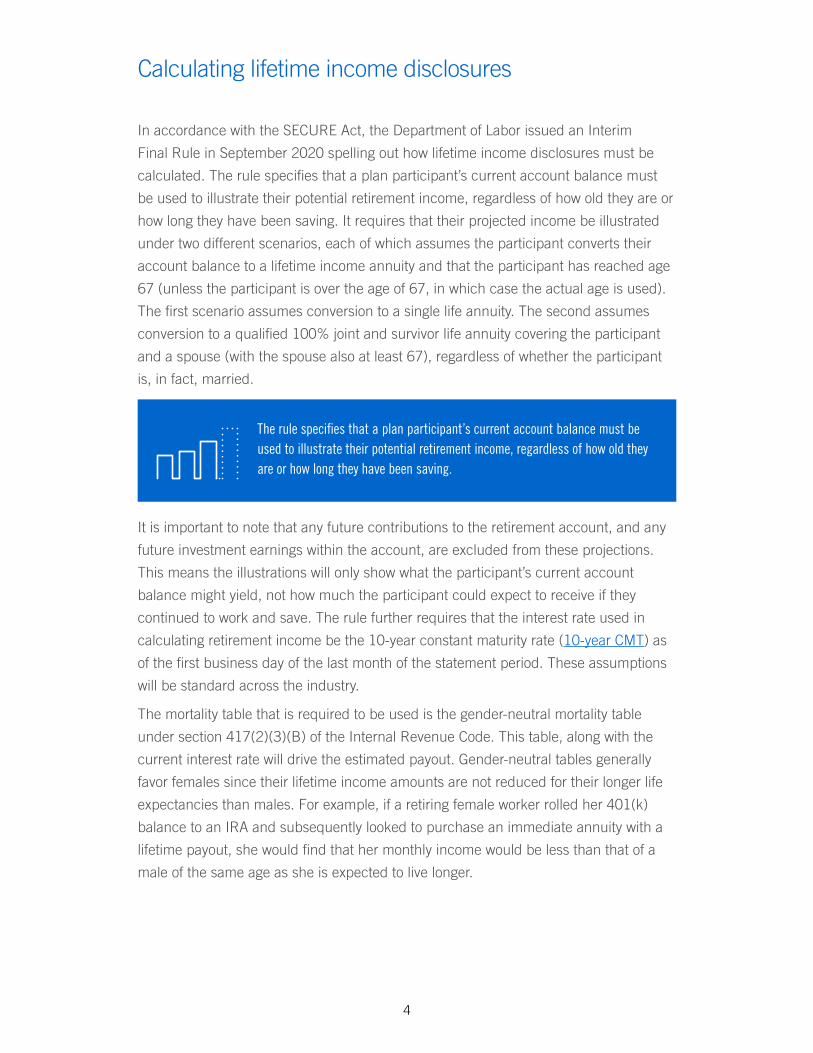
calculated. The rule specifies that a plan participant’s current account balance must
be used to illustrate their potential retirement income, regardless of how old they are or
how long they have been saving. It requires that their projected income be illustrated
under two different scenarios, each of which assumes the participant converts their
account balance to a lifetime income annuity and that the participant has reached age
67 (unless the participant is over the age of 67, in which case the actual age is used).
The first scenario assumes conversion to a single life annuity. The second assumes
conversion to a qualified 100% joint and survivor life annuity covering the participant
and a spouse (with the spouse also at least 67), regardless of whether the participant
is, in fact, married.
The rule specifies that a plan participant’s current account balance must be used to illustrate their potential retirement income, regardless of how old they are or how long they have been saving.
It is important to note that any future contributions to the retirement account, and any
future investment earnings within the account, are excluded from these projections.
This means the illustrations will only show what the participant’s current account
balance might yield, not how much the participant could expect to receive if they
continued to work and save. The rule further requires that the interest rate used in
calculating retirement income be the 10-year constant maturity rate (10-year CMT) as
of the first business day of the last month of the statement period. These assumptions
will be standard across the industry.
The mortality table that is required to be used is the gender-neutral mortality table
under section 417(2)(3)(B) of the Internal Revenue Code. This table, along with the
current interest rate will drive the estimated payout. Gender-neutral tables generally
favor females since their lifetime income amounts are not reduced for their longer life
expectancies than males. For example, if a retiring female worker rolled her 401(k)
balance to an IRA and subsequently looked to purchase an immediate annuity with a
lifetime payout, she would find that her monthly income would be less than that of a
male of the same age as she is expected to live longer.
4
Observations
Under the DOL rule, lifetime income illustrations will effectively provide a snapshot of
where participants are at that moment, as if they were retiring at that time. Because
the projections will not account for future contributions or investment earnings,
the illustrations will greatly underrepresent future retirement income for most plan
participants other than those very near retirement. Many of these participants will
need more information to help them assess whether they are on track to meet their
retirement income goals. They will want to know what steps they can take to get
on track if they have fallen behind, and how to allocate their plan assets given their
personal funding level.
Participants who are nearing retirement, meanwhile, may become conditioned to
the idea of living on the illustrated monthly benefit, only to be disappointed later.
Why? The illustration is a single number that assumes they annuitize their entire DC
account balance when they retire. This approach will generally produce a number
higher than what participants will be able to prudently withdraw from their accounts
without annuitizing, assuming they don’t want to dramatically increase the risk of
outliving their savings. In addition to adjusting to a lower level of retirement income,
these participants will have to recognize that they are effectively self-insuring against
longevity risk.
With momentous financial decisions to be made, participants will be looking for help with figuring out how to achieve their illustrated monthly income amount.
They’ll also need help understanding the tradeoffs they’ll be making depending on
which approach to lifetime income they choose: drawing down money on their own
and hoping it will last, or annuitizing.
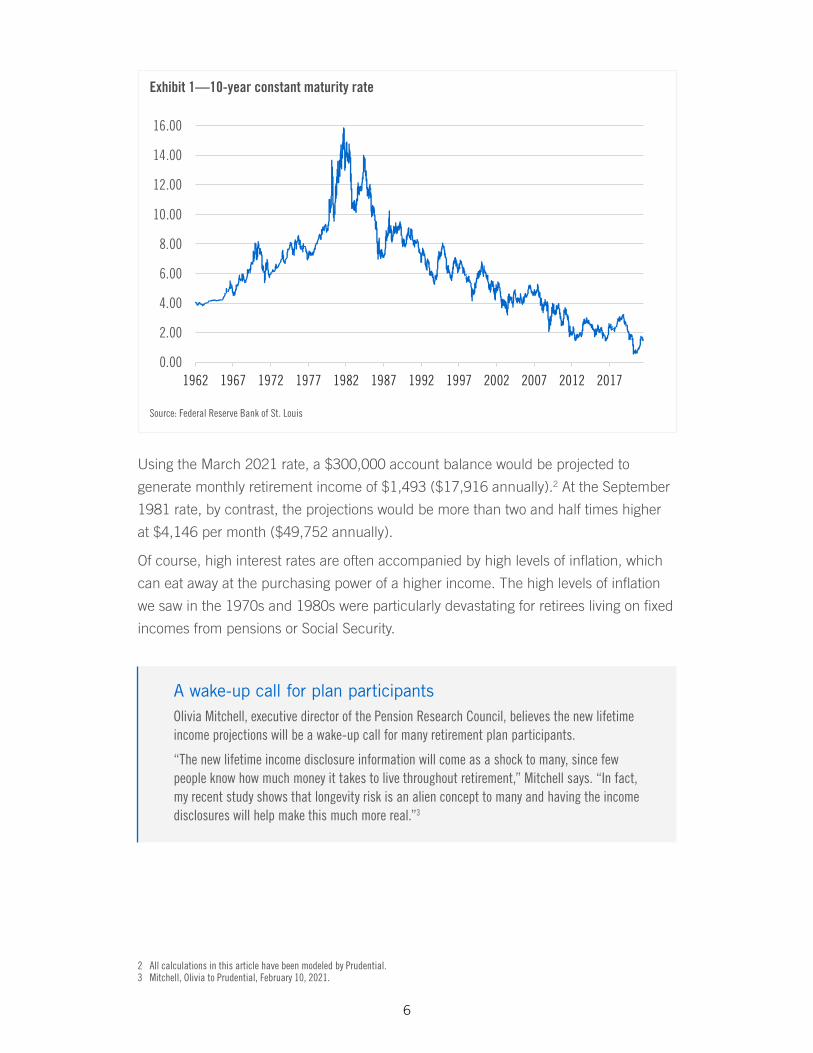
The 10-year CMT rate will play an important role in income projections and the degree
to which they fluctuate over time. The higher the rate, the larger projections will be,
everything else being constant. As of March 1, 2021, the CMT rate was 1.45%.1 But its
record high was 15.84% set in September 1981.
1 U.S. Department of Treasury, March 2021, https://www.treasury.gov/resource-center/data-chart-center/interest-rates/pages/textview.aspx?data=yield
5
0.00
2.00
4.00
6.00
8.00
10.00
12.00
14.00
16.00
1962 1967 1972 1977 1982 1987 1992 1997 2002 2007 2012 2017
Exhibit 1—10-year constant maturity rate
Source: Federal Reserve Bank of St. Louis
Using the March 2021 rate, a $300,000 account balance would be projected to
generate monthly retirement income of $1,493 ($17,916 annually).2 At the September
1981 rate, by contrast, the projections would be more than two and half times higher
at $4,146 per month ($49,752 annually).
Of course, high interest rates are often accompanied by high levels of inflation, which
can eat away at the purchasing power of a higher income. The high levels of inflation
we saw in the 1970s and 1980s were particularly devastating for retirees living on fixed
incomes from pensions or Social Security.
A wake-up call for plan participantsOlivia Mitchell, executive director of the Pension Research Council, believes the new lifetime income projections will be a wake-up call for many retirement plan participants.
“The new lifetime income disclosure information will come as a shock to many, since few people know how much money it takes to live throughout retirement,” Mitchell says. “In fact, my recent study shows that longevity risk is an alien concept to many and having the income disclosures will help make this much more real.”3
2 All calculations in this article have been modeled by Prudential.3 Mitchell, Olivia to Prudential, February 10, 2021.
6

How much will income projections change year to year?
Changes in year-to-year income illustrations will vary in size depending not just upon the
course of interest rates but also on changes in how much participants contribute to their
plan and fluctuations in investment returns. In general, the smaller a person’s account
balance, the greater percentage change they could see. A new plan participant with
a year-one account balance of $1,000, for example, might see that it equates to $5 a
month in retirement income. But this participant could see a nearly five-fold increase in
their projection—to $25 a month—if their account balance increases to $5,000 in year
two (assuming the CMT rate remains unchanged).4
Since most plan participants will make ongoing contributions to their accounts, they are
likely to see their income projections grow over time. Even when financial markets stumble,
ongoing contributions may offset negative investment returns to some degree.
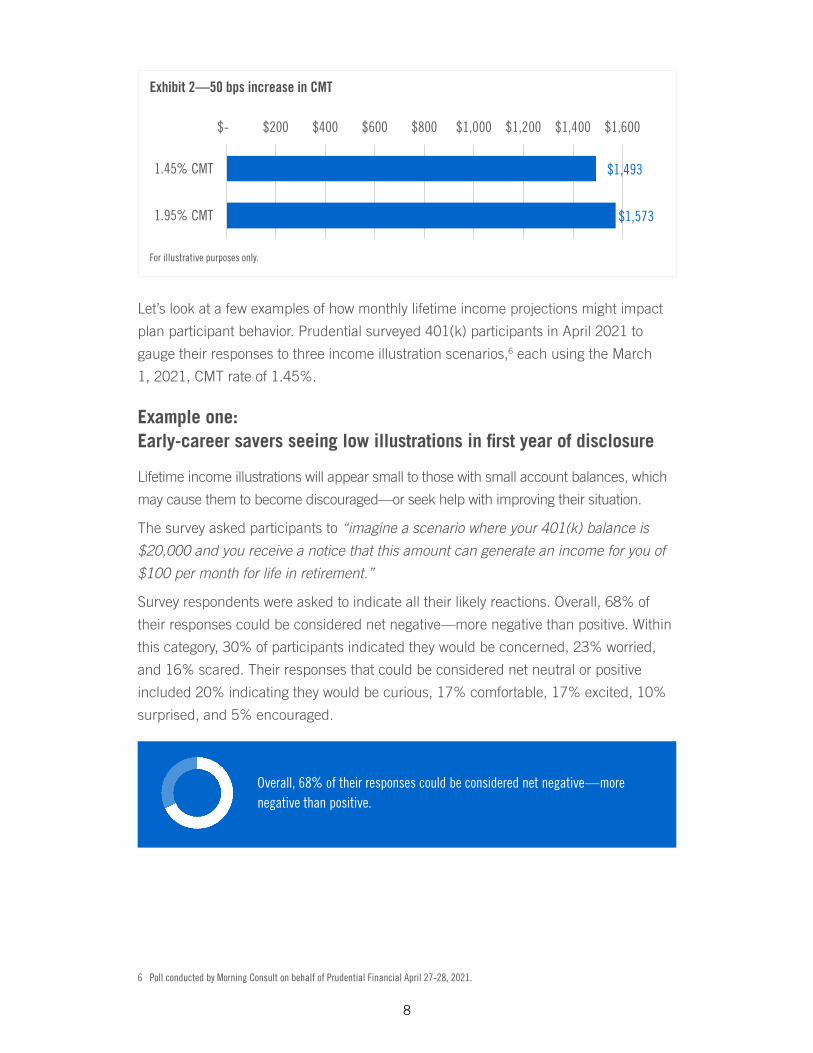
Year-over-year changes could be particularly pronounced when interest rates are
volatile. Over the last 30 years, the largest year-over-year change in the CMT rate
occurred in 1996 when it dropped to 5.60% from 7.88% a year earlier.5 When the
rate falls, it has a negative impact on projected monthly income, and when it rises the
effect is reversed. For a participant with a $300,000 account balance, for example,
an increase in the CMT of just half a percentage point, to 1.95% from 1.45%, would
increase their projected monthly income by $80 to $1,573, up from $1,493.
4 Based on a CMT of 1.45%, the rate as of March 1, 2021.5 Federal Reserve Bank of St. Louis, https://fred.stlouisfed.org.
7
$1,493
$1,573
$- $200 $400 $600 $800 $1,000 $1,200 $1,400 $1,600
1.45% CMT
1.95% CMT
Exhibit 2—50 bps increase in CMT
For illustrative purposes only.
Let’s look at a few examples of how monthly lifetime income projections might impact
plan participant behavior. Prudential surveyed 401(k) participants in April 2021 to
gauge their responses to three income illustration scenarios,6 each using the March
1, 2021, CMT rate of 1.45%.
Example one: Early-career savers seeing low illustrations in first year of disclosure
Lifetime income illustrations will appear small to those with small account balances, which
may cause them to become discouraged—or seek help with improving their situation.
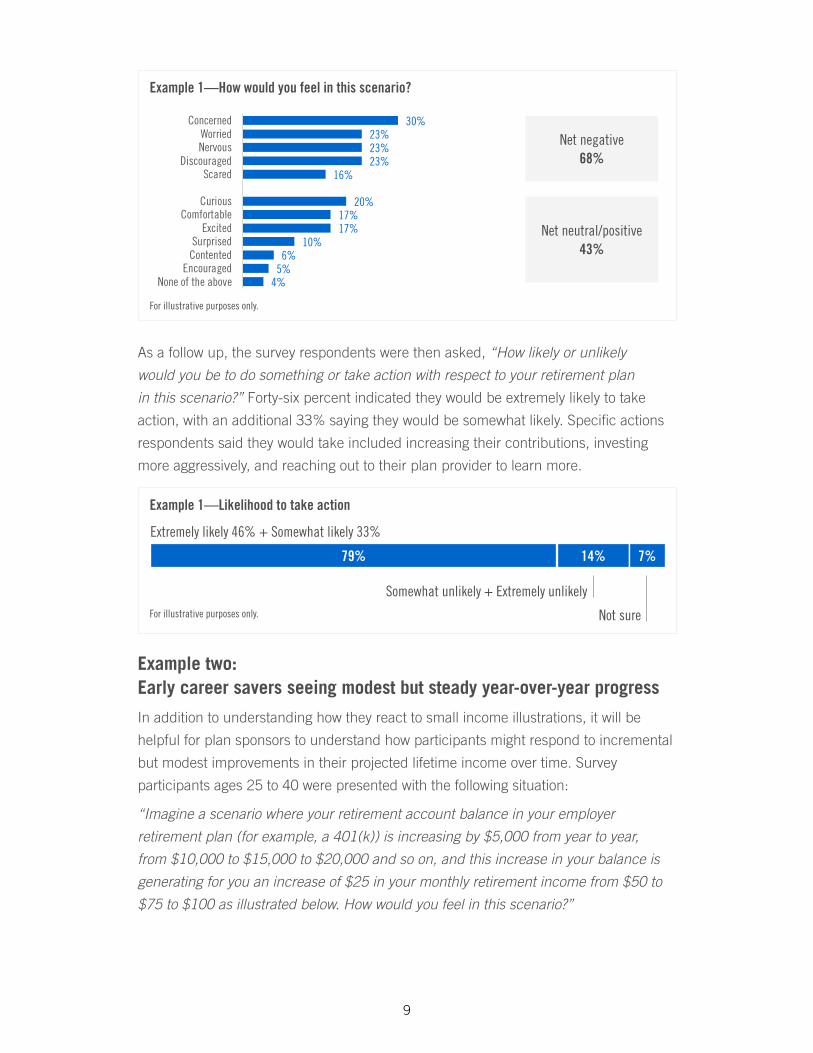
The survey asked participants to “imagine a scenario where your 401(k) balance is
$20,000 and you receive a notice that this amount can generate an income for you of
$100 per month for life in retirement.”
Survey respondents were asked to indicate all their likely reactions. Overall, 68% of
their responses could be considered net negative—more negative than positive. Within
this category, 30% of participants indicated they would be concerned, 23% worried,
and 16% scared. Their responses that could be considered net neutral or positive
included 20% indicating they would be curious, 17% comfortable, 17% excited, 10%
surprised, and 5% encouraged.
Overall, 68% of their responses could be considered net negative—more negative than positive.
6 Poll conducted by Morning Consult on behalf of Prudential Financial April 27-28, 2021.
8
30%23%23%23%
16%
20%17%17%
10%6%
5%4%
ConcernedWorriedNervous
DiscouragedScared
CuriousComfortable
ExcitedSurprised
ContentedEncouraged
None of the above
Net negative68%
Net neutral/positive43%
Example 1—How would you feel in this scenario?
For illustrative purposes only.
As a follow up, the survey respondents were then asked, “How likely or unlikely
would you be to do something or take action with respect to your retirement plan
in this scenario?” Forty-six percent indicated they would be extremely likely to take
action, with an additional 33% saying they would be somewhat likely. Specific actions
respondents said they would take included increasing their contributions, investing
more aggressively, and reaching out to their plan provider to learn more.
For illustrative purposes only.
Example 1—Likelihood to take action
79% 14% 7%
Extremely likely 46% + Somewhat likely 33%
Somewhat unlikely + Extremely unlikely
Not sure
Example two: Early career savers seeing modest but steady year-over-year progress
In addition to understanding how they react to small income illustrations, it will be
helpful for plan sponsors to understand how participants might respond to incremental
but modest improvements in their projected lifetime income over time. Survey
participants ages 25 to 40 were presented with the following situation:
“Imagine a scenario where your retirement account balance in your employer
retirement plan (for example, a 401(k)) is increasing by $5,000 from year to year,
from $10,000 to $15,000 to $20,000 and so on, and this increase in your balance is
generating for you an increase of $25 in your monthly retirement income from $50 to
$75 to $100 as illustrated below. How would you feel in this scenario?”
9
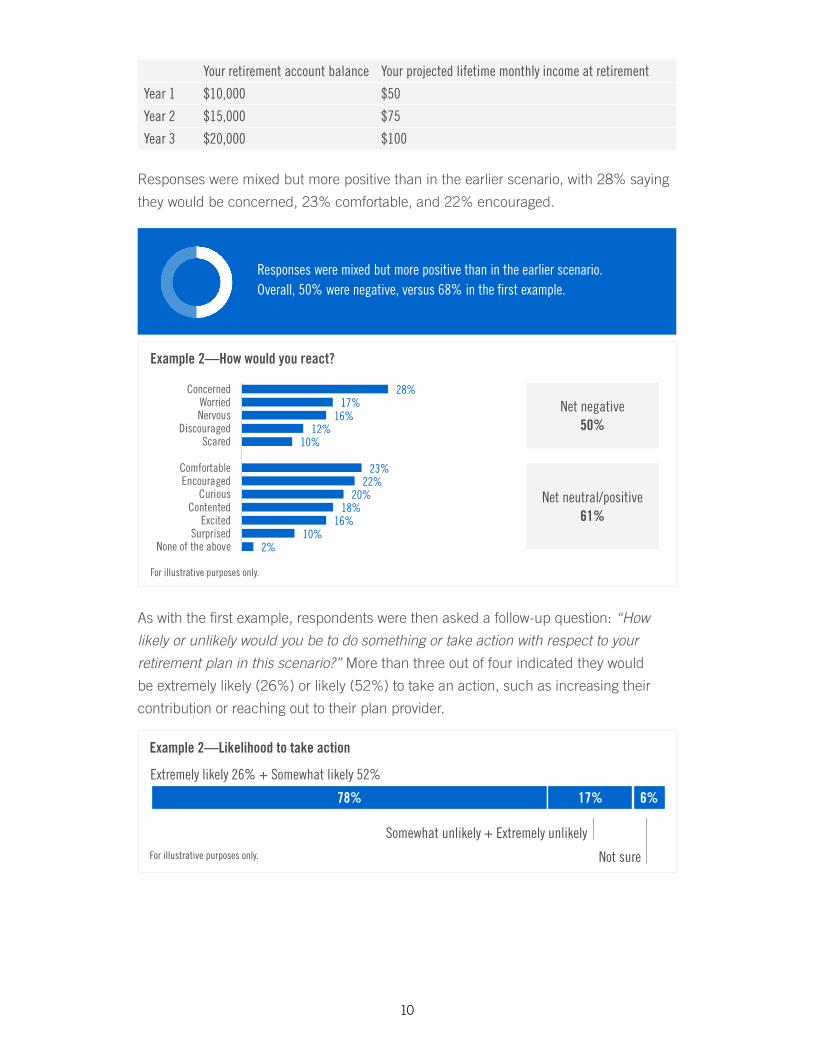
Your retirement account balance Your projected lifetime monthly income at retirement
Year 1 $10,000 $50
Year 2 $15,000 $75
Year 3 $20,000 $100
Responses were mixed but more positive than in the earlier scenario, with 28% saying
they would be concerned, 23% comfortable, and 22% encouraged.
Responses were mixed but more positive than in the earlier scenario. Overall, 50% were negative, versus 68% in the first example.
28%17%
16%12%
10%
23%22%
20%18%
16%10%
2%
ConcernedWorriedNervous
DiscouragedScared
ComfortableEncouraged
CuriousContented
ExcitedSurprised
None of the above
Net negative50%
Net neutral/positive61%
Example 2—How would you react?
For illustrative purposes only.
As with the first example, respondents were then asked a follow-up question: “How
likely or unlikely would you be to do something or take action with respect to your
retirement plan in this scenario?” More than three out of four indicated they would
be extremely likely (26%) or likely (52%) to take an action, such as increasing their
contribution or reaching out to their plan provider.
For illustrative purposes only.
Example 2—Likelihood to take action
78% 17% 6%
Extremely likely 26% + Somewhat likely 52%
Somewhat unlikely + Extremely unlikely
Not sure
10
Example three: Near retirees seeing projected income higher than actual income
Over time, we anticipate that DC plan participants will become accustomed to seeing
their account balance framed as monthly income. We also expect that some if not
most of them will come to see the illustrated amount as the amount they will actually
get in retirement. But as we’ve already noted, this figure assumes the participant’s full
account balance has been annuitized. In the real world, very few retirees annuitize
all their retirement assets. A much more popular approach to generating income is
to draw down retirement assets using a systematic “safe withdrawal rate”—a rate at
which, under most financial market scenarios, the investor will not outlive their assets.
The most commonly cited safe withdrawal rate is 4%, in which the investor withdraws
4% of their account balance in the first year of retirement, and then adjusts that
withdrawal amount annually for inflation in succeeding years.7
An initial withdrawal rate of 4% will typically generate less income than participants
would receive by annuitizing their account balance. To find out how pre-retirees
would feel about this discrepancy, the survey asked those with 401(k) balances under
$250,000 to consider the following scenario (pre-retirees with higher balances were
presented with a different set-up):
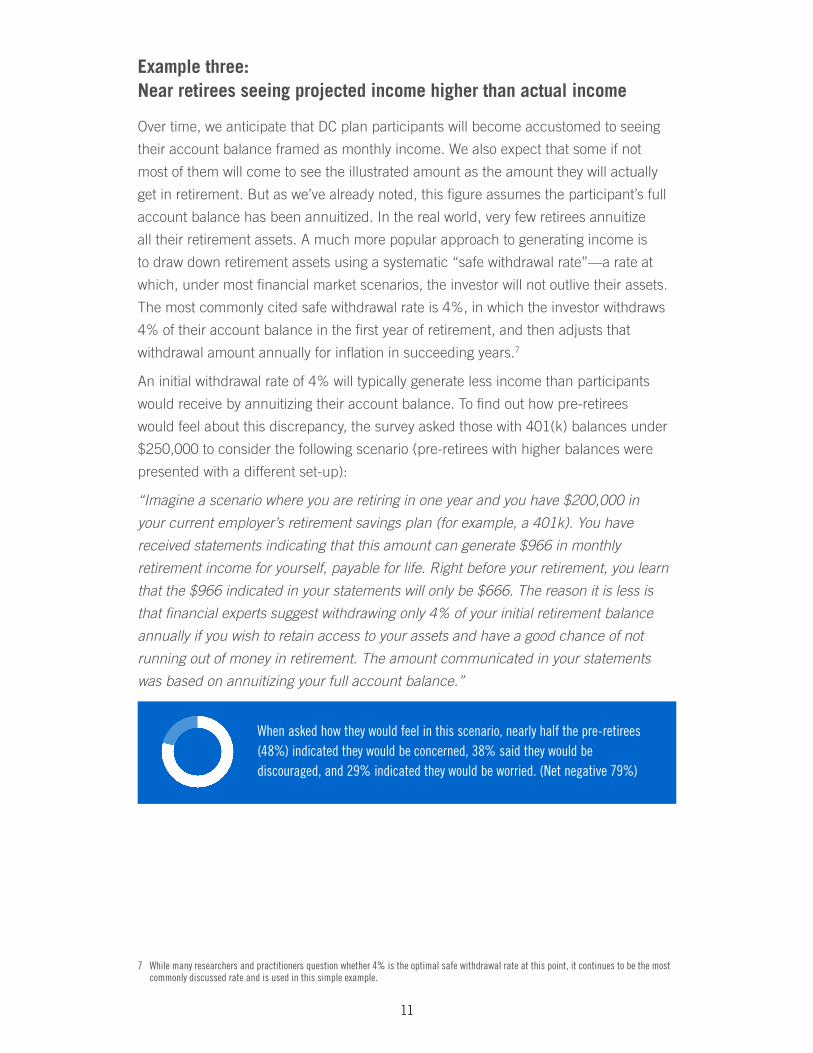
“Imagine a scenario where you are retiring in one year and you have $200,000 in
your current employer’s retirement savings plan (for example, a 401k). You have
received statements indicating that this amount can generate $966 in monthly
retirement income for yourself, payable for life. Right before your retirement, you learn
that the $966 indicated in your statements will only be $666. The reason it is less is
that financial experts suggest withdrawing only 4% of your initial retirement balance
annually if you wish to retain access to your assets and have a good chance of not
running out of money in retirement. The amount communicated in your statements
was based on annuitizing your full account balance.”
When asked how they would feel in this scenario, nearly half the pre-retirees (48%) indicated they would be concerned, 38% said they would be discouraged, and 29% indicated they would be worried. (Net negative 79%)
7 While many researchers and practitioners question whether 4% is the optimal safe withdrawal rate at this point, it continues to be the most commonly discussed rate and is used in this simple example.
11
48%38%
29%25%
14%
23%22%
5%3%
2%1%
5%
ConcernedDiscouraged
WorriedNervous
Scared
SurprisedCurious
ComfortableEncouraged
ContentedExcited
None of the above
Net negative79%
Net neutral/positive43%
Example 3—How would you react?
For illustrative purposes only.
When they were then asked whether they would take action in the scenario described
above, approximately three out of four said they would be extremely or somewhat likely
to do so.
For illustrative purposes only.
Example 3—Likelihood to take action, all pre-retirees w/ESRP (n=147)
74% 17% 9%
Extremely likely 36% + Somewhat likely 38%
Somewhat unlikely + Extremely unlikely
Not sure
When asked specifically what action they would take, more than 60% of respondents
said they would seek help from their plan provider, such as reaching out to learn more
and engaging with retirement planning tools and calculators.
12
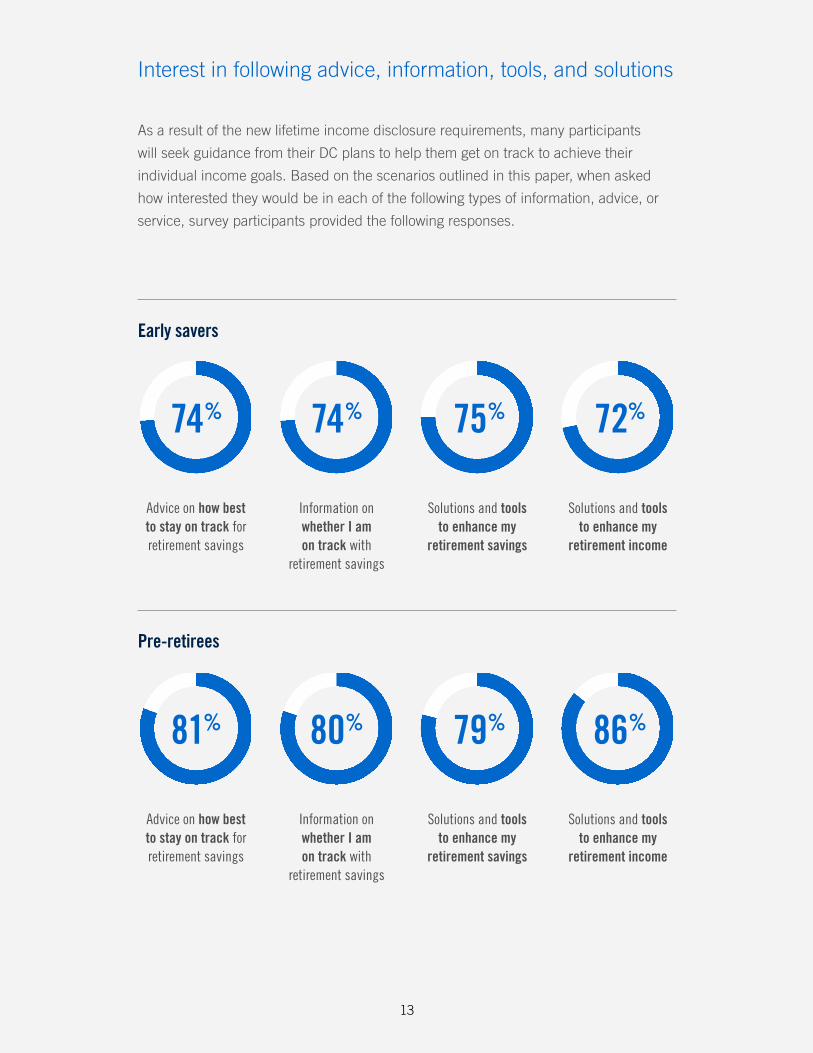
Interest in following advice, information, tools, and solutions
As a result of the new lifetime income disclosure requirements, many participants
will seek guidance from their DC plans to help them get on track to achieve their
individual income goals. Based on the scenarios outlined in this paper, when asked
how interested they would be in each of the following types of information, advice, or
service, survey participants provided the following responses.
Advice on how best to stay on track for retirement savings
Advice on how best to stay on track for retirement savings
Information on whether I am on track with
retirement savings
Information on whether I am on track with
retirement savings
Solutions and tools to enhance my
retirement savings
Solutions and tools to enhance my
retirement savings
Solutions and tools to enhance my
retirement income
Solutions and tools to enhance my
retirement income
Early savers
Pre-retirees
74%
81%
74%
80%
75%
79%
72%
86%
13
Conclusion
Lifetime income disclosures will be a great initial step to get plan participants to think
in terms of retirement income and not just in terms of building retirement savings. With
this increased awareness, many participants will look to their DC plans for additional
tools to help them get on track to their individual income goals. Driving behavioral
change is critical to helping those who are behind, get on track.
The survey results strongly indicate that many participants will be motivated to take
additional action to improve their projected lifetime income. This is a good result. This
also means it will be critical for participants to receive further advice and guidance
from plan sponsors so they can glean greater meaning as to what this retirement
income projection means in terms of whether they are on track.
Lifetime income disclosures will likely change how workers think about their DC plans.
However, like target-date funds, the disclosures treat everyone in a similar way. We
know that participants have different income needs, expenses, timing, and appetite for
risk. To address these needs, plan sponsors will need to evolve their DC plans across
several areas:
• Communications: Personalized and customized messaging will need to become
more front and center and include a focus on retirement income, especially as
workers approach their pre-retirement years.
• Education/Advice: Managed accounts, planning tools, and calculators will each
become more important as participants seek out guidance and need customized
solutions tailored to their situation.
• Investment Solutions: Participants will need investment solutions to help them
increase the probability of meeting the income projections they are shown and
manage the unique risks that generating lifetime income poses. Institutional
investments will continue to play a critical role in growing assets in a risk-controlled
manner, but additional non-guaranteed income solutions will be needed to manage
the payout and interest rate risk individuals face. In addition, guaranteed income will
be important to help manage longevity risk that these projections are assuming is
already built in.
• Financial Wellness: Financial wellness programs will increase in importance to
help participants improve their budgeting in order to save more as well as address
student loan and other types of debt.
At least now, thanks to the disclosure rule, attention will turn to lifetime income, a
transition that is long overdue. Accordingly, the income disclosures are likely to be a
large catalyst to evolve DC plans from savings plans to true retirement income plans.
14

15

This material is being provided for informational or educational purposes only and does not consider the investment objectives or financial situation of any client or prospective clients. The information is not intended as investment advice and is not a recommendation about managing or investing your retirement savings. If you would like information about your particular investment needs, please contact a financial professional.This material is intended to provide information only. This material is not intended as advice or recommendation about investing or managing your retirement savings. By sharing this information, Prudential Retirement is not acting as your fiduciary as defined by the Department of Labor or otherwise. If you need investment advice, please consult with a qualified professional.
Retirement products and services are provided by Prudential Retirement Insurance and Annuity Company (PRIAC), Hartford, CT or its affiliates. PRIAC is a Prudential Financial company.
© 2021 Prudential Financial, Inc. (PFI) and its related entities. Prudential Financial, Inc. of the United States is not affiliated in any manner with Prudential plc, incorporated in the United Kingdom or with Prudential Assurance Company, a subsidiary of M&G plc, incorporated in the United Kingdom. Prudential, the Prudential logo, and the Rock symbol are service marks of Prudential Financial, Inc., and its related entities, registered in many jurisdictions worldwide.
1049606-00001-00 NOT01_WP_RE13_01