liftoff app engagement index
TRANSCRIPT

100%
100%

Liftoff Mobile App Engagement Index Q1 2015 2
IntroductionMobile is an incredible space to work in these days. Mobile now
accounts for a staggering 52% of time spent with all digital media,
with 86% of this time spent in apps. And the trend isn’t slowing down
anytime soon. For the marketers, product managers, and engineers
who are a part of it, we get to see first hand how fast the space is
moving, and participate in building it.
But as a channel, mobile is young, lacking many benchmarks and
best practices to help guide our efforts. Even with a great mobile app,
building an active and profitable mobile user base is no small feat. And
with over 1.3 million apps to choose from, the challenge is very real,
requiring a significant investment of time and money into both paid and
organic user acquisition efforts.
The Liftoff Mobile App Engagement Index answers many key questions
about the impact of paid media on app engagement, setting cost-per-
engagement benchmarks and conversion rates for the most common
“post-install” events that users complete on mobile. Events measured
are first time events only and include registering, sharing content,
making a reservation (e.g. hotel, taxi, airline), making a purchase and
subscribing to a paid service.
The index also examines engagement within five different app
categories including Dating, Finance, Shopping, Social and Utilities.
New to the Index is a look at the impact of gender on mobile
engagement. Not surprisingly, differences do in fact exist amongst the
genders, just as they do between iOS and Android users.
The Index is based on an analysis of 22.5 million app installs and 550
million post-install events.

Liftoff Mobile App Engagement Index Q1 2015 3
HighlightsMobile advertisers spent an average $9.54 to acquire
a new registered user, consistent with the prior 3 months.
Social apps convert 76.3% of all installs into registered
users, followed by ecommerce apps (72.5%) and financial
apps (43.8%).
Non-transactional events cost less on Android than
iOS, including registering (42.2% less) and sharing content
(24.2% less), partly a reflection of the lower cost of mobile ad
inventory on Android.
Transactional events where users spend money cost less
on iOS than Android. Specifically, acquisition costs are
lower for users who make a reservation (6.8% less), make
a purchase (20.4% less), and subscribe to a service
(22.4% less).
Of users who install a dating app, 52% of men create an
account whereas only 41% of women do. And yet 31.6%
more women pay for a dating app subscription than men.
Of all mobile users who installed a shopping app, women
converted from install-to-purchase 30% more than men.
Women installed a social app and shared content nearly
40% more than men, and at a lower cost per first-time share
($7.74 vs. $10.52).
Liftoff Mobile App Engagement Index Q1 2015 3

Liftoff Mobile App Engagement Index Q1 2015 4
Mobile Engagement BenchmarksTo establish mobile CPA benchmarks, we calculated the cost to
acquire a new user from app install campaigns who engage in a
post-install event for the first time. Post-install events measured
include (1) register / create an account, (2) share content, (3) make a
reservation (e.g. airline, hotel, taxi, restaurant), (4) make a purchase,
and (5) subscribe to a paid service.
Similar to Q4 2014 CPA benchmarks, mobile events which occur
earlier in the funnel and do not require a financial transaction have by
far the lowest cost-per-action, like registration and sharing.
SubscribePurchaseReserveShareRegister
202.33
$
86.57
$
42.19
$
$23.14
9.54$
Companies spent an
average of $9.54 to
acquire a registered
user from mobile app
install ads.
Mobile CPA benchmarks are heavily influenced by several factors including volume of users, app install campaign targeting and optimization, ad creatives, app store rating and reviews, and the in-app experience.
Q1 2015 Mobile Cost per Action Index

Liftoff Mobile App Engagement Index Q1 2015 5
Average Costper Registration
The Registration Index measures the cost of acquiring a
registered mobile user from a paid app install campaign.
From Q4 2014 to Q1 2015, the monthly average cost
per registered user decreased by 5.9%, partly due to a
decrease in advertising spend and thus less competition in
mobile inventory following the holiday season.
Register: a user installs an app and creates an account.
$10
$12
$10.66
$9.98
$9.25$9.09
$9.58
$9.43
Oct-14 Nov-14 Dec-14 Jan-15 Feb-15 Mar-15
Mobile Indexes
Average Cost per Registration
Liftoff Mobile App Engagement Index Q1 2015 6
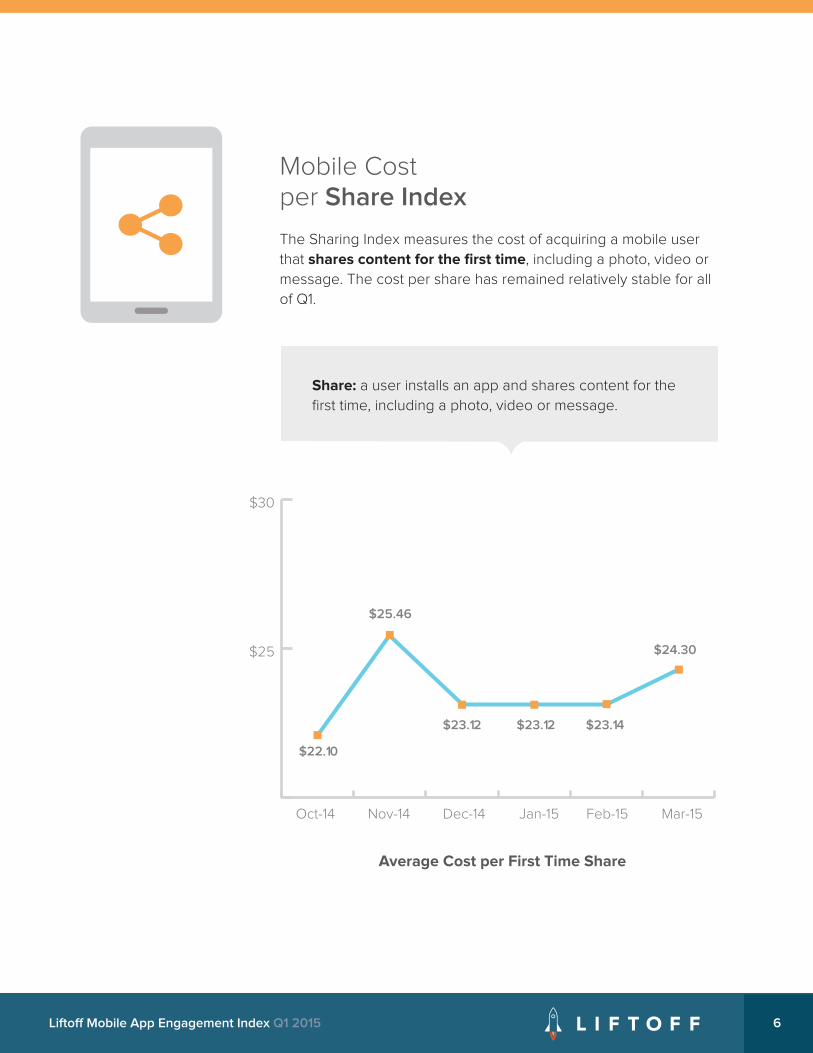
Mobile Costper Share Index
The Sharing Index measures the cost of acquiring a mobile user
that shares content for the first time, including a photo, video or
message. The cost per share has remained relatively stable for all
of Q1.
$25
$30
$25.46
$22.10
$23.12 $23.12 $23.14
$24.30
Oct-14 Nov-14 Dec-14 Jan-15 Feb-15 Mar-15
Average Cost per First Time Share
Share: a user installs an app and shares content for the
first time, including a photo, video or message.

Liftoff Mobile App Engagement Index Q1 2015 7
Mobile Costper Reservation Index
The Reservation Index measures the cost of acquiring a
mobile user that makes a reservation, a hotel room for
example. Between Q4 and Q1, 2015, the cost per reservation
increased by 20%. CPAs in Q4 were lower than usual due to
increased holiday travel bookings.
Reservation: a user installs an app and makes a
reservation, including airlines, hotels and taxis.
40
50
Oct-14 Nov-14 Dec-14 Jan-15 Feb-15 Mar-15
Cost per First Time Reservation
$37.10
$31.90
$34.10
$37.05
$39.52
$43.85
$
$
Liftoff Mobile App Engagement Index Q1 2015 8
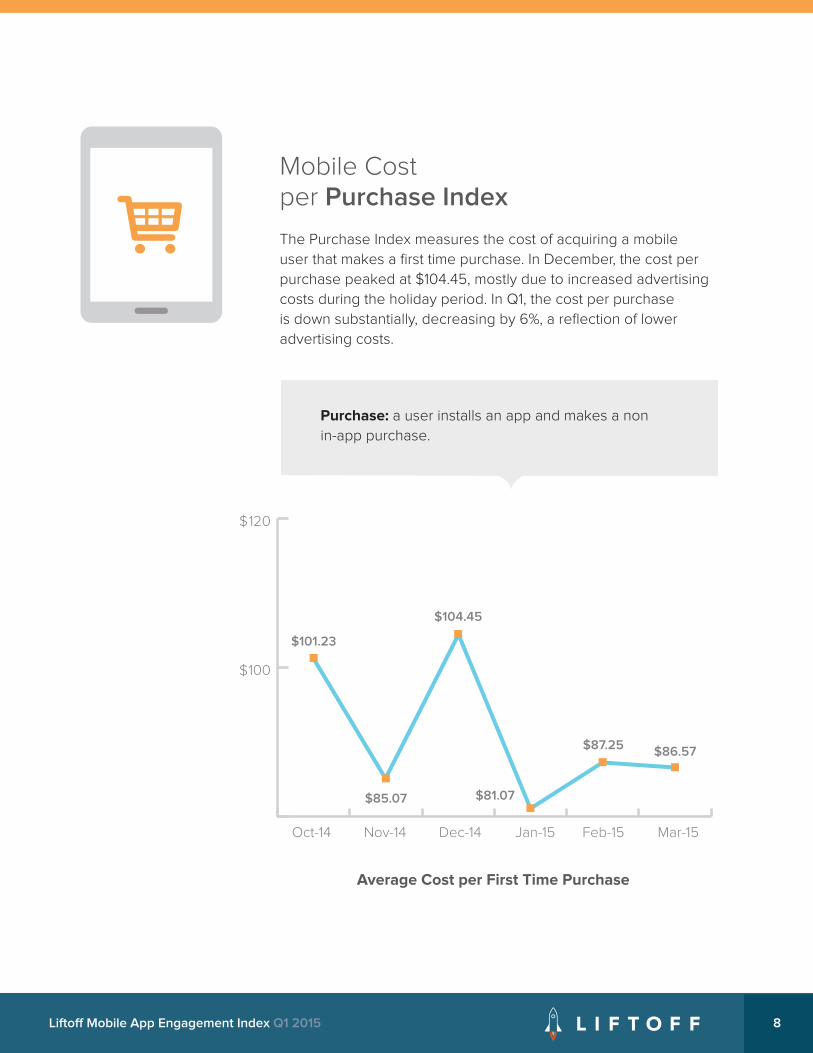
Mobile Costper Purchase Index
The Purchase Index measures the cost of acquiring a mobile
user that makes a first time purchase. In December, the cost per
purchase peaked at $104.45, mostly due to increased advertising
costs during the holiday period. In Q1, the cost per purchase
is down substantially, decreasing by 6%, a reflection of lower
advertising costs.
Purchase: a user installs an app and makes a non
in-app purchase.
100
120
Oct-14 Nov-14 Dec-14 Jan-15 Feb-15 Mar-15
Average Cost per First Time Purchase
$
$
$85.07
$104.45
$101.23
$81.07
$87.25 $86.57

Liftoff Mobile App Engagement Index Q1 2015 9
Mobile Costper Subscription Index
The Subscription Index measures the cost of acquiring a mobile user
who subscribes to a paid service, including dating apps. Between Q4
2014 and Q1 2015, the average cost per subscription decreased by 5.0%,
likely due to reduced ad inventory costs and increased interest in dating
following the holiday season, especially around Valentine’s day.
In addition, non-dating apps with a subscription event had much lower
CPAs than dating apps, though dating apps have a higher lifetime value,
justifying the higher CPA.
Subscription: a user installs an app and subscribes to
a paid service including dating apps, business apps and
other consumer-related apps.
* Q4 subscription CPAs were revised to include all apps with a subscription event.
Average Cost per Subscription
$229.94
$192.10
$215.09
$207.37
$211.60
$181.60
200
250
Oct-14 Nov-14 Dec-14 Jan-15 Feb-15 Mar-15
$
$

Liftoff Mobile App Engagement Index Q1 2015 10
Engagement by Platform iOS vs. Android
In Q1 2015 we saw notable differences in mobile CPAs between
iOS and Android. Android delivered the lowest CPAs on non
transactional events including registering and sharing content. The
gap is even more pronounced than in Q4 2014, when registered
users on Android cost 19% less than iOS.
Yet iOS continues to be significantly more cost-effective on
transactional events further down the funnel including reservations,
purchases and subscriptions. Paid subscriptions on iOS are 22%
higher than Android, likely because it’s the event that requires a
greater financial commitment, and hence is most affected by users’
disposable income levels.
The differences between iOS and Android are consistent with
Q4 findings and generally explained by two key factors: (1) high-
performing mobile ad impressions are more expensive on iOS,
resulting in higher cost-per-installs and cost-per-actions for top of
funnel events; (2) iOS users are more affluent and therefore more
inclined to transact.
$6.62 $11.46 $19.95 $26.33$43.66 $40.71
$227.80
$176.85
$96.40$76.75
SubscribePurchaseReserveShareRegister
-22%
-7%-24%
-42%
-20%
Cost per First Time Engagement by Platform
The cost to acquire a
registered user on Android was 42% less than iOS.
iOS was more cost effective in acquiring a 1st time purchaser (20% less).
20%
42%
Liftoff Mobile App Engagement Index Q1 2015 11
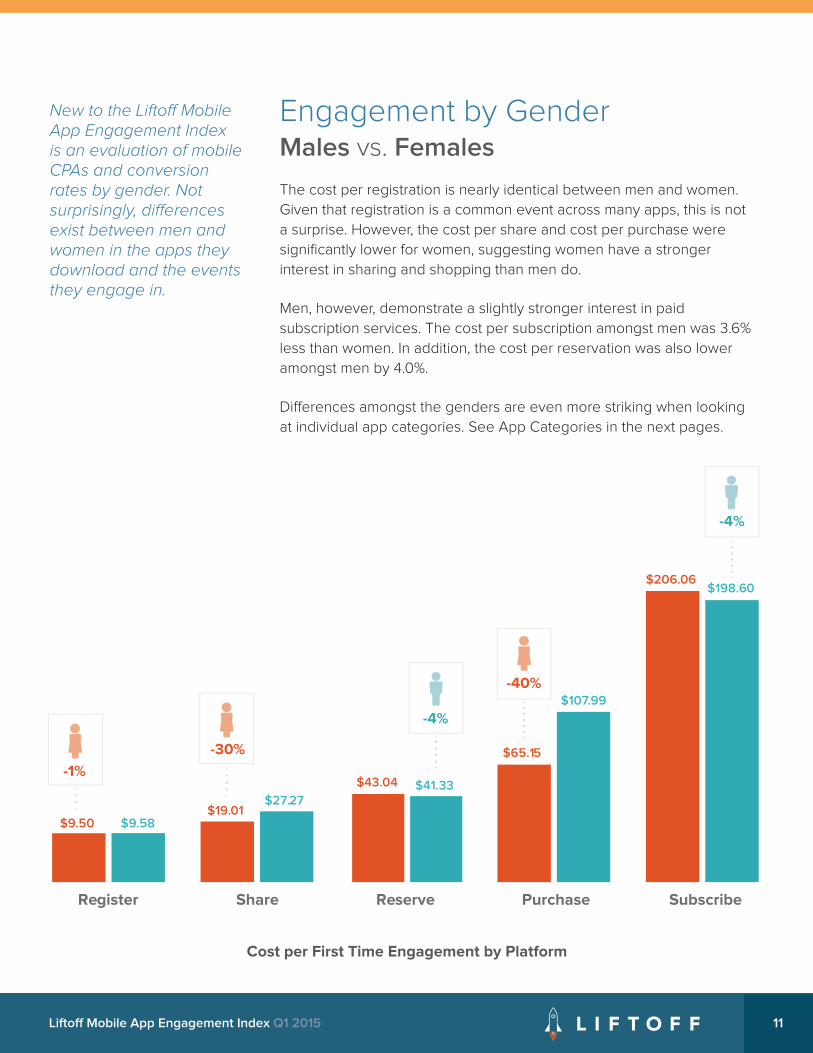
Engagement by Gender Males vs. Females
The cost per registration is nearly identical between men and women.
Given that registration is a common event across many apps, this is not
a surprise. However, the cost per share and cost per purchase were
significantly lower for women, suggesting women have a stronger
interest in sharing and shopping than men do.
Men, however, demonstrate a slightly stronger interest in paid
subscription services. The cost per subscription amongst men was 3.6%
less than women. In addition, the cost per reservation was also lower
amongst men by 4.0%.
Differences amongst the genders are even more striking when looking
at individual app categories. See App Categories in the next pages.
New to the Liftoff Mobile App Engagement Index is an evaluation of mobile CPAs and conversion rates by gender. Not surprisingly, differences exist between men and women in the apps they download and the events they engage in.
Acquisition costs by Gender and App category
SubscribePurchaseReserveShareRegister
-4%
-4%
-30%
-1%
-40%
$9.50 $9.58$19.01
$27.27
$43.04 $41.33
$65.15
$107.99
$206.06 $198.60
Cost per First Time Engagement by Platform

Liftoff Mobile App Engagement Index Q1 2015 12
DatingIn Q1, the install-to-registration rate for
new users of dating apps was 39.9% and
the install-to-subscribe rate was 1.2%. The
average cost per dating subscription was
$280.20, with a range of $100 - $600.
Compared to Q4, the cost per subscription
is down almost 10%, a result of increased
interest in dating following the holidays and
around Valentine’s Day.
*Install to action (ITA) is the % of users who install an app and convert in a post-install event.
Looking at differences by gender, men
have lower cost-per-installs, lower cost-per-
registrations and higher install-to-registration
rates, suggesting that men have a greater
interest in dating than women.
Yet 6% more women converted to a paid
subscription, suggesting that while men are
browsers, women are more serious about
using dating apps to find a mate.
Dating App Engagement Funnel by Gender
Dating App Engagement Funnel
Engagement by App Category
1.0%
40.7%
1.3%
52.0%
1.2%
39.9%
$3.24
$8.13
$280.20
$2.70 $3.78
$9.30
$288.78
$5.19
$271.62

Liftoff Mobile App Engagement Index Q1 2015 13
FinanceThe install-to-registration rate for new users of
financial apps was 43.8%. The average cost
per registration was $13.55, with a range of
$7 to $30. CPIs were lower in Q1 though CPAs
remained essentially unchanged from Q4.
Once again we see differences in
performance by gender in both CPI and CPA,
with men being significantly less expensive
to acquire. The cost per install for men was
15.25% less than women.
The cost per registration shows even greater
disparity, with men averaging 16.3% less than
women, reinforcing stereotypes that men have
a greater interest in finance than women.
Given the wide range of financial services
and business models offered by financial
apps included in this report, no downstream
transactional events are included in our
analysis.
Finance App Engagement Funnel by Gender
Finance App Engagement Funnel
43.8%
*Install to action (ITA) is the % of users who install an app and convert in a post-install event.
$13.55
$5.93
44.0% 43.6%
$5.51 $6.35
$14.57$12.52

Liftoff Mobile App Engagement Index Q1 2015 14
ShoppingThe install-to-registration rate for new users of
shopping apps was 72.5%, and the install-to-
first-purchase rate was 2.2%.
The average cost to acquire a first time
shopper from app install ads was $164.55,
with a range of $30 to $400. CPAs were down
slightly in Q1, due to increased ad spend
during the holiday period.
Given that the lifetime value of a shopper is
greater than $165, ecommerce companies can
support a large cost per first-time purchase.
Amongst shopping apps, women far
outperformed men. Though men and women
had a similar cost per install, women had a much
higher install to first purchase rate, lower cost
per purchase and a higher install to share rate,
which helps boost organic user acquisition.
Shopping App Engagement Funnel by Gender
Shopping App Engagement Funnel
*Install to action (ITA) is the % of users who install an app and convert in a post-install event.
$4.88
$3.54
$164.55
72.5%
86.0%62.9%
1.9% 2.4%
2.2%
$3.57 $3.51
$4.08
$144.50
$5.67
$190.79

Liftoff Mobile App Engagement Index Q1 2015 15
76.3%
35.7%
SocialSocial apps continue to demonstrate the
highest install-to-registration rate amongst the
app categories at 76.3%, mostly due to heavily
optimized registration flows.
The install to first time share rate was 35.7%
and the average cost to acquire a new
registered user was $4.27, with a range of
$4.00 to $15.00. On average, new registered
users shared 17 times within the first 30 days.
While both the cost per install and cost per
registration decreased significantly in Q1, the
cost per first share increased by 12.5%. This is
largely attributable to increased content sharing
levels during the holiday season.
Gender differences in post-install sharing were
pronounced, with 36% more women sharing
than men. This data correlates with multiple
studies that show a higher percentage of
women use social media, and that they use it
more heavily than men.
Social App Engagement Funnel by Gender
Social App Engagement Funnel
74.3%
30.6%
78.7%
42.8%
*Install to action (ITA) is the % of users who install an app and convert in a post-install event.
$4.27
$3.26
$9.13
$3.22 $3.31
$4.21
$7.74
$4.33
$10.52

Liftoff Mobile App Engagement Index Q1 2015 16
TravelThe install-to-registration rate amongst travel
apps was 41.7%, an 18.8% improvement from
Q4, while the cost per first time reservation
increased by 7.7%. The average cost to acquire
a new user who makes a first time reservation
was $42.19, with a range of $20 to $400.
Amongst all app categories included in the
index, travel apps have the highest cost-per-
registration. This is likely due to most travel
apps not requiring users to create an account
until they are ready to make a purchase.
CPIs and CPAs were lower for men, but more
women had higher conversion rates on both
registration and making reservations.
Note that reservations within travel apps include
booking flights, hotels and taxi-related services,
accounting for the wide disparity in cost-per-
reservation. The more immediate, short-term
travel services demonstrated significantly lower
CPA than those that require more planning
ahead of time.
Travel App Engagement Funnel by Gender
Travel App Engagement Funnel
43.9%
14.9%
*Install to action (ITA) is the % of users who install an app and convert in a post-install event.
$14.39
$6.00
$42.19
41.7%
39.5%
13.5%
14.2%
$5.58 $6.42
$14.64
$43.04
$14.14
$41.33

Liftoff Mobile App Engagement Index Q1 2015 17
UtilityThe install-to-registration rate amongst utility apps
was 26.3%, an increase of 10.5% from Q4, and the
install-to-first-purchase was 8.5%, an increase of
25%. The average cost to acquire a first purchase
was $40.25, with a range of $30 to $200.
Utility apps again had the lowest install-to-
registration rates at 26.3% and relatively high
cost-per-registration at $13.07, a reflection of
the fact that many utility apps do not require
users to create an account in order to use the
app. However, they also had the lowest cost-
per-purchase, a quarter that of Shopping apps.
This makes sense as Utility apps tend to have
lighter-weight purchases that offer more instant
gratification.
Because utility apps offer such a wide range of
services, making it more challenging to establish
meaningful benchmarks for this category, we
recommend using this data for directional
purposes only.
Utility App Engagement Funnel by Gender
Utility App Engagement Funnel
6.3% 5.7%
20.8% 16.4%
*Install to action (ITA) is the % of users who install an app and convert in a post-install event.
$13.07
$3.44
$40.25
26.3%
8.5%
$3.45 $2.87
$13.82
$40.02
$12.33
$45.11

Liftoff Mobile App Engagement Index Q1 2015 18
The Bottom LineMobile CPA benchmarks and conversion rates continue to shift,
impacted by gender, seasonality, OS platform, ad inventory and
increasing competition. While Android succeeds in offering the lowest
cost per non-transaction event, iOS continues to be the platform where
business can generate the most revenue.
As it turns out, gender plays a big role in mobile engagement,
corroborating other research on how men and women engage with
media.
CPA values are heavily influenced by the revenue potential of a given
app category, like Dating and Shopping, and the lifetime value that can
be derived from engaged users. And with bigger advertisers investing
more on mobile, improving their apps and spending more on paid user
acquisition, this will only put added pressure of both CPIs and CPAs.
About LiftoffEngaged users are the lifeblood of your mobile business. Yet most
marketers are focused on acquiring app installs, hoping some users will
convert into active customers. At Liftoff, we flip this model on its head.
We start with the post-install events you care most about - like creating
an account, making a purchase, or booking a hotel room - and set a
target cost-per-action. We then build rich profiles of your most active
customers and run campaigns targeting lookalike users across the major
mobile ad networks and RTB exchanges.
As our platform gathers data, we automatically fine tune all aspects of
your campaigns until we hit your target CPA. When we’re done, we’ll
switch you to a CPA pricing model so you’ll never again pay for an
install that doesn’t convert.
Liftoff. Go beyond the install.
Contact us at [email protected]
or visit www.liftoff.io