light sar 1, radar basics - earth online - esa · lecture content 1. introduction to radar remote...
TRANSCRIPT
Light SAR 1, Radar Basics
Lena Halounová
29 June 2009, D1La1
Lecture content
1. Introduction to radar remote sensing
2. Synthetic Aperture Radar
3. Geometric properties of SAR images
4. Scattering mechanisms
5. Statistic properties of SAR measurements
6. Physical content of SAR data
Lecture content
1. Introduction to radar remote sensing
2. Synthetic Aperture Radar
3. Geometric properties of SAR images
4. Scattering mechanisms
5. Statistic properties of SAR measurements
6. Physical content of SAR data
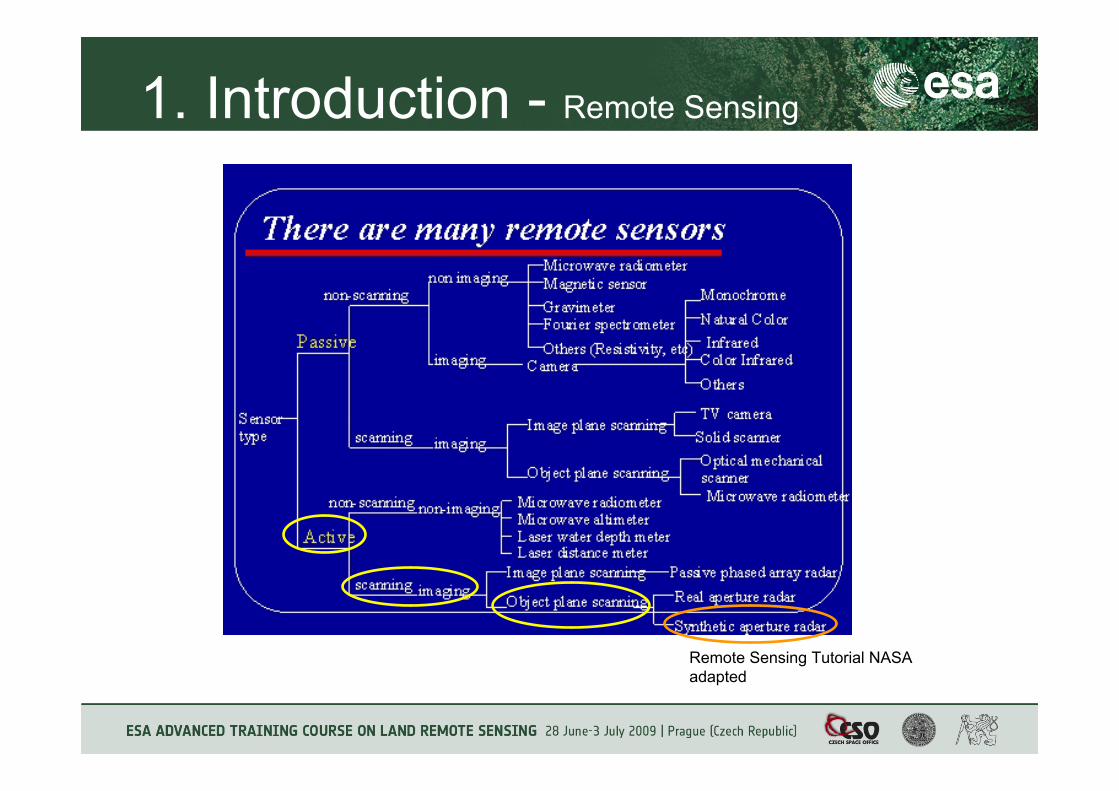
1. Introduction - Remote Sensing
Remote Sensing Tutorial NASA adapted
1. Introduction - terms
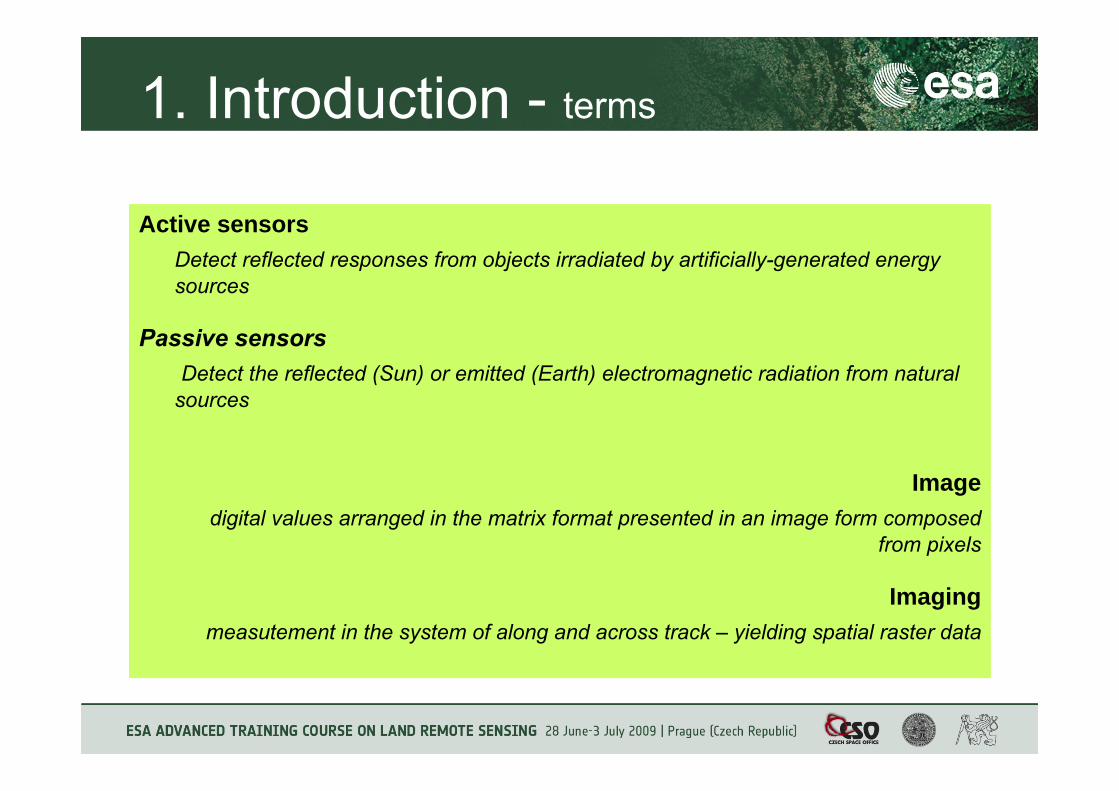
Active sensorsDetect reflected responses from objects irradiated by artificially-generated energy sources
Passive sensorsDetect the reflected (Sun) or emitted (Earth) electromagnetic radiation from natural
sources
Imagedigital values arranged in the matrix format presented in an image form composed
from pixels
Imagingmeasutement in the system of along and across track – yielding spatial raster data
1. Introduction - active RS terms
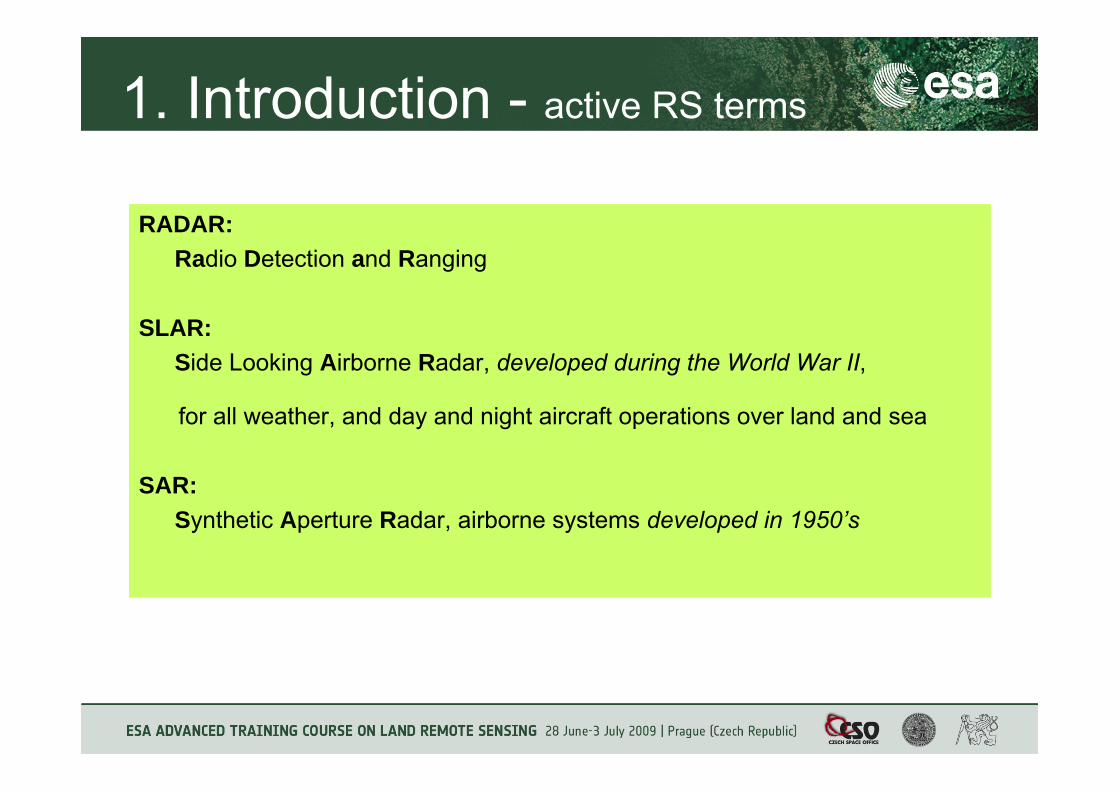
RADAR: Radio Detection and Ranging
SLAR: Side Looking Airborne Radar, developed during the World War II,
for all weather, and day and night aircraft operations over land and sea
SAR: Synthetic Aperture Radar, airborne systems developed in 1950’s

1. Introduction - electromagnetic spectrum
Remote Sensing Tutorial NASA
1. Introduction -spectral bands of SAR
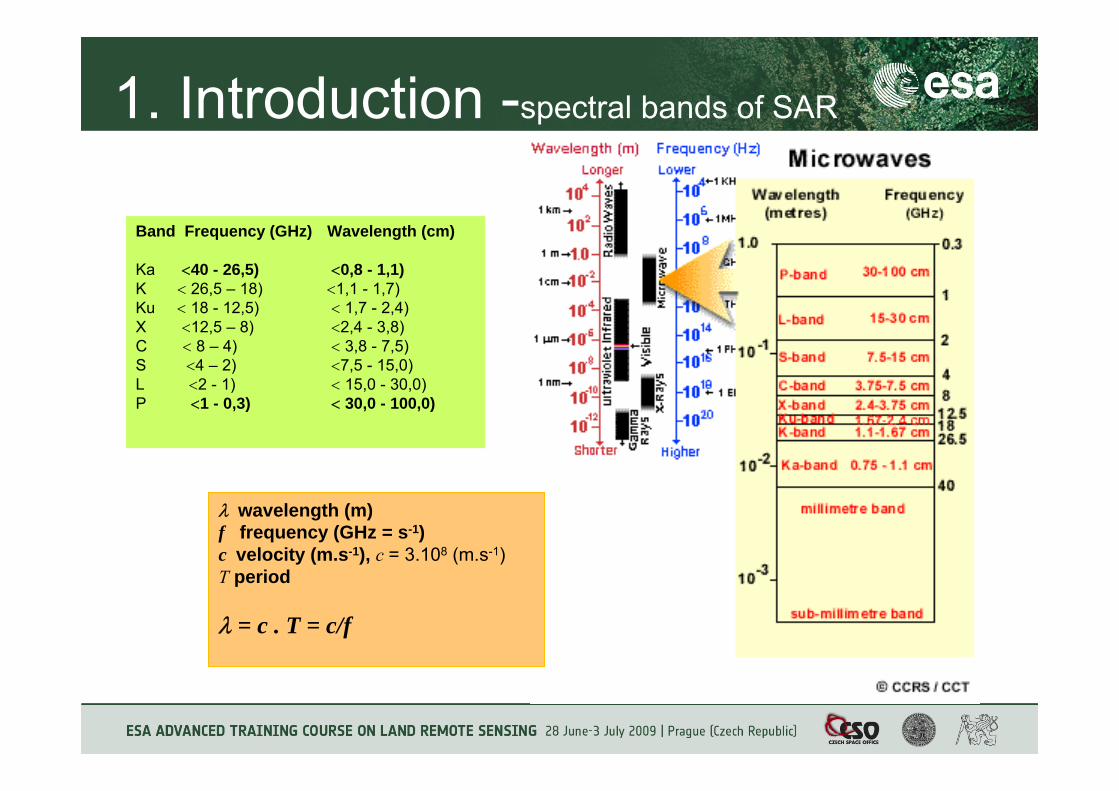
Band Frequency (GHz) Wavelength (cm)
Ka <40 - 26,5) <0,8 - 1,1)K < 26,5 – 18) <1,1 - 1,7)Ku < 18 - 12,5) < 1,7 - 2,4)X <12,5 – 8) <2,4 - 3,8)C < 8 – 4) < 3,8 - 7,5)S <4 – 2) <7,5 - 15,0)L <2 - 1) < 15,0 - 30,0)P <1 - 0,3) < 30,0 - 100,0)
λ wavelength (m)f frequency (GHz = s-1)c velocity (m.s-1), c = 3.108 (m.s-1)T period
λ = c . T = c/f
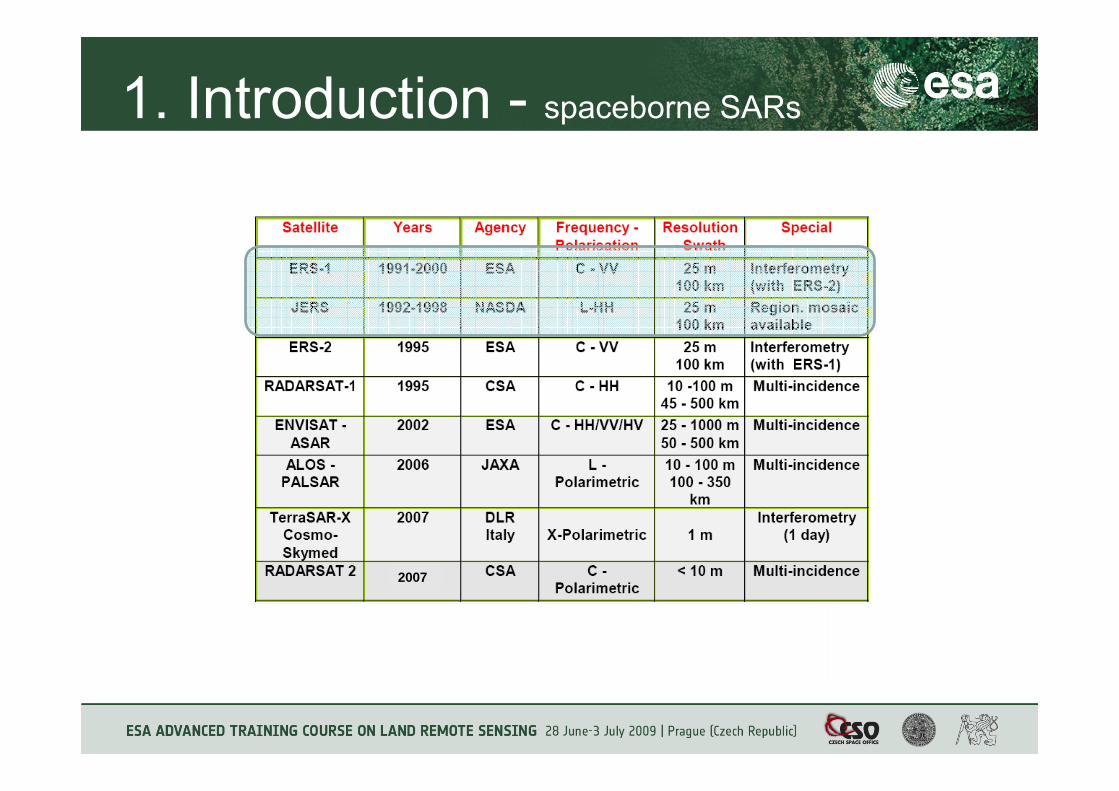
1. Introduction - spaceborne SARs
2007
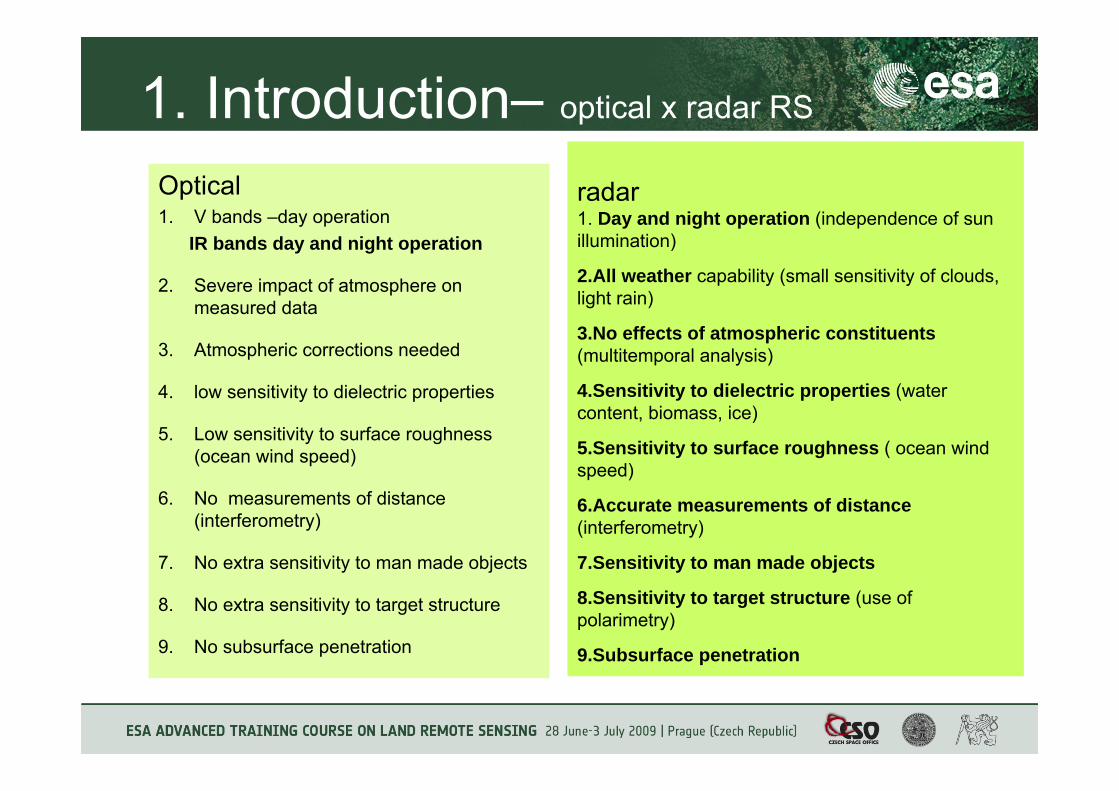
1. Introduction– optical x radar RS
Optical1. V bands –day operation
IR bands day and night operation
2. Severe impact of atmosphere on measured data
3. Atmospheric corrections needed
4. low sensitivity to dielectric properties
5. Low sensitivity to surface roughness (ocean wind speed)
6. No measurements of distance (interferometry)
7. No extra sensitivity to man made objects
8. No extra sensitivity to target structure
9. No subsurface penetration
radar1. Day and night operation (independence of sun illumination)
2.All weather capability (small sensitivity of clouds, light rain)
3.No effects of atmospheric constituents (multitemporal analysis)
4.Sensitivity to dielectric properties (water content, biomass, ice)
5.Sensitivity to surface roughness ( ocean wind speed)
6.Accurate measurements of distance(interferometry)
7.Sensitivity to man made objects
8.Sensitivity to target structure (use of polarimetry)
9.Subsurface penetration
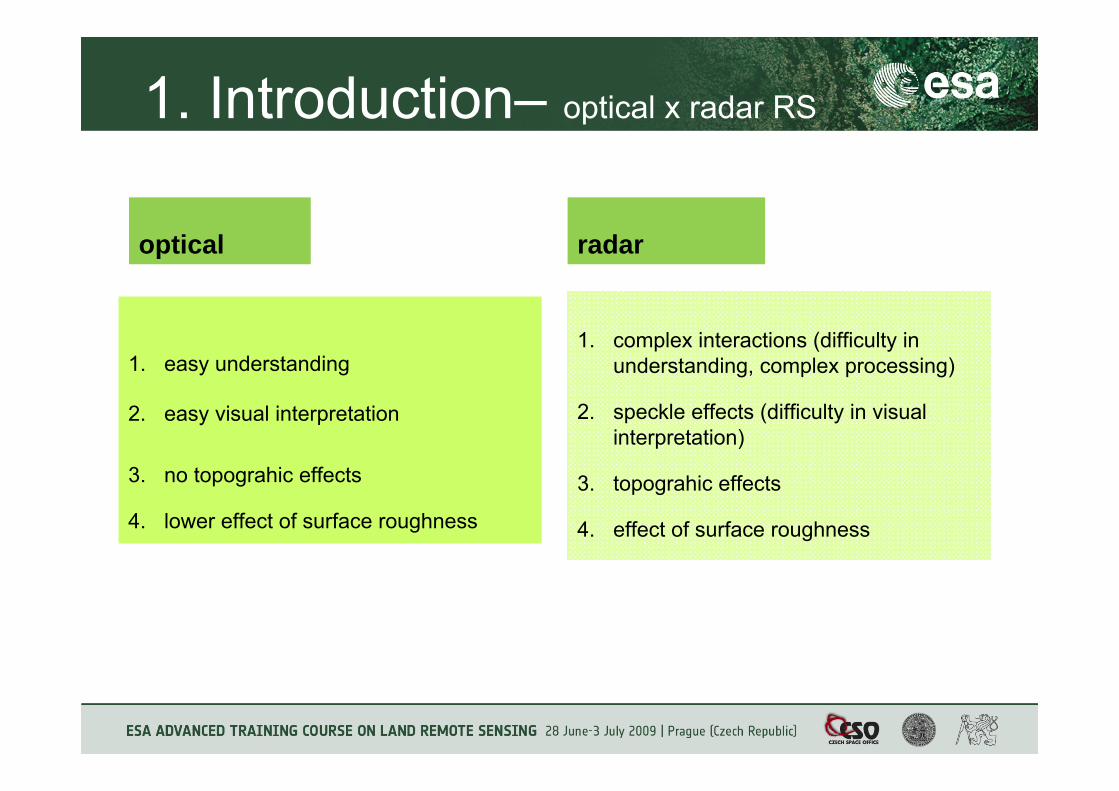
1. Introduction– optical x radar RS
optical
1. easy understanding
2. easy visual interpretation
3. no topograhic effects
4. lower effect of surface roughness
radar
1. complex interactions (difficulty in understanding, complex processing)
2. speckle effects (difficulty in visual interpretation)
3. topograhic effects
4. effect of surface roughness
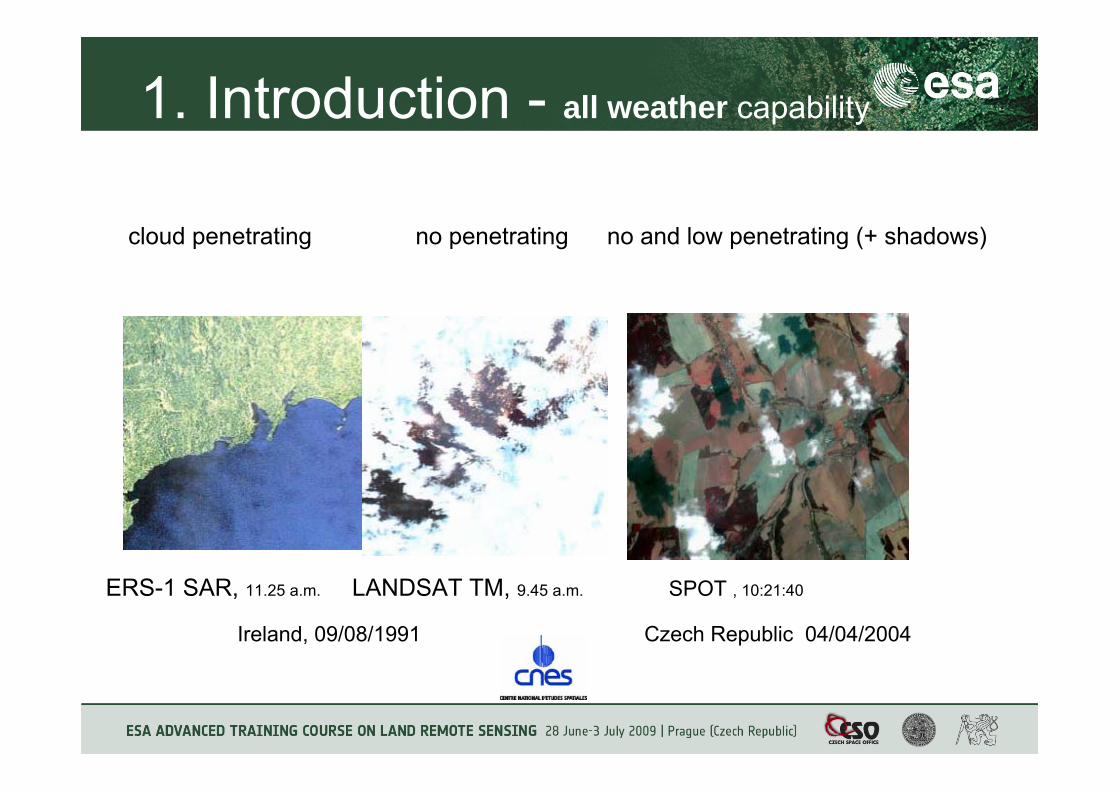
1. Introduction - all weather capability
ERS-1 SAR, 11.25 a.m. LANDSAT TM, 9.45 a.m. SPOT , 10:21:40
Ireland, 09/08/1991 Czech Republic 04/04/2004
cloud penetrating no penetrating no and low penetrating (+ shadows)
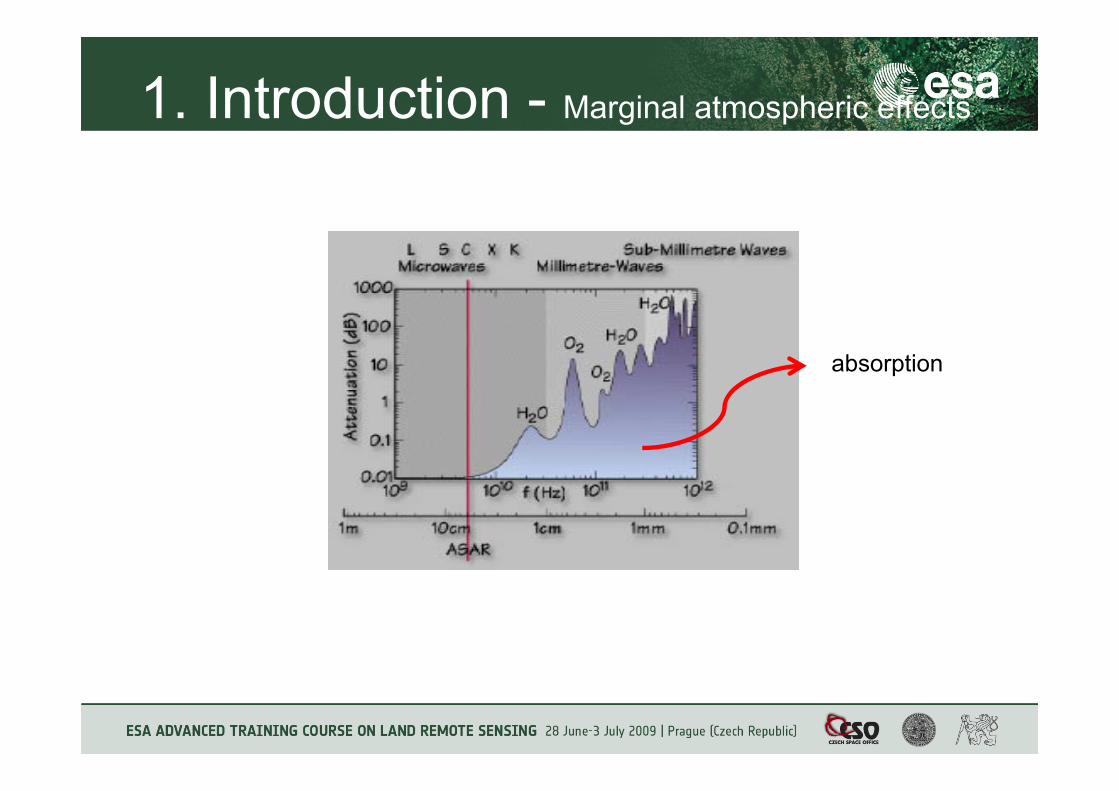
1. Introduction - Marginal atmospheric effects
absorption
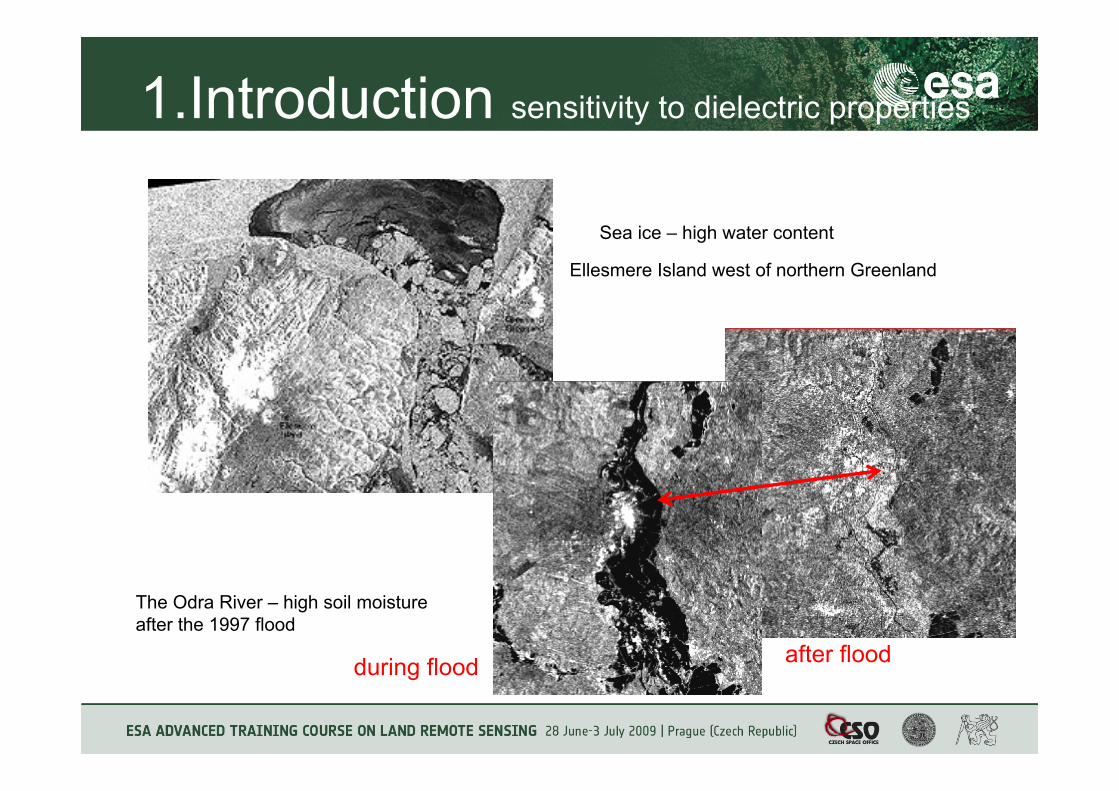
1.Introduction sensitivity to dielectric properties
Sea ice – high water content
Ellesmere Island west of northern Greenland
The Odra River – high soil moisture after the 1997 flood
during flood after flood
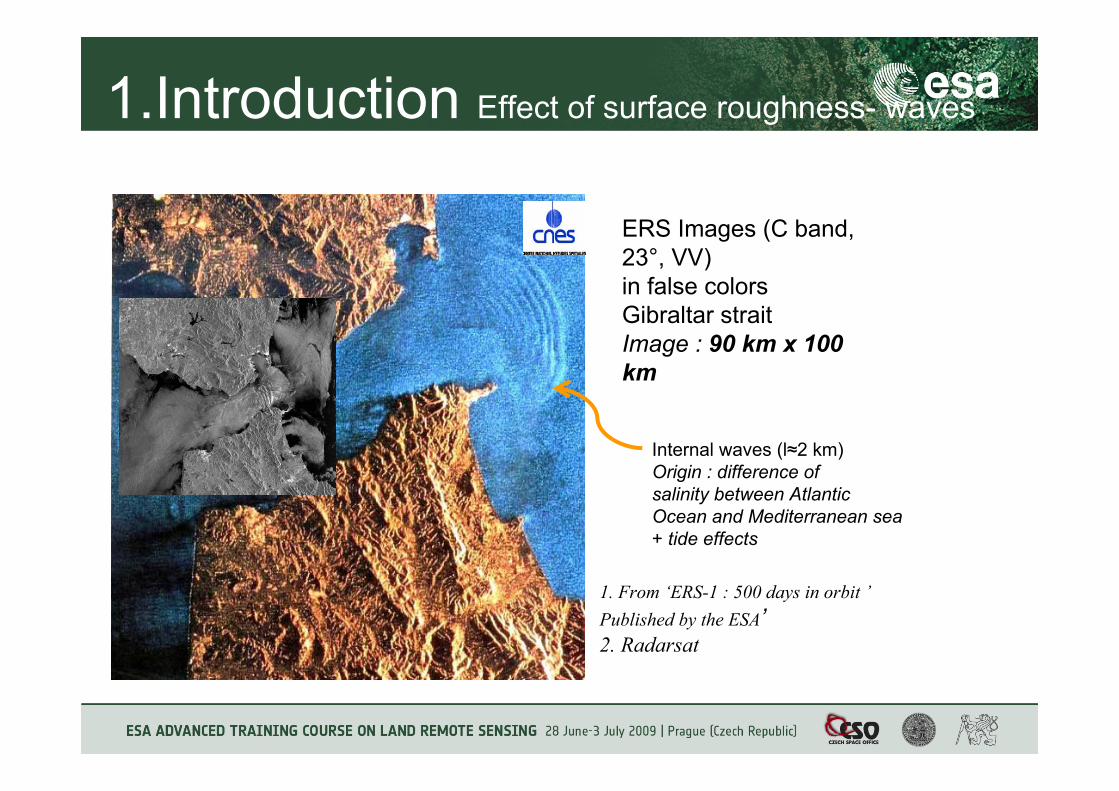
1.Introduction Effect of surface roughness- waves
ERS Images (C band, 23°, VV)in false colorsGibraltar straitImage : 90 km x 100 km
Internal waves (l≈2 km)Origin : difference ofsalinity between AtlanticOcean and Mediterranean sea+ tide effects
1. From ‘ERS-1 : 500 days in orbit ’Published by the ESA’2. Radarsat
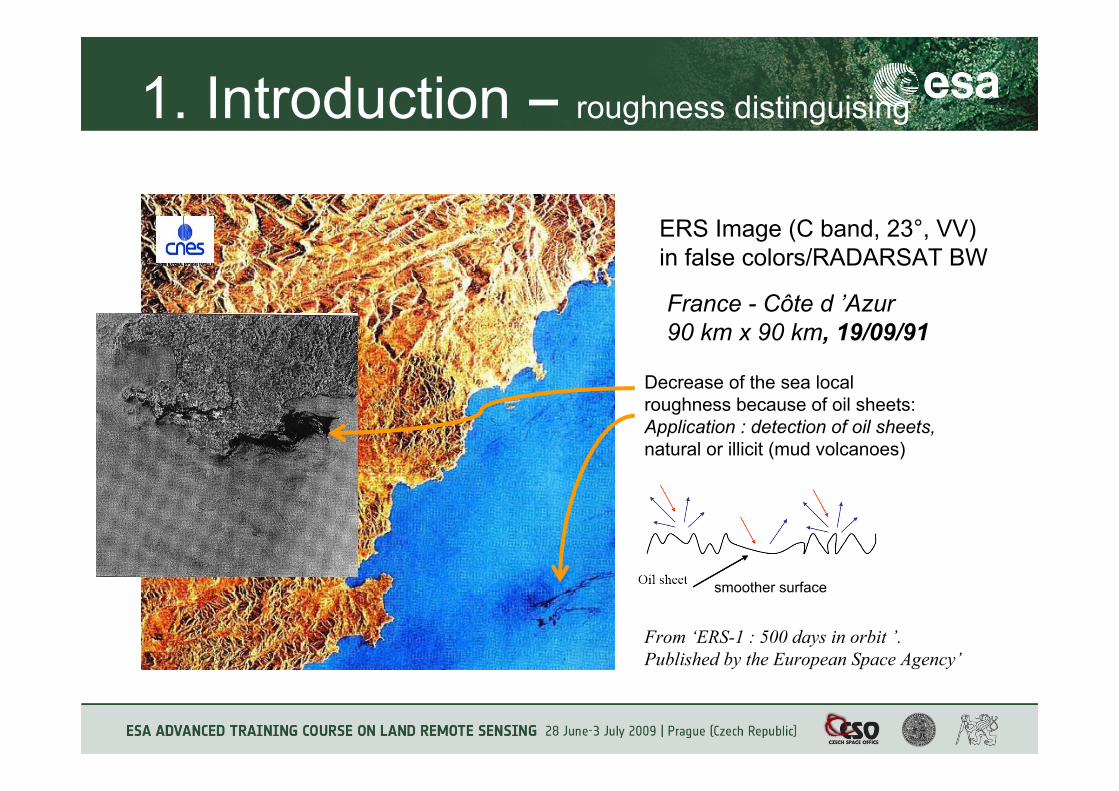
1. Introduction – roughness distinguising
ERS Image (C band, 23°, VV)in false colors/RADARSAT BW
France - Côte d ’Azur90 km x 90 km, 19/09/91
Decrease of the sea localroughness because of oil sheets:Application : detection of oil sheets,natural or illicit (mud volcanoes)
From ‘ERS-1 : 500 days in orbit ’.Published by the European Space Agency’
smoother surface
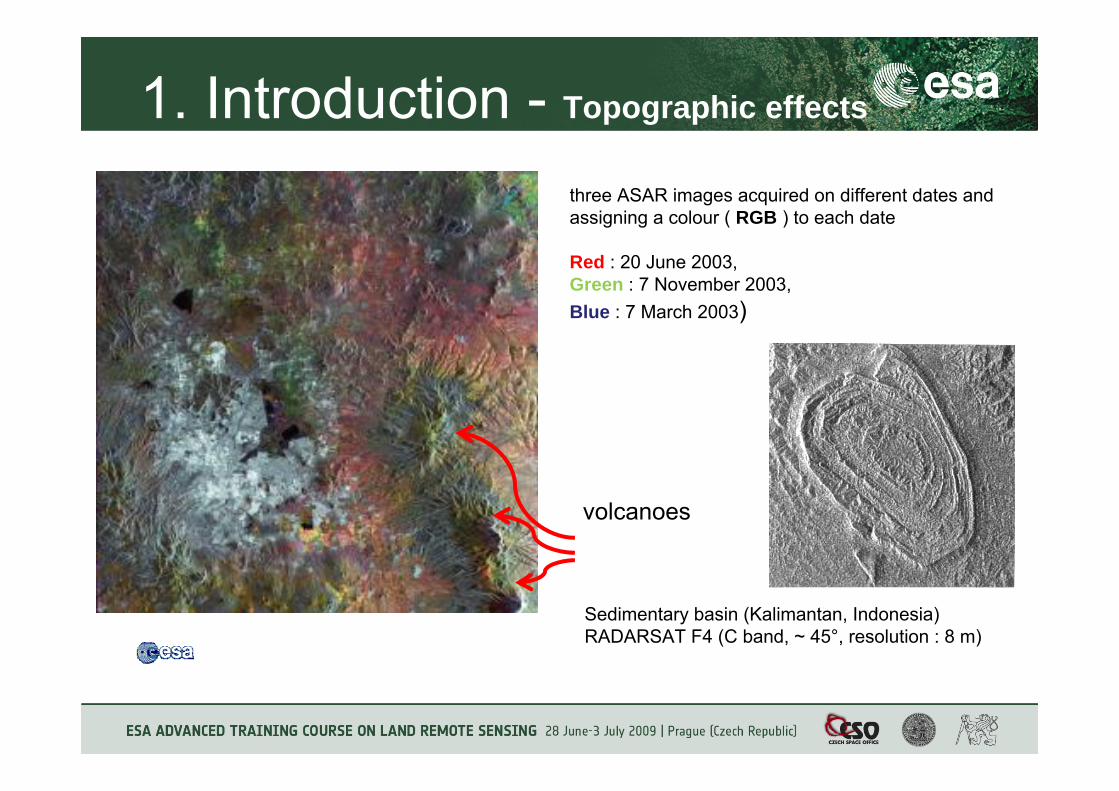
1. Introduction - Topographic effects
three ASAR images acquired on different dates and assigning a colour ( RGB ) to each date
Red : 20 June 2003, Green : 7 November 2003, Blue : 7 March 2003)
volcanoes
Sedimentary basin (Kalimantan, Indonesia)RADARSAT F4 (C band, ~ 45°, resolution : 8 m)
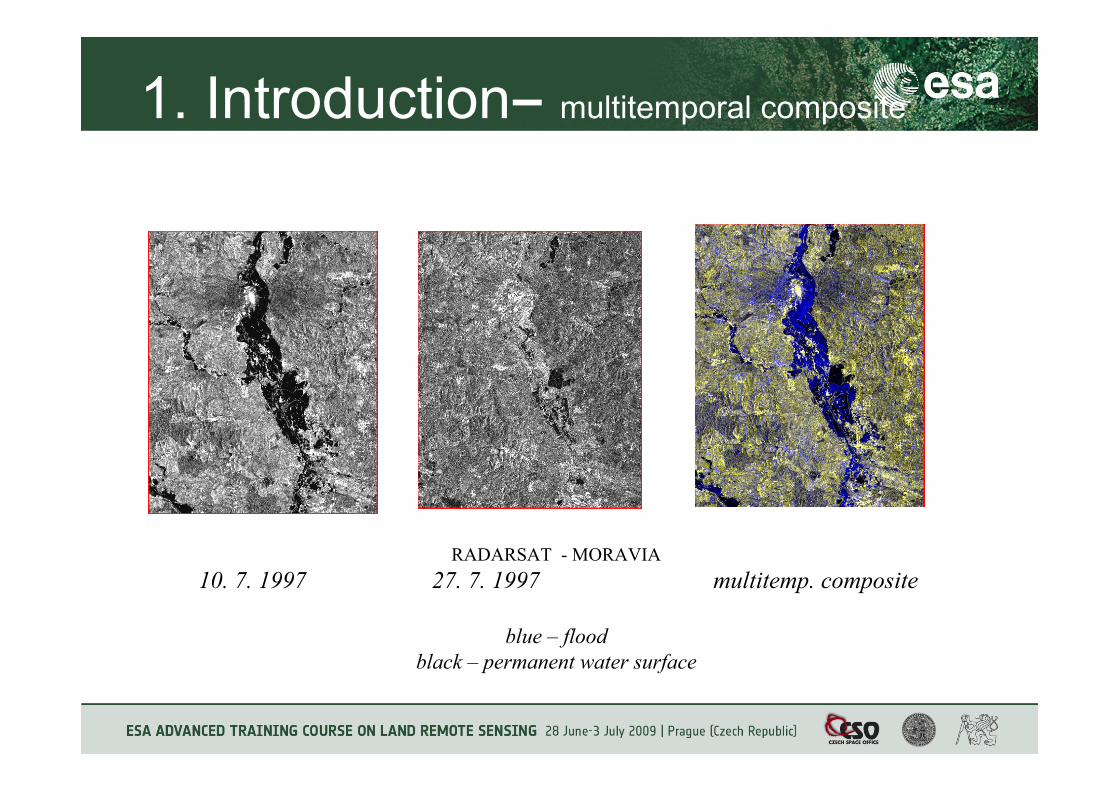
1. Introduction– multitemporal composite
RADARSAT - MORAVIA10. 7. 1997 27. 7. 1997 multitemp. composite
blue – floodblack – permanent water surface
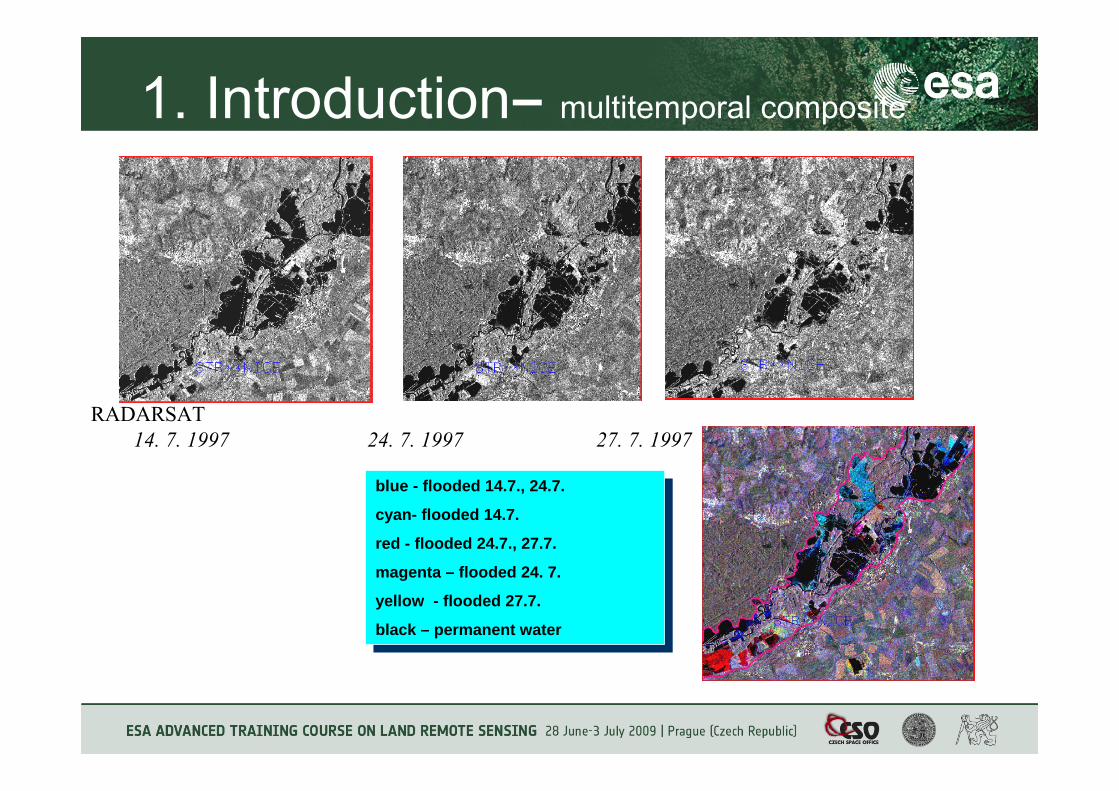
1. Introduction– multitemporal composite
RADARSAT14. 7. 1997 24. 7. 1997 27. 7. 1997
blue - flooded 14.7., 24.7.
cyan- flooded 14.7.
red - flooded 24.7., 27.7.
magenta – flooded 24. 7.
yellow - flooded 27.7.
black – permanent water
blue - flooded 14.7., 24.7.
cyan- flooded 14.7.
red - flooded 24.7., 27.7.
magenta – flooded 24. 7.
yellow - flooded 27.7.
black – permanent water
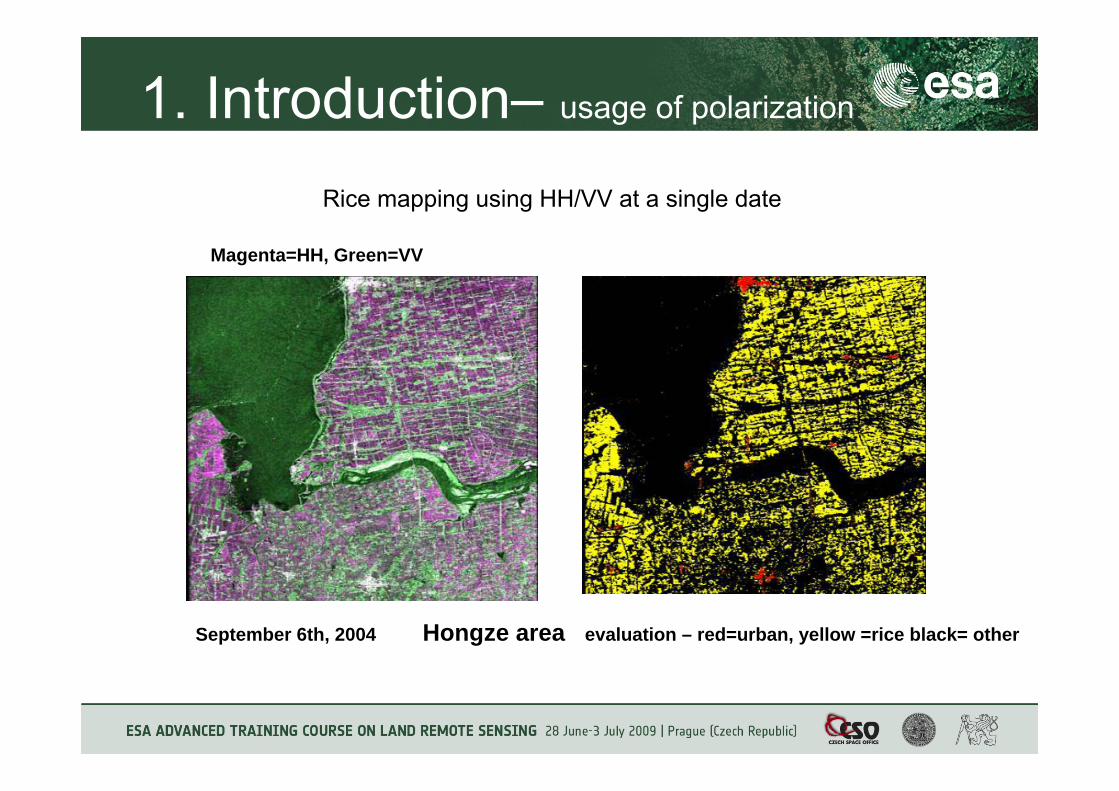
1. Introduction– usage of polarization
Rice mapping using HH/VV at a single date
September 6th, 2004 Hongze area evaluation – red=urban, yellow =rice black= other
Magenta=HH, Green=VV
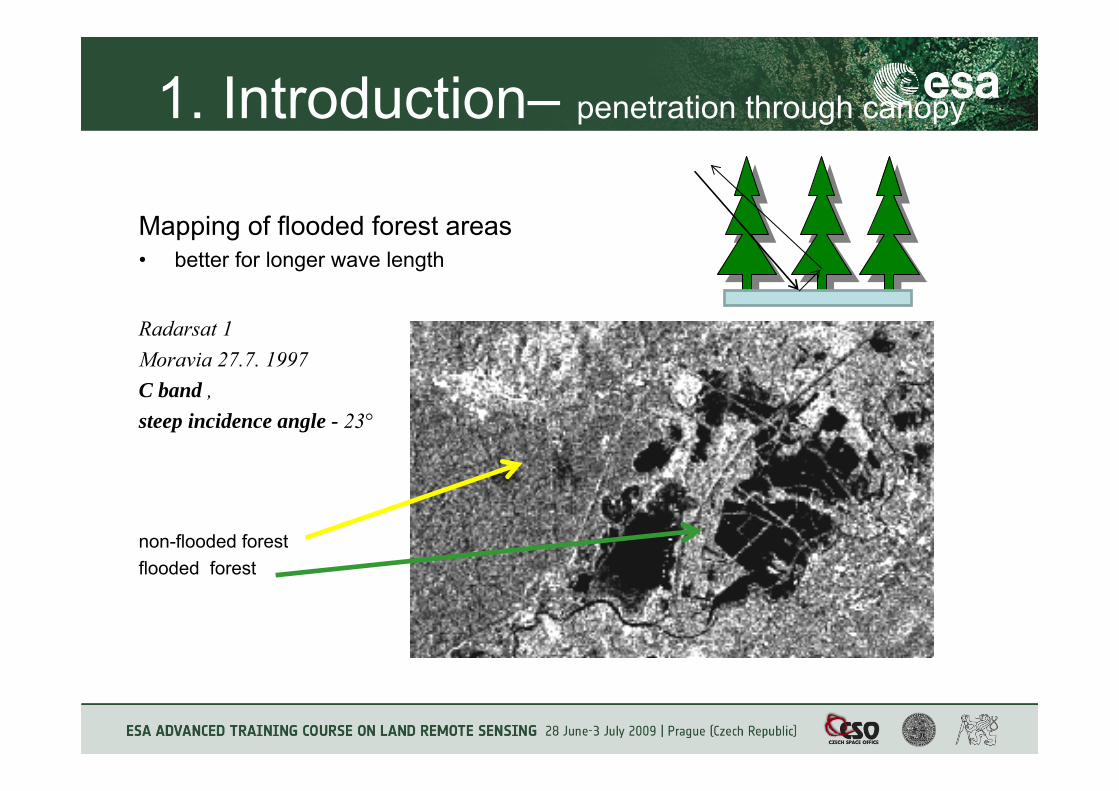
1. Introduction– penetration through canopy
Mapping of flooded forest areas • better for longer wave length
Radarsat 1Moravia 27.7. 1997C band , steep incidence angle - 23°
non-flooded forest flooded forest
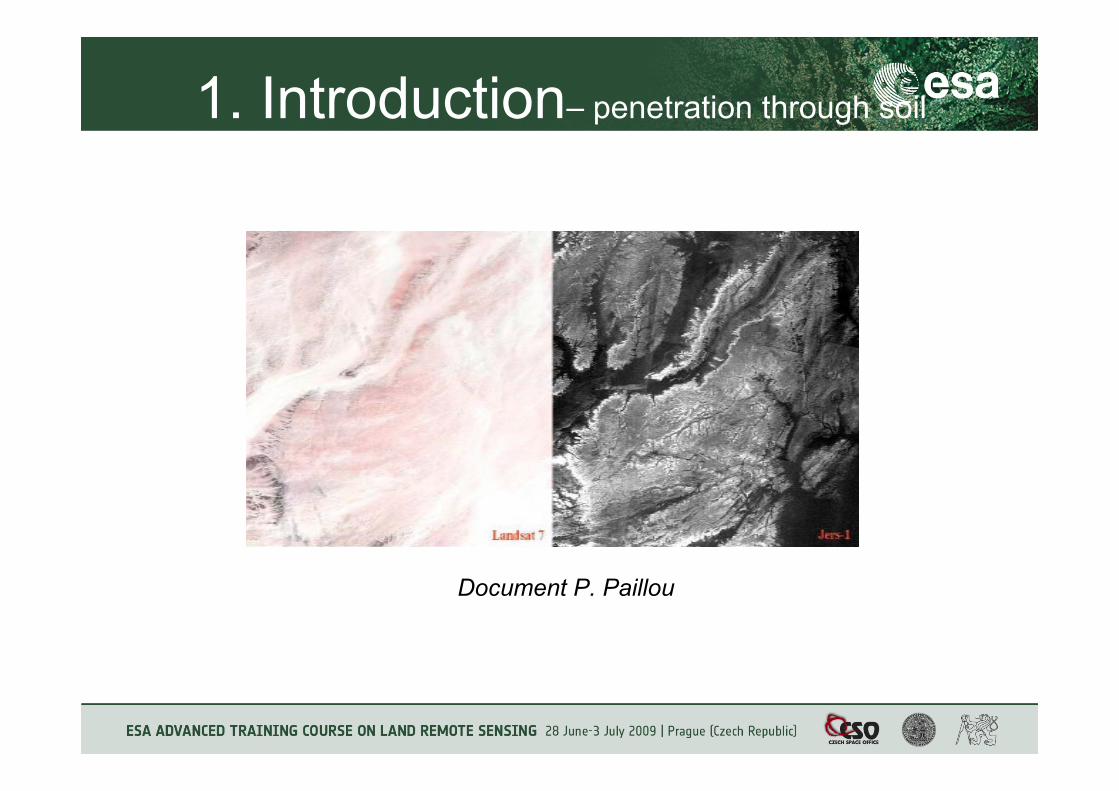
1. Introduction– penetration through soil
Document P. Paillou
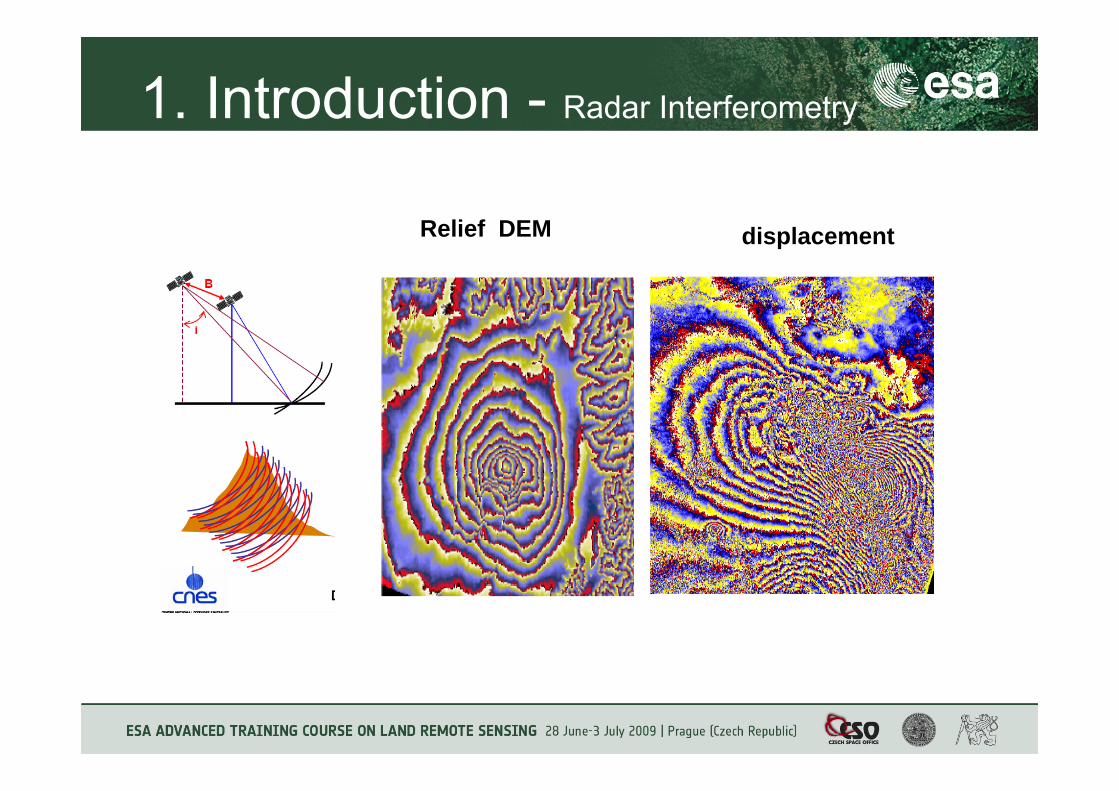
1. Introduction - Radar Interferometry
Relief DEM displacement
Lecture content
1. Introduction to radar remote sensing
2. Synthetic Aperture Radar
3. Geometric properties of SAR images
4. Scattering mechanisms
5. Statistic properties of SAR measurements
6. Physical content of SAR data
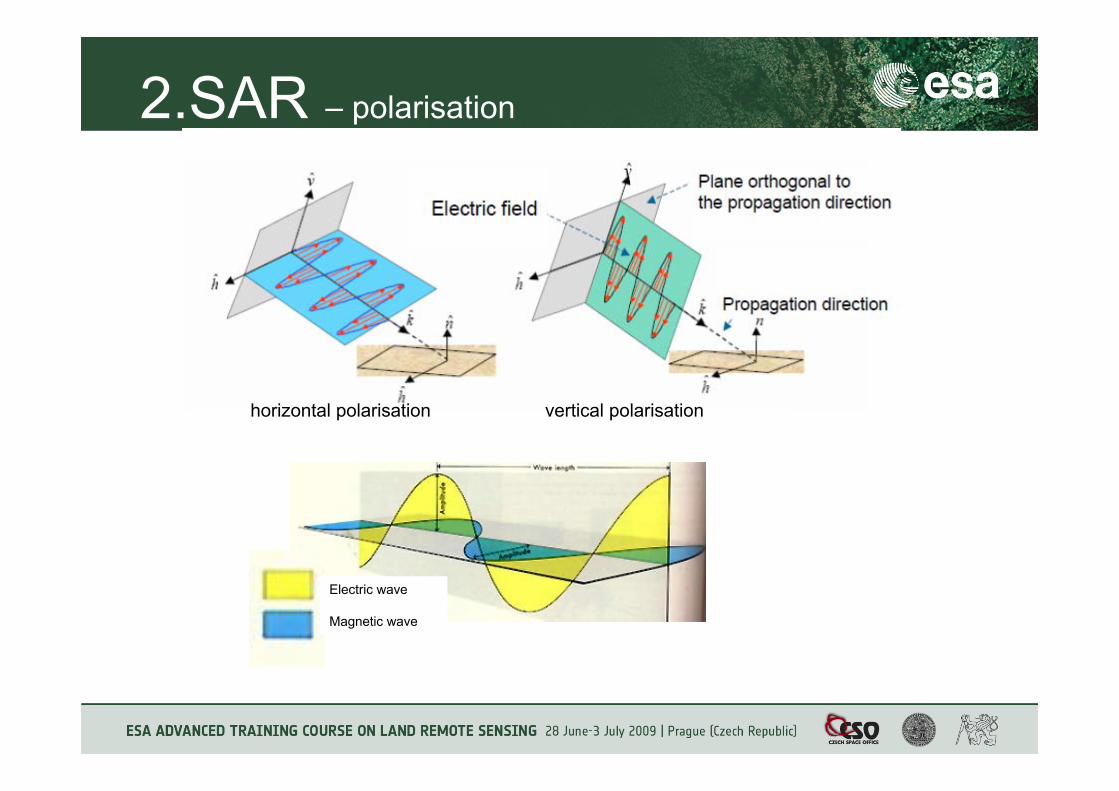
2.SAR – polarisation
horizontal polarisation vertical polarisation
Electric wave
Magnetic wave
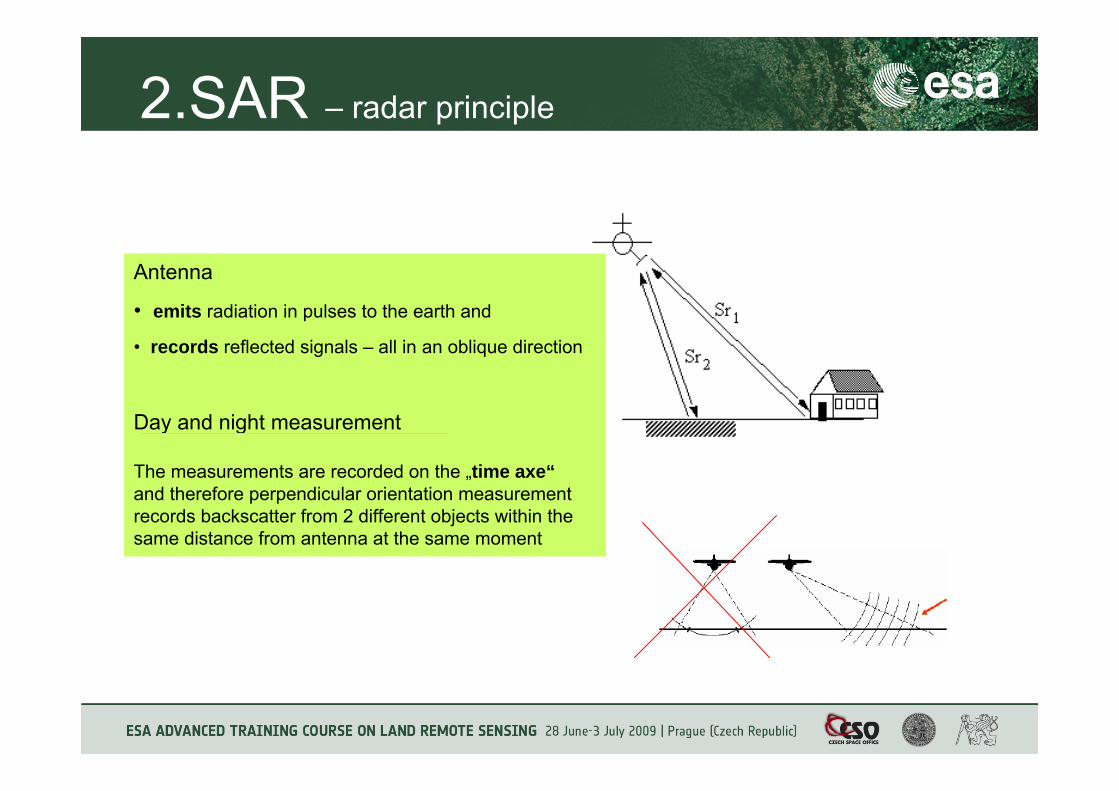
2.SAR – radar principle
Antenna
• emits radiation in pulses to the earth and
• records reflected signals – all in an oblique direction
Day and night measurement
The measurements are recorded on the „time axe“and therefore perpendicular orientation measurement records backscatter from 2 different objects within the same distance from antenna at the same moment
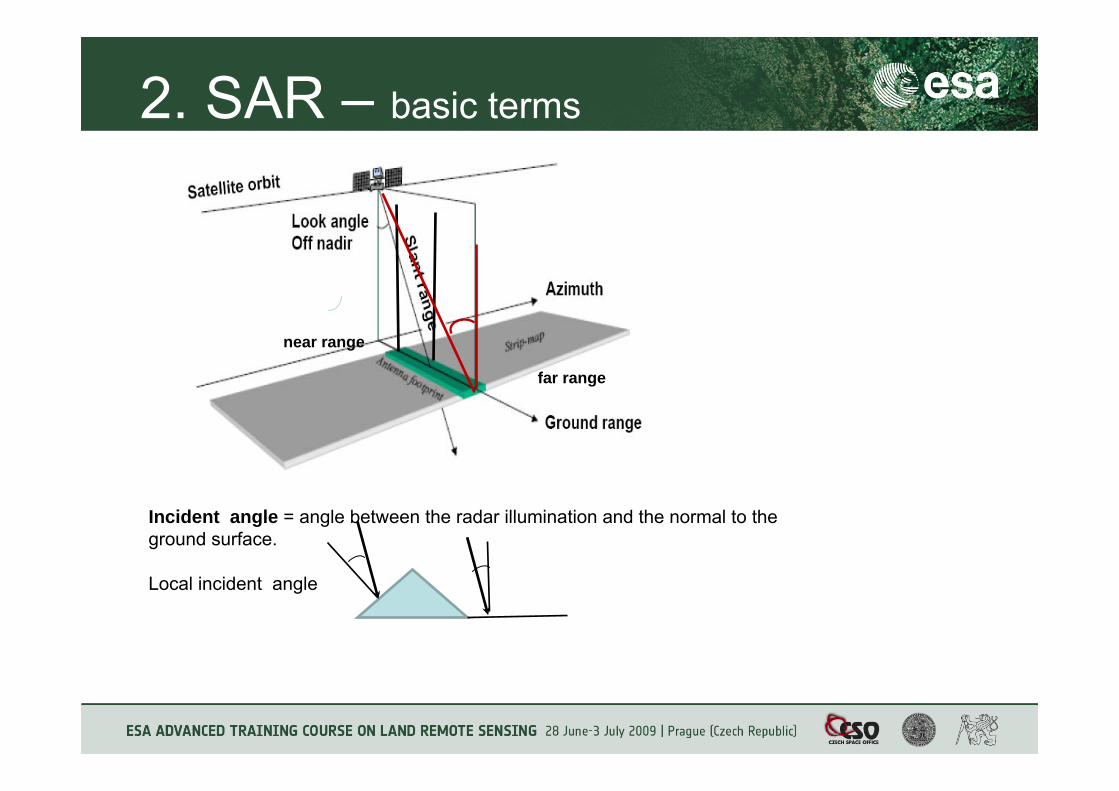
2. SAR – basic terms
Incident angle = angle between the radar illumination and the normal to the ground surface.
Local incident angle
far range
near range
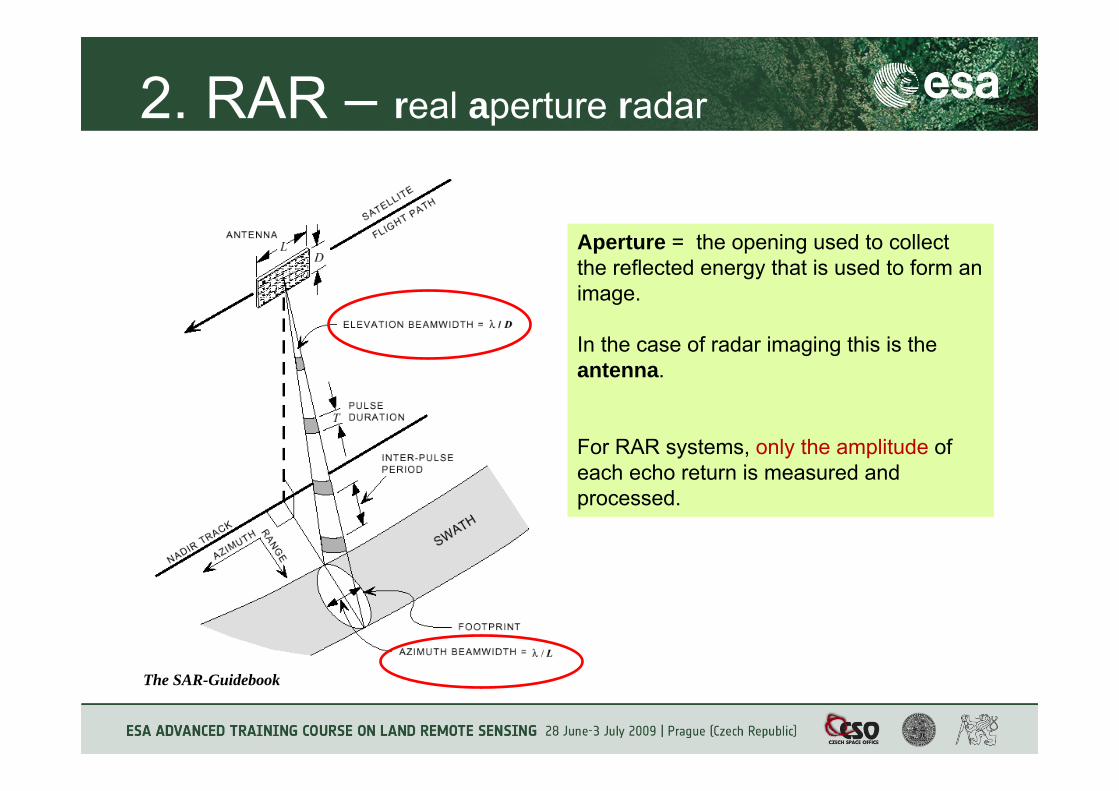
2. RAR – real aperture radar
Aperture = the opening used to collect the reflected energy that is used to form an image.
In the case of radar imaging this is the antenna.
For RAR systems, only the amplitude of each echo return is measured and processed.
The SAR-Guidebook
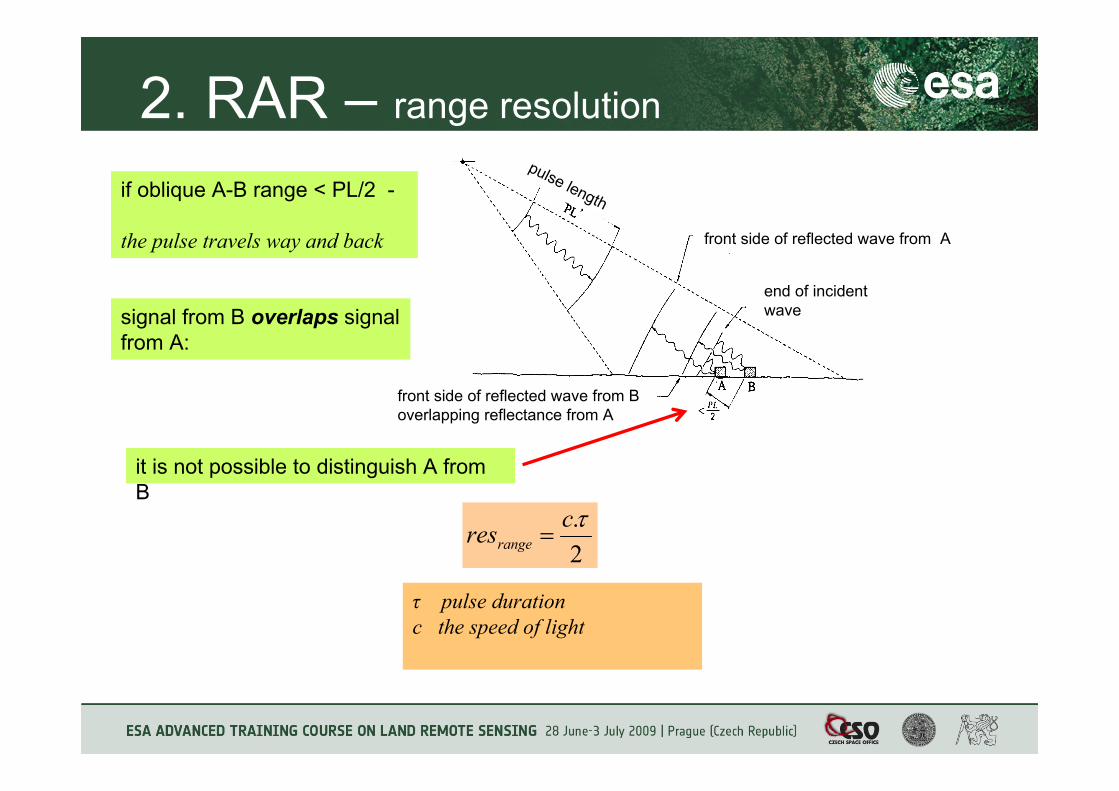
2. RAR – range resolutionpulse length
front side of reflected wave from A
end of incident wave
front side of reflected wave from B overlapping reflectance from A
τ pulse durationc the speed of light
2.τcresrange =
if oblique A-B range < PL/2 -
the pulse travels way and back
signal from B overlaps signal from A:
it is not possible to distinguish A from B
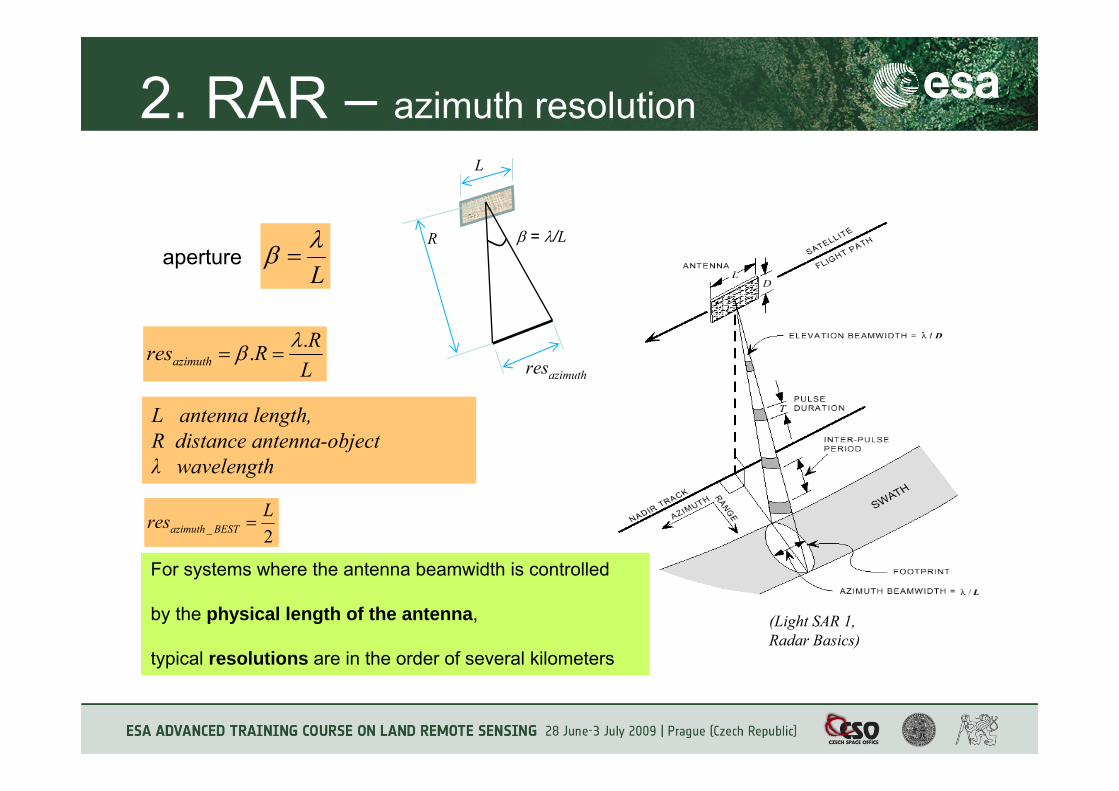
2. RAR – azimuth resolution
LRRresazimuth.. λβ ==
L antenna length, R distance antenna-objectλ wavelength
For systems where the antenna beamwidth is controlled
by the physical length of the antenna,
typical resolutions are in the order of several kilometers
Lλβ =
β = λ/LRaperture
L
resazimuth
(Light SAR 1,Radar Basics)
2_Lres BESTazimuth =
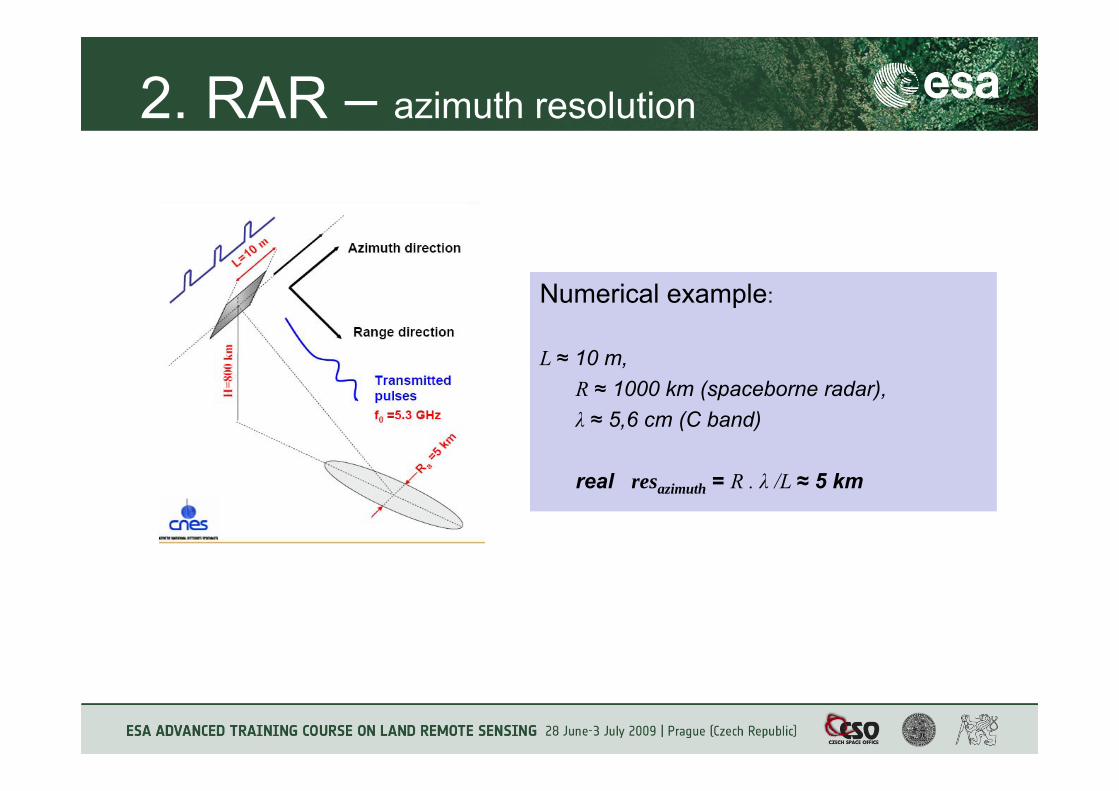
2. RAR – azimuth resolution
Numerical example:
L ≈ 10 m, R ≈ 1000 km (spaceborne radar), λ ≈ 5,6 cm (C band)
real resazimuth = R . λ /L ≈ 5 km
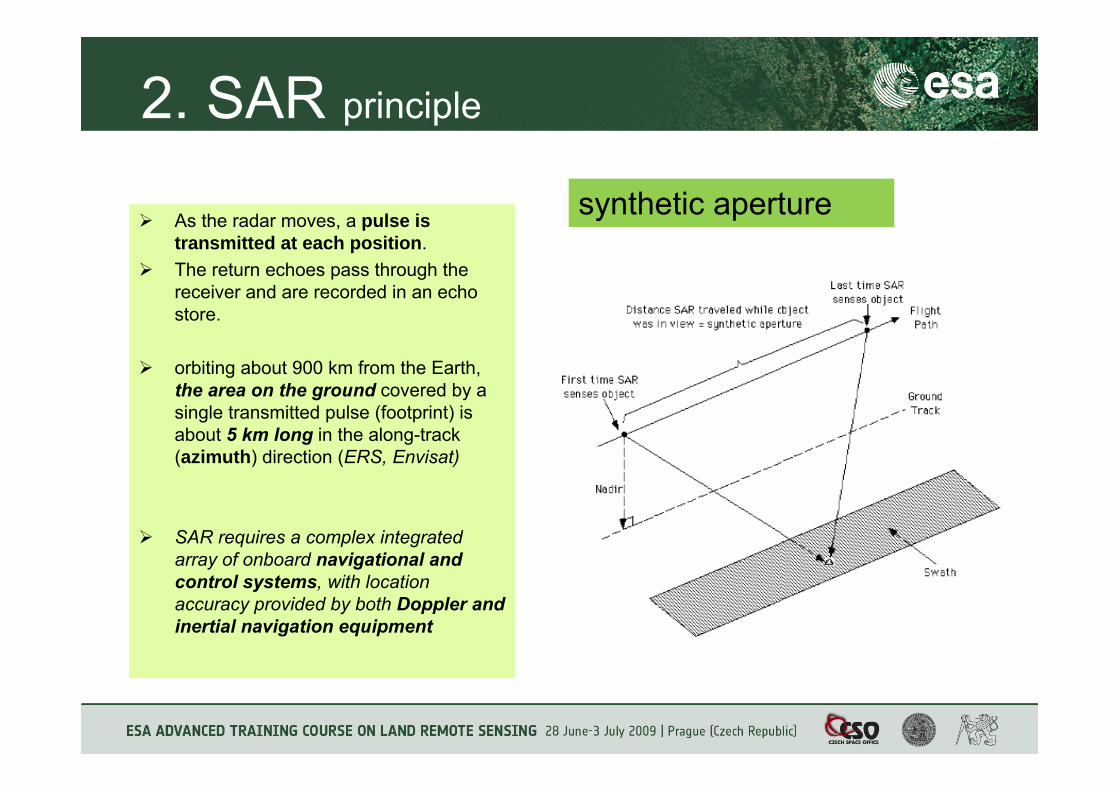
2. SAR principle
As the radar moves, a pulse is transmitted at each position. The return echoes pass through the receiver and are recorded in an echo store.
orbiting about 900 km from the Earth, the area on the ground covered by a single transmitted pulse (footprint) is about 5 km long in the along-track (azimuth) direction (ERS, Envisat)
SAR requires a complex integrated array of onboard navigational and control systems, with location accuracy provided by both Doppler and inertial navigation equipment
synthetic aperture
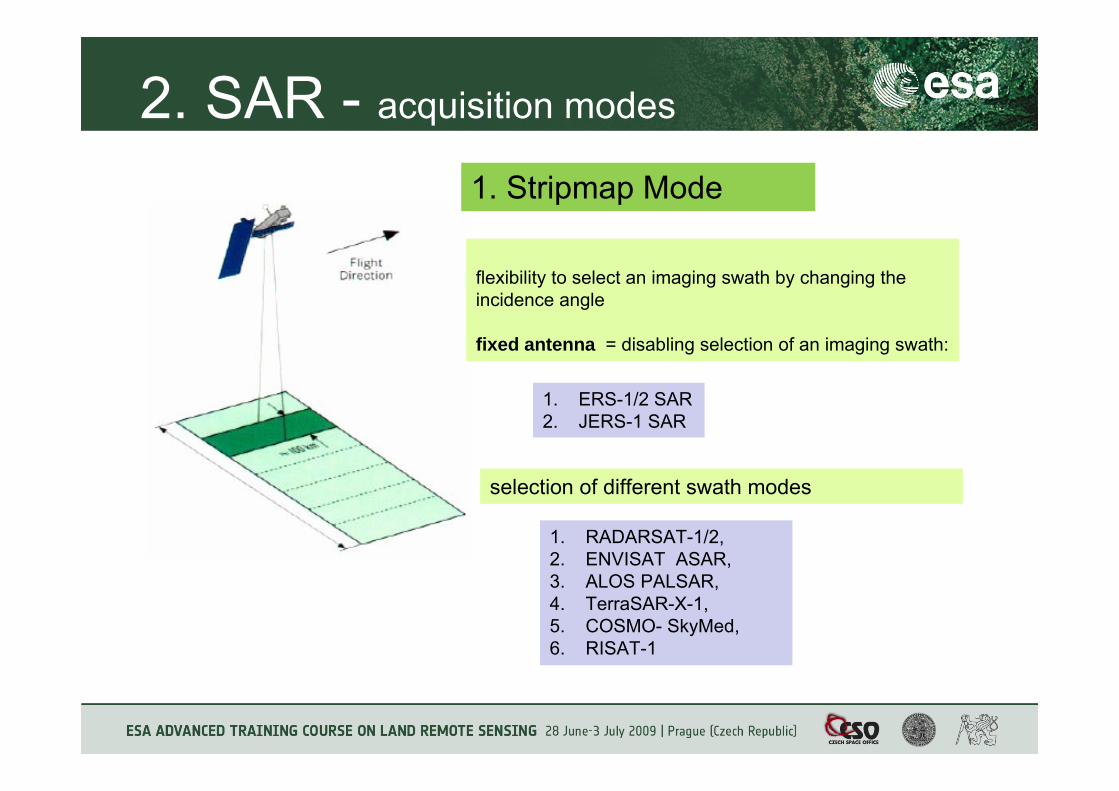
2. SAR - acquisition modes
flexibility to select an imaging swath by changing the incidence angle
fixed antenna = disabling selection of an imaging swath:
1. ERS-1/2 SAR 2. JERS-1 SAR
1. RADARSAT-1/2, 2. ENVISAT ASAR, 3. ALOS PALSAR, 4. TerraSAR-X-1, 5. COSMO- SkyMed, 6. RISAT-1
selection of different swath modes
1. Stripmap Mode
2. SAR - acquisition modes
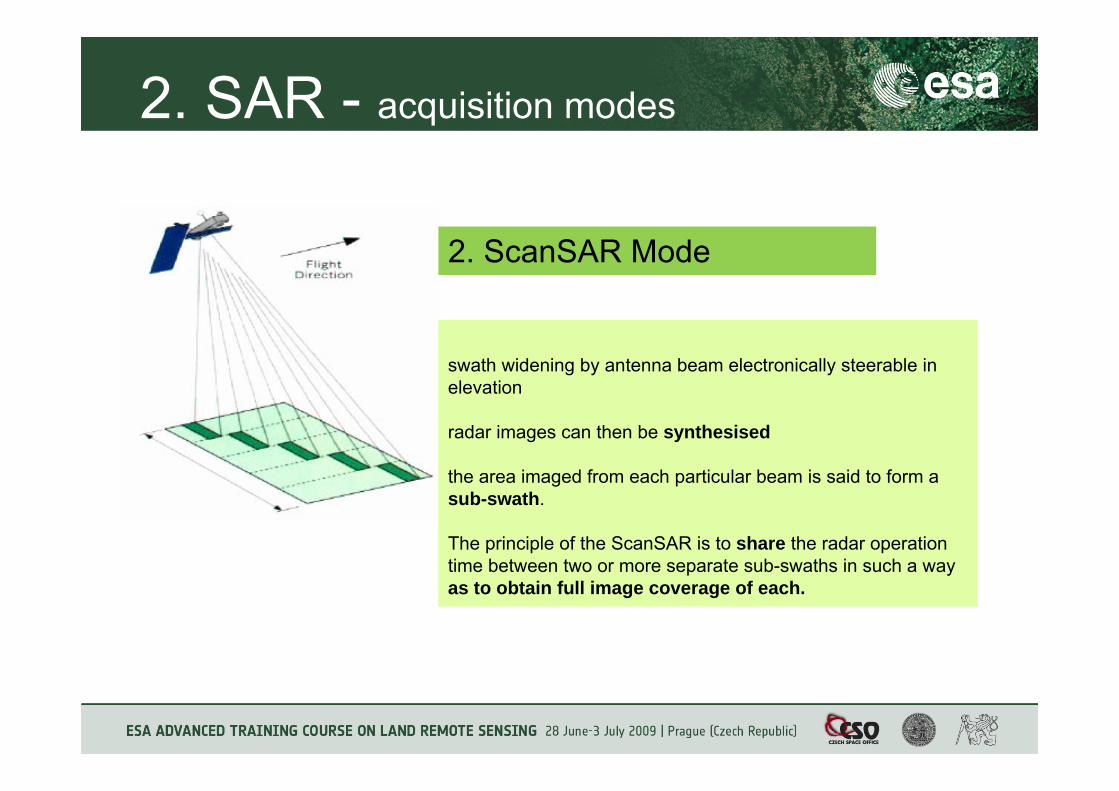
swath widening by antenna beam electronically steerable in elevation
radar images can then be synthesised
the area imaged from each particular beam is said to form a sub-swath.
The principle of the ScanSAR is to share the radar operation time between two or more separate sub-swaths in such a way as to obtain full image coverage of each.
2. ScanSAR Mode
2. SAR - acquisition modes
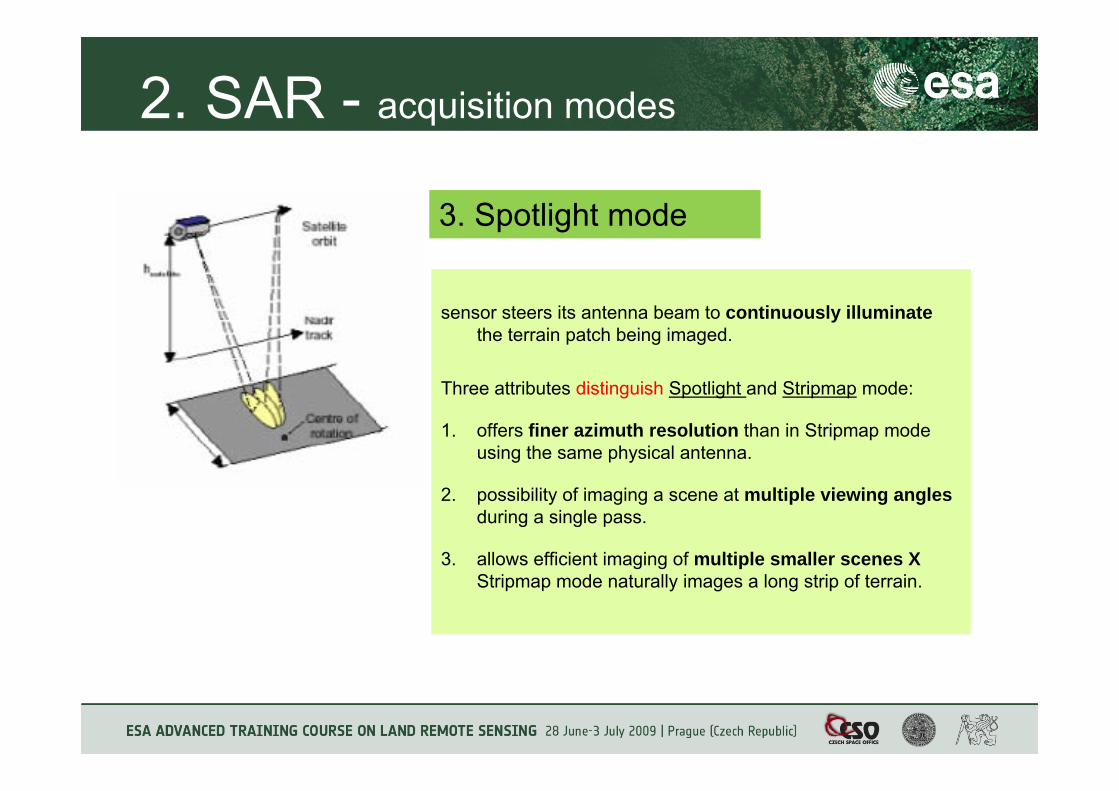
sensor steers its antenna beam to continuously illuminate the terrain patch being imaged.
Three attributes distinguish Spotlight and Stripmap mode:
1. offers finer azimuth resolution than in Stripmap mode using the same physical antenna.
2. possibility of imaging a scene at multiple viewing angles during a single pass.
3. allows efficient imaging of multiple smaller scenes X Stripmap mode naturally images a long strip of terrain.
3. Spotlight mode
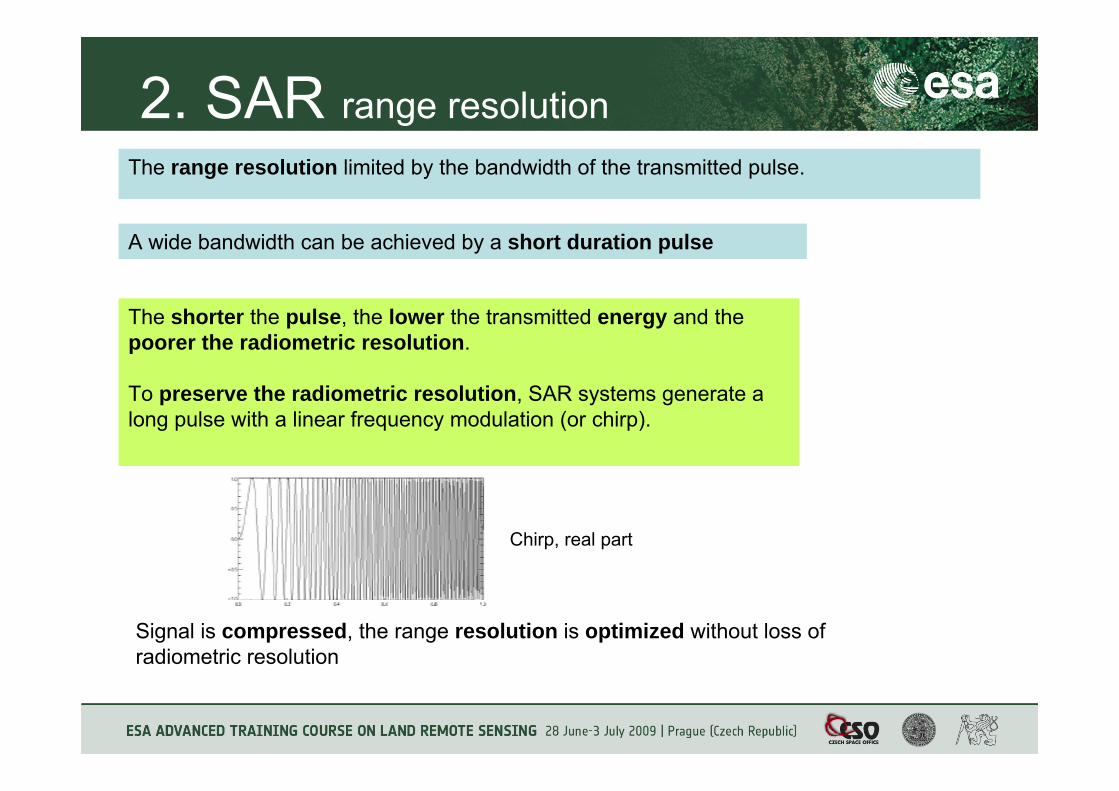
2. SAR range resolutionThe range resolution limited by the bandwidth of the transmitted pulse.
A wide bandwidth can be achieved by a short duration pulse
The shorter the pulse, the lower the transmitted energy and the poorer the radiometric resolution.
To preserve the radiometric resolution, SAR systems generate a long pulse with a linear frequency modulation (or chirp).
Chirp, real part
Signal is compressed, the range resolution is optimized without loss of radiometric resolution
2. SAR range resolution
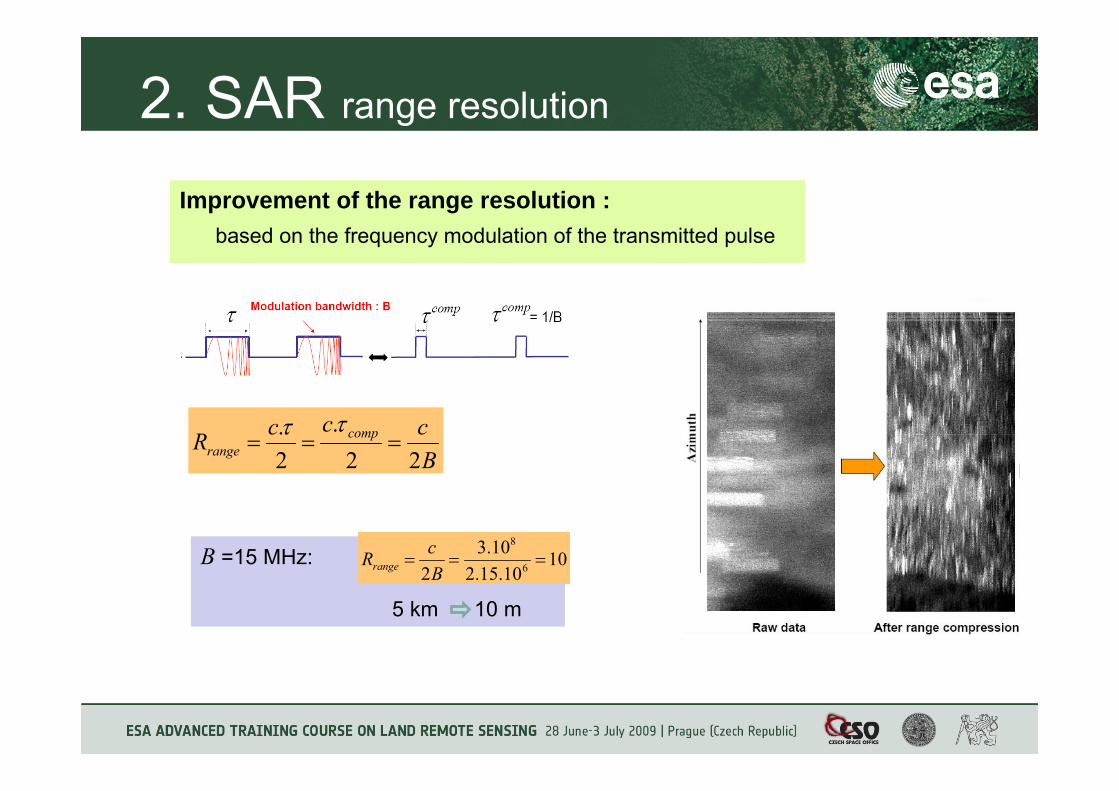
Improvement of the range resolution :based on the frequency modulation of the transmitted pulse
BcccR comp
range 22.
2.
===ττ
B =15 MHz:
5 km 10 m
1010.15.2
10.32 6
8
===BcRrange
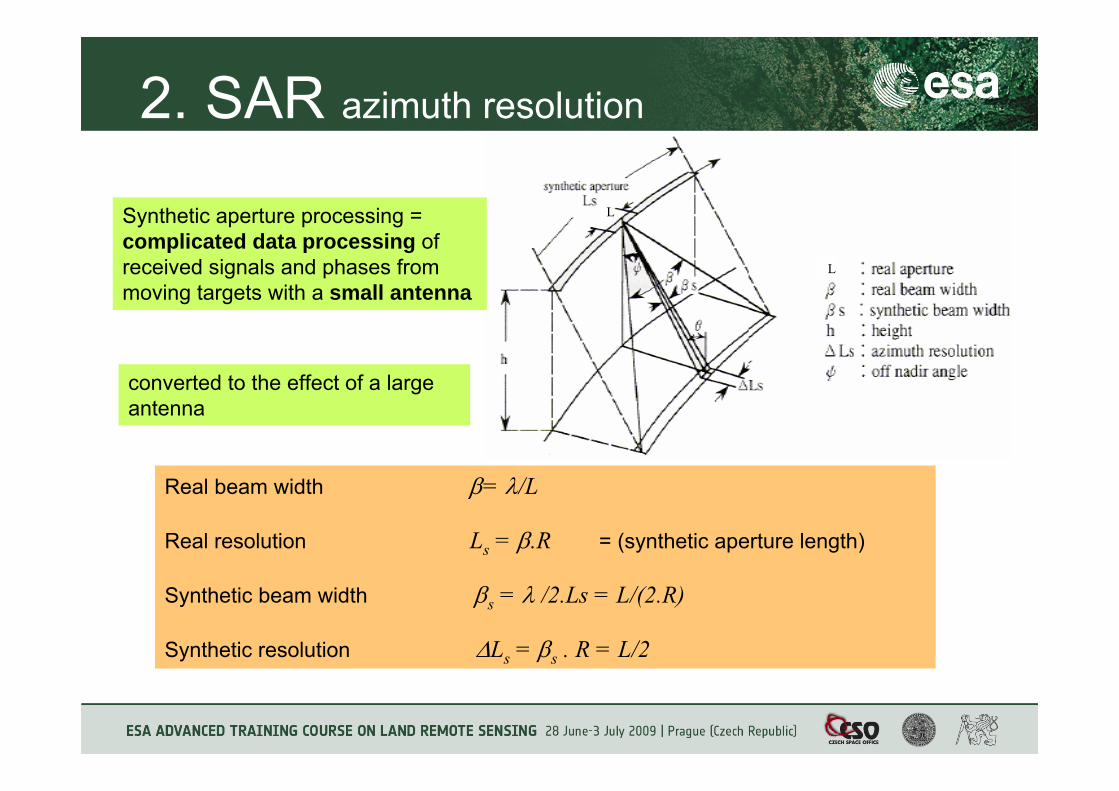
2. SAR azimuth resolution
Synthetic aperture processing =complicated data processing of received signals and phases from moving targets with a small antenna
converted to the effect of a large antenna
Real beam width β= λ/L
Real resolution Ls = β.R = (synthetic aperture length)
Synthetic beam width βs = λ /2.Ls = L/(2.R)
Synthetic resolution ΔLs = βs . R = L/2
L
L
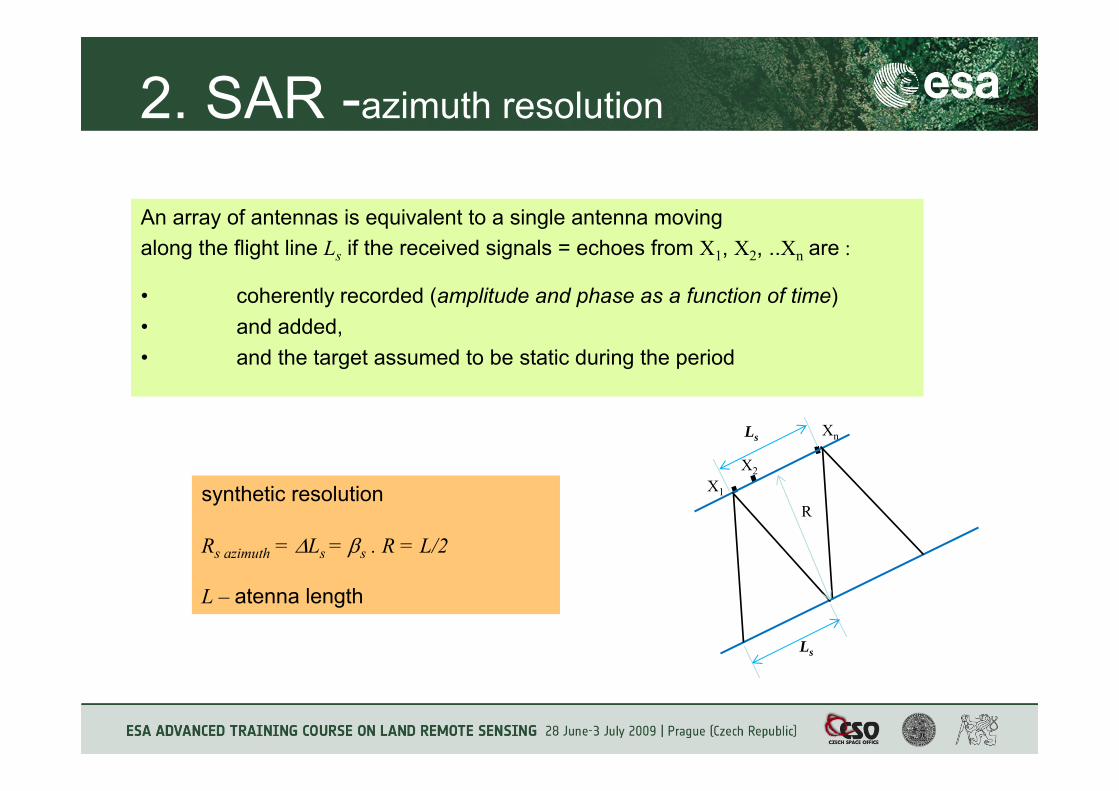
2. SAR -azimuth resolution
An array of antennas is equivalent to a single antenna movingalong the flight line Ls if the received signals = echoes from X1, X2, ..Xn are :
• coherently recorded (amplitude and phase as a function of time)• and added, • and the target assumed to be static during the period
X2X1
Xn
R
Ls
Ls
synthetic resolution
Rs azimuth = ΔLs = βs . R = L/2
L – atenna length
Lecture content
1. Introduction to radar remote sensing
2. Synthetic Aperture Radar
3. Geometric properties of SAR images
4. Scattering mechanisms
5. Statistic properties of SAR measurements
6. Physical content of SAR data
3. Geometric properties
weak reflection
image
shadow shadow shadow
foreshorteninglayover layover
Depression angle
Pulse direction
Steeper terrain imaged with layover
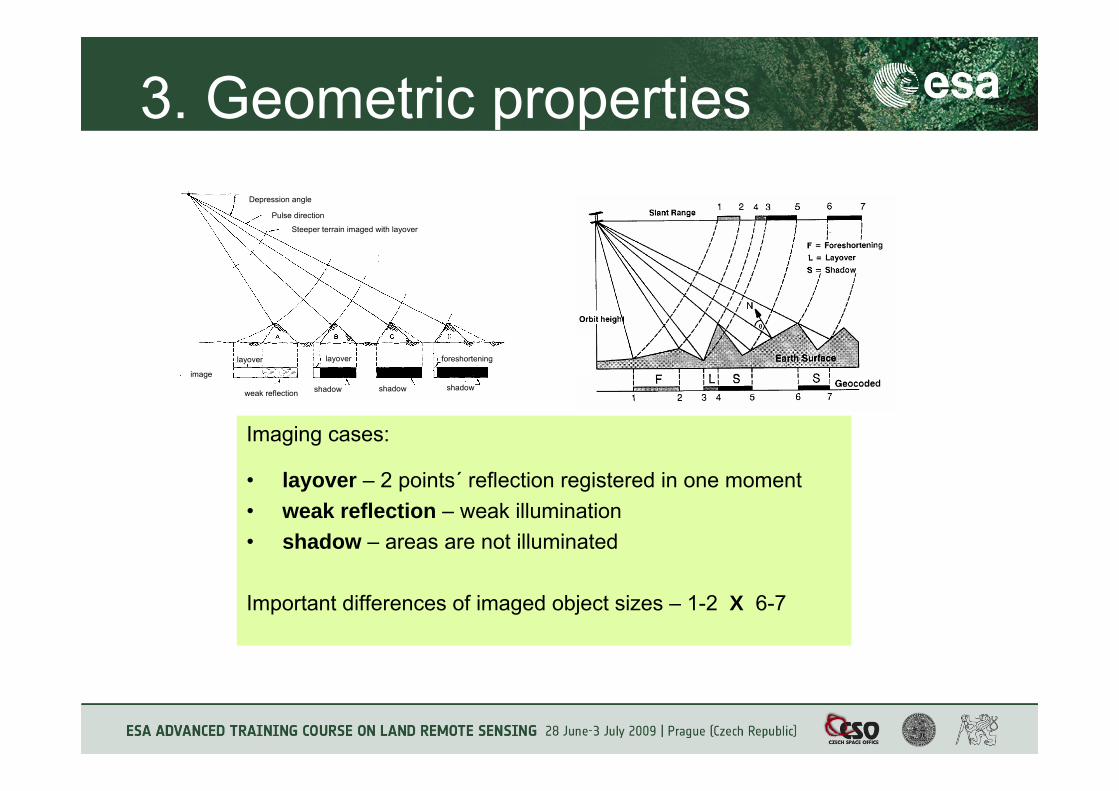
Imaging cases:
• layover – 2 points´ reflection registered in one moment• weak reflection – weak illumination• shadow – areas are not illuminated
Important differences of imaged object sizes – 1-2 X 6-7
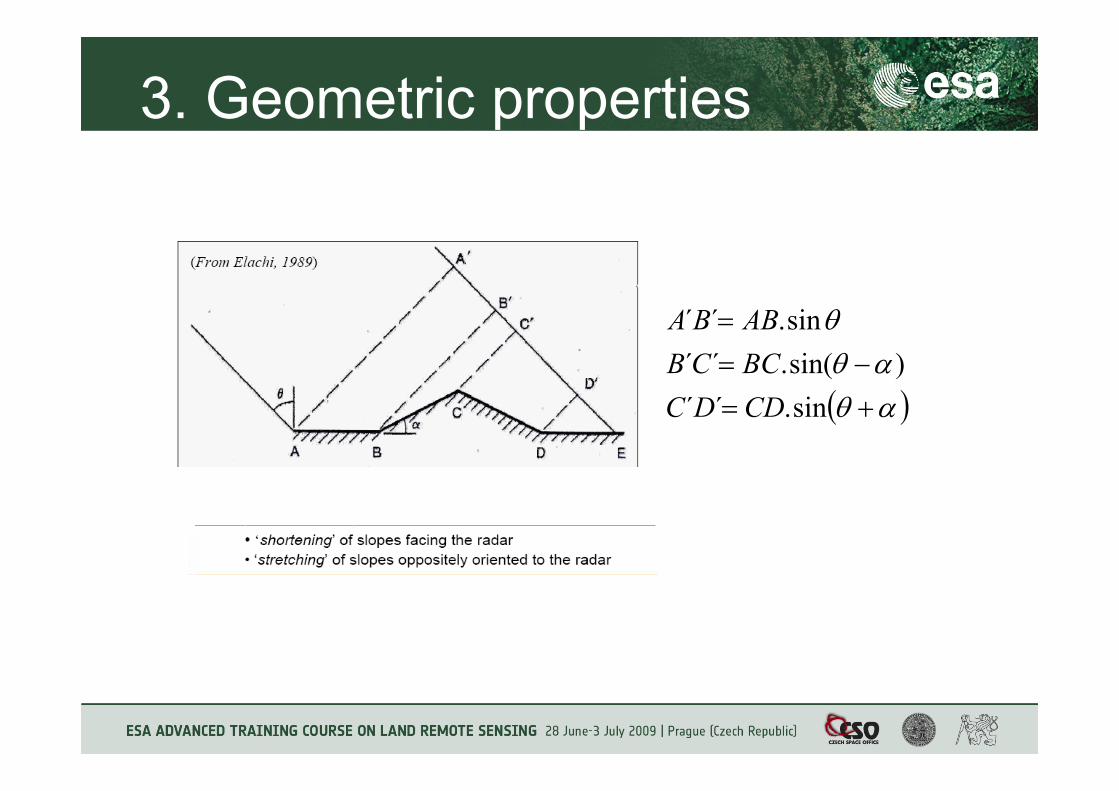
3. Geometric properties
( )αθαθ
θ
+=−=
=
sin.´´)sin(.´´
sin.´´
CDDCBCCBABBA
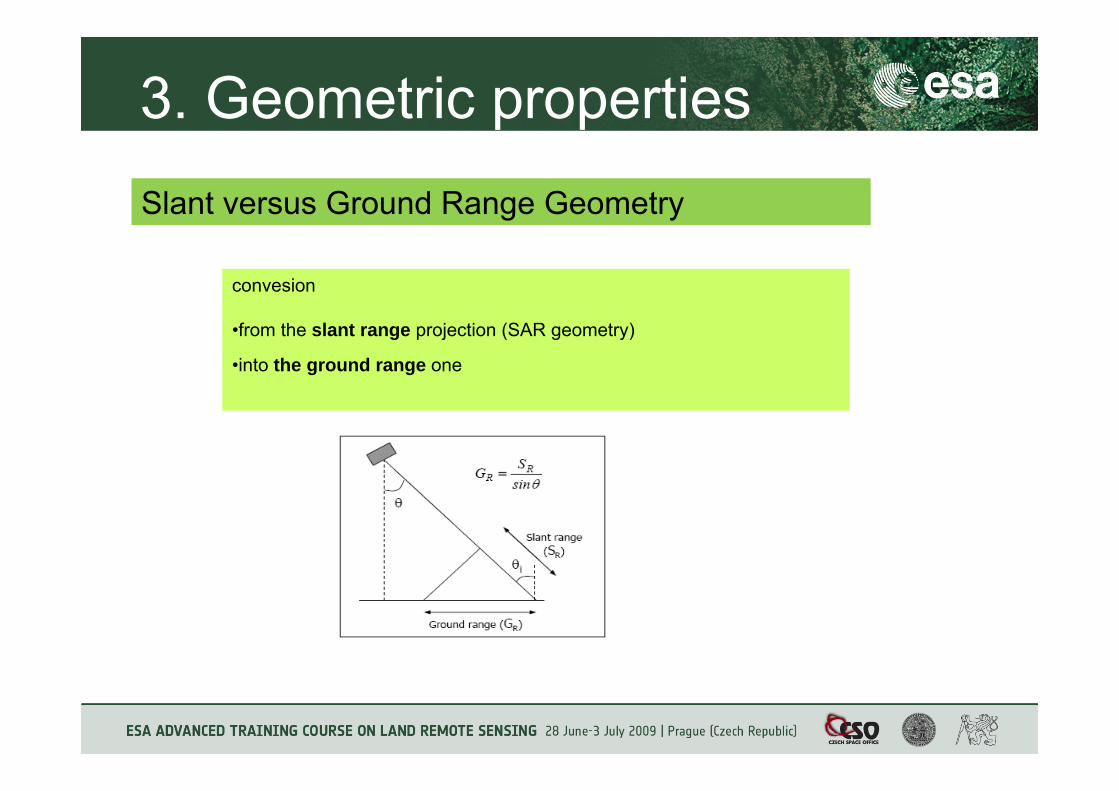
3. Geometric propertiesSlant versus Ground Range Geometry
convesion
•from the slant range projection (SAR geometry)
•into the ground range one
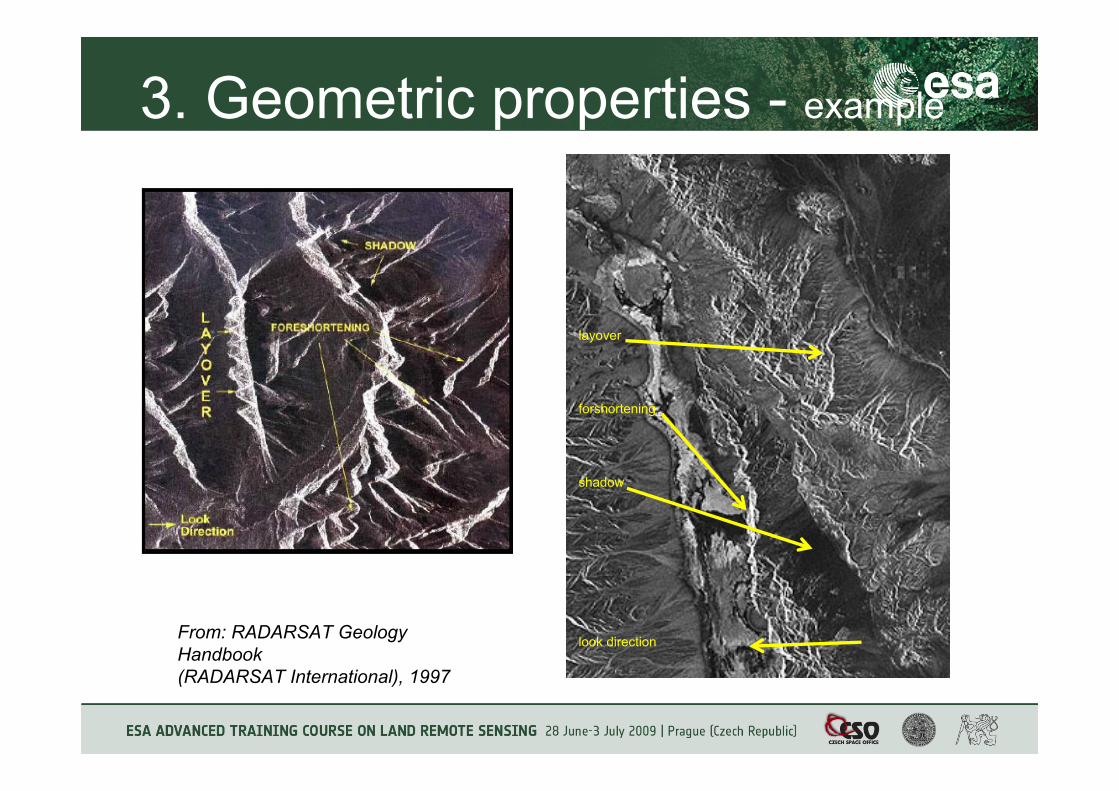
3. Geometric properties - example
layover
forshortening
shadow
look directionFrom: RADARSAT GeologyHandbook(RADARSAT International), 1997
Lecture content
1. Introduction to radar remote sensing
2. Synthetic Aperture Radar
3. Geometric properties of SAR images
4. Scattering mechanisms
5. Statistic properties of SAR measurements
6. Physical content of SAR data
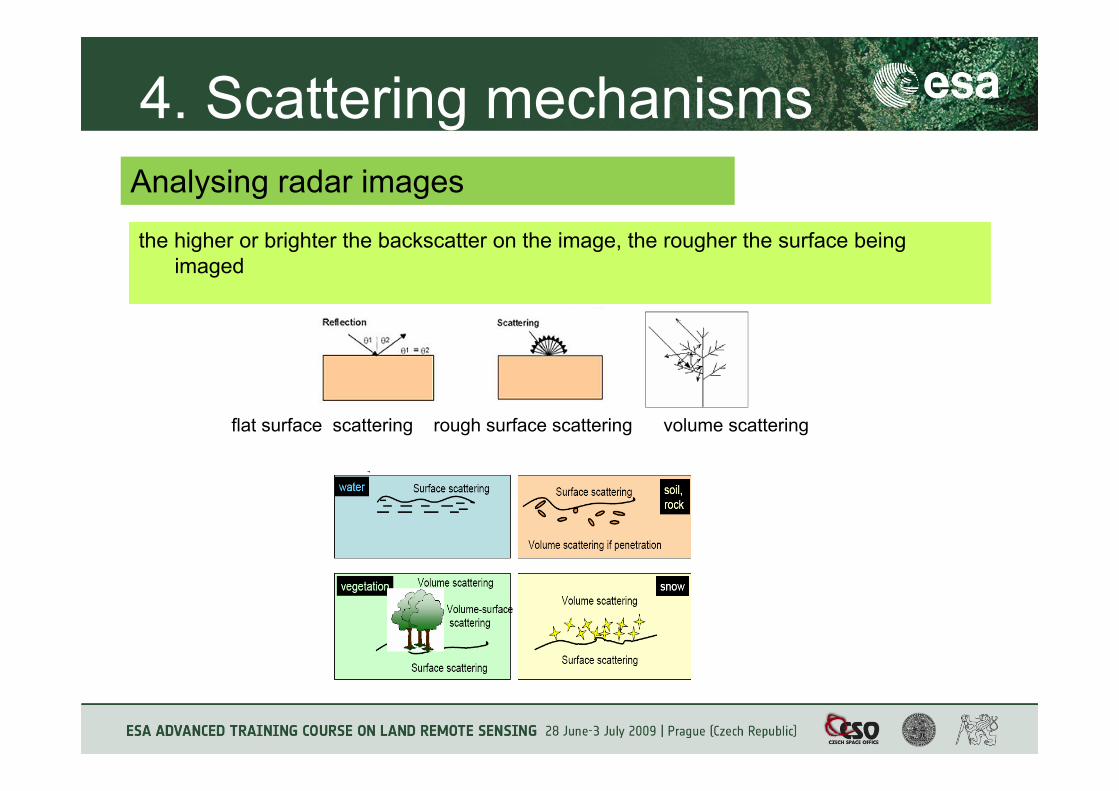
4. Scattering mechanisms
the higher or brighter the backscatter on the image, the rougher the surface being imaged
flat surface scattering rough surface scattering volume scattering
Analysing radar images
4. Scattering mechanisms
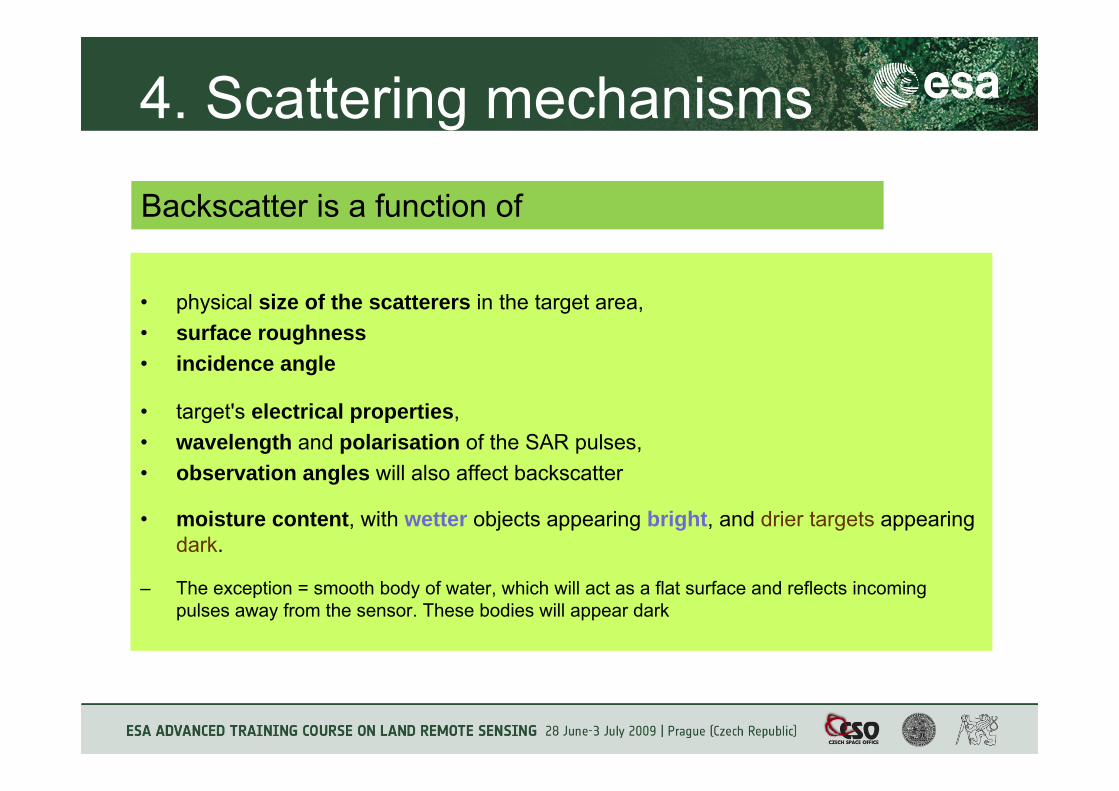
• physical size of the scatterers in the target area, • surface roughness• incidence angle
• target's electrical properties,• wavelength and polarisation of the SAR pulses,• observation angles will also affect backscatter
• moisture content, with wetter objects appearing bright, and drier targets appearing dark.
– The exception = smooth body of water, which will act as a flat surface and reflects incoming pulses away from the sensor. These bodies will appear dark
Backscatter is a function of
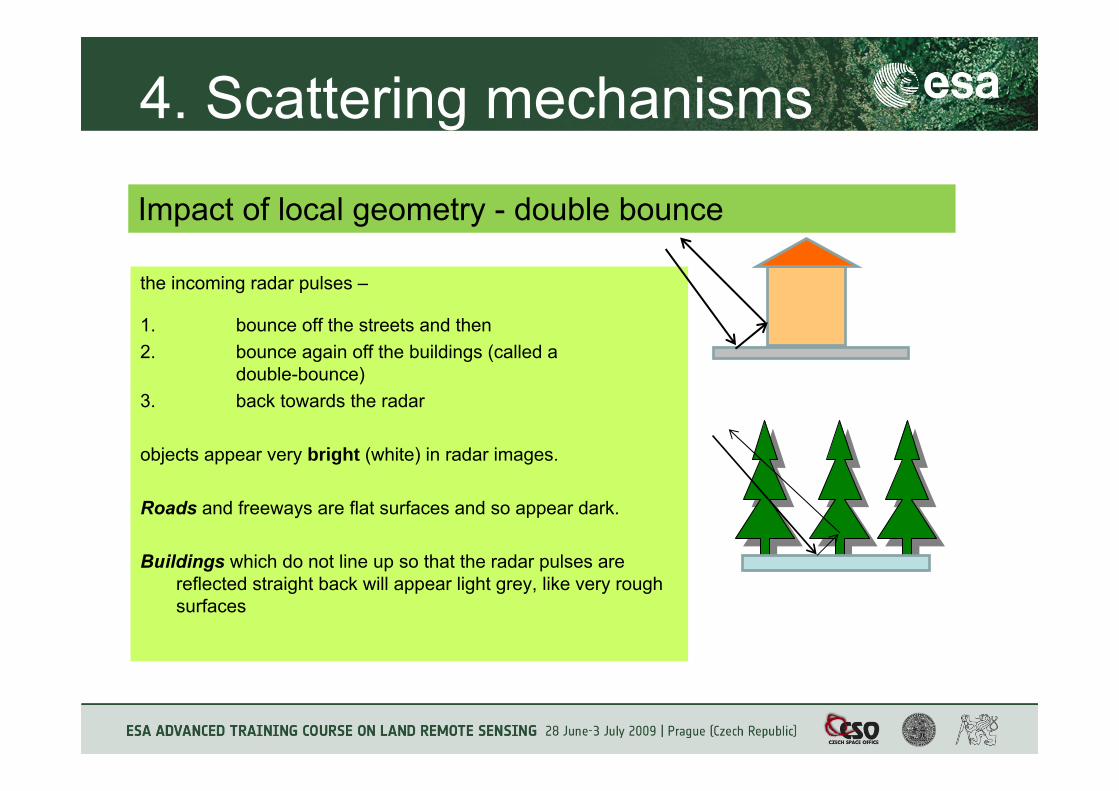
4. Scattering mechanisms
the incoming radar pulses –
1. bounce off the streets and then 2. bounce again off the buildings (called a
double-bounce) 3. back towards the radar
objects appear very bright (white) in radar images.
Roads and freeways are flat surfaces and so appear dark.
Buildings which do not line up so that the radar pulses are reflected straight back will appear light grey, like very rough surfaces
Impact of local geometry - double bounce
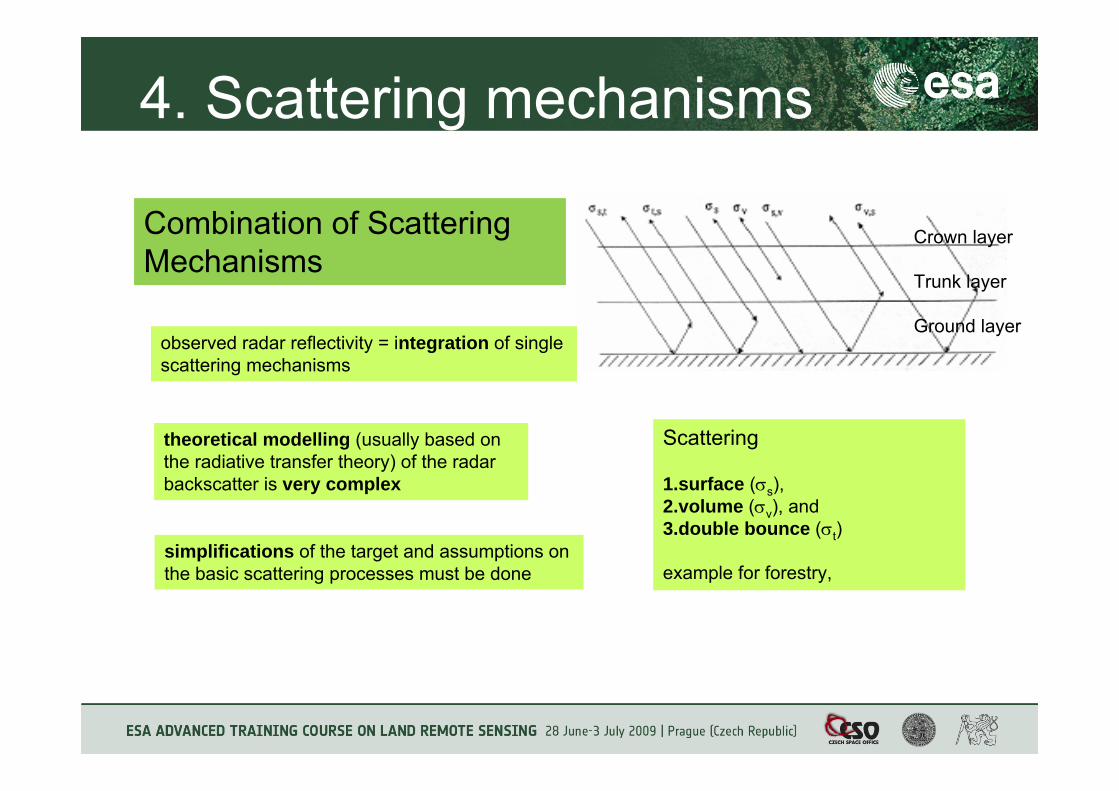
4. Scattering mechanisms
observed radar reflectivity = integration of single scattering mechanisms
Scattering
1.surface (σs), 2.volume (σv), and3.double bounce (σt)
example for forestry, simplifications of the target and assumptions on the basic scattering processes must be done
theoretical modelling (usually based on the radiative transfer theory) of the radar backscatter is very complex
Crown layer
Trunk layer
Ground layer
Combination of Scattering Mechanisms
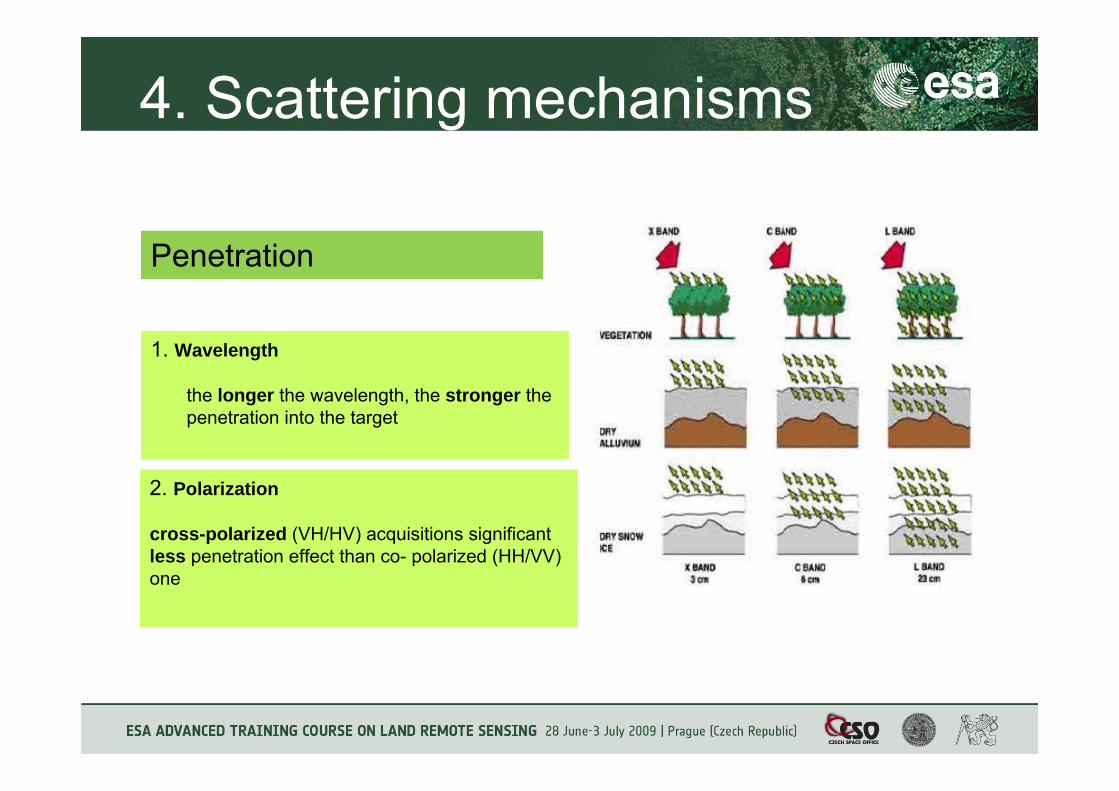
4. Scattering mechanisms
1. Wavelength
the longer the wavelength, the stronger the penetration into the target
2. Polarization
cross-polarized (VH/HV) acquisitions significant less penetration effect than co- polarized (HH/VV) one
Penetration
4. Scattering mechanisms
high dielectric constant (80):metal and water
low dielectric constant (3 to 8):dry conditions
Dielectric Properties
wetness of soils or vegetated surfaces can produce a notable increase in radar signal reflectivity
dielectric constant of moistened soil from approximately 2.5 (dry) to 25 to 30 (saturated conditions)
soil moisture from the backscattering coefficient limited to the use of polarimetric and dual frequency (C-, L-band) SAR sensors, in order to separate the effect of soil roughness and moisture
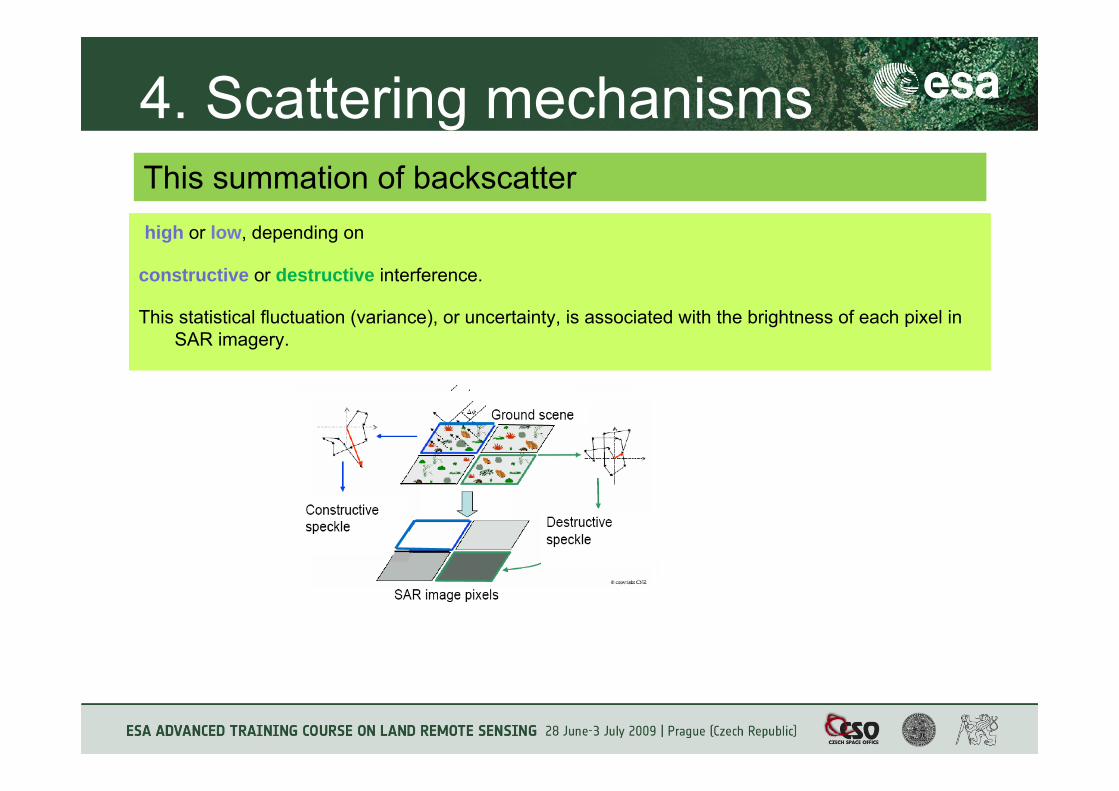
4. Scattering mechanisms
high or low, depending on
constructive or destructive interference.
This statistical fluctuation (variance), or uncertainty, is associated with the brightness of each pixel in SAR imagery.
This summation of backscatter
4. Scattering mechanisms
transforming SAR signal data into actual imagery –
1. focusing process
2. multi-look processing = non-coherent averaging
3. speckle filtering: still inherent speckle in SAR image data - reduced through adaptive image restoration techniques.
Unlike system noise, speckle is a real electromagnetic measurement, which is exploited in particular in SAR interferometry (InSAR)
Speckle
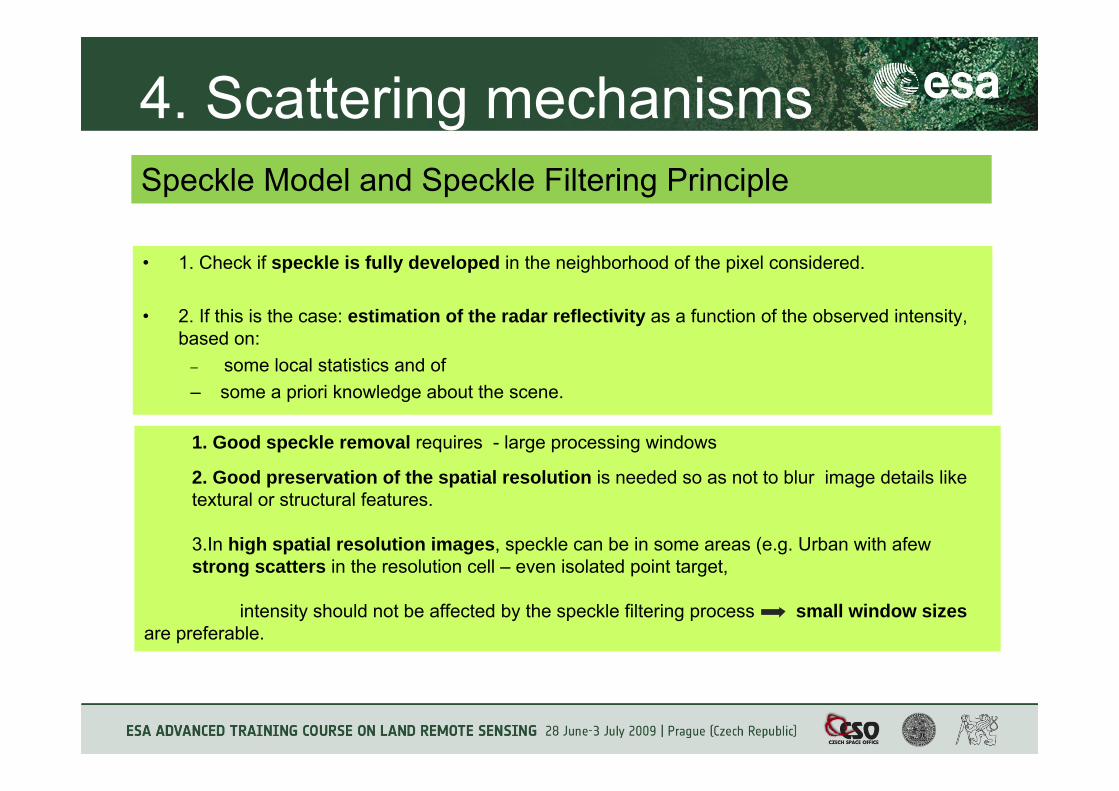
1. Good speckle removal requires - large processing windows
2. Good preservation of the spatial resolution is needed so as not to blur image details like textural or structural features.
3.In high spatial resolution images, speckle can be in some areas (e.g. Urban with afew strong scatters in the resolution cell – even isolated point target,
intensity should not be affected by the speckle filtering process small window sizes are preferable.
4. Scattering mechanisms
• 1. Check if speckle is fully developed in the neighborhood of the pixel considered.
• 2. If this is the case: estimation of the radar reflectivity as a function of the observed intensity, based on:
– some local statistics and of – some a priori knowledge about the scene.
Speckle Model and Speckle Filtering Principle
4. Scattering mechanisms
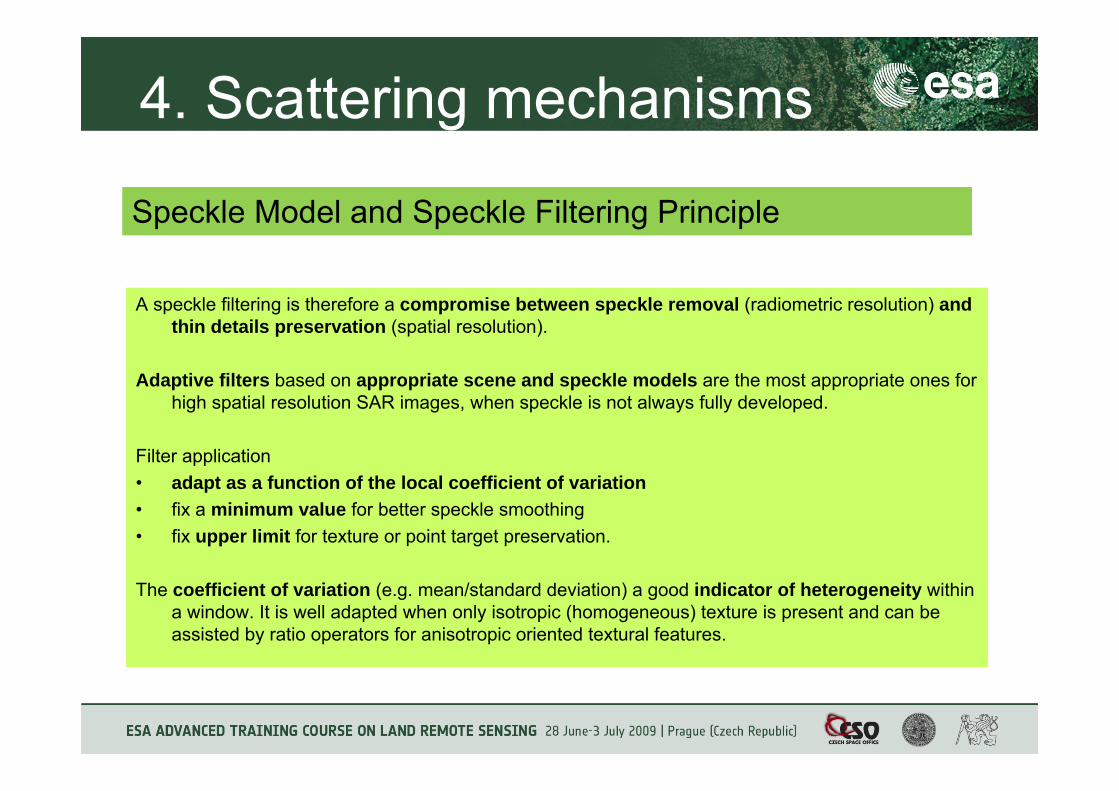
A speckle filtering is therefore a compromise between speckle removal (radiometric resolution) and thin details preservation (spatial resolution).
Adaptive filters based on appropriate scene and speckle models are the most appropriate ones for high spatial resolution SAR images, when speckle is not always fully developed.
Filter application• adapt as a function of the local coefficient of variation • fix a minimum value for better speckle smoothing• fix upper limit for texture or point target preservation.
The coefficient of variation (e.g. mean/standard deviation) a good indicator of heterogeneity within a window. It is well adapted when only isotropic (homogeneous) texture is present and can be assisted by ratio operators for anisotropic oriented textural features.
Speckle Model and Speckle Filtering Principle
4. Scattering mechanisms
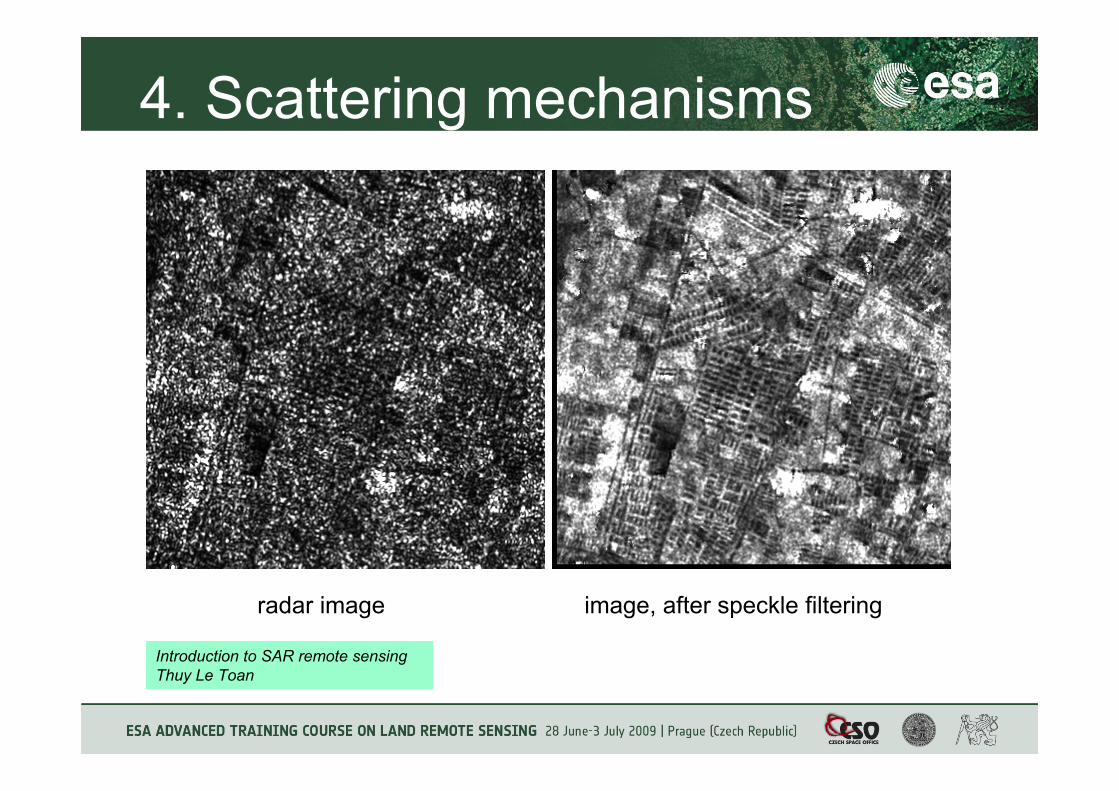
radar image image, after speckle filtering
Introduction to SAR remote sensing Thuy Le Toan
Lecture content
1. Introduction to radar remote sensing
2. Synthetic Aperture Radar
3. Geometric properties of SAR images
4. Scattering mechanisms
5. Statistic properties of SAR measurements
6. Physical content of SAR data
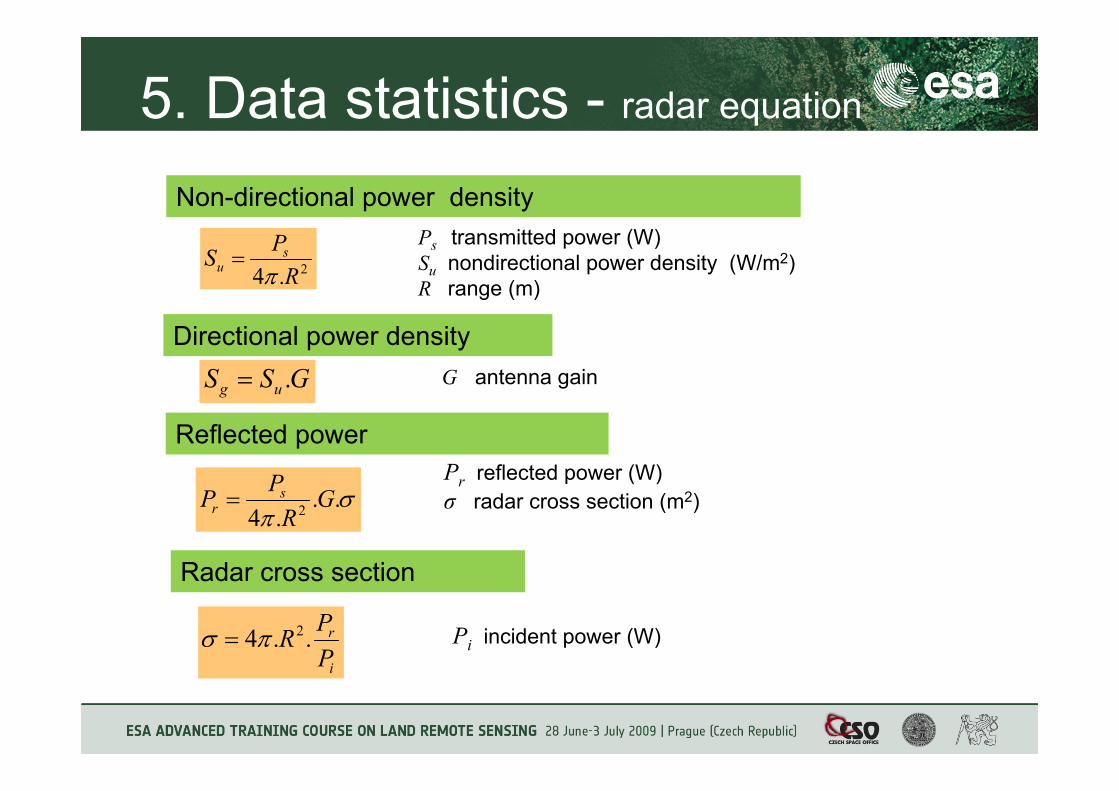
5. Data statistics - radar equation
2.4 RPS s
u π=
Non-directional power densityPs transmitted power (W)Su nondirectional power density (W/m2)R range (m)
GSS ug .=
Directional power densityG antenna gain
Reflected power
σπ
...4 2 GR
PP sr =
Pr reflected power (W)σ radar cross section (m2)
i
r
PPR ..4 2πσ =
Radar cross section
Pi incident power (W)
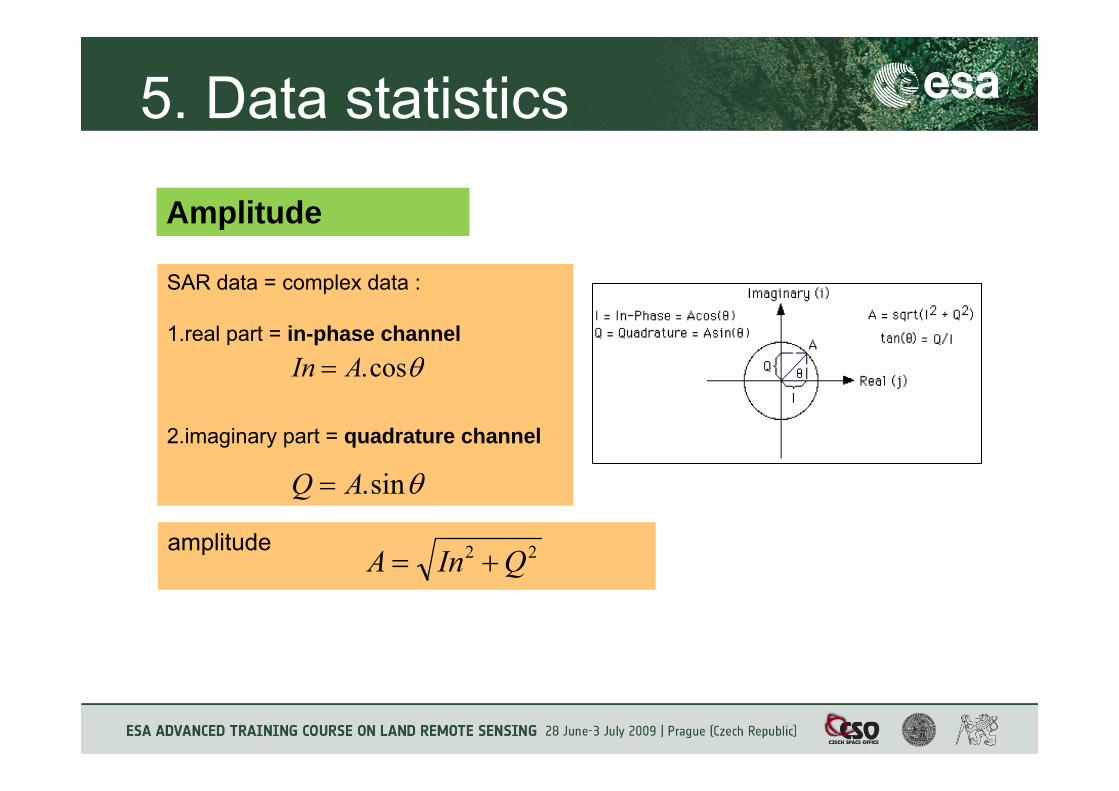
5. Data statistics
Amplitude
SAR data = complex data :
1.real part = in-phase channel
2.imaginary part = quadrature channel
amplitude
θcos.AIn =
θsin.AQ =
22 QInA +=
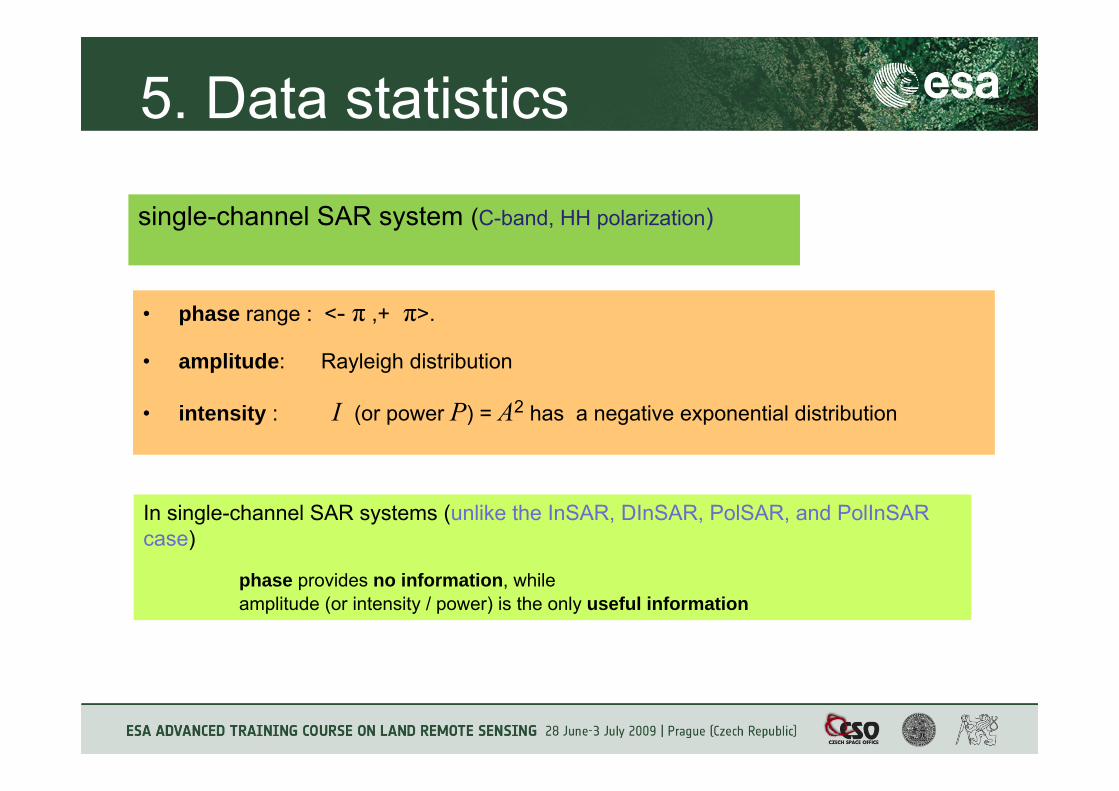
5. Data statistics
• phase range : <- π ,+ π>.
• amplitude: Rayleigh distribution
• intensity : I (or power P) = A2 has a negative exponential distribution
In single-channel SAR systems (unlike the InSAR, DInSAR, PolSAR, and PolInSAR case)
phase provides no information, while amplitude (or intensity / power) is the only useful information
single-channel SAR system (C-band, HH polarization)
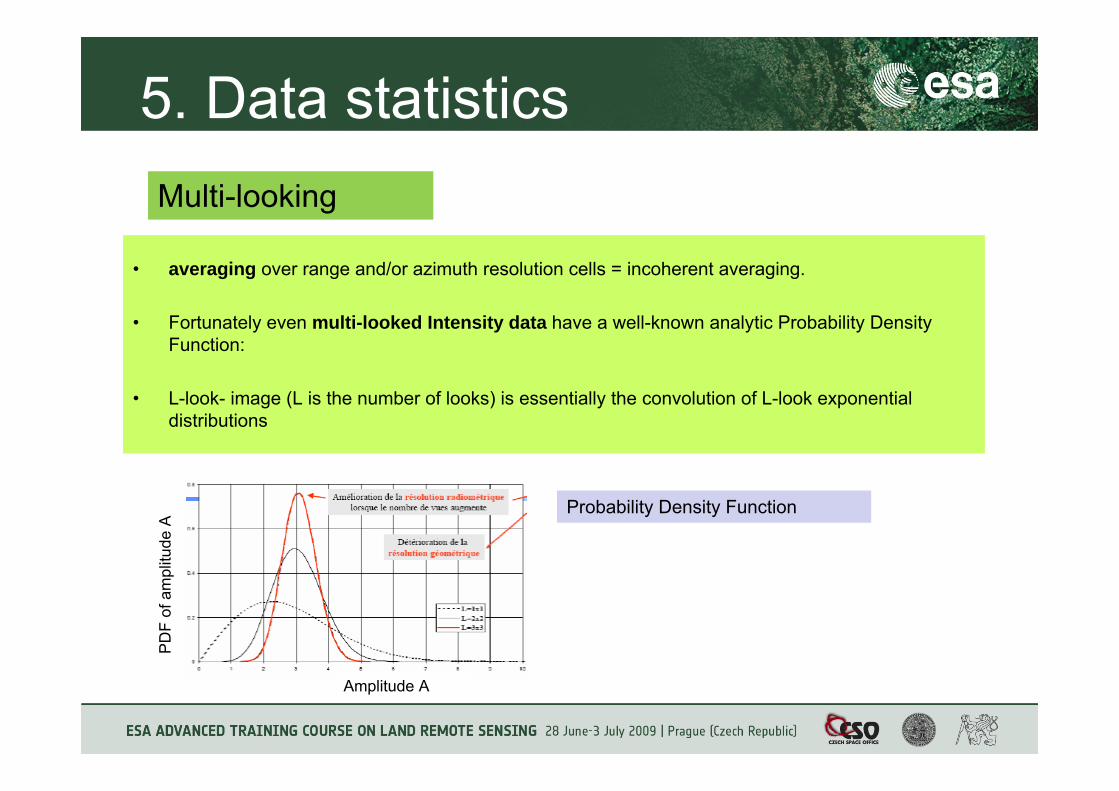
5. Data statistics
• averaging over range and/or azimuth resolution cells = incoherent averaging.
• Fortunately even multi-looked Intensity data have a well-known analytic Probability Density Function:
• L-look- image (L is the number of looks) is essentially the convolution of L-look exponential distributions
Multi-looking
Probability Density Function
PD
F of
am
plitu
de A
Amplitude A
Lecture content
1. Introduction to radar remote sensing
2. Synthetic Aperture Radar
3. Geometric properties of SAR images
4. Scattering mechanisms
5. Statistic properties of SAR measurements
6. Physical content of SAR data
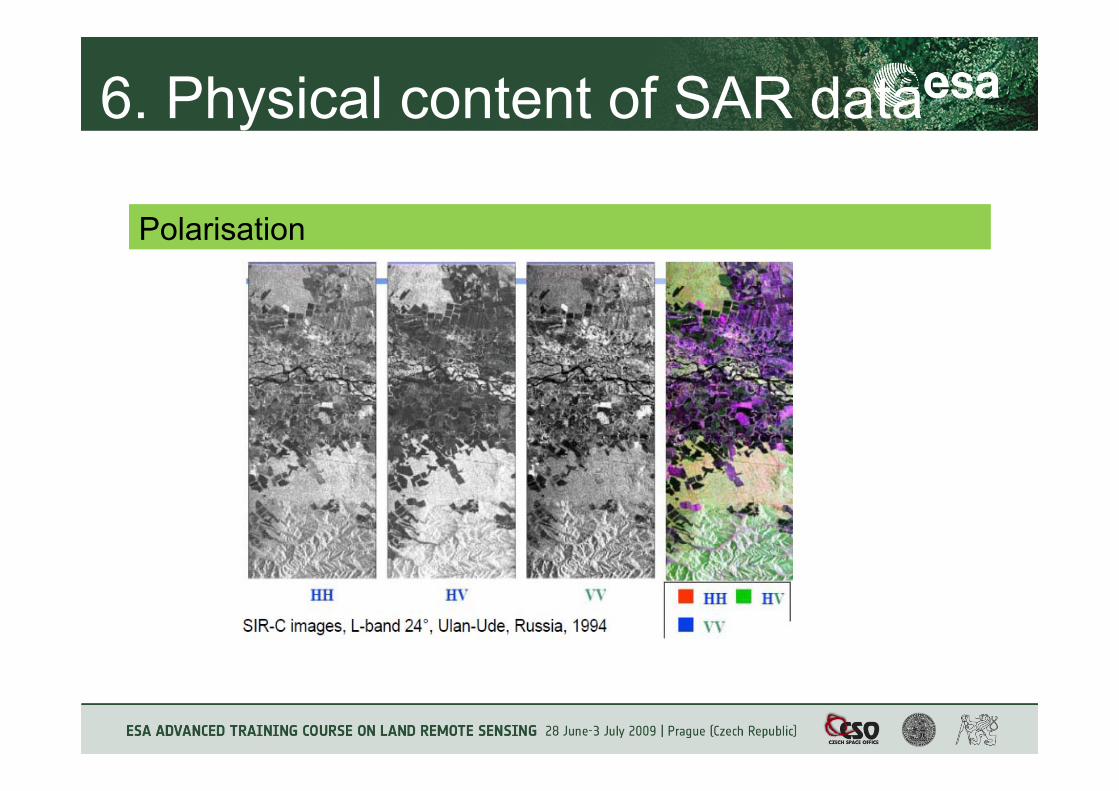
6. Physical content of SAR data
Polarisation
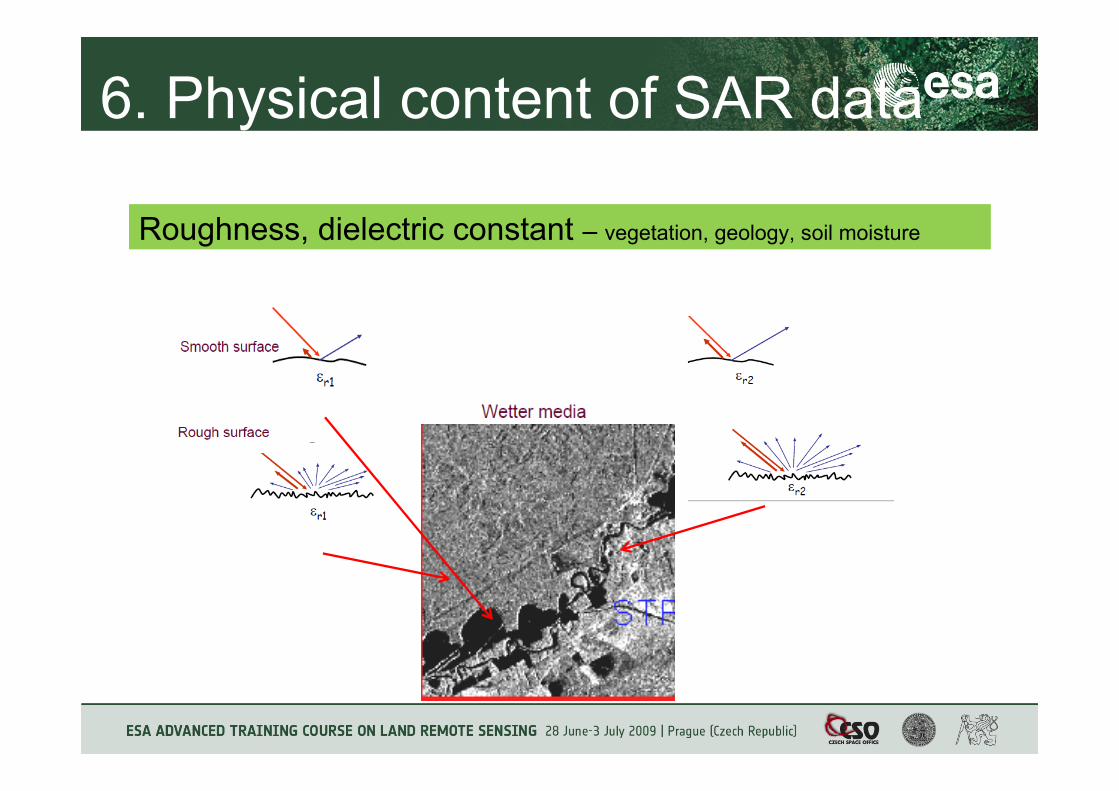
6. Physical content of SAR data
Roughness, dielectric constant – vegetation, geology, soil moisture
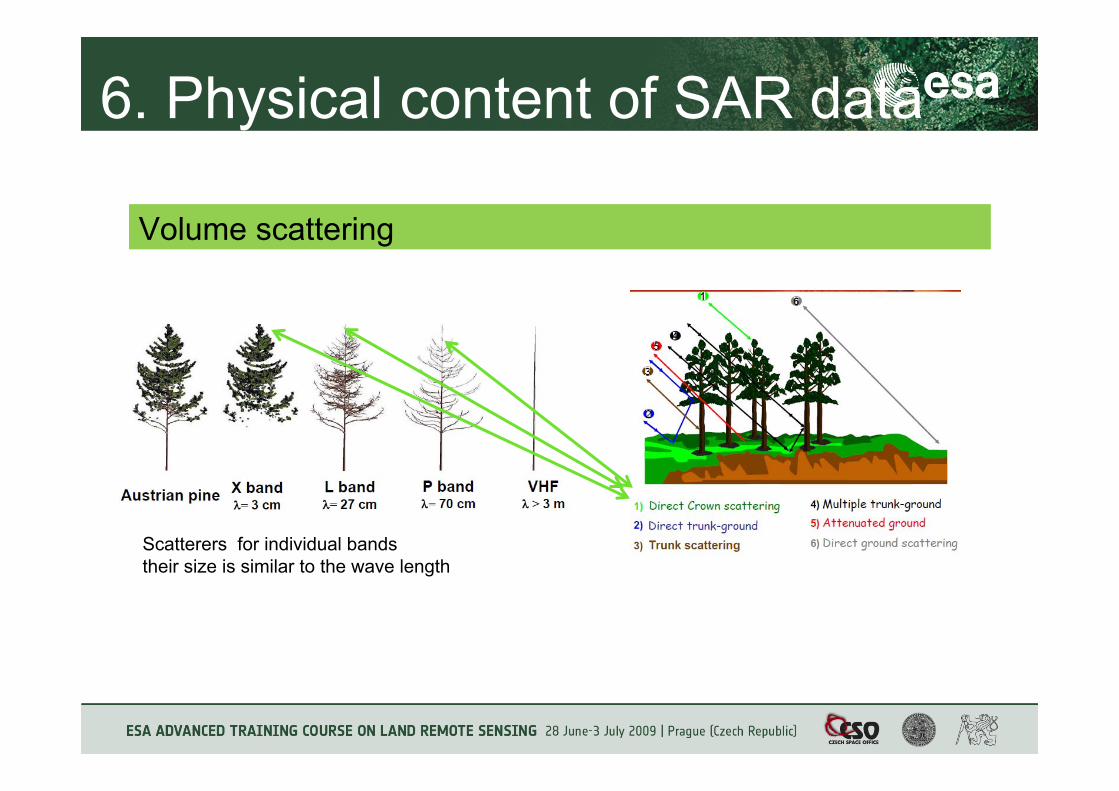
6. Physical content of SAR data
Volume scattering
Scatterers for individual bandstheir size is similar to the wave length
6. Physical content of SAR data
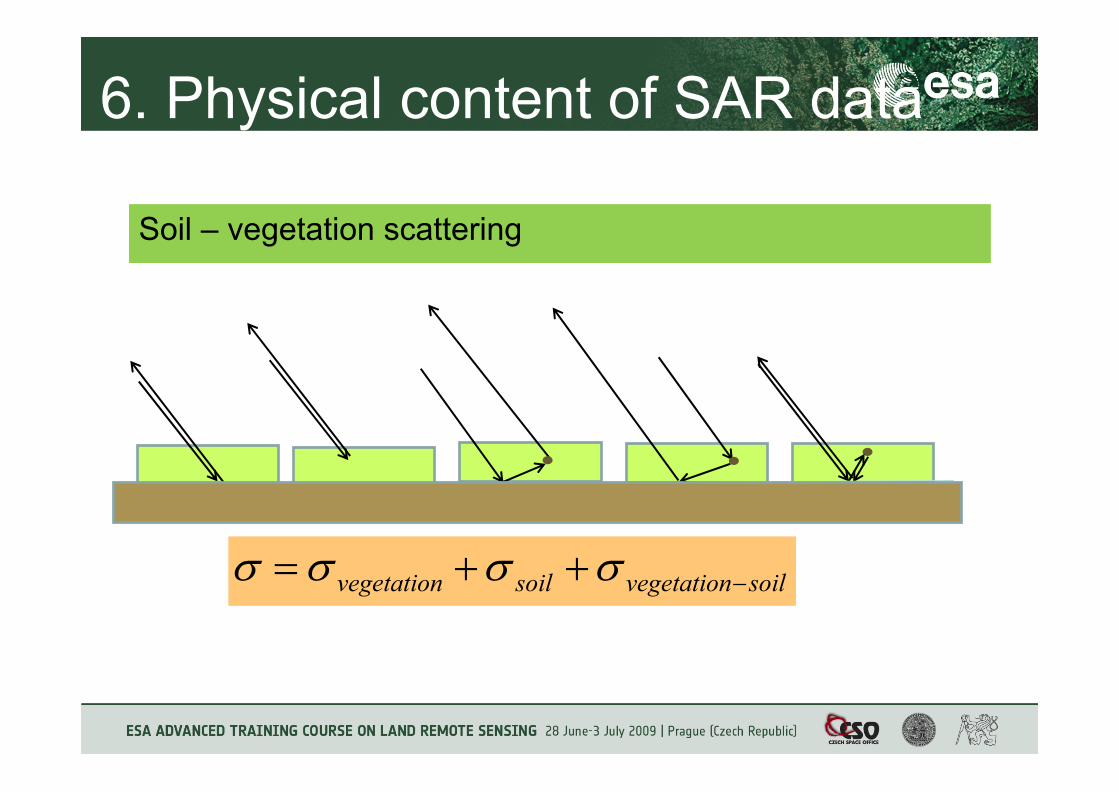
Soil – vegetation scattering
soilvegetationsoilvegetation −++= σσσσ
6. Physical content of SAR data
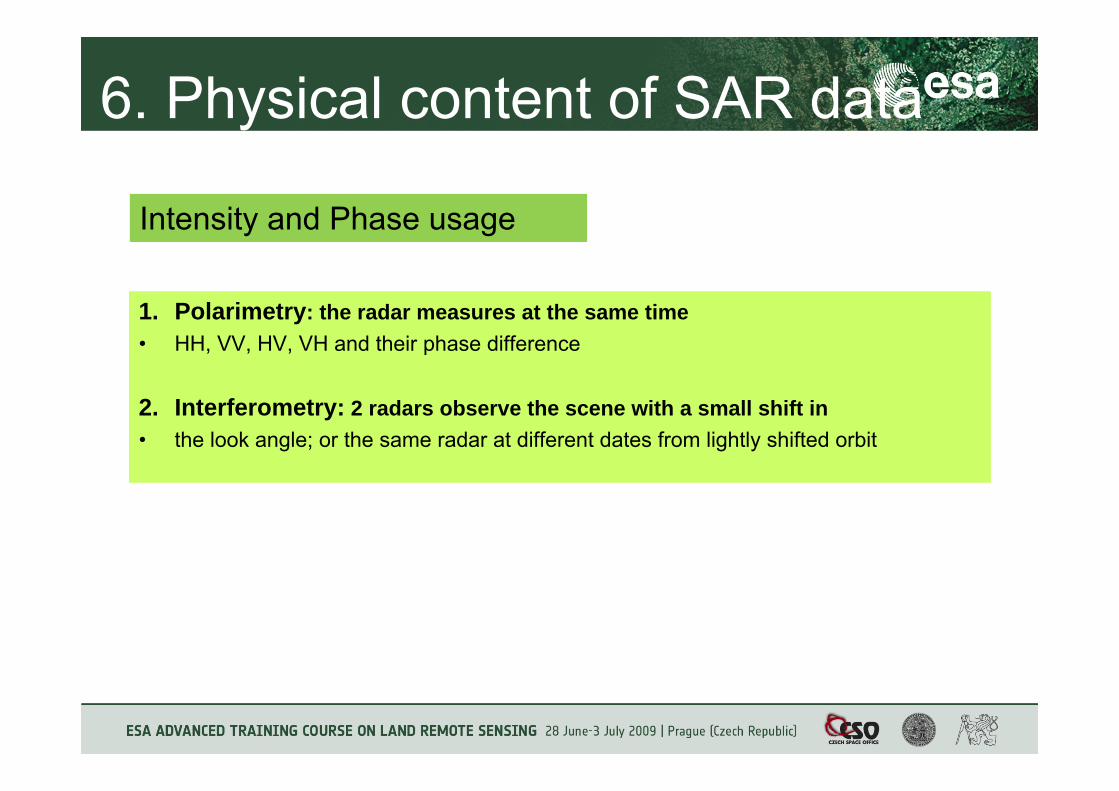
1. Polarimetry: the radar measures at the same time• HH, VV, HV, VH and their phase difference
2. Interferometry: 2 radars observe the scene with a small shift in• the look angle; or the same radar at different dates from lightly shifted orbit
Intensity and Phase usage