likelihood of future drought hazard: …€¦ · improved assessment of climate change impact on...
TRANSCRIPT
Technical Report No.11
LIKELIHOOD OF FUTURE DROUGHT HAZARD: SELECTED EUROPEAN CASE STUDIES
Henny A.J. van Lanen, Marcel A.A. Alderlieste, Anne van der Heijden, Dionysis Assimacopoulos, Susana Dias, Lukas Gudmundsson, David Haro Monteagudo, Joaquín Andreu, Carlo Bifulco, Francisco Gero, Javier Paredes and Abel Solera March 2013; Revised July 2013

Technical Report No.11 - ii -
DROUGHT-R&SPI (Fostering European Drought Research and Science-Policy Interfacing) is a Collaborative Project funded by the European Commission under the FP7 Cooperation Work Programme 2011, Theme 6: Environment (including Climate Change, ENV.2011.1.3.2-2: Vulnerability and increased drought risk in Europe (Grant agreement no: 282769). The DROUGHT-R&SPI project started 01/10/2011 and will continue for 3 years.
Title: Likelihood of future drought hazards: selected European case studies
Authors: Henny A.J. van Lanen, Marcel A.A. Alderlieste, Anne van der Heijden, Dionysis Assimacopoulos, Susana Dias, Lukas Gudmundsson, David Haro Monteagudo, Joaquín Andreu, Carlo Bifulco, Francisco Gero, Javier Paredes and Abel Solera
Organisations: Wageningen Universiteit Instituto Superior de Agronomia Lisbon Eidgenössische Technische Hochschule Zürich Universidad Polytechnica de Valencia National Technical University of Athens
Submission date: March 2013; July 2013 Revised version
Function: This report is an output from Work Package 2 Drought vulnerability assessment and risk reduction at different scales: Development of Case Studies, task 2.1 Quantitative analysis of historic droughts. It also supports Work Package 1 Drought as a natural Hazard, Task 1.1 Quantitative analysis of historic large-scale droughts in Europe.
Deliverable This report contributes DROUGHT-R&SPI deliverable D2.4 Likelihood of future drought hazards – case study scale.
Photos: 2003 drought, sunflower field France (photo Henny van Lanen) Change average drought duration (all DROUGHT-R&SPI Case Study areas) taken from a multi-
model set of large-scale models for the intermediate and far future.

Technical Report No.11 - iii -
Acknowledgement This report is the outcome of the joint effort of all DROUGHT-R&SPI participants working on the Case Studies. In addition to the DROUGHT-R&SPI project, the research contributes to the programme of the Wageningen Institute for Environment and Climate Research (WIMEK-SENSE) and it supports the work of the UNESCO-IHP VII EURO-FRIEND programme. The report is complementary to DROUGHT-R&SPI Technical Report No. 11. It summarises the previous report, which is based upon the WATCH data, and it adds through information on climate change on drought derived from local information. The authors thank Graham Weedon (UK MetOffice) for supplying the WATCH forcing data. We further thank the large-scale modelers for providing model results, i.e. Doug Clark (Centre for Ecology and Hydrology, Wallingford, United Kingdom), Simon Gosling (School of Geography, The University of Nottingham, Nottingham, United Kingdom), Sandra Gomes (Centro de Geofisica da Universidade de Lisboa, Portugal), Jens Heinke (Potsdam Institute for Climate Impact Research, Potsdam, Germany), Tobias Stacke (Terrestrial Hydrology Group, Max Planck Institute for Meteorology, Hamburg, Germany) and Frank Voss (Center for Environmental Systems Research, University of Kassel, Kassel, Germany). The authors also want to thank Claudia Vezzani (Po River Water Authority, Parma, Italy) for providing information. Dario Musolino and Alessandro de Carli (UB-CERTeT) made contacts with the Po River Water Authority possible.
Wageningen, July 2013
1 Alderlieste, M.A.A., and Van Lanen, H.A.J. (2013): Change in future low flow and drought in selected European areas derived from WATCH GCM Forcing Data and simulated multi-model runoff. DROUGHT-R&SPI Technical Report No. 5, 316 pg.

Technical Report No.11 - iv -
Abstract In this study on future meteorological drought, future low flow and hydrological drought (i.e. drought in flow or runoff), two different sources were used for each of the six DROUGHT-R&SPI case study areas: (i) local hydrometeorological data (projections for future), and (ii) hydrometeorological data from the EU-FP6 WATCH project, incl. climate re-analysis data (i.e. WATCH Forcing Data, WFD), data from three GCMs (historic and future periods) for the A2 and B1 emission scenarios, simulated runoff from five large-scale hydrological models (GHMs) using WFD and GCM forcing (historic and future periods). The local data are more fine-tuned to each of the case study areas, but are hard to intercompare because the variety of methods that have been used to predict future drought in the study areas. The WATCH data (WFD, GCM and GHMs forced with WFD and GCMs) were used in this study to investigate the impact of climate change outcome that was obtained with a consistent method, which allowed intercomparison of climate change outcome for the case study areas and comparison with local data. Local meteorological data clearly predict an increase of the temperature in the 21st century in all six case study areas. This varies from 1-2oC in the Netherlands to about 3.4-5.5 oC in the Mediterranean. This is supported by the down-scaled and bias-corrected climate output from the three GCMs that was derived from the WATCH project. Local data on predicted precipitation change is more uncertain. This is in line with the precipitation data derived from the WATCH data. In more than 50% of the cases (i.e. case study areas, emission scenarios, intermediate and far future, 2021-2050 and 2071-2100) the three GCMs did not completely agree on the direction of the change. The highest uncertainty was found for the Netherlands and the B1 scenario for the intermediate future (2021-2050) for all case study areas. Changes in precipitation can be up to tens of per cent, dependent on the location and scenario. The uncertainty in the forcing data, in particular the precipitation, propagates into the river flow or runoff for each of the case study areas and the associated hydrological drought characteristics (duration, deficit volume). This could not be supported with local data for all case study areas because future flow or runoff data were not available. In general, projections suggest a reduction of flow in the case study areas, although this depends which flow characteristic was analyzed. In the Netherlands, the direction of the projected change in annual flow is unclear, whereas it is likely that low or summer flow will decrease (e.g. for the Rhine and Meuse the predicted decrease of summer flows is up to 30-40%). In other case study areas the impact of snow and glaciers (Switzerland, Po River basin) on future flow is uncertain. The analyses with the WATCH outcome for the control period (1971-2000) showed that the impact of climate change on flows simulated with the GHM-GCM model combinations is larger than the spread due to inadequacies in GCM’ forcing in only 45% of the cases. This applies to the impact of the A2 scenario. For the B2 scenario this is not more than 28 and 38% of the cases for the intermediate and far future, respectively. The WATCH GHM-GCM model combinations also showed that the projected impact of climate change on hydrological drought duration and drought deficit volume is more robust for all case study areas than for flow characteristics. Model outcome spread due to forcing uncertainty is substantially smaller than the projected impact of climate change. In 87% of the cases the predicted increase in average drought duration is larger than the model spread. For the drought deficit volume it is even for 96% of the cases. The magnitude of increase in average hydrological drought duration and deficit volume for a case study depends as expected on the GCM forcing, the scenario and the future time period. For instance, in the Jucar River Basin, the average drought duration is projected to increase by about 40-90% for the intermediate future and about 130-165% for the far future (A2 scenario, 2 GCMs). For the B1 scenario the increase is smaller, i.e. 25-50% and 75-90%, respectively. The predicted increase in deficit volume is usually larger (often >100%) than for the duration because of the rather small magnitude of the deficit volume in the control period, which is the reference period.

Technical Report No.11 - v -
Table of Contents Page Abstract
1. Introduction 1
2. Data and methodology to identify future low flows and drought 3 2.1. DROUGHT-R&SPI Case Study areas 3 2.2. WATCH data 4
2.2.1. Meteorological data: reanalysis data ..4 2.2.2. Meteorological data: GCM data 4 2.2.3. Runoff data: large-scale models 5 2.2.4. Selected cells 6
2.3. Drought identification method 6 2.3.1. Low flow characteristics 6 2.3.2. Drought: threshold method 7
2.4. Determination of change 8
3. Analysis of future drought using local hydrometeorological data and methods ..9 3.1 Júcar River basin 9 3.2 The Netherlands 11 3.3 Po River basin 15 3.4 Portugal 16 3.5 Switzerland 19 3.6 Syros 20
4 Analysis of future drought using WATCH data and approaches 22
4.1 Júcar River basin 22 4.2 The Netherlands 24 4.3 Po River basin 26 4.4 Portugal 28 4.5 Switzerland 30 4.6 Syros 32
5 Discussion and Concluding remarks 35
References 39 Annexes 43

Technical Report No.11 - 1 -
1. Introduction On a global scale drought is one of the most severe natural hazards with large environmental and socio-economic impacts, which need to receive more attention to be better prepared for the future water, food and energy security (Tallaksen and Van Lanen, 2004; Sheffield and Wood, 2011; Romm 2011; Van Vliet et al. 2012). The recent droughts in Russia and Central United States (NOAA, 2012) were the most severe on the record. The 2011 drought in the Horn of Africa, affected million people and caused large famine. In Europe almost 80 000 people over the period 1998-2009 died due to drought-related heat waves and forest fires (EEA 2010). Seneviratne et al. (2012) report that there is medium confidence that since the 1950s some regions of the world have experienced longer and more severe droughts (e.g. southern Europe) and that droughts will intensify in the 21st century in some seasons and areas (e.g. many European regions), as result of climate change. Lack of long, updated time series of observed hydrological data (e.g. Hannah et al. 2011; Stahl et al. 2012), multiple definitions and drought-generating processes (e.g. Van Loon and Van Lanen 2013a), and the incapability of models to include all these processes (e.g. Gudmundsson et al. 2011; Haddeland et al. 2011; Prudhomme et al. 2011) impede to achieve strong confidence in the assessment of past and future drought across the world. High-impact large-scale droughts, like the recent droughts in Russia, United States and Africa, show the need to improve the understanding of droughts on a continental scales, particularly to come to an improved assessment of climate change impact on drought. Global Circulation Models (GSMs) are used to assess the impact of climate change. The GCM’ outcome usually is downscaled and bias corrected to generate time series of future weather data that can be used as input for hydrological models. These hydrological models can be either comprehensive when used for river basin-scale studies or coarse when applied to continental scales. At large scales, Global Hydrological Models (GHMs) are used to produce time series of future runoff, which are then used for hydrological drought assessment (frequency, scale, duration, severity). Recently, the WATCH2 (WATer and global CHange) project concluded a comprehensive multi-model analysis (e.g. Haddeland et al. 2011) that tested GHM’ performance against historic low runoff (e.g. Gudmundsson et al. 2011; Stahl et al. 2012) and drought (e.g. Prudhomme et al. 2011). Corzo-Perez et al. (2011) made a first attempt to use the outcome from the WATCH model suite to assess future hydrological drought (three GCMs, two scenarios, multiple hydrological models). The DROUGHT-R&SPI project considers future impacts and vulnerability on different scales (pan-European, national and local). Case studies are being carried out at the national scale (Portugal, Switzerland, The Netherlands) and more detailed per river basin (Júcar, Po) and even on the local scale (Syros). Policies responses on drought are identified and risk mitigation options are defined per case study area. Assessment of impacts, vulnerabilities, policy responses and risk mitigations options can only be performed after the future drought hazard is known, which is based on a good understanding of the historic drought hazard. Alderlieste and Van Lanen (2012) and Van Lanen et al. (2013b) report on the drought hazard in the DROUGHT-R&SPI Case Study areas. The objective of this part of the DROUGHT-R&SPI study is to investigate severity and duration of future drought events for different emission scenarios in the case study areas. Two sources of information were used to study future drought. The first source is information based on so-called local studies, e.g. assessment of climate change on drought using downscaled and bias-corrected future weather data and simulated future hydrological variables (e.g. soil moisture, streamflow) that are targeted to the Case Study area. Likely the methodologies that were used to obtain 2 http://www.eu-watch.org/

Technical Report No.11 - 2 -
local information on future drought differ per case study area. For example, different GCMs, RCMs, downscaling and bias-correction approaches, and hydrological models will have been used to obtain information on future drought. The collation of the diverse, but targeted local information called for an additional consistent analysis of future drought that uses the same GCMs, emission scenarios, downscaling and bias-correction approaches, and hydrological models. This study decided to use time series of future precipitation, temperature and runoff data from the EU-FP6 WATCH project (WATer and global CHange , Harding et al, 2011a; 2011b). The outcome from this study is reported by Alderlieste and Van Lanen (2013b). The following research questions are addressed: � how well do forcing data (e.g. precipitation, temperature) that are simulated with different GCMs
agree with observed (i.e. reanalysis) data in the control period in second part of the 20th century for each of the case study areas;
� how well do low flow and drought characteristics derived from runoff that is simulated with different hydrological models forced with different GCMs agree with the low flow and drought characteristics derived from the same hydrological models but now forced with observed (i.e. reanalysis) data in the control period in second part of the 20th century for each of the case study areas;
� how large is the impact of climate change (different emission scenarios) on future precipitation and temperature according to different GCMs for the intermediate future (2021-2050) and far future (2071-2100) for each of the case study areas. How does the impact compare with the model skill;
� how large is the impact of climate change (different emission scenarios) on future low flow and drought characteristics derived from future runoff obtained from different hydrological models forced with different GCMs for the intermediate future (2021-2050) and far future (2071-2100) for each of the case study areas. How does the impact compare with the model skill;
� does the impact of climate change on precipitation, temperature, low flow and drought characteristics obtained from the WATCH driving force and runoff data agree with the so-called more targeted local sources of information for each of the case study areas.
The report starts with a brief description of the DROUGHT-R&SPI case studies, and the data (reanalysis data, GCMs, large-scale hydrological models and runoff data) and the methods we employed (Chapter 2). Impact of climate change on future drought obtained from local information is described in Chapter 3. The report proceeds with an explanation of climate change on future precipitation, temperature, low flow and drought characteristics using WATCH outcome (Chapter 4). Eventually, agreement and differences between impact of climate change on future drought derived from local information and WATCH outcome are discussed in Chapter 6.

Technical Report No.11 - 3 -
2. Data and methodology to identify future low flow s and drought This chapter briefly describes the DROUGHT-R&SPI Case Study areas (Section 2.1), the WATCH data (Section 2.2) that will be used for the consistent analysis (Chapter 4). The chapter concludes with the different methods that we applied to identify future low flows and drought (Section 2.3). 2.1. DROUGHT-R&SPI Case Study areas Case Study areas have been selected in different geo-climatic regions. The Case Study areas have different scales (local, river basin and national) (Fig. 2.1). Each of the selected Case Study areas is described in the DROUGHT-R&SPI project description (Van Lanen, 2011).
Figure 2.1 Location of the DROUGHT-R&SPI Case Study areas. � The Júcar river basin in Spain, one of the most vulnerable areas of the western Mediterranean due
to the high water exploitation, and environmental and water quality issues. Due to the prioritization of water uses, past drought episodes have primarily affected agriculture and hydroelectricity, but had significant economic impacts across all water use sectors.
� The Netherlands, where vulnerability to drought primarily concerns agriculture, navigation and sensitive ecosystems. Vulnerability is strongly linked to the very controlled water management and the country's dependence on transboundary river water.
� The Po river basin in Italy, where past drought episodes have resulted to extreme pressures on the river basin system, affecting downstream demands, energy production and agriculture and incurring economic damage that exceeded 1.3 billion Euros.
� Portugal, where the 2004-05 drought episode had a pronounced impact on all economic sectors and the environment, and resulted in the second worst wave of wildfires in the country's history, destroying more than 325,000 hectares.
� Switzerland, where the impacts of the 2003 episode motivated authorities to seriously consider the country's vulnerability to drought events, which are expected to become more severe as a result of

Technical Report No.11 - 4 -
climate change. Sectors affected by the 2003 drought concerned agriculture, navigation, energy production, and ecosystems.
� Syros Island of the Cyclades complex in Greece, where drought impacts primarily concern local ecosystems, environmental quality and agriculture. The latter is a vital ingredient of the local economy and an important pillar in achieving a more balanced and sustainable economic development.
2.2. WATCH data In this study we used the following data from the WATCH project: (i) time series of gridded daily meteorological data (reanalysis data), i.e. WATCH Forcing Data (WFD) for the control period (1971-2000), (ii) time series of gridded daily meteorological data from three GCMs for the control period, (iii) time series of gridded daily meteorological data from three GCMs for the intermediate future (2021-2050) and far future (2071-2100), (iv) time series of daily gridded runoff that were simulated with a suite of large-scale models and that were forced with WFD (Haddeland et al (2011) for the control period, (v) time series of daily gridded runoff that were simulated with a suite of large-scale models and that were forced with the three GCMs for the control period, and (vi) time series of daily gridded runoff that were simulated with a suite of large-scale models and that were forced with the three GCMs for the intermediate future (2021-2050) and far future (2071-2100). 2.2.1. Meteorological data: reanalysis data The Watch Forcing Data (WFD) is a gridded global meteorological data set covering the period 1901-2001, i.e. reanalysis dataset. For this study we only used a portion of the second part of the dataset covering the period 1971-2000 (control period). The dataset covers the land surface (minus Antarctica) of the Earth. The globe was divided in grid cells of 0.5 by 0.5 degree, resulting in a total of 67240 cells. For these cells several variables are available on daily and sub-daily time scales. For the trend study we used time series of gridded daily precipitation and temperature. The dataset has a 0.5 by 0.5 degree grid.. The data have been generated (i.e. re-analysis data) by combining the Climatic Research Unit's (CRU) monthly observations of temperature, wet days and cloud cover, plus the GPCCv4 monthly precipitation observations, and the ERA-40 reanalysis products (Uppala et al., 2005). The ERA-40 dataset is available for the period 1958-2002 (Uppala et al., 2005). For more details the readers are referred to (Weedon et al., 2011). Table 2.1 Global Circulation Models (GCMs) used to force the large scale hydrological models
Model Organization Reference
ECHAM5 Max Planck Institute for Meteorology Roeckner et al. (2003) IPSL Institute Pierre Simon Laplace Hourdin et al. (2006) CNRM Centre National de Recherches Météorologiques, Météo-France Déqué and Piedelievre (1995)
2.2.2. Meteorological data: GCM data In this study the output from three coupled atmosphere-ocean General Circulation Models (GCMs) for the SRES A2 and B1 scenarios has been used (Nakićenović and Swart, 2000). The three models included are ECHAM5 (Roeckner et al. 2003), CNRM3 (Déqué and Piedelievre, 1995) and IPSL (Hourdin et al. 2006). Detailed information on the models can be found in Table 2.1. Each GCM provides daily meteorological forcing for the period 1960-2100. We used the period 1971-2000 as control period. The same procedure as for the WFD was applied in the WATCH project to downscale each GCM to the higher resolution 0.5 grid of the WFD. The WFD were used to determine the bias correction required for precipitation, snowfall, minimum, mean and maximum air temperature for the
Technical Report No.11 - 5 -
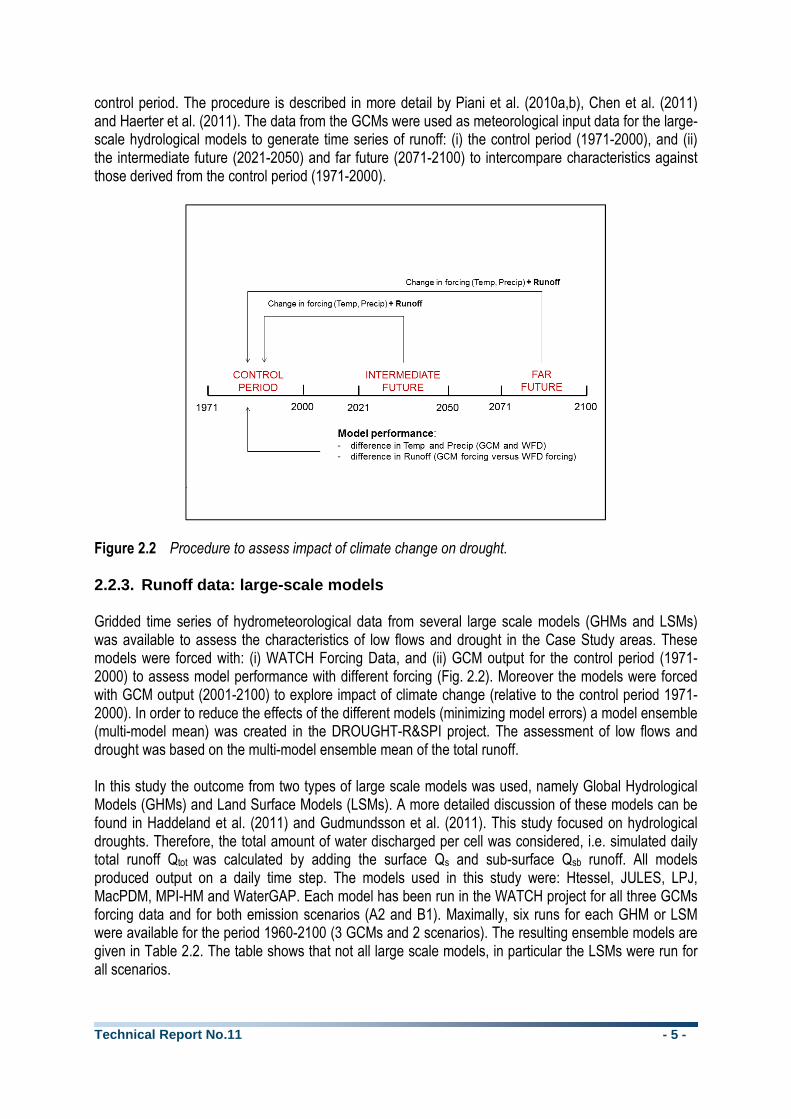
control period. The procedure is described in more detail by Piani et al. (2010a,b), Chen et al. (2011) and Haerter et al. (2011). The data from the GCMs were used as meteorological input data for the large-scale hydrological models to generate time series of runoff: (i) the control period (1971-2000), and (ii) the intermediate future (2021-2050) and far future (2071-2100) to intercompare characteristics against those derived from the control period (1971-2000).
Figure 2.2 Procedure to assess impact of climate change on drought. 2.2.3. Runoff data: large-scale models Gridded time series of hydrometeorological data from several large scale models (GHMs and LSMs) was available to assess the characteristics of low flows and drought in the Case Study areas. These models were forced with: (i) WATCH Forcing Data, and (ii) GCM output for the control period (1971-2000) to assess model performance with different forcing (Fig. 2.2). Moreover the models were forced with GCM output (2001-2100) to explore impact of climate change (relative to the control period 1971-2000). In order to reduce the effects of the different models (minimizing model errors) a model ensemble (multi-model mean) was created in the DROUGHT-R&SPI project. The assessment of low flows and drought was based on the multi-model ensemble mean of the total runoff. In this study the outcome from two types of large scale models was used, namely Global Hydrological Models (GHMs) and Land Surface Models (LSMs). A more detailed discussion of these models can be found in Haddeland et al. (2011) and Gudmundsson et al. (2011). This study focused on hydrological droughts. Therefore, the total amount of water discharged per cell was considered, i.e. simulated daily total runoff Qtot was calculated by adding the surface Qs and sub-surface Qsb runoff. All models produced output on a daily time step. The models used in this study were: Htessel, JULES, LPJ, MacPDM, MPI-HM and WaterGAP. Each model has been run in the WATCH project for all three GCMs forcing data and for both emission scenarios (A2 and B1). Maximally, six runs for each GHM or LSM were available for the period 1960-2100 (3 GCMs and 2 scenarios). The resulting ensemble models are given in Table 2.2. The table shows that not all large scale models, in particular the LSMs were run for all scenarios.

Technical Report No.11 - 6 -
Table 2.2 Available large-scale models and scenarios for the different periods
2.2.4. Selected cells Gridded time series of meteorological and runoff data for the Case Study areas were retrieved from the WATCH global dataset. The data for the cells covering the Case Study areas have been selected based on their coordinates. The bounding box coordinates (latitude, longitude) are given by Alderlieste and Van Lanen (2012). In total data from 244 unique cells were retrieved (some cells occur in two Case Study areas, i.e. overlapping areas in Switzerland and the Po basin). The Júcar basin, The Netherlands, Po basin, Portugal, Switzerland and Syros consist of 24, 30, 45, 49, 27 and 4 cells, respectively. In addition 108 cells were selected for the Rhine basin (Fig. 2.3). The Rhine basin was selected in addition to the DROUGHT-R&SPI Case Study areas to obtain a north-south cross section over Europe, which complements the west-cross section over Europe (Portugal-Júcar-Po-Syros).
Figure 2.3 Selected grid cells of the Case Study areas and the Rhine river basin from the WATCH
dataset. 2.3. Drought identification method This section introduces the low flow and drought characteristics that have been used in this study. 2.3.1. Low flow characteristics Runoff obtained from local observations and the large-scale models (Section 2.2.3) was directly analysed on trends. The flow analysis focussed on the change in mean annual and mean monthly flow characteristics. The following (low) flow characteristics were calculated, based on the original time-series of total runoff:

Technical Report No.11 - 7 -
� May-November AM(7) and AM(30)
The 7-day/30-day minimum runoff per year, over the period May to November. � May-November AM(7) and AM(30) timing
The calendar day on which the minimum 7-day/30-day runoff occurred each year, over the period May to November.
� mean annual flow The annual average runoff value.
� mean monthly flow The monthly average runoff value (January, February, …, December).
The reason for choosing the May–November period for calculating low flow indices is to ensure that only summer low flows (driven by low rainfall/high evapotranspiration) were considered, and not winter low flows caused by storage in ice and snow. Mixing processes would hamper the interpretation of the results (Stahl et al., 2010; Stahl et al., 2012). 2.3.2. Drought: threshold method In addition to the analysis of the change in runoff directly (Section 2.3.1), change in drought was investigated by identifying anomalies in the gridded time series of total runoff. One approach to define drought is by determining the degree of departure from normal for a given variable of interest such as precipitation, soil moisture, groundwater level or discharge (Tallaksen and Van Lanen, 2004). In this study, anomalies in simulated total runoff (sum of surface and sub-surface runoff) were used to determine hydrological drought. The method chosen to identify drought events was the threshold level method (TLM) (Yevjevich, 1967; Hisdal et al., 2004). With the threshold method, drought occurs when the variable of interest (e.g. runoff, precipitation) is below a predefined threshold level. A drought starts when the runoff falls below this thresholds, and it continues until it exceeds the threshold again (Hisdal et al., 2004). As the simulated runoff often shows a seasonal behaviour, a variable threshold was introduced i.e. monthly thresholds were calculated in this study by calculating the mean monthly flows. Based on these monthly flow values, a flow duration curve was calculated for each month to define the threshold levels. To avoid sudden "jumps" in the threshold, these monthly threshold values were smoothed using a 31-day sliding window (15 days post and 15 days prior) to get a smoothed threshold as proposed by Van Loon et al. (2010). In this study we used the 20th percentile (Q20) as threshold value to be consistent with the many other large scale studies. The Q20 is defined as the flow which is exceeded 80% of the time. The result of this approach is that droughts are identified in each grid cell, regardless of the hydrological regime. Fleig et al. (2006) and Van Lanen et al. (2013b) discuss the impact of using another threshold on drought identification. The simulated daily runoff with the large-scale models was smoothed to reduce peaky behaviour. As the output of the models can show strong daily fluctuations, the runoff was smoothed with a 15-day moving window (7 days post and 7 days prior) for the drought analysis. With the smoothed daily runoff and the thresholds calculated, droughts were identified. Short/minor droughts were excluded by only considering droughts with a duration of at least three days. Drought characteristics commonly derived with this method are: beginning, end, duration, deficit volume, minimum flow during an event and the intensity (Hisdal et al., 2004; Fleig et al., 2006). The following annual drought characteristics were calculated: � number of drought events per year (year-1) � average drought duration, i.e. average duration for all events occurring in a year (day)

Technical Report No.11 - 8 -
� average deficit volume, i.e. average of deficit volume of all events occurring in a year (mm) � average intensity, i.e. average intensity of all events occurring in a year (mm/day) 2.4. Determination of change GCM forcings (precipitation and temperature) were compared against the WATCH Forcing Data for the control period (1971-2000). This comparison was done using the summary statistics of this 30 year period. The per cent change was used as measure. After the comparison for the control period to evaluate the quality of the downscaled and bias corrected GCM data (% change in this case is a measure for model performance, i.e. model skill, Fig. 2.2), the summary statistics of each scenario for both the intermediate and far future were compared with the control period to assess the impact of climate change on precipitation and temperature. Next the performance of the large scale hydrological models for the control period (1971-2000) was tested by forcing each of the large scale hydrological models with: (i) WATCH Forcing Data, and (ii) downscaled, bias corrected GCM output for each of the three GCMs, separately. Summary statistics were again used to show deviations in total runoff, low flow and drought characteristics (% change), caused by GCM forcing. In this case the per cent change is a measure for model performance, i.e. skill of the large-scale models forced with GCM’ output to reproduce runoff when the same models are forced with reanalysis data (WFD)(Dig. 2.2).Finally, summary statistics of total runoff, low flow and drought characteristics were computed for the intermediate future (2021-2050) and the far future (2071-2100) and compared against the control period (% change) to assess the impact of climate change. This was done for each multi-model ensemble mean for each GCM and each scenario.

Technical Report No.11 - 9 -
3. Analysis of future drought using local hydromete orological historic data and methods
This chapter that addresses future drought hazard. It includes information from targeted local sources for each of the case study areas. Hydrometeorological variables that were considered to describe the future drought vary per Case Study area. It is dependent on nature of the catchment and the availability of the data. Hence a consistent analysis was carried out in parallel using the same assessment analysis approach everywhere (Section 2.4) and the same data source (WATCH dataset) (Chapter 4), 3.1. Júcar River basin 3 Climate change in Spain The assessment of the impact of climate change and the exploration of future droughts in Spain has been done jointly by the State Agency for Meteorology (AEMET) and the Hydrographic Studies Center (CEH) from the Spanish Governmental Research Institute CEDEX. AEMET (2008) used four well-known Global Circulation Models (ECHAM4, CGCM2, HadCM3 and HadAM3) to calculate future precipitation and temperature projections for emission scenarios A2 and B2. However, these models generate climatic conditions at insufficient scale for the level of detail required to determine the impact of climate change in the different domains of the hydrologic cycle (e.g. soil water, groundwater, river flow). Thus, the GCM results obtained were downscaled to the detail required by hydrologic models by using 4 different regionalisation approaches (FIC, SDSM, PROMES and RCAO). The different combinations GCM and RCM provided CEDEX 12 different climate projections, 6 for scenario A2 and 6 for scenario B2, to carry out the assessment of the impact of climate change on the hydrological system. Table 3.1 shows the characteristics of the projections used. Table 3.1 Characteristics of climate projections used to evaluate the impact of climate change on the
water resources in Spain
Projection GCM Regiona-lisation
1961-1990 2011-2040 2041-2070 2071-2100 Detail
I CGM2 FIC X X X X Meteo stations II ECHAM4 FIC X X X X III HadAM3 FIC X X IV HadCM3 SDSM X X X X V HadCM3 PROMES X X 0.5° resolution VI ECHAM4 RCAO X X cells
The projections reveal consistent results with a gradual increase of maximum temperatures, especially in the inland areas, and a lower increase of minimum temperatures, increasing daily temperature oscillations during the 21st century. However, precipitation projections show a major dispersion, although there seems to be a tendency towards reduction of precipitation in the south of Spain with a north-south gradient. Superimposed to the this gradient, there is also a west-east gradient. This results in a major reduction of precipitation in south-eastern basins in the Iberian Peninsula. The study concludes that the little robustness in precipitation projections, which is caused the uncertainty introduced by the regionalisation methods. One of the main reasons for the uncertainty is the location of the Iberian Peninsula in the transition zone between high latitudes, where precipitation tends to increase,
3 This section is based upon a technical note by: David Haro, Joaquín Andreu, Abel Solera, Javier Paredes (2013): Exploration of future droughts Case Study: Jucar River basin, Universidad Polytechnica de Valencia, Spain.

Technical Report No.11 - 10 -
and the low ones, where precipitation tends to decrease. As mentioned above, there is also a west-east gradient superimposed to the previous north-south one, which introduces additional uncertainty. This implies that the Jucar River basin is the area of the Iberian Peninsula in means where uncertainties of climate projections are highest. This is probably due to the predominant convective character of precipitation in this area, which makes them more difficult to predict by GCMs. CEDEX (2010) evaluated the effects of climate change on future water resources in the different hydrographic regions of Spain and in the whole of the country. The precipitation and temperature projections developed by AEMET (2008) were analysed and used as input to simulate streamflow under natural conditions by applying the hydrologic model SIMPA, which is developed by CEDEX. This model is commonly used in water resources evaluation for hydrologic planning in Spain. The model uses a monthly scale, it is spatially distributed with a cell resolution of 1 km2 and it considers water storage in soils and aquifers. It generates maps with monthly simulated soil moisture content, real evapotranspiration, aquifers recharge and runoff. The CEDEX (2010) investigation confirmed the outcome from previous study by AEMET (2008) that precipitation is one of the variables with more uncertainty generated by GCMs than temperature. The observed average precipitation in Spain is between 15% and 25% larger than the ones projected. Projected temperatures match the observed values better, although there is still some important bias depending on the model projection. The study from CEDEX concludes that, generally, projections underestimate the observed statistics. The uncertainty of each projection varies by region, what enters into conflict with the hypothesis of equiprobability of any of them. Despite the differences between observed and projected values for the control period 1960-1990, CEDEX analysed climate change under the hypothesis that the deviations of the average values during each of the thirty years period of the 21st century with regard to the simulated average values for the control period for each GCM would be translatable to the real situation. However, they also remind that the results contain a high uncertainty and should be taken with caution. Under this basis, the study concludes that there will be a general water resources reduction in Spain, larger as the 21st century advances, being this decrease worse in scenario A2 than in B2. Regarding drought, CEDEX (2012) concludes that droughts tend to become more frequent in all periods. However, these results contain even more uncertainty than previous results because, apart from the uncertainty already introduced by simulation of atmospheric processes, regionalisation, simulation of hydrologic processes, there is the uncertainty related to the selection process of dry and extreme events.
Figure 3.1 Mean annual streamflow values observed and predicted by the different GCM
projections. Vertical bars represent the standard deviation. Climate change and future drought in the Jucar River basin

Technical Report No.11 - 11 -
The streamflow simulated with SIMPA for the Jucar River basin (CEDEX, 2010) were analysed in the DROUGHT-R&SPI study. In particular, the simulation results on streamflow under natural conditions regime at the main regulation point of the Jucar River basin, which coincides with the location of the Tous Reservoir. Figure 3.1 shows the simulated mean annual stream flow values under natural conditions at the regulation point of the Jucar River basin for the control period 1961-1990. It also includes the standard deviation of the streamflow. As can be observed, the results of the GCM- regionalisation combinations are far from matching the observed streamflow. As mentioned above, the Jucar River basin is located at the SE of the Iberian Peninsula, precisely the area at which the GCM projected worse results due to the convective character of precipitation of this area. Additionally, the Jucar River basin suffers what is called “effect 80”, a drastic reduction of streamflow values from 1980 onwards. This effect is not reflected in the results from the different GCMs for the control period either. Moreover, GCMs results show a gradual change of streamflow for the whole 21st century without sudden changes, which does not match the behaviour already observed in the basin. Therefore, the degree of uncertainty for predictions affecting the Jucar River basin is very high. Annex I shows the average streamflow projections for A2 and B2 scenarios for three GCM-regionalisation approaches (Annex I, Figs. I.1 and I.2). Results are shown for the control period (1961-1990) and three continuous periods in the 21st century (2011-2040, 2041-2070, 2071-2100). As can be observed, the different GCM results only follow a common trend for the A2 scenario, in which streamflow tends to decrease. In scenario B2, the predictions differ from one model to another. Table 3.2 shows the percentage deviation relative to the control period for a number of GCM-regionalisation combinations. Table 3.2 Percentage change of average streamflow in the Jucar River basin relative to the control
period for each GCM
GCM- regionalisation combination
Scenario
A2 B2
Period
2011-2040 2041-2070 2070-2100 2011-2040 2041-2070 2070-2100
CGM2_FIC -1.9 -17.4 36.3 -21.2 -8.46 -20.13 ECHAM4_FIC -24.2 -44.0 -42.4 -26.1 -27.5 -35.7 HadCM3_SDSM -0.6 -8.3 -45.1 +6.7 -12.3 -5.7
In conclusion: the current generation of GCM-regionalisation approaches is not capable to reproduce specific characteristics of the Jucar River basin due to the many uncertainties involved Therefore, use of these results to assess the occurrence of droughts in the near and far future should be done with special caution. Water managers in the Jucar River basin should to maintain a constant monitoring of climate and hydrology to anticipate to the occurrence of drought episodes. 3.2. The Netherlands Change in climate conditions The Netherlands Royal Meteorological Institute (KNMI) has constructed future climates by combining information from global and regional climate models from all over the world (Van den Hurk et al., 2006). In these models the scientific knowledge on the climate system was brought together. Observations have been used to assess which climate models best describe the climate of the Netherlands and surroundings. The KNMI’06 climate scenarios portray a plausible and coherent picture of climate change in the Netherlands.
Technical Report No.11 - 12 -
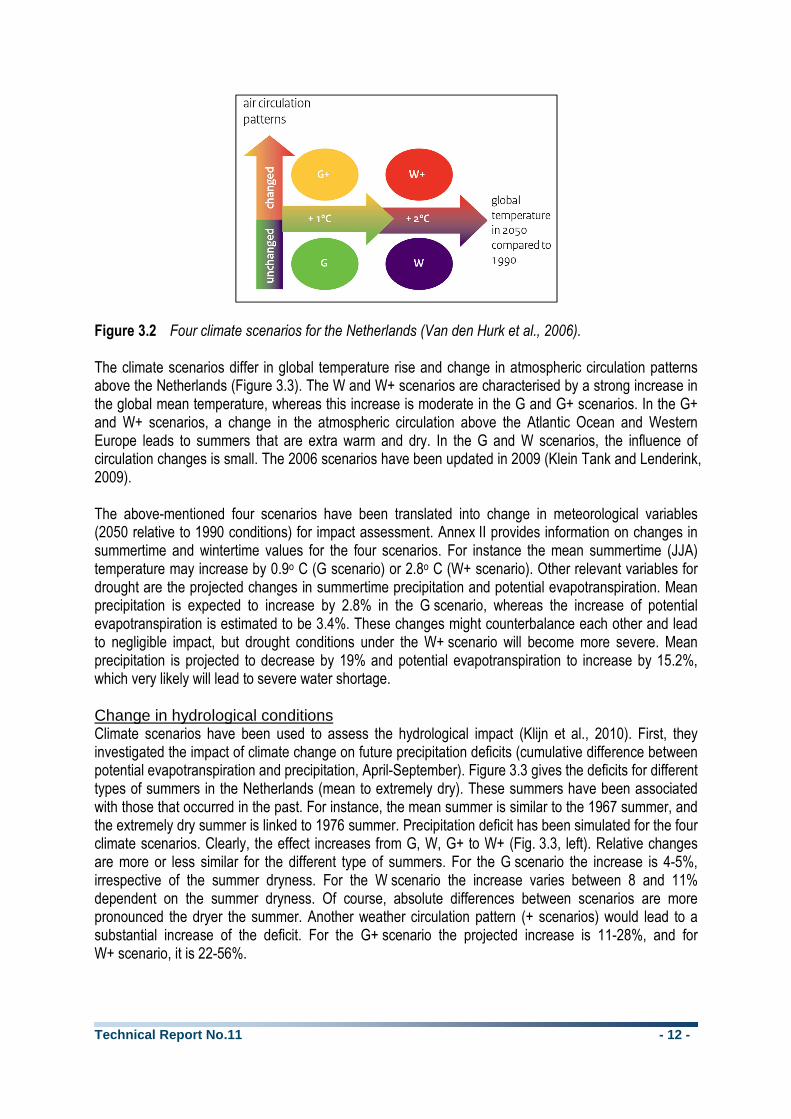
Figure 3.2 Four climate scenarios for the Netherlands (Van den Hurk et al., 2006). The climate scenarios differ in global temperature rise and change in atmospheric circulation patterns above the Netherlands (Figure 3.3). The W and W+ scenarios are characterised by a strong increase in the global mean temperature, whereas this increase is moderate in the G and G+ scenarios. In the G+ and W+ scenarios, a change in the atmospheric circulation above the Atlantic Ocean and Western Europe leads to summers that are extra warm and dry. In the G and W scenarios, the influence of circulation changes is small. The 2006 scenarios have been updated in 2009 (Klein Tank and Lenderink, 2009). The above-mentioned four scenarios have been translated into change in meteorological variables (2050 relative to 1990 conditions) for impact assessment. Annex II provides information on changes in summertime and wintertime values for the four scenarios. For instance the mean summertime (JJA) temperature may increase by 0.9o C (G scenario) or 2.8o C (W+ scenario). Other relevant variables for drought are the projected changes in summertime precipitation and potential evapotranspiration. Mean precipitation is expected to increase by 2.8% in the G scenario, whereas the increase of potential evapotranspiration is estimated to be 3.4%. These changes might counterbalance each other and lead to negligible impact, but drought conditions under the W+ scenario will become more severe. Mean precipitation is projected to decrease by 19% and potential evapotranspiration to increase by 15.2%, which very likely will lead to severe water shortage. Change in hydrological conditions Climate scenarios have been used to assess the hydrological impact (Klijn et al., 2010). First, they investigated the impact of climate change on future precipitation deficits (cumulative difference between potential evapotranspiration and precipitation, April-September). Figure 3.3 gives the deficits for different types of summers in the Netherlands (mean to extremely dry). These summers have been associated with those that occurred in the past. For instance, the mean summer is similar to the 1967 summer, and the extremely dry summer is linked to 1976 summer. Precipitation deficit has been simulated for the four climate scenarios. Clearly, the effect increases from G, W, G+ to W+ (Fig. 3.3, left). Relative changes are more or less similar for the different type of summers. For the G scenario the increase is 4-5%, irrespective of the summer dryness. For the W scenario the increase varies between 8 and 11% dependent on the summer dryness. Of course, absolute differences between scenarios are more pronounced the dryer the summer. Another weather circulation pattern (+ scenarios) would lead to a substantial increase of the deficit. For the G+ scenario the projected increase is 11-28%, and for W+ scenario, it is 22-56%.

Technical Report No.11 - 13 -
Figure 3.3 Precipitation deficit (potential evapotranspiration minus precipitation) for different types of
dry summers (summer dryness, April-September) for current conditions and climate scenarios fort the Netherlands (Klijn et al., 2010). Left: deficit, and right: return period.
Climate change is projected to have a clear impact on the return period of dryer summers (Fig. 3.3, right). Very dry summers, such as 1959, which had a return period of about 70 years, would happen 50 out of 100 years for the G scenario, and about 20 out of 100 years for the W+ scenario. The extremely dry summers (like 1976) that now have a return period of about 90 years, would occur 20 out of 100 years for the W+ scenario.
Figure 3.4 Soil moisture deficit (mm) in the Netherlands (Klijn et al., 2010). Left: current conditions,
and right: 2050 W+ scenario. A deficit in precipitation translates into a soil moisture deficit. Figure 3.4 (left) shows the spatial distribution of the soil moisture deficit in an extremely dry year in the Netherlands under current conditions. The average deficit over the whole country is 155 mm. For the W+ scenario the deficit increases up to 227 mm. Figure 3.4 (right) illustrates that a deficit occurs almost everywhere, including on the peat and clay soils in the western and northern part of the Netherlands. Under such conditions capillary rise is insufficient even on these soils.

Technical Report No.11 - 14 -
Figure 3.5 Impact of climate change on mean lowest groundwater level in the Netherlands (De Haas
and Niemeijer, 2007). Changes in winter and summertime precipitation (Annex II) also impact groundwater levels. Groundwater levels may rise or drop, dependent on the time of the year, but also on the climate change scenario. De Haas and Niemeijer investigated the impact of climate change on groundwater levels. They studied effect on among others mean lowest groundwater level (MLGL, mean of three lowest groundwater level over a year, sampling frequency: twice a month, sampling period at least 8 years). Figure 3.5 presents the difference of the MLGL relative to current conditions. Per cent changes (in area) are larger for the classes that describe dryer conditions (e.g. 0-5, 5-10, 10-25 and >25 cm). For example, the MLGL dropped 5-10 cm on about 8% of the area for the G scenario, and about 21%, 14% and 9% for the G+, W and W+ scenarios, respectively. The largest change is expected to happen for the W+ scenario in the class >25 cm; MLGL drops at about 31% of the area. Note that the W+ scenario can also lead to a rise of the MLGL; at about 6% of the area the MLGL is projected to rise >25 cm likely due to higher precipitation in wintertime from which the summer levels benefit. Climate change also impacts flow of rivers. For the major rivers, i.e. Rhine and Meuse, investigations include the whole river basin, from which the major part is outside the Netherlands, including parts of Switzerland, Germany, France, Luxembourg and Belgium.
Figure 3.6 Change in average monthly river flow of major Dutch rivers for two climate scenarios (Klijn
et al., 2010). Left: River Rhine at Lobith, and right: River Meuse at Borgharen.

Technical Report No.11 - 15 -
Higher precipitation and temperature in wintertime (Annex II) leads to higher winter flows relative to current conditions, as illustrated for the Rhine River and Meuse River (Fig. 3.6, left and right, respectively). Maximum increase is for the Rhine River about 20% (February) and about 10% for the Meuse River (March) for the W+ scenario. The precipitation decrease and higher evapotranspiration, particularly for the G+ and W+ scenarios, results in clear relative change of the summer flows. By the end of the summer and early autumn river flow is projected to drop by 30-40%. This has a clear effect on drought characteristics as described by Bergsma et al. (2010). Klijn et al. (2010) calculated that the Rhine River is projected to have a flow below 1250 m3/s for about 10% 15%, 9% and 22% of the time for the G, G+, W and W+ scenarios, respectively. A flow of 1250 m3/s a key threshold for water management in the Netherlands. When the flow drops below this threshold, a whole series of drought management activities start. 3.3. Po River basin In general, a major concern in the Po River basin is the impact of climate change on the snowfields and glaciers in the Alps. One of the most visible aspects of recent climate change is the retreat of mountain glaciers, which has potential impacts on water resources, power generation, tourism, natural hazards and sea level rise. Obtaining estimates of future glacier changes is therefore important. For river basin planning, it is relevant to consider snowfields and glaciers as big water reservoirs, which influence environment in a variety of ways4 . They have a considerable influence on the hydrologic regime: lowering the multiannual CV coefficient, smoothing natural peaks (floods and low flow events - “delay effect” on the flood waves generation; provide a “base-flow” during low flow/drought/dry periods). For example, during the dry 2003 summer, the Po river discharge was originated primarily from glacial and snow melting. Table 3.3 provides some data from Alpine glaciers in the Po River basin that demonstrate that glaciers generate a substantial volume of water. Table 3.3 Some data from river subbasins in the Alps feeding the Po River
Subbasin Area glacier 1)
(km2)
Annual water snowmelt / glacial ablation
Volume (.106 m3)
Specific discharge (l/s/km2)
Dora Baltea a Ponte Baio 237 670 90 Oglio a monte del Lago d’Iseo 29 61 100 Sesia a Romagnano 7.9 24 95 Ticino a Bellinzona 26.2 86 100 Adda a Fuentes 151 425 80 (upstream of Tirano)
100 (downstream of Tirano)
1) 1973 Haeberli and Beniston (1998) report that climate change in the European Alps during the 20th century caused an increase of minimum temperatures of about 2°C through to the mid-1980s. Temperature increase has been most intense in the 1940s, followed by the 1980s. Such changes caused pronounced effects in the glaciated areas. Since the 1850s (end of the Little Ice Age) glaciated area of the European Alps has lost about 30-40% in area and around half its original volume. Strongly negative mass balances have caused an additional loss of about 10-20% of remaining ice volume since 1980. Simulations with high-resolution regional climate models (RCMs) give generally higher winter
4 Vezzani, C. (2006): Nivo-glacial water resource and river basin planning, Po River Water Authority, Parma, Italy. Presentation WP 4- Snow-glacial water resource and evolutionary trends, Bormio - Centro Tematico Ghiacciai - ARPA Lombardia, 3 February 2006.
Technical Report No.11 - 16 -
temperatures, a more marked increase in summer temperatures, indications that temperature increases more at higher elevations than at lower altitudes, and higher/more intense precipitation in winter, but much dryer conditions in summer. Under such conditions, the Alps would lose major parts of their glacier cover within decades. They strongly recommend that empirical knowledge should be replaced increasingly by improved process understanding, especially concerning runoff formation. Cannone et al. (2008) support more or less the findings of Haeberli and Beniston (1998).They found an increase in air temperature of more than twice the increase in global mean temperature over the last 50 years in the European Alps. Both the abiotic and the biotic components of the mountainous environment showed ample evidence of climate change impacts. All the glaciological data indicate that a glacial retreat and shrinkage occurred and was much stronger after 2002 than during the last 35 years. Vegetation started to colonize surfaces deglaciated for only one year, with a rate much faster than usual. This impressive acceleration could be associated with only slight local summer warming (about +0.5°C) and a poorly documented local decrease in the snow cover depth and duration. In the Alps most small glaciers (80% of total glacial coverage and an important contribution to water resources) may disappear in the next decades. Both Haeberli and Beniston (1998) and Cannone et al. (2008) issue alarming messages about the fate of the Alpine glaciers, which substantially contribute to the river flow of the Po River. In the long run this may cause reduction of fresh water resources. However, it is very hard to generate reliable projections for the response of glaciers to climate change, as demonstrated already some time ago through a modeling experiment by Oerlemans et al. (1998). They used dynamic ice-flow models for 12 glaciers and ice caps, which were calibrated against the historic record of glacier length where possible and forced with six different climate change scenarios. The model outcome reveals that differences in individual glacier responses are very large. The hypsometry of individual glaciers and ice caps plays an important role in their response, thus making it difficult to generalize results. 3.4. Portugal 5 The most conditioning climate factors in mainland Portugal are, besides latitude, its orography and the effect of the Atlantic Ocean, all promoting a significant spatial and seasonal variations particularly in temperature and precipitation (Miranda et al., 2006). The first integrated assessment of climate change impacts and adaptation measures in a southern European country was in Portugal with the SIAM Project1 (phase I: 1999-2002). It focused on a core set of socio-economic and biophysical impacts and was based on climate scenarios produced by a GCM and RCM (Santos et al., 2002). A second phase of the SIAM project (2002-2003) extended and updated previous work on specific topics, such as the evaluation of groundwater availability, the involvement of different stakeholders as well as the evaluation of effectiveness and cost of potential adaptation measures (Santos & Miranda, 2006). Both the hydrographic region planning (PGRH) and National Strategy for Climate Change Adaptations (ENAAC) rely on the identification of the best possible climatic scenarios. Those scenarios were firstly developed at national level under the project SIAM I assuming one GHG emission scenario (Santos et al., 2002). Since then a considerable amount of work was done to improve forecast scenarios. A major effort was put forward to increase the spatial and temporal resolution for climatic models (Belo-Pereira et al., 2011), along with the quality and quantity of datasets that allow a better model calibration, in particular for precipitation simulations (e.g. Dutra et al., 2008; De Lima et al., 2010; Martins et al., 2012; Soares et al., 2012). The second approach was based upon the outcome of the recently finished. ENSEMBLES project to assess future climate scenarios for water resources at national and watershed
5 This section is based upon a technical note by Dias, S., Rego, F. and Bifulco (2013): Likelihood of future drought hazards – Case Study Portugal, ISA-CEABN, Lisbon Technical University.

Technical Report No.11 - 17 -
level (e.g. INAG, 2010 in APA and ARH Norte, 2012). Latest initiatives include the evaluation of the Weather Research and Forecast model (WRF) as an RCM to perform high resolution precipitation simulations that could be more representative of the national weather, especially under extremes conditions and rugged topography (Cardoso et al., 2012, 2012a). First results on on-going projects (EC-Earth ) were applied to foreseen impacts and adaptations to climate change in the forest resources (Dias, 2013). Under the two major initiatives promoting the study of impacts of climate change in water resources at national level (ENAAC and PGRH), future drought hazard is not assessed in its full potential given the data availability on climatic scenarios and runoff predictions. In Portugal most of the drought hazard research relies on statistical models to investigate relationship between spatio-temporal statistics of precipitation with other local or remote predictors such as atmospheric circulation indices (Costa et al., 2011). Meteorological drought assessment using drought indices (e.g. SPI, PDSI) is common. Only recently, drought risk assessment is being evaluated by identifying areas were agricultural and meteorological drought can occur based on the application of integrated water balance models at river basin scale (e.g. Vivas and Maia, 2010; APA and ARH Alentejo, 2012; APA and ARH Algarve, 2012). Approach The assessment of climate change impacts on national water resources was evaluated by comparing results from a hydrological model, which was run under different climate scenarios. Historic monthly precipitation and temperature records describe the current climate. Future climate scenarios were built by perturbing the historical records with expected changes predicted by GCMs or RCMs. Two approaches were followed, i.e. the SIAM and ENSEMBLES approach. In the SIAM approach the meteorological dataset used as forcing data for the hydrological model was the outcome from one GCM (HadCM3) and one RCM HadRM2. These Hadley Centre models stand out from a group of 4 GCMs and 2 RCMs whose performance was previously evaluated, as the ones that have produced the most consistent results with the Portuguese historical observation (Miranda et al., 2006). In the ENSEMBLES approach nine GCMs and 13 RCMs were combined to produce 18 climatic scenarios for Europe. Results were assessed through comparisons with the ENSEMBLES daily observational gridded dataset for Europe (E-OBS) at 0.25° x 0.25°, which consists of 26 stations in Portugal (Soares et al., 2012a). Within each of the eight Portuguese Hydrographical Regions (RHs), the simulation runs for the period 1971-2000 were compared with the observed data from the meteorological stations representing the RH. Cardoso et al. (2012), Herrera et al. (2010) and Soares et al. (2012) provide information on simulation performance and comparison with other models. With statistical techniques uncertainty of the climatic projections was quantified. ENSEMBLES has a better spatial resolution the SIAM, thus is expected to better reproduce extreme values of the climate variables or better modulate processes which are sensitive to local geography, like water resources. However, ENSEMBLES usually underestimates temperature and precipitation, in particular for Portugal. The precipitation variability is usually well captured and models perform better in winter (Santos et al., 2012). The hydrological Temez model (Temez, 1977) was used in both approaches (SIAM and ENSEMBLES) to assess the flow characteristics and forecast water natural availability. It is a continuous aggregated and deterministic rainfall-runoff model that simulates the transformation process of precipitation into runoff on a given river basin. It operates at a monthly time step and since it is an aggregated model it assumes a uniform spatial distribution of the conditions that affect the transformation process (Cunha et al. 2002). The Temez model requires as input monthly time series if river basin precipitation and potential evapotranspiration (PET). As output the model produces monthly runoff, aquifer recharge and effective evapotranspiration. The former two fluxes were used for climate change assessment (Cunha et al. 2006).

Technical Report No.11 - 18 -
In the SIAM approach, the Temez model with the different climate scenarios as input was tested for 62 gauging basins with no major human intervention and whose area varied between 15 and 2000 km2. Results were expected to represent the variety of runoff regimes existing in mainland Portugal (Cunha et al., 2006). Future precipitation and temperature were estimated by perturbating historical meteorological records. The perturbated values were fed into the Temez model to produce future runoff projections for the climate models used. The results were presented for 3 regions (north, centre and south). The downscaling allowed to have separated climate scenarios for the main river basins (Miranda et al., 2006). In the ENSEMBLES approach the forcing data obtained from climate simulations were fed into the Temez model to produce runoff scenarios for each subbasin. After a testing phase, the simulated runoff data were aggregated to estimate runoff series at major basin level (e.g. APA and ARH Centro, 2012; APA and ARH Norte, 2012). Future changes Both the SIAM and ENSEMBLES approaches agreed on the general trends obtained for each hydrographical regions. Most of the projections obtained with the ENSEMBLES approach, which explicitly includes the uncertainty evaluation, are overlapped by the ones obtained with SIAM approach. The uncertainly is progressively reduced with time, reaching the lowest level by the far future. Table 3.4 Range of change in the average annual runoff (%) relative to 1951-1980 predicted by
several runs of climate models (ENSEMBLES approach) for the Hydrographical Regions in
Portugal. Arrows denote the prevalent trend: ↑increase, ↓decrease and ↕ both ways
The climate projections show highly consistent results indicating an increase of the annual mean temperature mostly between 2.0 and 3.0 °C by 2050 and between 3.5 and 5.5°C by 2100 (Annexes III and IV), which are higher than the predicted changes in global mean temperature (Miranda et al., 2006). The results for central and southern regions are approximately 0.5°C higher than for the northern region. Precipitation predictions present a higher variability than temperature, although all models estimate a reduction in mean precipitation and in the duration of the rainy season by the end of the 21st century (Annexes III and IV). The trend for winter and spring precipitation is highly uncertain for several regions. Most of the simulation runs predict a runoff reduction by the end of 21th century (Table 3.4). The reduction appears to be small in the northern hydrographical regions, but increases progressively towards the south. The simulations predicted also a concentration of precipitation and runoff in winter.
Hydrographical Region
Change in the average annual runoff (in %) relative to
1951-1980
1991/2020 2021/2050 2071/2100
RH 1 – Minho, Lima ↓ -15 to +10 ↓ -22 to +3 ↓ -35 to 0
RH 2 - Ave, Cavado, Leça ↓ -25 to +18 ↓ -22 to +15 ↓ -38 to 0
RH 3 - Douro ↓ -28 to +15 ↓ -38 to +38 ↓ -70 to 0
RH 4 - Vouga, Mondego, Lis ↓ -35 to +18 ↓ -60 to +15 ↓ -55 to +5
RH 5 - Tagus
RH 6 - Sado and Mira ↕ -50 to +60 ↓ -70 to +20
RH 7 – Guadiana ↕ -70 to +80 ↓ -80 to +45
RH 8 - Algarve ↕ -30 to +30 ↓ -80 to +40
Technical Report No.11 - 19 -
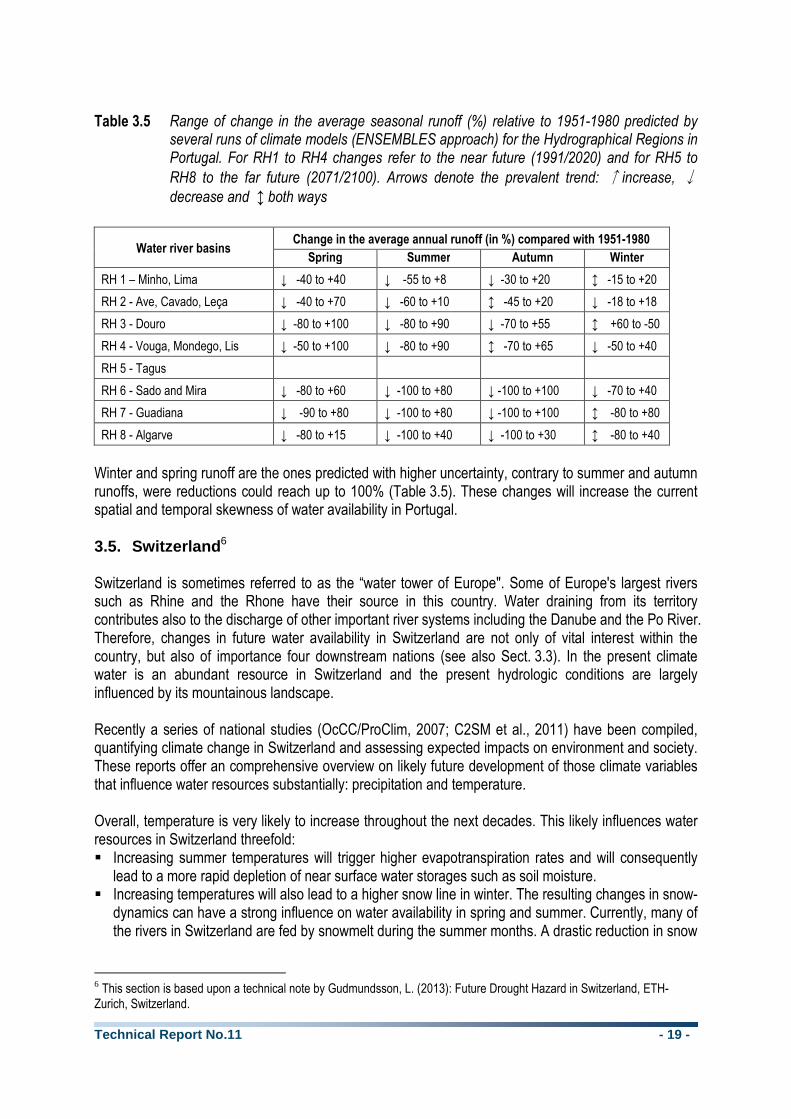
Table 3.5 Range of change in the average seasonal runoff (%) relative to 1951-1980 predicted by
several runs of climate models (ENSEMBLES approach) for the Hydrographical Regions in Portugal. For RH1 to RH4 changes refer to the near future (1991/2020) and for RH5 to
RH8 to the far future (2071/2100). Arrows denote the prevalent trend: ↑increase, ↓
decrease and ↕ both ways
Winter and spring runoff are the ones predicted with higher uncertainty, contrary to summer and autumn runoffs, were reductions could reach up to 100% (Table 3.5). These changes will increase the current spatial and temporal skewness of water availability in Portugal. 3.5. Switzerland 6 Switzerland is sometimes referred to as the “water tower of Europe". Some of Europe's largest rivers such as Rhine and the Rhone have their source in this country. Water draining from its territory contributes also to the discharge of other important river systems including the Danube and the Po River. Therefore, changes in future water availability in Switzerland are not only of vital interest within the country, but also of importance four downstream nations (see also Sect. 3.3). In the present climate water is an abundant resource in Switzerland and the present hydrologic conditions are largely influenced by its mountainous landscape. Recently a series of national studies (OcCC/ProClim, 2007; C2SM et al., 2011) have been compiled, quantifying climate change in Switzerland and assessing expected impacts on environment and society. These reports offer an comprehensive overview on likely future development of those climate variables that influence water resources substantially: precipitation and temperature. Overall, temperature is very likely to increase throughout the next decades. This likely influences water resources in Switzerland threefold: � Increasing summer temperatures will trigger higher evapotranspiration rates and will consequently
lead to a more rapid depletion of near surface water storages such as soil moisture. � Increasing temperatures will also lead to a higher snow line in winter. The resulting changes in snow-
dynamics can have a strong influence on water availability in spring and summer. Currently, many of the rivers in Switzerland are fed by snowmelt during the summer months. A drastic reduction in snow
6 This section is based upon a technical note by Gudmundsson, L. (2013): Future Drought Hazard in Switzerland, ETH-Zurich, Switzerland.
Water river basins Change in the average annual runoff (in %) compared with 1951-1980
Spring Summer Autumn Winter
RH 1 – Minho, Lima ↓ -40 to +40 ↓ -55 to +8 ↓ -30 to +20 ↕ -15 to +20
RH 2 - Ave, Cavado, Leça ↓ -40 to +70 ↓ -60 to +10 ↕ -45 to +20 ↓ -18 to +18
RH 3 - Douro ↓ -80 to +100 ↓ -80 to +90 ↓ -70 to +55 ↕ +60 to -50
RH 4 - Vouga, Mondego, Lis ↓ -50 to +100 ↓ -80 to +90 ↕ -70 to +65 ↓ -50 to +40
RH 5 - Tagus
RH 6 - Sado and Mira ↓ -80 to +60 ↓ -100 to +80 ↓ -100 to +100 ↓ -70 to +40
RH 7 - Guadiana ↓ -90 to +80 ↓ -100 to +80 ↓ -100 to +100 ↕ -80 to +80
RH 8 - Algarve ↓ -80 to +15 ↓ -100 to +40 ↓ -100 to +30 ↕ -80 to +40

Technical Report No.11 - 20 -
cover in mountainous regions may consequently cause water scarcity in melt-water fed systems. In some instances this may even cause some rivers and streams to dry up.
� An increase in temperatures and an associated decrease in snowfall rates will lead to a reduction in glacier size. As many hydrological systems in Switzerland are to date dependent on glacial melt-water a reduction in glacial extent will lead in the long run to a reduction in fresh water availability during the warm season.
In general, changes in precipitation are projected to be less pronounced in Switzerland than temperature changes. Overall there is a tendency for decreasing precipitation rates in summer, which is likely to reduce water availability in the dry season. Some projections suggest increasing winter precipitation, although these changes are less pronounced and have a large regional variability. Overall, the projected decrease in summer precipitation, together with the effects of increasing temperatures are likely to alter water availability in Switzerland. Especially, during the summer months, the combination of decreasing precipitation and increasing evapotranspiration may trigger water shortages. This can have effects on surface water bodies as well as on near surface storages such as soil moisture. Consequently future water scarcity can potentially affect a wide range of economic sectors during the summer months. Examples include fisheries, transport (shipping), hydropower, agriculture and forestry. An increase in winter precipitation is unlikely to mitigate these effects, as a rising snow line implies that less water is stored as snow. Especially the changes in snow dynamics and the reduction of glaciers may also have consequences for downstream countries, owing to the role of Switzerland as the “water tower of Europe". 3.6. Syros 7 A study on future drought has not been undertaken for Syros Island. Some studies (e.g. Tigkas, 2008; Bank of Greece, 2011) deal with future climate conditions in the wider Cyclades region and can provide thus information on the anticipated effects of climate change on future drought conditions also for Syros. Tigkas (2008) calculated the Reconnaissance Drought Index and performed a trend analysis for the period 1995-2005, to assess drought hazard for the period 2050-2080. Particularly, the results of the trend analysis were used to formulate a drought scenario (optimistic projection) with the assumption that past trends will remain the same in the future. Based on this scenario the percentage of severe and extreme drought years will decrease in the Cyclades from 17% to 13%. Tigkas (2008) also examined a second drought scenario (pessimistic projection) by adopting climate projections from the HadCM3/A1F model. In this case the percentage of severe and extreme drought years is increasing to 83%. Table 3.6 Average precipitation using climate projections from the PRUDENCE project and
difference relative to the 1961-1990 reference period (Bank of Greece, 2011)
Period Precipitation for scenario (mm/year)
Change in precipitation for scenario
(mm/year) (%)
A2 B2 A2 B2 A2 B2
1961-1990 400.6 ±106.0 411.7 ±125.2 2071-2080 334.3 ±89.6 400.6 ±110.1 -66.3 ±32.3 -11.1 ±27.6 -16.4 ±5.5 -1.7 ±6.1 2081-2090 313.4 ±95.8 379.4 ±122.2 -87.3 ±27.0 -32.3 ±36.5 -22.4 ±6.3 -8.0±12.1 2091-2100 361.9 ±106.7 436.8 ±138.1 -38.7 ±36.9 25.1 ±36.9 -10.3 ±10.1 5.6±11.1
7 This section is based upon a technical note by Assimacopoulos, D. (2013): Available information on future drought hazard for Syros Island, National Technical University Athens, Greece.

Technical Report No.11 - 21 -
A study on climate change and its impacts in Greece was financed by the Bank of Greece (2011). The projections used in the study indicate a decrease in precipitation in the Cyclades (Tables 3.6 and 3.7) that will significantly –negatively- influence the frequency and severity of drought events in the region. Table 3.7 Average precipitation using climate projections from the ENSEMBLE project and difference
relative to the 1961-1990 reference period (Bank of Greece, 2011)
Period Precipitation for scenario (mm/year)
Change in precipitation for scenario
(mm/year) (%)
1961-1990 449.5 ±169.2 2021-2050 426.9 ±158.4 -22.6 ±33.1 -4.4 ±6.7 2071-2100 371.4 ±166.3 -78.2 ±26.8 -19.0 ±8.0
Particularly, for Syros Island, climate projections have been provided by the EU FP7 WASSERMed project “Water Availability and Security in Southern EuRope and the Mediterranean” (Grant agreement no.: 244255). Regional climate datasets were based on the HIRHAM5 model, forced by the ECHAM5 GCM for the A1B IPCC scenario. The SPI-12 index was calculated for the 2011-2065 period. Results indicate that after 2035 there will be a significant increase in drought conditions (Fig. 3.7).
Figure 3.7 Percentage of wet and drought periods based upon the SPI-12 Index for Syros Island in
the future using climate datasets from the WASSERMed project.
Technical Report No.11 - 22 -
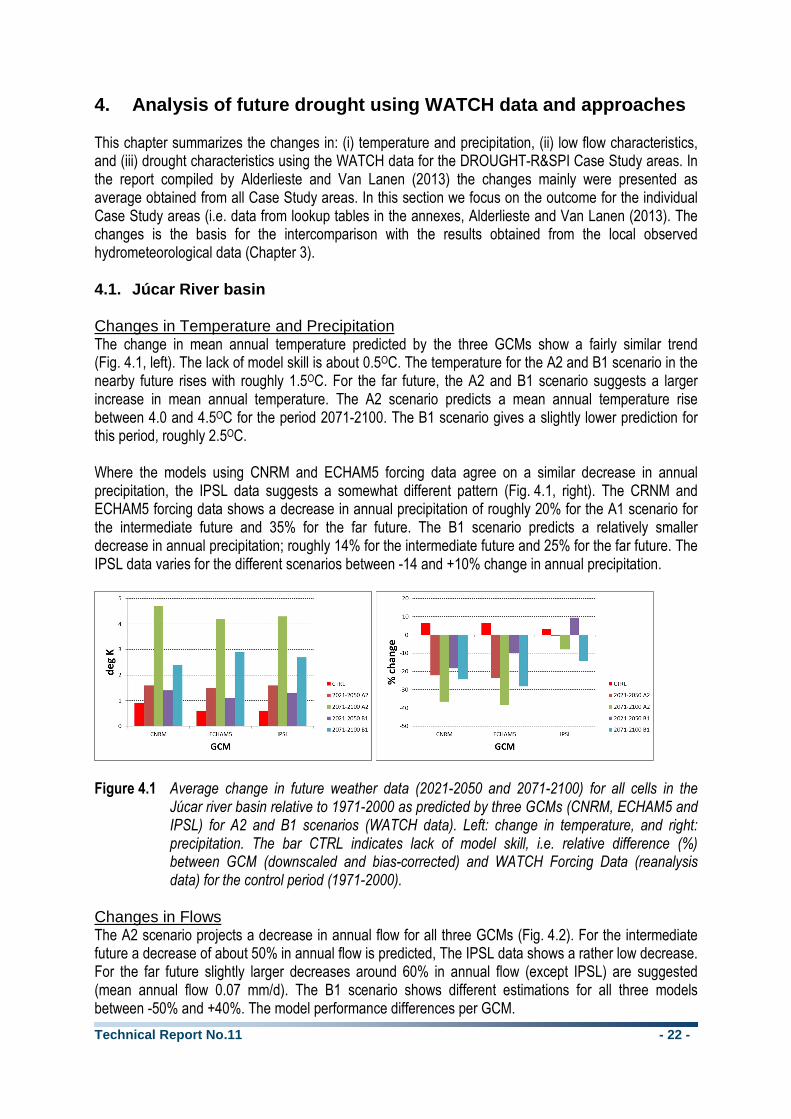
4. Analysis of future drought using WATCH data and approaches This chapter summarizes the changes in: (i) temperature and precipitation, (ii) low flow characteristics, and (iii) drought characteristics using the WATCH data for the DROUGHT-R&SPI Case Study areas. In the report compiled by Alderlieste and Van Lanen (2013) the changes mainly were presented as average obtained from all Case Study areas. In this section we focus on the outcome for the individual Case Study areas (i.e. data from lookup tables in the annexes, Alderlieste and Van Lanen (2013). The changes is the basis for the intercomparison with the results obtained from the local observed hydrometeorological data (Chapter 3). 4.1. Júcar River basin Changes in Temperature and Precipitation The change in mean annual temperature predicted by the three GCMs show a fairly similar trend (Fig. 4.1, left). The lack of model skill is about 0.5OC. The temperature for the A2 and B1 scenario in the nearby future rises with roughly 1.5OC. For the far future, the A2 and B1 scenario suggests a larger increase in mean annual temperature. The A2 scenario predicts a mean annual temperature rise between 4.0 and 4.5OC for the period 2071-2100. The B1 scenario gives a slightly lower prediction for this period, roughly 2.5OC. Where the models using CNRM and ECHAM5 forcing data agree on a similar decrease in annual precipitation, the IPSL data suggests a somewhat different pattern (Fig. 4.1, right). The CRNM and ECHAM5 forcing data shows a decrease in annual precipitation of roughly 20% for the A1 scenario for the intermediate future and 35% for the far future. The B1 scenario predicts a relatively smaller decrease in annual precipitation; roughly 14% for the intermediate future and 25% for the far future. The IPSL data varies for the different scenarios between -14 and +10% change in annual precipitation.
Figure 4.1 Average change in future weather data (2021-2050 and 2071-2100) for all cells in the
Júcar river basin relative to 1971-2000 as predicted by three GCMs (CNRM, ECHAM5 and IPSL) for A2 and B1 scenarios (WATCH data). Left: change in temperature, and right: precipitation. The bar CTRL indicates lack of model skill, i.e. relative difference (%) between GCM (downscaled and bias-corrected) and WATCH Forcing Data (reanalysis data) for the control period (1971-2000).
Changes in Flows The A2 scenario projects a decrease in annual flow for all three GCMs (Fig. 4.2). For the intermediate future a decrease of about 50% in annual flow is predicted, The IPSL data shows a rather low decrease. For the far future slightly larger decreases around 60% in annual flow (except IPSL) are suggested (mean annual flow 0.07 mm/d). The B1 scenario shows different estimations for all three models between -50% and +40%. The model performance differences per GCM.

Technical Report No.11 - 23 -
Figure 4.2 Average change in annual flow (2021-2050 and 2071-2100) relative to 1971-2000 for all cells in the Júcar river basin as obtained from the multi-model mean runoff of six large-scale hydrological models that were forced by three GCMs (CNRM, ECHAM5 and IPSL) for A2 and B1 scenarios (WATCH data). The bar CTRL indicates lack of model skill, i.e. relative difference (%) in annual flow obtained from the multi-model mean annual runoff of six large-scale models that were forced by three GCMs (downscaled and bias-corrected) and the same models forced with WATCH Forcing Data (reanalysis data) for the control period (1971-2000).
Changes in Droughts All three GCMs agree on an increase of average drought duration except for IPSL (A2 scenario) for the intermediate future (Fig. 4.3, left). The lack of model skill for these predictions is relatively small. The A2 scenario predicts a relatively smaller increase of average drought duration for the intermediate future than for the far future (130-165%, except IPSL). For the B1 scenario, the models show a less distinct pattern. The IPSL data suggest only a small increase in average drought duration (16-30%).
Figure 4.3 Average change in drought characteristics flow (2021-2050 and 2071-2100) relative to
1971-2000 for all cells in the Júcar river basin as obtained from the multi-model mean runoff of six large-scale hydrological models that were forced by three GCMs (CNRM, ECHAM5 and IPSL) for A2 and B1 scenarios (WATCH data). Left: change in average drought duration, and right: change in average deficit volume. The bar CTRL indicates lack of model skill, i.e. relative difference (%) in drought characteristics derived from the multi-model mean runoff of six large-scale models that were forced by three GCMs (downscaled and bias-corrected) and the same models forced with WATCH Forcing Data (reanalysis data) for the control period (1971-2000).

Technical Report No.11 - 24 -
Again all three GCMs are in agreement on an increase in average deficit volume with a relatively small lack of model skill (Fig. 4.3, right). The A2 scenario for the far future suggests a relatively large increase in average deficit volume between 450 and 620% (1.9-2.2 mm) for CNRM and ECHAM5. The intermediate future of the A2 scenario shows a relatively lower increase in average deficit volume between 20 and 250%. The forced data does not show a distinct pattern for the B1 scenario and time periods. 4.2. The Netherlands Changes in Temperature and Precipitation The change in mean annual temperature predicted by the three GCMs show a fairly similar trend (Fig. 4.4, left). The lack of model skill is about 0.8OC. The temperature for the A2 and B1 scenario in the nearby future rises with roughly 1.5 OC. For the far future, the A2 and B1 scenario suggests a larger increase in mean annual temperature. The A2 scenario predicts a mean annual temperature rise between 4.0 and 4.5OC for the period 2071-2100. The B1 scenario gives a slightly lower prediction for this period, roughly 2.5OC. The three GCMs do not show a very distinct pattern for the change in annual precipitation (Fig. 4.4, right). The lack of model skill is relatively large. The predictions for the changes of the annual precipitation are small and varies between -8 and +9% (2.1 to 2.4 mm). The lack of model skill varies for each GCM. Surprisingly, the A2 scenario data shows a larger increase for the intermediate future than for the far future. While the B1 scenario shows the opposite, a larger increase for the far future than the intermediate future.
Figure 4.4 Average change in future weather data (2021-2050 and 2071-2100) for all cells in the
Netherlands relative to 1971-2000 as predicted by three GCMs (CNRM, ECHAM5 and IPSL) for A2 and B1 scenarios (WATCH data). Left: change in temperature, and right: precipitation. The bar CTRL indicates lack of model skill, i.e. relative difference (%) between GCM (downscaled and bias-corrected) and WATCH Forcing Data (reanalysis data) for the control period (1971-2000).
Changes in Flows The model performance on predicting flow is low; the lack of model skill is quite large for each GCM relative to the predicted changes (Fig. 4.5). The IPSL data shows a decrease in annual flow, while the CRNM and ECHAM5 data shows an increase in annual flow for the A2 scenario.

Technical Report No.11 - 25 -
Figure 4.5 Average change in annual flow (2021-2050 and 2071-2100) relative to 1971-2000 for all cells in the Netherlands as obtained from the multi-model mean runoff of six large-scale hydrological models that were forced by three GCMs (CNRM, ECHAM5 and IPSL) for A2 and B1 scenarios (WATCH data). The bar CTRL indicates lack of model skill, i.e. relative difference (%) in annual flow obtained from the multi-model mean annual runoff of six large-scale models that were forced by three GCMs (downscaled and bias-corrected) and the same models forced with WATCH Forcing Data (reanalysis data) for the control period (1971-2000).
Changes in Droughts All three GCMs show an increase of average drought duration (Fig. 4.6, left). The lack of model skill for these predictions is relatively small. The CNRM and ECHAM5 A2 scenario predicts a smaller increase of average drought duration for the intermediate future than for the far future (80 and 140%). The IPSL data shows a more equal prediction for the A2 scenario of roughly 80% (~35 days). For the B2 scenario, the models show a less distinct pattern. The predictions are not clear if there is a higher increase of average drought duration for the far future than the intermediate future (e.g. ECHAM5 projects the opposite).
Figure 4.6 Average change in drought characteristics flow (2021-2050 and 2071-2100) relative to
1971-2000 for all cells in the Netherlands as obtained from the multi-model mean runoff of six large-scale hydrological models that were forced by three GCMs (CNRM, ECHAM5 and IPSL) for A2 and B1 scenarios (WATCH data). Left: change in average drought duration, and right: change in average deficit volume. The bar CTRL indicates lack of model skill, i.e. relative difference (%) in drought characteristics derived from the multi-model mean runoff of six large-scale models that were forced by three GCMs (downscaled and bias-corrected)

Technical Report No.11 - 26 -
and the same models forced with WATCH Forcing Data (reanalysis data) for the control period (1971-2000).
Again all three GCMs show an increase in average deficit volume with a relatively small lack of model skill (Fig. 4.6, right). The A2 scenario for the far future suggests a relatively large increase in average deficit volume between 60 and 360%. The intermediate future of the A2 scenario shows a relatively lower increase in average deficit volume between 25 and 60%. The predictions for the B1 scenario do not show in general a lower increase in average deficit volume, as expected. 4.3. Po River basin Changes in Temperature and Precipitation The change in mean annual temperature predicted by the three GCMs show a fairly similar trend (Fig. 4.7, left). The lack of model skill is relatively large, about 1.3OC. The temperature for the A2 and B1 scenario in the nearby future rises with roughly 1.4OC. For the far future, the A2 and B1 scenario suggests a relatively larger increase in mean annual temperature. The A2 scenario predicts a mean annual temperature rise of roughly 3.9OC for the period 2071-2100. The B1 scenario gives a slightly lower prediction for this period, roughly 2.3OC. The three GCMs do not show a very distinct pattern for the change in annual precipitation (Fig. 4.7, right). The lack of model skill is relatively small. The predictions for the changes of the annual precipitation varies between -20 and +17%. The CNRM data does not show a distinct pattern. The ECHAM5 data shows clearly a relatively large decrease in annual precipitation of roughly 2.4 mm. The IPSL data shows almost no change in annual precipitation.
Figure 4.7 Average change in future weather data (2021-2050 and 2071-2100) for all cells in the Po
river basin relative to 1971-2000 as predicted by three GCMs (CNRM, ECHAM5 and IPSL) for A2 and B1 scenarios (WATCH data). Left: change in temperature, and right: precipitation. The bar CTRL indicates lack of model skill, i.e. relative difference (%) between GCM (downscaled and bias-corrected) and WATCH Forcing Data (reanalysis data) for the control period (1971-2000).
Changes in Flows The model performance is really low (Fig. 4.8); the lack of model skill is too large for a good prediction of the changes in annual flow. The data shows decrease of annual flow from +5 to -30% (A2 scenario), while the lack of model skill is over 100%.

Technical Report No.11 - 27 -
Figure 4.8 Average change in annual flow (2021-2050 and 2071-2100) relative to 1971-2000 for all cells in the Po river basin as obtained from the multi-model mean runoff of six large-scale hydrological models that were forced by three GCMs (CNRM, ECHAM5 and IPSL) for A2 and B1 scenarios (WATCH data). The bar CTRL indicates lack of model skill, i.e. relative difference (%) in annual flow obtained from the multi-model mean annual runoff of six large-scale models that were forced by three GCMs (downscaled and bias-corrected) and the same models forced with WATCH Forcing Data (reanalysis data) for the control period (1971-2000).
Changes in Droughts All three GCMs show an increase of average drought duration (Fig. 4.9, left). The lack of model skill for these predictions is relatively small (~18%). The A2 scenario shows a smaller increase of average drought duration for the intermediate future for the far future 140 and 160% (39 to 46 days, except IPSL). The B1 scenario also suggests a relatively larger increase in average drought duration for the intermediate future than for the far future (except ECHAM5).
Figure 4.9 Average change in drought characteristics flow (2021-2050 and 2071-2100) relative to
1971-2000 for all cells in the Po river basin as obtained from the multi-model mean runoff of six large-scale hydrological models that were forced by three GCMs (CNRM, ECHAM5 and IPSL) for A2 and B1 scenarios (WATCH data). Left: change in average drought duration, and right: change in average deficit volume. The bar CTRL indicates lack of model skill, i.e. relative difference (%) in drought characteristics derived from the multi-model mean runoff of six large-scale models that were forced by three GCMs (downscaled and bias-corrected) and the same models forced with WATCH Forcing Data (reanalysis data) for the control period (1971-2000).
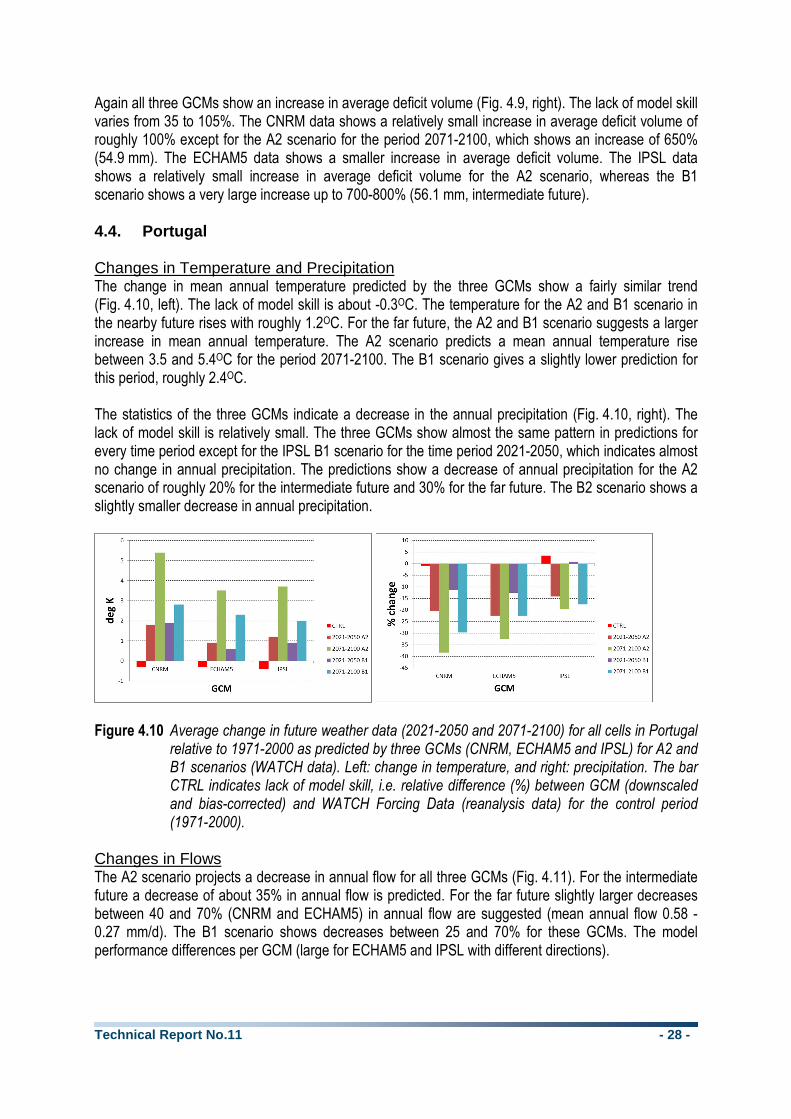
Technical Report No.11 - 28 -
Again all three GCMs show an increase in average deficit volume (Fig. 4.9, right). The lack of model skill varies from 35 to 105%. The CNRM data shows a relatively small increase in average deficit volume of roughly 100% except for the A2 scenario for the period 2071-2100, which shows an increase of 650% (54.9 mm). The ECHAM5 data shows a smaller increase in average deficit volume. The IPSL data shows a relatively small increase in average deficit volume for the A2 scenario, whereas the B1 scenario shows a very large increase up to 700-800% (56.1 mm, intermediate future). 4.4. Portugal Changes in Temperature and Precipitation The change in mean annual temperature predicted by the three GCMs show a fairly similar trend (Fig. 4.10, left). The lack of model skill is about -0.3OC. The temperature for the A2 and B1 scenario in the nearby future rises with roughly 1.2OC. For the far future, the A2 and B1 scenario suggests a larger increase in mean annual temperature. The A2 scenario predicts a mean annual temperature rise between 3.5 and 5.4OC for the period 2071-2100. The B1 scenario gives a slightly lower prediction for this period, roughly 2.4OC. The statistics of the three GCMs indicate a decrease in the annual precipitation (Fig. 4.10, right). The lack of model skill is relatively small. The three GCMs show almost the same pattern in predictions for every time period except for the IPSL B1 scenario for the time period 2021-2050, which indicates almost no change in annual precipitation. The predictions show a decrease of annual precipitation for the A2 scenario of roughly 20% for the intermediate future and 30% for the far future. The B2 scenario shows a slightly smaller decrease in annual precipitation.
Figure 4.10 Average change in future weather data (2021-2050 and 2071-2100) for all cells in Portugal
relative to 1971-2000 as predicted by three GCMs (CNRM, ECHAM5 and IPSL) for A2 and B1 scenarios (WATCH data). Left: change in temperature, and right: precipitation. The bar CTRL indicates lack of model skill, i.e. relative difference (%) between GCM (downscaled and bias-corrected) and WATCH Forcing Data (reanalysis data) for the control period (1971-2000).
Changes in Flows The A2 scenario projects a decrease in annual flow for all three GCMs (Fig. 4.11). For the intermediate future a decrease of about 35% in annual flow is predicted. For the far future slightly larger decreases between 40 and 70% (CNRM and ECHAM5) in annual flow are suggested (mean annual flow 0.58 - 0.27 mm/d). The B1 scenario shows decreases between 25 and 70% for these GCMs. The model performance differences per GCM (large for ECHAM5 and IPSL with different directions).

Technical Report No.11 - 29 -
Figure 4.11 Average change in annual flow (2021-2050 and 2071-2100) relative to 1971-2000 for all
cells in Portugal as obtained from the multi-model mean runoff of six large-scale hydrological models that were forced by three GCMs (CNRM, ECHAM5 and IPSL) for A2 and B1 scenarios (WATCH data). The bar CTRL indicates lack of model skill, i.e. relative difference (%) in annual flow obtained from the multi-model mean annual runoff of six large-scale models that were forced by three GCMs (downscaled and bias-corrected) and the same models forced with WATCH Forcing Data (reanalysis data) for the control period (1971-2000).
Changes in Droughts All three GCMs agree on an increase of average drought duration (Fig. 4.12, left). The data suggests a relatively larger increase in average drought duration for the far future than for the intermediate future. The lack of model skill for these predictions is small. The A2 scenario predicts a relatively small increase of average drought duration of about 120% for the intermediate future (CNRM and ECHAM5) and a larger increase of about 290-340% for the far future (~85 days). IPSL projects an increase of about 50% for both scenarios. Also the B1 scenario predicts a relatively small increase of average drought duration of about 50-70% (CNRM and ECHAM5) for the intermediate future and a high increase of about 155-205% for the far future.
Figure 4.12 Average change in drought characteristics flow (2021-2050 and 2071-2100) relative to
1971-2000 for all cells in Portugal as obtained from the multi-model mean runoff of six large-scale hydrological models that were forced by three GCMs (CNRM, ECHAM5 and IPSL) for A2 and B1 scenarios (WATCH data). Left: change in average drought duration, and right: change in average deficit volume. The bar CTRL indicates lack of model skill, i.e. relative difference (%) in drought characteristics derived from the multi-model mean runoff of six large-scale models that were forced by three GCMs (downscaled and bias-corrected)

Technical Report No.11 - 30 -
and the same models forced with WATCH Forcing Data (reanalysis data) for the control period (1971-2000).
Again all three GCMs are in agreement on an increase in average deficit volume with a good model performance (Fig. 4.12, right). The data suggests again a relatively larger increase in average drought deficit volume for the far future than for the intermediate future (except IPSL). The A2 scenario for these two models for the far future suggests a relatively large increase in average deficit volume between 550-720% (16.4 - 13.8 mm). For the other scenarios and time periods, an average deficit volume of about 50-100% is suggested, except for the slightly higher predictions of the CNRM data for the B1 scenario (2071-2100). 4.5. Switzerland Changes in Temperature and Precipitation The change in mean annual temperature predicted by the three GCMs shows a fairly similar trend (Fig. 4.13, left). The lack of model skill is relatively large, about -2.0OC. The temperature for the A2 and B1 scenario in the nearby future rises with roughly 1.4OC. For the far future, the A2 and B1 scenario suggests a larger increase in mean annual temperature. The A2 scenario predicts a mean annual temperature rise between 3.7 and 4.9OC for the period 2071-2100. The B1 scenario gives a slightly lower prediction for this period, roughly 2.4OC. The model performance for these predictions is really low; the lack of model skill is too large for a good prediction of the changes in annual precipitation (Fig. 4.13, right). The data shows a decrease of precipitation around 5%, while the lack of model skill has an overestimation of roughly 30%.
Figure 4.13 Average change in future weather data (2021-2050 and 2071-2100) for all cells in
Switzerland relative to 1971-2000 as predicted by three GCMs (CNRM, ECHAM5 and IPSL) for A2 and B1 scenarios (WATCH data). Left: change in temperature, and right: precipitation. The bar CTRL indicates lack of model skill, i.e. relative difference (%) between GCM (downscaled and bias-corrected) and WATCH Forcing Data (reanalysis data) for the control period (1971-2000).
Changes in Flows The model performance for these predictions is really low; the lack of model skill is too large for a good prediction of the changes in annual flow (Fig. 4.14). The data shows a decrease of flow of around 5-30% (except IPSL: about 70%), while the lack of model skill has an overestimation of roughly 140%.

Technical Report No.11 - 31 -
Figure 4.14 Average change in annual flow (2021-2050 and 2071-2100) relative to 1971-2000 for all cells in Switzerland as obtained from the multi-model mean runoff of six large-scale hydrological models that were forced by three GCMs (CNRM, ECHAM5 and IPSL) for A2 and B1 scenarios (WATCH data). The bar CTRL indicates lack of model skill, i.e. relative difference (%) in annual flow obtained from the multi-model mean annual runoff of six large-scale models that were forced by three GCMs (downscaled and bias-corrected) and the same models forced with WATCH Forcing Data (reanalysis data) for the control period (1971-2000).
Changes in Droughts All three GCMs show an increase of average drought duration (Fig. 4.15, left). The lack of model skill for these predictions is relatively small (~15%). The A2 scenario shows a smaller increase of average drought duration for the intermediate future than for the far future (CNRM and ECHAM5, 100-230%, 32 to 58 days). IPSL projects no difference between both time periods (about 50%). For the B2 scenario, the models show a less distinct pattern. The predictions are not clear if there is a higher increase of average drought duration for the far future than the intermediate future. The estimated average drought duration for the IPSL data is quite large (over 150% for both future periods).
Figure 4.15 Average change in drought characteristics flow (2021-2050 and 2071-2100) relative to
1971-2000 for all cells in Switzerland as obtained from the multi-model mean runoff of six large-scale hydrological models that were forced by three GCMs (CNRM, ECHAM5 and IPSL) for A2 and B1 scenarios (WATCH data). Left: change in average drought duration, and right: change in average deficit volume. The bar CTRL indicates lack of model skill, i.e. relative difference (%) in drought characteristics derived from the multi-model mean runoff of six large-scale models that were forced by three GCMs (downscaled and bias-corrected) and the same models forced with WATCH Forcing Data (reanalysis data) for the control period (1971-2000).

Technical Report No.11 - 32 -
Again all three GCMs show an increase in average deficit volume (Fig. 4.15, right). The lack of model skill varies from 55 to 100.0%. Increases from about 50-100% are projected by all models, scenarios and future periods. Exceptions are: (i) CNRM for the A2 scenario for the period 2071-2100, which shows an increase of 650% (54.9 mm), and (ii) IPSL for the B1 scenario for both future periods (>1000%). 4.6. Syros Changes in Temperature and Precipitation The change in mean annual temperature predicted by the three GCMs show a fairly similar trend (Fig. 4.16, left). The temperature for the A2 and B1 scenario in the nearby future rises with roughly 1.5OC. For the far future, the A2 and B1 scenario suggests a larger increase in mean annual temperature. The A2 scenario predicts roughly a mean annual temperature rise of 5.5OC for the period 2071-2100. The B1 scenario gives a slightly lower prediction of roughly 3.5OC. This estimation is supported by the small lack of model skill. The statistics of the three GCMs indicate a decrease in the annual precipitation (Fig. 4.16, right). The CNRM and ECHAM5 model show almost the same pattern in predictions, with a decrease of annual precipitation for the A2 scenario of about 7% for the intermediate future and 34% for the far future. The B2 scenario shows less difference per time period. They estimate a decrease of about 10% for the period 2021-2050 and 15% for the period 2071-2100. The IPSL model indicates a smaller decrease of the annual precipitation. But the lack of model skill for this forcing data is relatively larger.
Figure 4.16 Average change in future weather data (2021-2050 and 2071-2100) for all cells in Syros
relative to 1971-2000 as predicted by three GCMs (CNRM, ECHAM5 and IPSL) for A2 and B1 scenarios (WATCH data). Left: change in temperature, and right: precipitation. The bar CTRL indicates lack of model skill, i.e. relative difference (%) between GCM (downscaled and bias-corrected) and WATCH Forcing Data (reanalysis data) for the control period (1971-2000).
Changes in Flows The A2 scenario projects a decrease in annual flow with the same trend for all three GCMs. For the intermediate future a decrease of about 15-35% in annual flow is predicted (Fig. 4.17). For the far future larger decreases around 60% in annual flow are suggested for CNRM and ECHAM5 (mean annual flow 0.15 mm/d). The B1 scenario shows different estimations for all three models between -45% and +40%. The model performance differences per GCM. Particularly the lack of model skill for the ECHAM5 is relatively large.

Technical Report No.11 - 33 -
Figure 4.17 Average change in annual flow (2021-2050 and 2071-2100) relative to 1971-2000 for all
cells in Syros as obtained from the multi-model mean runoff of six large-scale hydrological models that were forced by three GCMs (CNRM, ECHAM5 and IPSL) for A2 and B1 scenarios (WATCH data). The bar CTRL indicates lack of model skill, i.e. relative difference (%) in annual flow obtained from the multi-model mean annual runoff of six large-scale models that were forced by three GCMs (downscaled and bias-corrected) and the same models forced with WATCH Forcing Data (reanalysis data) for the control period (1971-2000).
Changes in Droughts All three GCMs agree on an increase of average drought duration (Fig. 4.18, left), although IPSL projects very small changes. The lack of model skill for these predictions is relatively small. The A2 scenario predicts a relatively small increase of average drought duration of about 85% for the intermediate future and a large increase of about 310-350% for the far future (~77 days) for CNRM and ECHAM5. For the B2 scenario, the models show a less distinct pattern. CNRM projects a decrease in duration over the 21st century, whereas ECHAM5 expects the opposite.
Figure 4.18 Average change in drought characteristics flow (2021-2050 and 2071-2100) relative to
1971-2000 for all cells in Syros as obtained from the multi-model mean runoff of six large-scale hydrological models that were forced by three GCMs (CNRM, ECHAM5 and IPSL) for A2 and B1 scenarios (WATCH data). Left: change in average drought duration, and right: change in average deficit volume. The bar CTRL indicates lack of model skill, i.e. relative difference (%) in drought characteristics derived from the multi-model mean runoff of six large-scale models that were forced by three GCMs (downscaled and bias-corrected) and the same models forced with WATCH Forcing Data (reanalysis data) for the control period (1971-2000).

Technical Report No.11 - 34 -
Again all three GCMs agree on an increase in average deficit volume with a good model performance (Fig. 4.18, right). For most of the models, the scenarios and time periods, the increase is about 40-100%. Exceptions are: (i) CNRM and ECHAM5, A2 scenario for the far future (approximately 800%), and (ii) CNRM for the B1 scenario and both time periods (270-400%).

Technical Report No.11 - 35 -
5. Discussion and Concluding remarks The study on future droughts in selected European case study areas leads to the following findings: Jucar � Information collected at the national scale in Spain shows that it is very likely that the temperature
will increase (Sect. 3.1). This is confirmed with the analyses of the GCM forcing obtained from three climate models used in the WATCH project (Sect. 4.1). Precipitation projections are more uncertain. Projected precipitation reduction is largest in SE Spain, where the Jucar River basin is located. However, there uncertainties are largest as well. Two GCMs used in the WATCH project predict a clear decrease of the precipitation, whereas one GCM simulates still an increase in the intermediate future, and a small decrease by the end of the 21st century (Fig. 4.1, Table 5.1).
� Clearly, uncertainties in projected precipitation propagate in the future streamflow and associated hydrological droughts. Likely the streamflow becomes lower in the Jucar River basin in the 21st century when the A2 scenario will happen. For the B2 scenario, results are less clear. This is in agreement with the multi-model mean annual flow from five large-scale hydrological models (GHMs), which were forced with three different GCMs, so-called WATCH GHM-GCM model combinations (Fig. 4.2, Table 5.3). According to most GHM-GCM models combinations the droughts become longer and more severe (larger deficit volume) (Fig. 4.3).
The Netherlands � Information provided by the Netherlands Royal Meteorological Institute (KNMI) says that temperature
will continue to rise, hot summers will become more common, on average. This is in agreement with the analyses of the GCM forcing obtained from three climate models used in the WATCH project (Sect. 4.2). KNMI also projects that although intensity of extreme rain showers in summer will increase, number of rainy days in summer will decrease.
� Temperature and potential evapotranspiration likely will increase in the Netherlands irrespective of the climate scenario. Precipitation projections are more divers (see also the analyses of the WATCH climate model data, Fig. 4.4, Table 5.1). If temperature increase is limited (1oC) and circulation patterns do not change, increase in precipitation likely will counterbalance increase of potential evapotranspiration. However, if temperature increase is more pronounced (2oC) and circulation patterns do change (more easterly, dry, continental winds) then precipitation decrease and potential evapotranspiration increase are 15-20% likely leading to water shortages. Precipitation deficit is expected to increase by 4-5% or 8-11% dependent on the temperature increase. However, if another air circulation pattern (more easterlies) would occur then this would lead to a substantial increase of the deficit, up to several tens of per cent.
� Change in climate forcing in the Netherlands will have impact on hydrology. The soil moisture deficit in an extremely dry year averaged over the whole country would increase from 155 mm (current conditions) to up to 227 mm for the most extreme climate scenario. In more than 30% of the area the mean lowest groundwater level would drop more than 25 cm for this scenario.
� Both the Rhine River and Meuse River on the border with the Netherlands is expected to have higher winter flows (up to 10-20%) and lower summer flows (up to 30-40%). Flow is projected to be lower than 1250 m3/s-1, which is key threshold for Dutch drought management, for about 10-20% of the time, dependent on the climate scenario. The WATCH GHM-GCM model combinations are uncertain about the change in the annual flow, but robust outcome was achieved for the drought duration and severity, which will become longer and more severe, respectively (Sect. 4.2, Table 5.3).
Po River Basin � Information collected in the Alpine region illustrates that during dry episodes, snowfields and glacier
substantially contribute to the flow the Po River. Several sources report about considerable retreat of

Technical Report No.11 - 36 -
glaciers in the European Alps with a remarkable effect on biotic components of the ecosystem. There are alarming messages that substantial parts of the Alpine glaciers might disappear in the coming decades. Modeling experiments, however, show that it is very hard to reliably model the impact of climate change on glaciers because the hypsometry of individual glaciers is very relevant, which makes it difficult to transfer results to other places.
� The analyses with the WATCH forcing data is clear about a temperature increase, but change in future precipitation is rather uncertain (Sect. 4.3, Table 5.1). This leads to uncertainty in the projected change of the annual flow. The WATCH GHM-GCM model combinations generate more robust results for the drought duration and drought deficit volume, which both will become larger (Fig. 4.9, Table 5.3).
Portugal � National studies in Portugal clearly project a temperature increase (2-3oC by 2050, and 3.5-5.5oC by
2100). Precipitation projections are more uncertain, but almost all models predict a reduction by the end of the 21st century. This is confirmed by the analyses with the output from the climate models from the WATCH project. Temperature will become higher, and precipitation likely will become higher (Fig. 4.10, Table 5.1).
� It also appears from the national information that most of the models simulation predict a runoff reduction by the end of 21th century in Portugal. The reduction is expected to be rather small in the northern hydrographical regions, but increases progressively towards the south. The WATCH GHM-GCM model combinations do not distinguish between north and south Portugal. However, overall the annual flow is projected to decrease (Fig. 4.11) and drought duration and drought deficit volume both very likely will become larger (Fig. 4.12, Table 5.3).
Switzerland � National information collected in Switzerland learns that the projected decrease in summer
precipitation, together with the effects of increasing temperatures and evapotranspiration may trigger water shortages during the summer months. An increase in winter precipitation is unlikely to mitigate these effects, as a rising snow line implies that less water is stored as snow. Especially the changes in snow dynamics and the reduction of glaciers may also have consequences for downstream countries (Italy, Po River; France, Rhone River; Germany and the Netherlands, Rhine River), owing to the role of Switzerland as the “water tower of Europe".
� The analyses with the WATCH forcing data is clear about a temperature increase, but change in future precipitation is rather uncertain (Fig. 4.13, Table 5.1). The reliability of the precipitation derived from the GCM forcing is rather low. This leads to uncertainty in the projected change of the annual flow, which, however, points at lower annual flow. The WATCH GHM-GCM model combinations generate more robust results for the drought duration and drought deficit volume, which both will become larger. The projected magnitude of change in drought characteristics is very different among the models (Fig. 4.15, Table 5.3).
Syros � Local information collected for Syros Island shows that future drought in the Cyclades will become
less severe if historic trends were extrapolated, however, if climate projections from the HadCM3/A1F model were implemented, percentage of severe and extreme drought will increase. Precipitation projections derived from the PRUDENCE project indicate, in particular for the A2 scenario a substantial decrease of annual precipitation (about 10-20%, dependent on the future time window). Impact on precipitation using the outcome of the ENSEMBLES project is slightly lower (5-20%). A lower annual precipitation likely will lead to more droughts.
� The analyses with the WATCH forcing data is clear about a temperature increase (it might be 3.5-5.5 oC by the end of the 21st century, Fig. 4.16). Future precipitation likely will become lower, in

Technical Report No.11 - 37 -
particular by the end of the century (Sect. 4.6, Table 5.1). Flow in the Syros is already low, but it likely will become even lower (Fig. 4.17). The WATCH GHM-GCM model combinations generate robust results for the drought duration and drought deficit volume, which both will become larger (Fig. 4.18, Table 5.3).
Projected change in forcing and flow and drought characteristics derived from WATCH data The impact climate change on the multi-model mean flow as obtained with the different WATCH GHM-GCM model combinations depends on the change in GCM’ forcing (i.e. change in temperature and precipitation). The forcing simulated with the GCMs gains confidence if more climate models point in the same direction. Table 5.1 gives information per case study area, whether all three GCMs project an increase or a decrease of the temperature and precipitation. Table 5.1 Mono-directionality2) of climate change projections as obtained from three GCMs (CNRM,
ECHAM5, IPSL)
Characteristic Case study area
A2 scenario B1 scenario
2021-2050 2071-2100 2021-2050 2071-2100 Temperature Jucar River + + + +
Netherlands + + + + Po River + + + + Portugal + + + +
Switzerland + + + + Syros + + + +
Precipitation Jucar River - - o - Netherlands o o o o
Po River - o o o Portugal - - o -
Switzerland o o o - Syros - - o -
2) +: all 3 GCMs agree on an increase, o: not all GCMs agree on increase or decrease, and -: all 3 GCMs agree on a decrease This investigations leads to the following observations: � As expected, all GCMs project for all future situations in all case study areas an increase of the
annual temperature; � The projected change of the precipitation is more uncertain. In more than 50% of the cases not all
three GCMs agree on the direction of the change. The highest uncertainty is for the Netherlands and the B1 scenario for the intermediate future (2021-2050) for all case study areas.
The evaluation of the low flow characteristics and drought characteristics derived from the multi-model mean flow obtained from the WATCH GHM-GCM model combinations versus the multi-model mean flow obtained from the WATCH GHM-WFD model combinations for the control period provided a measure for the quality of the GCM forcing, i.e. GCM or climate model skill (Sect. 2.4 and Fig. 2.2). The climate change signal (% change of a characteristic in the future relative to the control period) gains more confidence, if the signal is larger than the lack of model skill. Table 5.2 provides the percentage of cases that the impact of the climate signal on the flow and drought characteristics is larger than the skill. From the evaluation we can learn that: � Change in multi-model mean annual flow due to climate change is more than half of the cases
smaller than the lack of model skill, which makes that the annual flow projections should be interpreted with caution;

Technical Report No.11 - 38 -
� Change in drought characteristics due to climate change is in about 80% of the cases or more larger than the lack of model skill, which makes the assessment for the these characteristics more reliable than for the flow characteristics;
� Impact of climate change signal on the flow and drought characteristics is in more cases larger than the lack of model skill for: (i) A2 scenario relative to B1 scenario, and (ii) far future (2071-2100) relative to the intermediate future (2021-2050).
Table 5.2 Number of cases1) (%) that the impact of the climate signal on the flow and drought
characteristics is larger than the lack of model skill
Characteristic A2 scenario B1 scenario
2021-2050 2071-2100 2021-2050 2071-2100 Annual flow 45 45 28 38 Drought duration 94 94 89 89 Drought deficit volume 78 94 89 83
1) n=18 (6 case study areas and 3 GCMs) per combination of characteristic, scenario and time period.
The assessment of the impact of climate change on the flow and drought characteristics gains confidence if more models point in the same direction. Table 5.2 gives information per case study area, whether a certain characteristic derived from all three GCM’ forcing project an increase or a decrease of this characteristic. This investigations leads to the following observations: � In 50% of the cases (combinations of scenario and future period) the multi-model mean annual flow
is projected to decrease for all 3 GCM forcings. In the other 50% cases the annual flow increases according one of the GCM forcings;
� The projections for the drought characteristics derived from the multi-model mean flow are more robust that the flow characteristics. The average drought duration and the deficit volume is projected to increase for almost all cases, irrespective of the GCM forcing that was used. This applies to 87% of the cases for the drought duration, and to 96% for the deficit volume.
Table 5.2 Mono-directionality2) of flow and hydrological drought characteristics derived from three climate change projections
Characteristic Case study area
A2 scenario B1 scenario
2021-2050 2071-2100 2021-2050 2071-2100 Annual flow Jucar River - - o o
Netherlands o o o o Po River - o o o Portugal - - o -
Switzerland - - - - Syros - - o o
Drought duration Jucar River o o + + Netherlands + + + +
Po River + + + + Portugal + + + +
Switzerland + + + + Syros + + o +
Drought deficit volume
Jucar River + o + + Netherlands + + + +
Po River + + + + Portugal + + + +
Switzerland + + + + Syros + + + +
2) +: all 3 GCMs agree on an increase, o: not all GCMs agree on increase or decrease, and -: all 3 GCMs agree on a decrease.

Technical Report No.11 - 39 -
References Alderlieste, M.A.A., and Van Lanen, H.A.J. (2012): Trends in low flow and drought in selected European areas
derived from WATCH forcing data and simulated multi-model mean runoff. DROUGHT-R&SPI Technical Report No. 1 [available at: http://www.eu-drought.org/], Wageningen University, the Netherlands.
Alderlieste, M.A.A., and Van Lanen, H.A.J. (2013): Change in future low flow and drought in selected European areas derived from WATCH GCM Forcing Data and simulated multi-model runoff. DROUGHT-R&SPI Technical Report No. 5, [available at: http://www.eu-drought.org/], Wageningen University, the Netherlands.
AEMET (2008): Generation of regionalized scenarios of climate change for Spain”. Report State Agency for Meteorology (AEMET), Spain.
APA, I.P. and ARH Norte, I.P. (2012): Plano de gestão da região hidrográfica do Minho e Lima (RH1). Relatório base. Parte 2 - Caracterização e diagnóstico da região hidrográfica. Final technical report. MAMAOT, Ministry of Agriculture, Sea, Environment and Spatial Planning (in Portuguese).
APA, I.P. and ARH Norte, I.P. (2012a): Plano de gestão da região hidrográfica do Cávado,Ave e Leça (RH2). Relatório base. Parte 2 - Caracterização e diagnóstico da região hidrográfica. Final technical report. MAMAOT, Ministry of Agriculture, Sea, Environment and Spatial Planning (in Portuguese).
APA, I.P. and ARH Norte, I.P. (2012b). Plano de gestão das bacias hidrográficas que integram a Região Hidrográfica do Douro (RH3). Relatório base. Parte 2 - Caracterização e diagnóstico da região hidrográfica. Final technical report. MAMAOT, Ministry of Agriculture, Sea, Environment and Spatial Planning (in Portuguese).
APA, I.P. and ARH Centro, I.P. (2012): Plano de gestão das bacias hidrográficas do Vouga, Mondego e Lis que integram a Região Hidrográfica (RH4). Relatório base. Parte 2 - Caracterização e diagnóstico da região hidrográfica. Final technical report. MAMAOT, Ministry of Agriculture, Sea, Environment and Spatial Planning (in Portuguese).
APA, I.P. and ARH Tejo, I.P. (2012): Plano das bacias hidrográficas das Ribeiras do Oeste. Final technical report. MAMAOT, Ministry of Agriculture, Sea, Environment and Spatial Planning (in Portuguese).
APA, I.P. and ARH Tejo, I.P. (2012a): Plano de gestão Região Hidrográfica (PGRH) do Tejo (RH5). Relatório base. Parte 2 - Caracterização e diagnóstico da região hidrográfica. Final technical report. MAMAOT, Ministry of Agriculture, Sea, Environment and Spatial Planning (in Portuguese).
APA, I.P. and ARH Alentejo, I.P. (2012): Plano de gestão das bacias hidrográficas integradas na região hidrográfica do Sado e Mira (RH5). Relatório base. Parte 2 - Caracterização e diagnóstico da região hidrográfica. Final technical report. MAMAOT, Ministry of Agriculture, Sea, Environment and Spatial Planning (in Portuguese).
APA, I.P. and ARH Alentejo, I.P. (2012a): Plano de gestão das bacias hidrográficas integradas na região hidrografica do Guadiana (RH7). Relatório base. Parte 2 - Caracterização e diagnóstico da região hidrográfica. Final technical report. MAMAOT, Ministry of Agriculture, Sea, Environment and Spatial Planning (in Portuguese).
APA, I.P. and ARH Algarve, I.P. (2012): Plano de gestão das bacias hidrográficas que integram a região hidrografica das ribeiras do Algarve (RH8). Relatório base. Parte 2 - Caracterização e diagnóstico da região hidrográfica. Final technical report. MAMAOT, Ministry of Agriculture, Sea, Environment and Spatial Planning (in Portuguese).
Bank of Greece (2011) Environmental, Economic and Social impacts of Climate Change in Greece, Climate Change Impacts Committee [Available in Greek from: http://www.bankofgreece.gr/Pages/el/klima/default.aspx].
Belo-Pereira M., Dutra E. and Viterbo P. (2011): Evaluation of global precipitation data sets over the Iberian Peninsula. J. Geophys. Res., 116, D20101, doi:10.1029/2010JD015481.
Bergsma T., E. Querner en H. Van Lanen (2010): Studying the Rhine basin with SIMGRO; Impact of climate and land use changes on discharge and hydrological droughts. Alterra. Rapport 2082, Wageningen.
Cannone, N., G. Diolaiuti, M. Guglielmin and C. Smiraglia (2008): Accelerating climate change impacts on Alpine glacier forefield ecosystems in the European Alps. Ecological Applications 18:637–648.
Cardoso R.M., Soares P.M.M., Miranda P.M.A. and Belo-Pereira M. (2012): WRF high resolution simulation of Iberia mean and extreme precipitation climate. Int. J. Climatol. DOI:10.1002/joc.3616.

Technical Report No.11 - 40 -
Cardoso R. M., Soares P.M.M., Miranda, P.M.A., Belo-Pereira M. and Medeiros, J. (2012a): Iberian mean and extreme precipitation climate: WRF-Cordex regional simulations. Geophysical Research Abstract, 14: EGU2012-11696.
CEDEX (2010): Assesment of the impacts of climate change on water resources in natural regime. Report Hydrographic Studies Center (CEH), Spanish Governmental Research Institute CEDEX.
C2SM, MeteoSwiss, ETH Zurich, NCCR Climate, and OcCC (Eds.) (2011): Swiss Climate Change Scenarios CH2011. 2011. URL http://www.ch2011.ch/.
Chen, C., Haerter, J. O., Hagemann, S., and Piani, C. (2011): On the contribution of statistical bias correction to the uncertainty in the projected hydrological cycle. Geophys. Res. Lett. 38(20):L20403.
Corzo-Perez, G. A., Van Lanen, H.A.J., Bertrand, N., Chen, C., Clark, D., Folwell, S., Gosling, S., Hanasaki, N., Heinke, J. and Voβ, F. (2011): Drought at the global scale in the 21st century. Tech. Rep. 43, EU WATCH (Water and global Change) project [available on www.eu.watch.org].
Costa A.C. (2011): Local patterns and trends of the Standard Precipitation Index in southern Portugal (1940–1999), Adv. Geosci., 30: 11–16, doi:10.5194/adgeo-30-11-2011.
Cunha R. (2008): Definição de cenários de referencia para avaliação dos impactos da seca. Master thesis in Civil engeneering. Faculdade de engenharia da Universidade do Porto. (in Portuguese).
Cunha L.V., Oliveira R. and Nunes V.(2002): Water resources. In: Santos F.D., Forbes K. and Moita R. (Eds). Climate Change in Portugal. Scenarios, impacts and adaptations measures. SIAM project. Gradiva. Lisbon. pp 135-171.
Cunha L.V., Oliveira R. and Nascimento J. (2006): Recursos hídricos. In: Santos, F. D and Miranda P. (Eds). Alterações Climáticas em Portugal, Cenários, Impactos e Medidas de Adaptação. Projecto SIAM II. Gradiva, Lisbon, pp:117-168 (in Portuguese).
Dias A.P. (Coord.) (2013): Adaptação das florestas às alterações climáticas. Relatório no âmbito da Estratégia Nacional de adaptação às Alterações Climáticas. ICNF, Ministério da Agricultura, do Mar, do ambiente e do ordenamento do território, 122 pp., Lisboa (in Portuguese).
De Haas, S.A. and Niemeijer, A.H. (2007): Investeringsruimte voor toekomstige droogte. Verkenning van hdyrologische effecten en economische schade in de KNMI ’06 klimaatscenario’s (Investment options future drought. Exploration of hydrological impact and economic impact, KNMI ’06 climate scenarios). Rapport Royal Haskoning/Rijkswaterstaat/RIZA. (in Dutch).
De Lima, M.I.P., Carvalho, S.C.P., De Lima, J.L.M.P. and Coelho, M.F.E.S. (2010): Trends in precipitation: analysis of long annual and monthly time series from mainland Portugal, Adv. Geosci., 25:155–160, doi:10.5194/adgeo-25-155-2010.
Déqué, M. and Piedelievre, J.P. (1995): High resolution climate simulation over Europe. Climate Dynamics 11: 321-339.
Dutra E., Viterbo P. and Miranda P.M. (2008): ERA-40 reanalysis hydrological applications in the characterization of regional drought. Geophys. Res. Lett., 35: L19402, doi:10.1029/2008GL035381.
EEA (2010): Mapping the impact of natural hazards and technological accidents in Europe. An overview of the last decade. Tech. Rep. 13/2010, EEA, Copenhagen.
Fleig, A. K., Tallaksen, L. M., Hisdal, H., and Demuth, S. (2006): A global evaluation of streamflow drought characteristics. Hydrology and Earth System Sciences 10(4):535--552.
Gudmundsson, L., et al., (2011): Comparing large-scale hydrological model simulations to observed runoff percentiles in Europe. Journal of Hydrometeorology 13 (2), 604-620, doi: 10.1175/JHM-D-11-083.1.
Haeberli, W. and Beniston, M. (1998): Climate Change and Its Impacts on Glaciers and Permafrost in the Alps. Ambio 27(4): 258-265.
Haddeland, I., et al., (2011): Multimodel estimate of the global terrestrial water balance: Setup and first results. Journal of Hydrometeorology 12 (5), 869-884, doi: 10.1175/2011JHM1324.1.
Haerter, J. O., Hagemann, S., Moseley, C., and Piani, C. (2011): Climate model bias correction and the role of timescales. Hydrology and Earth System Sciences 15(3): 1065-1079.
Hannah, D.M., Demuth, S., Van Lanen, H.A.J., Looser, U., Prudhomme, C., Rees, R., Stahl, K., Tallaksen, L.M. (2011) Large-scale river flow archives: importance, current status and future needs. Hydrological Processes 25 (7): 1191-1200, doi: 10.1002/hyp.7794.
Herrera S., Fita L., Fernandez J. and Gutierrez J.M. (2010): Evaluation of the mean and extreme precipitation regimes from the ENSEMBLES model simulations over Spain. J. Geophys. Res. 115: D21117, DOI: 10.1029/2010JD013936.

Technical Report No.11 - 41 -
Hisdal, H., Tallaksen, L. M., Clausen, B., Peters, E., and Gustard, A. (2004): Drought characteristics. In Tallaksen, L.M. and Van Lanen, H.A.J, editors, Hydrological drought: processes and estimation methods for streamflow and groundwater, Developments in Water Science; 48, pg. 139--198. Elsevier.
Hourdin, F., Musat, I., Bony, S., Braconnot, P., Codron, F., Dufresne, J.-L., Fairhead, L., Filiberti, M.-A., Friedlingstein, P., Grandpeix, J.-Y., Krinner, G., LeVan, P., Li, Z.-X., and Lott, F. (2006). The lmdz4 general circulation model: climate performance and sensitivity to parametrized physics with emphasis on tropical convection. Climate Dynamics 27: 787--813.
Klein Tank, A.M.G. and G. Lenderink (Eds.) (2009): Climate change in the Netherlands; Supplements to the KNMI’06 scenarios, KNMI, De Bilt, The Netherlands.
Klijn, F., Kwadijk, J., De Bruijn, K. and Hunink, J. (2010): Overstromingsrisico's en droogterisico's in een veranderend klimaat - verkenning van wegen naar een klimaatveranderingsbestendig Nederland (Risk on flooding and drought in a changing climate: Exploration of ways towards a climate resilent Netherlands). Report Deltares (in Dutch).
Martins D.S., Raziei T., Paulo A.A. and Pereira L.S. (2012): Spatial and temporal variability of precipitation and drought in Portugal. Nat. Hazards Earth Syst. Sci., 12: 1493-1501. Doi:10.5194/nhess-12-1493-2012
Miranda P.M.A., Valente M.A., Tomé A.R., Trigo R., Coelho M F. Aguiar A. and Azevedo E.B. (2006): O Clima de Portugal nos séculos XX e XXI. In: Santos, F. D., Forbes, K., and Moita, R. (Eds.), Climate Change in Portugal: Scenarios, Impacts and Adaptation Measures – SIAM II Project Gradiva, Lisbon, 47–113 (in Portuguese).
Nakićenović, N. and R. Swart (2000): Special Report on Emissions Scenarios: A special report of Working Group III of the Intergovernmental Panel on Climate Change. Cambridge University Press.
NOAA (2012): www.ncdc.noaa.gov/sotc/drought/2012. OcCC/ProClim (Ed.) (2007): Climate Change and Switzerland 2050 (2007): Expected Impacts on Environment,
Society and Economy. OcCC / ProClim, 2007. URL http://www.proclim.ch/4dcgi/proclim/en/Media?794. Oerlemans, J., Anderson, B., Hubbard, A., Huybrechts, P., Johannesson, T., Knap, W., Schmeits, M., Stroeven,
A., Wal, R., Wallinga, J. and Zuo, Z. (1998): Modelling the response of glaciers to climate warming. Climate Dynamics 14(4): 267-274.
Piani, C., Haerter, J., and Coppola, E. (2010a): Statistical bias correction for daily precipitation in regional climate models over Europe. Theoretical and Applied Climatology 99: 187--192.
Piani, C., Weedon, G., Best, M., Gomes, S., Viterbo, P., Hagemann, S., and Haerter, J. (2010b): Statistical bias correction of global simulated daily precipitation and temperature for the application of hydrological models. Journal of Hydrology 395(3-4):199 -- 215.
Prudhomme, C., S. Parry, J. Hannaford, D. B. Clark, S. Hagemann, and F. Voss, 2011: How well do large-scale models reproduce regional hydrological extremes in Europe? Journal of Hydrometeorology 12 (6), 1181-1204, doi:10.1175/2011JHM1387.1.
Roeckner, E., Bäuml, G., Bonaventura, L., Brokopf, R., Esch, M., Giorgetta, M., Hagemann, S., Kirchner, I., Kornblueh, L., Manzini, E., Rhodin, A., Schlese, U., Schulzweida, U., and Tompkins, A. (2003): The atmospheric general circulation model ECHAM 5. PART I: Model description.
Romm, J. (2011): Desertification: The next dust bowl. Nature 478 (7370), 450-451, doi: 606 10.1038/478450a. Santos F.D., Forbes K. and Moita R. (Eds). (2002): Climate Change in Portugal. Scenarios, impacts and
adaptations measures. SIAM project. Gradiva. Lisbon Santos F.D. and Miranda P. (Eds). (2006). Alterações climáticas em Portugal. Cenários, Impactos e medidas de
adaptação. Projecto SIAM II. Gradiva, Lisboa (in Portuguese). Seneviratne, S. I., Nicholls, N., Easterling, D., Goodess, C. M., Kanae, S., Kossin, J., Luo, Y., Marengo, J.,
McInnes, K., Rahimi, M., Reichstein, M., Sorteberg, A., Vera, C., and Zhang, X. (2012): Changes in climate extremes and their impacts on the natural physical environment. In Field, C. B., Barros, V., Stocker, T. F., Qin, D., Dokken, D. J., Ebi, K. L., Mastrandrea, M. D., Mach, K. J., Plattner, G. K., Allen, S. K., Tignor, M., and Midgley, P. M., editors, Managing the Risks of Extreme Events and Disasters to Advance Climate Change Adaptation, pages 190--230. A Special Report of Working Groups I and II of the Intergovernmental Panel on Climate Change (IPCC). Cambridge University Press, Cambridge, UK and New York, NY, USA.
Sheffiefield, J. and E. F. Wood (2011): Drought : past problems and future scenarios. Earthscan, London. Soares P.M.M., Cardoso R.M., de Medeiros J., Miranda P.M.A., Belo-Pereira M. andEspirito-Santo F. (2012):
WRF high resolution dynamical downscaling of ERA-Interim for Portugal. Climate Dynamics . DOI:10.1007/s00382-012-1315-2

Technical Report No.11 - 42 -
Soares P.M.M., Cardoso R.M., Miranda P.M.A. Viterbo P. and Belo-Pereira M. (2012a): Assessment of the ENSEMBLES regional climate models in the representation of precipitation variability and extremes over Portugal. J. Geophys. Res., 117,D07114.
Stahl, K., L. M. Tallaksen, L. Gudmundsson, and J. H. Christensen, 2011: Streamflow data from small basins: A challenging test to high-resolution regional climate modeling. Journal of Hydrometeorology 12 (5), 900-912, doi:10.1175/2011JHM1356.1.
Stahl, K., L. M. Tallaksen, J. Hannaford, and H. A. J. van Lanen (2012): Filling the white space on maps of european runoff trends: estimates from a multi-model ensemble. Hydrology and Earth System Sciences, 16 (7), 2035-2047, doi:10.5194/hess-16-2035-2012.
Tallaksen, L.M. and Van Lanen, H.A.J. (2004): Hydrological Drought: Processes and estimation methods for streamflow and groundwater. No. 48 in Development in water science, Elsevier Science B.V.
Temez J.R. (1977): Modelo matemático de transformacíon Precipitacion-aportación. ASINEL. Tigkas D. (2008): Drought Characterization and Monitoring in Regions of Greece. European Water 23/24: 29-39. Uppala, S.M., Kållberg, P.W., Simmons, A.J., Andrae, U., Bechtold, V.D.C., Fiorino, M., Gibson, J.K., Haseler, J.,
Hernandez, A., Kelly, G.A., Li, X., Onogi, K., Saarinen, S., Sokka, N., Allan, R.P., Andersson, E., Arpe, K., Balmaseda, M.A., Beljaars, A.C.M., Berg, L.V.D., Bidlot, J., Bormann, N., Caires, S., Chevallier, F., Dethof, A., Dragosavac, M., Fisher, M., Fuentes, M., Hagemann, S., Hólm, E., Hoskins, B.J., Isaksen, L., Janssen, P.A. E. M., Jenne, R., Mcnally, A. P., Mahfouf, J.-F., Morcrette, J.-J., Rayner, N.A., Saunders, R.W., Simon, P., Sterl, A., Trenberth, K.E., Untch, A., Vasiljevic, D., Viterbo, P., and Woollen, J. (2005). The ERA-40 re-analysis. Quarterly Journal of the Royal Meteorological Society 131(612): 2961--3012.
Van den Hurk, B., A. Klein Tank, G. Lenderink, A. van Ulden, G. J. van Oldenborgh, C. Katsman, H. van den Brink, F. Keller, J. Bessembinder, Burgers, G., G. Komen, W. Hazeleger and S. Drijfhout (2006): KNMI Climate Change Scenarios 2006 for the Netherlands. KNMI Scientific Report WR 2006-01, De Bilt, The Netherlands.
Van Lanen, H.A.J. (2011): DROUGHT-R&SPI: Fostering European Drought Research and Science-Policy Interfacing. EU-FP7 project. Description of Work. Wageningen University, The Netherlands.
Van Lanen, H.A.J., Wanders, N., Tallaksen, L.M. and Van Loon, A.F. (2013a): Hydrological drought across the world: impact of climate and physical catchment structure. Hydrol. Earth Syst. Sci. 17: 1715–1732, doi:10.5194/hess-17-1715-2013.
Van Lanen, H.A.J., Alderlieste, M.A.A., Acacio, V., Andreu, J. Garnier, E., Gudmundsson, L., Haro Monteagudo, D., Lekkas, D., Paredes, J., Solera, A., Assimacopoulos, D., Rego, F., Seneviratne, S., Stahl, K. and Tallaksen, L.M. (2013b): Quantitative analysis of historic droughts in selected European case study areas. DROUGHT-R&SPI Technical Report No. 8 [available at: http://www.eu-drought.org/], Wageningen University, the Netherlands.
Van Loon, A. F., Van Lanen, H. A. J., Hisdal, H., Tallaksen, L. M., Fendeková, M., Oosterwijk, J., Horvát, O., and Machlica, A. (2010): Understanding hydrological winter drought in europe. In Servat, E., Demuth, S., Dezetter, A., Daniell, T., Ferrari, E., Ijjaali, M., Jabrane, R., Van Lanen, H., and Huang, Y., editors, Global Change: Facing Risks and Threats to Water Resources, number 340, pages 189-197. IAHS.
Van Vliet, M. T. H., J. R. Yearsley, F. Ludwig, S. Vogele, D. P. Lettenmaier, and P. Kabat (2012): Vulnerability of US and European electricity supply to climate change. Nature Clim. Change, 2(9): 676-681, doi:10.1038/nclimate1546.
Vivas E. and Maia R. (2010): A gestão de escassez e secas enquadrando as alterações climáticas. The water scarcity and droughts’ management framing climate change issues. Recursos Hidricos, 31(1): 25-37.
Weedon, G.P., Gomes, S., Viterbo, P., Shuttleworth, W.J., Blyth, E., Ã-sterle, H., Adam, J. C., Bellouin, N., Boucher, O., and Best, M. (2011): Creation of the watch forcing data and its use to assess global and regional reference crop evaporation over land during the twentieth century. J. of Hydrometeor 12(5):823--848.
Wilhite, D. (2000): Drought: A global assessment. Ed., Routledge. Yevjevich, V. (1967). An Objective Approach to Definitions and Investigations of Continental Hydrologic Droughts.
Hydrology papers, 23. Colorado State University, Fort Collins, USA.

Technical Report No.11 - 43 -
Annex I Observed and simulated streamflow for the J ucar River basin for the control period (1961-1990) and projected flow for t hree future windows covering the period 2012-2100 as predicted with three GCM-regionalisation combinations
Figure I.1 GCM-regionalisation combination for the A2 scenario.
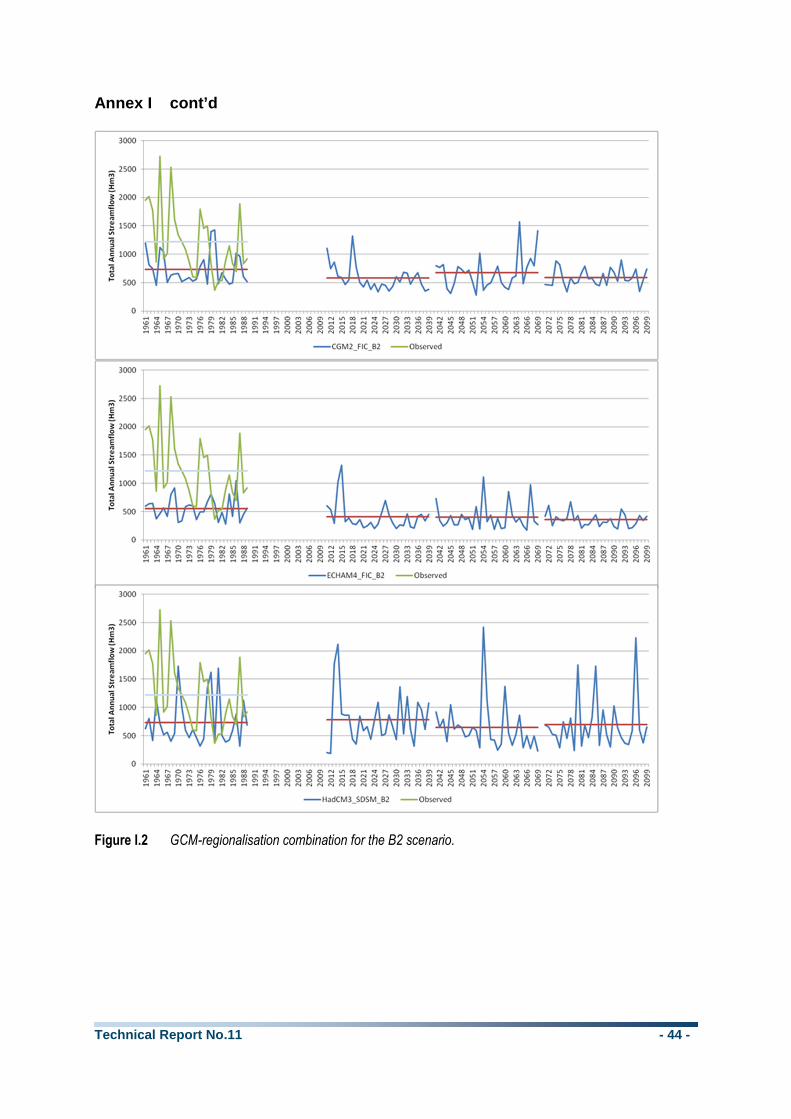
Technical Report No.11 - 44 -
Annex I cont’d
Figure I.2 GCM-regionalisation combination for the B2 scenario.
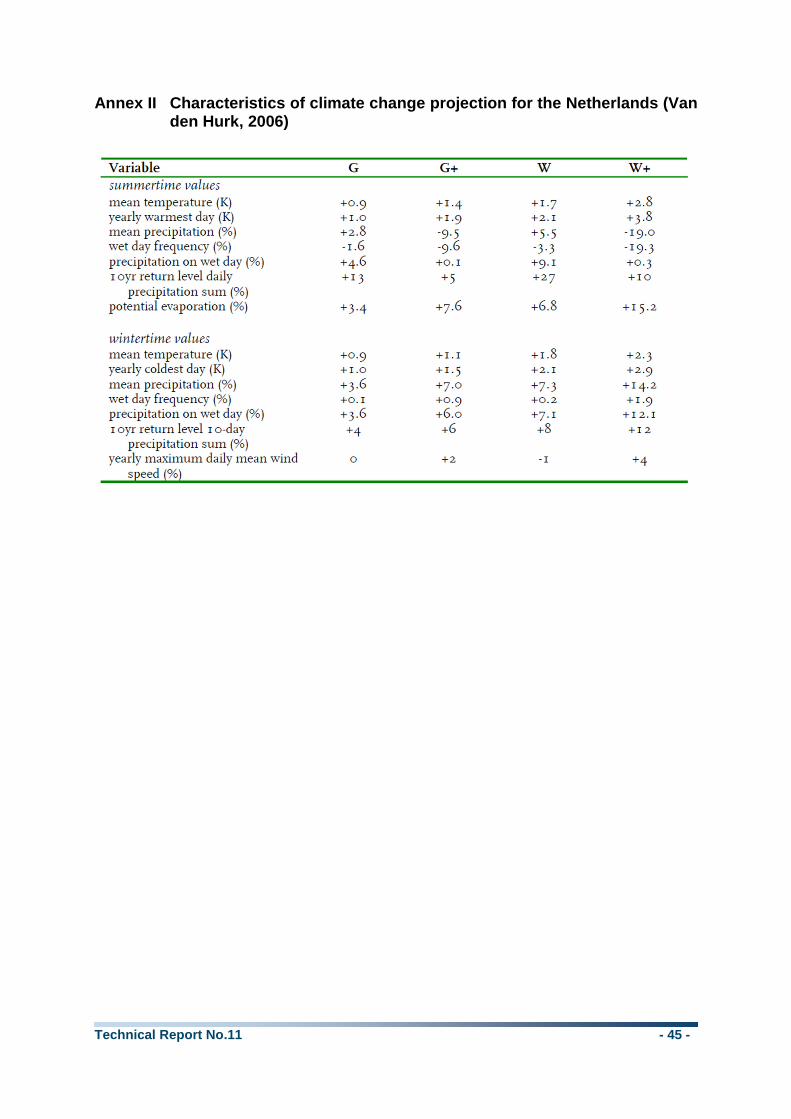
Technical Report No.11 - 45 -
Annex II Characteristics of climate change projecti on for the Netherlands (Van den Hurk, 2006)
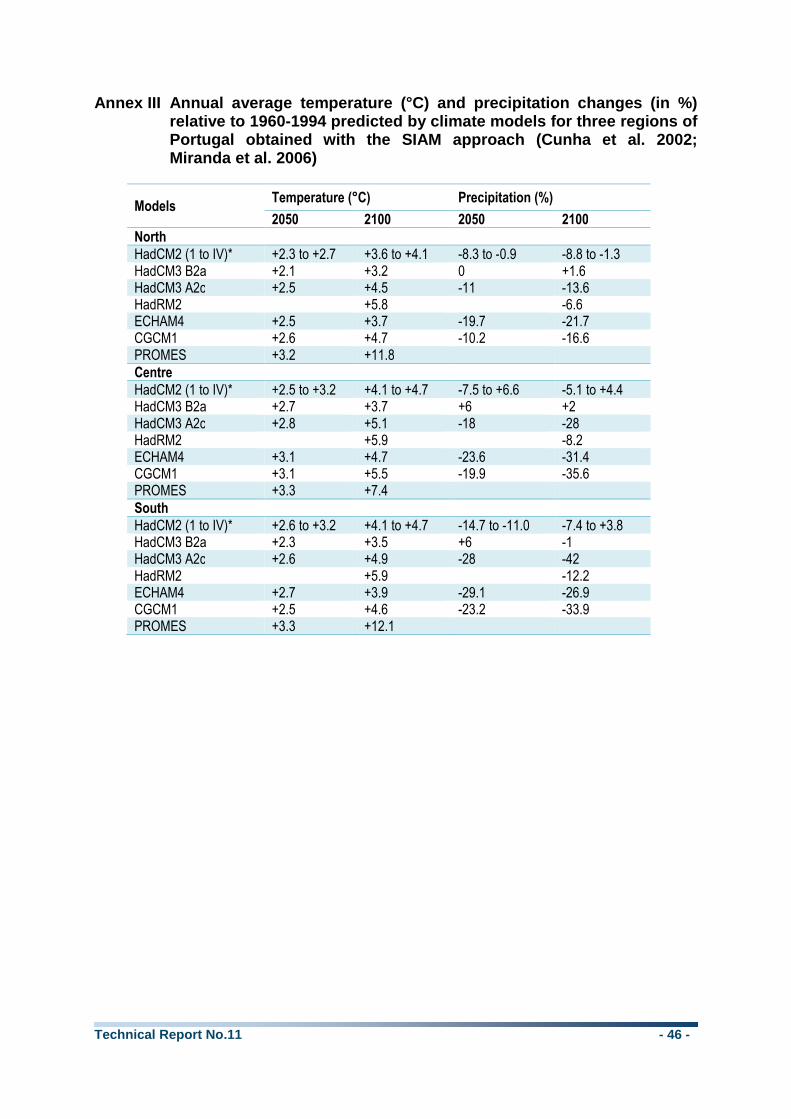
Technical Report No.11 - 46 -
Annex III Annual average temperature (°C) and preci pitation changes (in %) relative to 1960-1994 predicted by climate models f or three regions of Portugal obtained with the SIAM approach (Cunha et al. 2002; Miranda et al. 2006)
Models Temperature (°C) Precipitation (%)
2050 2100 2050 2100
North HadCM2 (1 to IV)* +2.3 to +2.7 +3.6 to +4.1 -8.3 to -0.9 -8.8 to -1.3 HadCM3 B2a +2.1 +3.2 0 +1.6 HadCM3 A2c +2.5 +4.5 -11 -13.6 HadRM2 +5.8 -6.6 ECHAM4 +2.5 +3.7 -19.7 -21.7 CGCM1 +2.6 +4.7 -10.2 -16.6 PROMES +3.2 +11.8 Centre HadCM2 (1 to IV)* +2.5 to +3.2 +4.1 to +4.7 -7.5 to +6.6 -5.1 to +4.4 HadCM3 B2a +2.7 +3.7 +6 +2 HadCM3 A2c +2.8 +5.1 -18 -28 HadRM2 +5.9 -8.2 ECHAM4 +3.1 +4.7 -23.6 -31.4 CGCM1 +3.1 +5.5 -19.9 -35.6 PROMES +3.3 +7.4 South HadCM2 (1 to IV)* +2.6 to +3.2 +4.1 to +4.7 -14.7 to -11.0 -7.4 to +3.8 HadCM3 B2a +2.3 +3.5 +6 -1 HadCM3 A2c +2.6 +4.9 -28 -42 HadRM2 +5.9 -12.2 ECHAM4 +2.7 +3.9 -29.1 -26.9 CGCM1 +2.5 +4.6 -23.2 -33.9 PROMES +3.3 +12.1
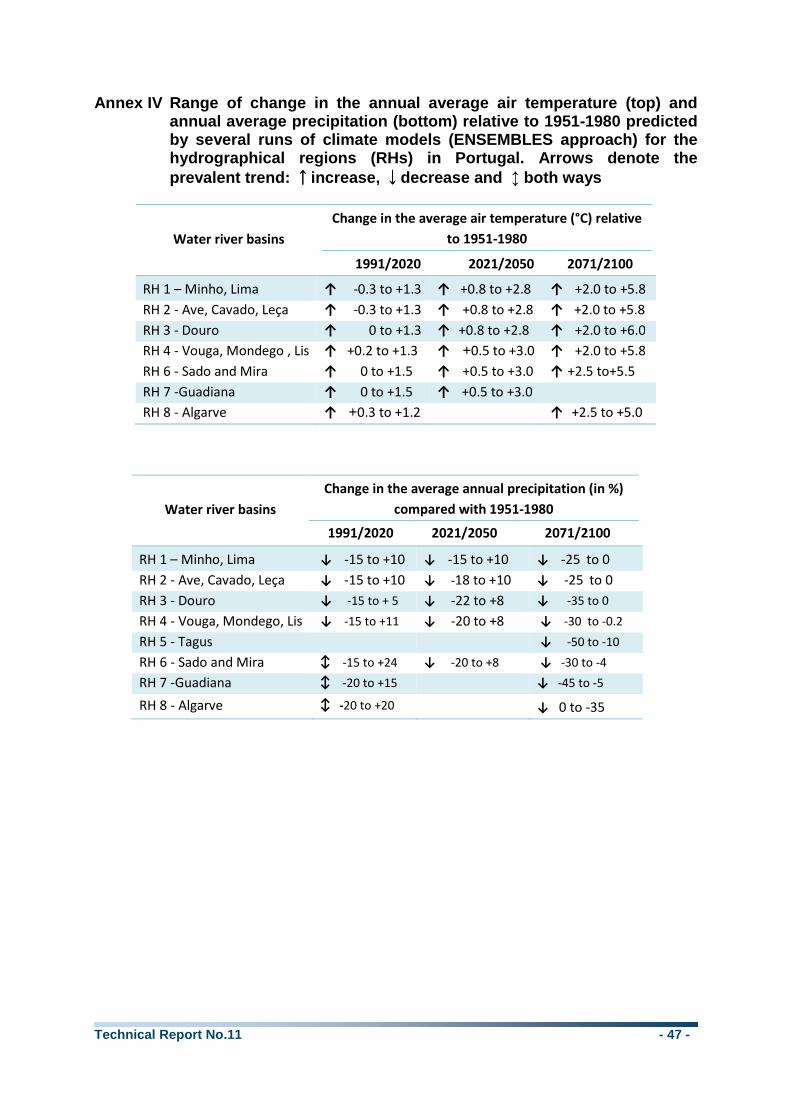
Technical Report No.11 - 47 -
Annex IV Range of change in the annual average air temperature (top) and annual average precipitation (bottom) relative to 1 951-1980 predicted by several runs of climate models (ENSEMBLES approa ch) for the hydrographical regions (RHs) in Portugal. Arrows de note the prevalent trend: ↑↑↑↑increase, ↓↓↓↓decrease and ↕ both ways
Water river basins
Change in the average air temperature (°C) relative
to 1951-1980
1991/2020 2021/2050 2071/2100
RH 1 – Minho, Lima ↑ -0.3 to +1.3 ↑ +0.8 to +2.8 ↑ +2.0 to +5.8
RH 2 - Ave, Cavado, Leça ↑ -0.3 to +1.3 ↑ +0.8 to +2.8 ↑ +2.0 to +5.8
RH 3 - Douro ↑ 0 to +1.3 ↑ +0.8 to +2.8 ↑ +2.0 to +6.0
RH 4 - Vouga, Mondego , Lis ↑ +0.2 to +1.3 ↑ +0.5 to +3.0 ↑ +2.0 to +5.8
RH 6 - Sado and Mira ↑ 0 to +1.5 ↑ +0.5 to +3.0 ↑ +2.5 to+5.5
RH 7 -Guadiana ↑ 0 to +1.5 ↑ +0.5 to +3.0
RH 8 - Algarve ↑ +0.3 to +1.2 ↑ +2.5 to +5.0
Water river basins
Change in the average annual precipitation (in %)
compared with 1951-1980
1991/2020 2021/2050 2071/2100
RH 1 – Minho, Lima ↓ -15 to +10 ↓ -15 to +10 ↓ -25 to 0
RH 2 - Ave, Cavado, Leça ↓ -15 to +10 ↓ -18 to +10 ↓ -25 to 0
RH 3 - Douro ↓ -15 to + 5 ↓ -22 to +8 ↓ -35 to 0
RH 4 - Vouga, Mondego, Lis ↓ -15 to +11 ↓ -20 to +8 ↓ -30 to -0.2
RH 5 - Tagus ↓ -50 to -10
RH 6 - Sado and Mira ↕ -15 to +24 ↓ -20 to +8 ↓ -30 to -4
RH 7 -Guadiana ↕ -20 to +15 ↓ -45 to -5
RH 8 - Algarve ↕ -20 to +20 ↓ 0 to -35