likely voters in pre polls: comparing methods find the ...€¦ · pre‐election polls: comparing...
TRANSCRIPT
Identifying Likely Voters in Pre‐election Polls: Comparing Methods to Find the Best One
David Vannette, Jon Krosnick, Matt DeBell, and Catherine Wilson
Stanford University

Outline
• Pre‐election polls• Likely voters• ANES• Gallup’s method• Turnout accuracy• Vote share accuracy• Probability‐based methods• Conclusions

Pre‐election polls
• Measure candidate preferences• Are viewed as predicting the outcome of the election
• Are becoming more common

The problem
• Pollsters believe too many people claim they are going to vote– Percentage intending to vote usually exceeds turnout rates on Election Day
• One solution:– Likely voters: a subset of the population identified as most likely to vote
The assumption
• Election predictions are more accurate when using likely voters

Another problem
• RDD telephone polls do not typically re‐interview respondents after the election
• No way to assess the effectiveness of likely voter models at identifying actual voters

American National Election Studies
• ANES 2008 Time Series Survey data– Nationally representative face‐to‐face survey
• 2,322 American adults interviewed pre‐election• 2,102 of the same respondents re‐interviewed post‐election
– Many questions measuring voting behavior• Intention to vote asked pre‐election• Candidate choice asked pre‐election• Turnout asked post‐election• Candidate choice asked post‐election

American National Election Studies
• 2008 Time Series Study:– Most interviews conducted in September– Many respondents may be undecided
• Other final pre‐election polls:– Based on interviews conducted in early November– Fewer undecided respondents
• Comparisons may be unfair

Research Questions
• How effective are different “likely voter” methods at identifying actual voters?
• Does using a subgroup of likely voters improve the vote share accuracy?
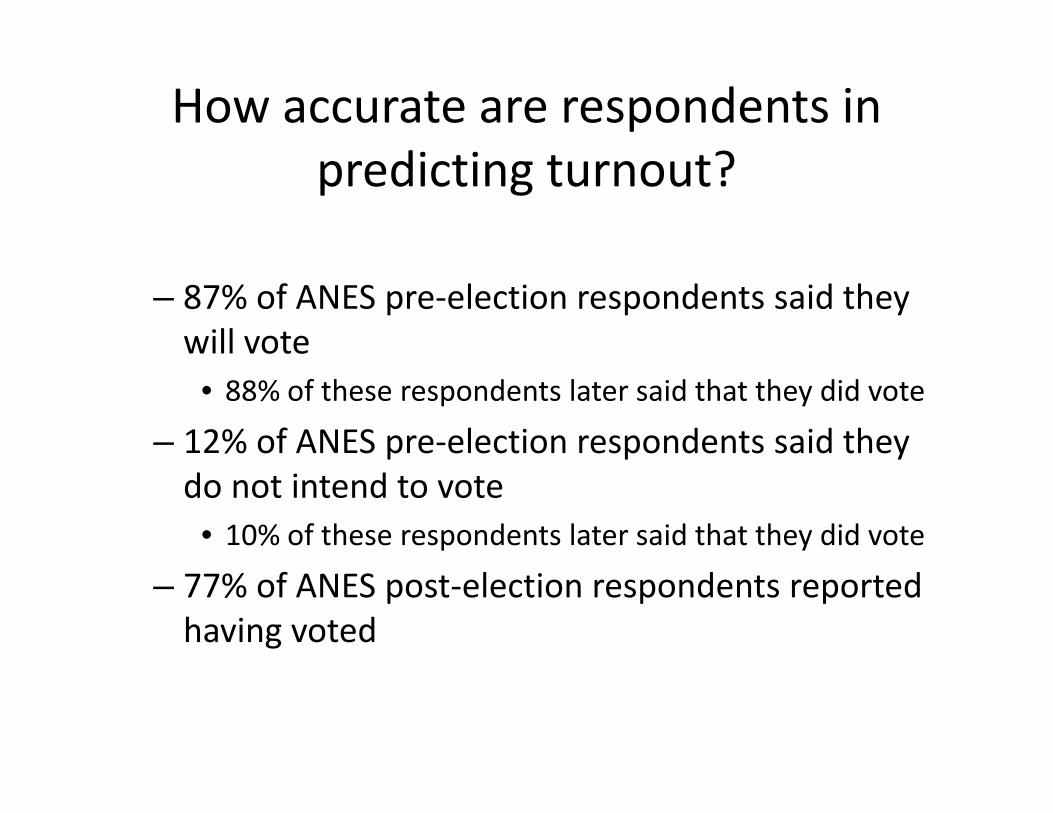
How accurate are respondents in predicting turnout?
– 87% of ANES pre‐election respondents said they will vote
• 88% of these respondents later said that they did vote
– 12% of ANES pre‐election respondents said they do not intend to vote
• 10% of these respondents later said that they did vote
– 77% of ANES post‐election respondents reported having voted
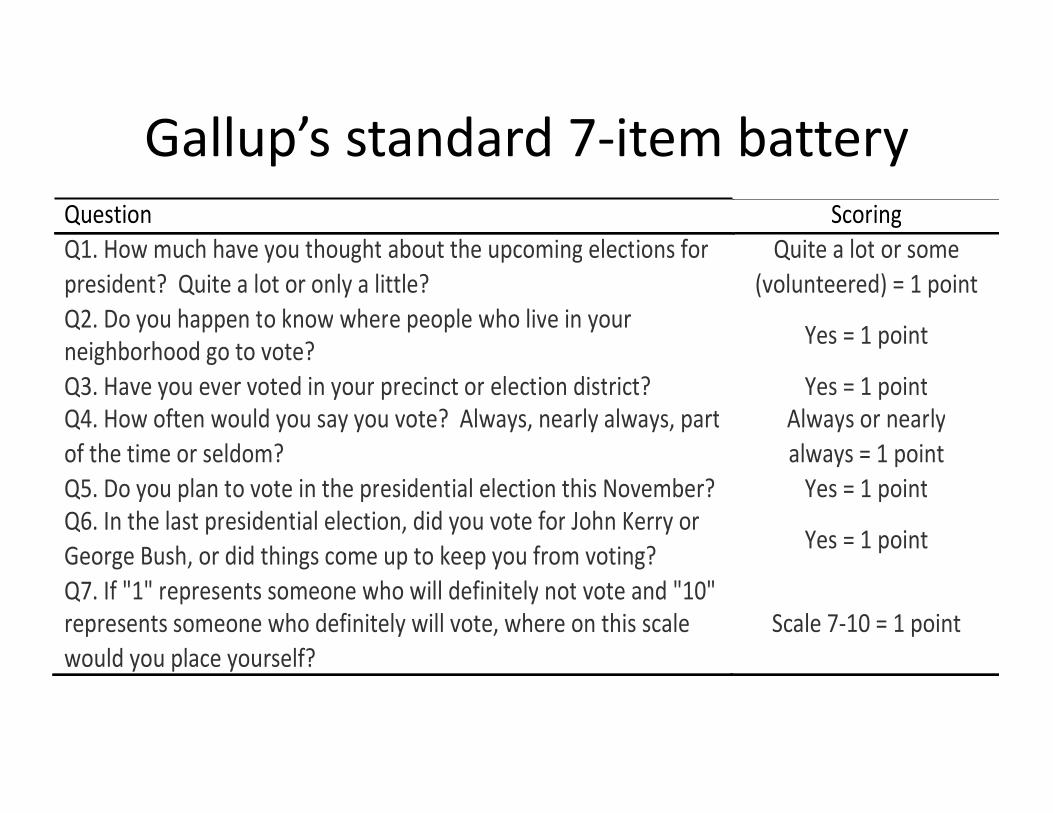
Gallup’s standard 7‐item batteryQuestion� Scoring�Q1.�How�much�have�you�thought�about�the�upcoming�elections�for�president?��Quite�a�lot�or�only�a�little?�
Quite�a�lot�or�some�(volunteered)�=�1�point�
Q2.�Do�you�happen�to�know�where�people�who�live�in�your�neighborhood�go�to�vote?� Yes�=�1�point�
Q3.�Have�you�ever�voted�in�your�precinct�or�election�district?� Yes�=�1�point�Q4.�How�often�would�you�say�you�vote?��Always,�nearly�always,�part�of�the�time�or�seldom?�
Always�or�nearly�always�=�1�point�
Q5.�Do�you�plan�to�vote�in�the�presidential�election�this�November?� Yes�=�1�point�Q6.�In�the�last�presidential�election,�did�you�vote�for�John�Kerry�or�George�Bush,�or�did�things�come�up�to�keep�you�from�voting?� Yes�=�1�point�
Q7.�If�"1"�represents�someone�who�will�definitely�not�vote�and�"10"�represents�someone�who�definitely�will�vote,�where�on�this�scale�would�you�place�yourself?�
Scale�7‐10�=�1�point�
�
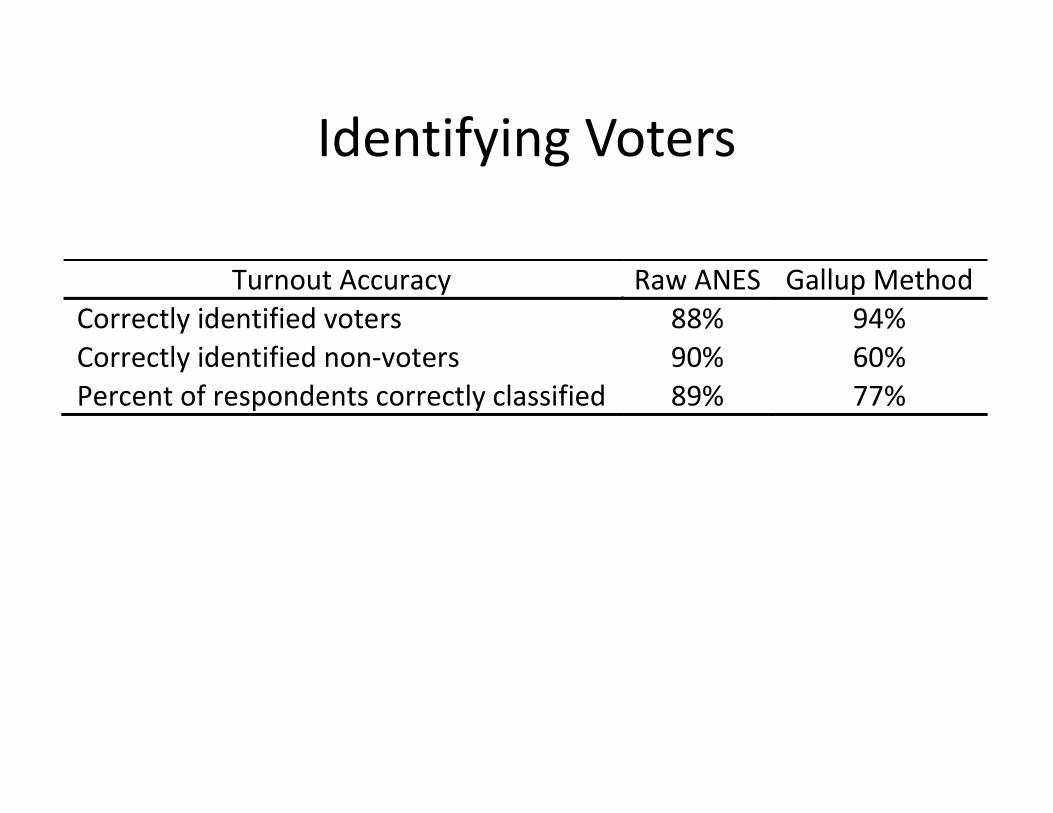
Identifying Voters
Turnout�Accuracy� Raw�ANES�Correctly�identified�voters� 88%�Correctly�identified�non‐voters� 90%�Percent�of�respondents�correctly�classified�� 89%�
Gallup�Method�94%�60%�77%�
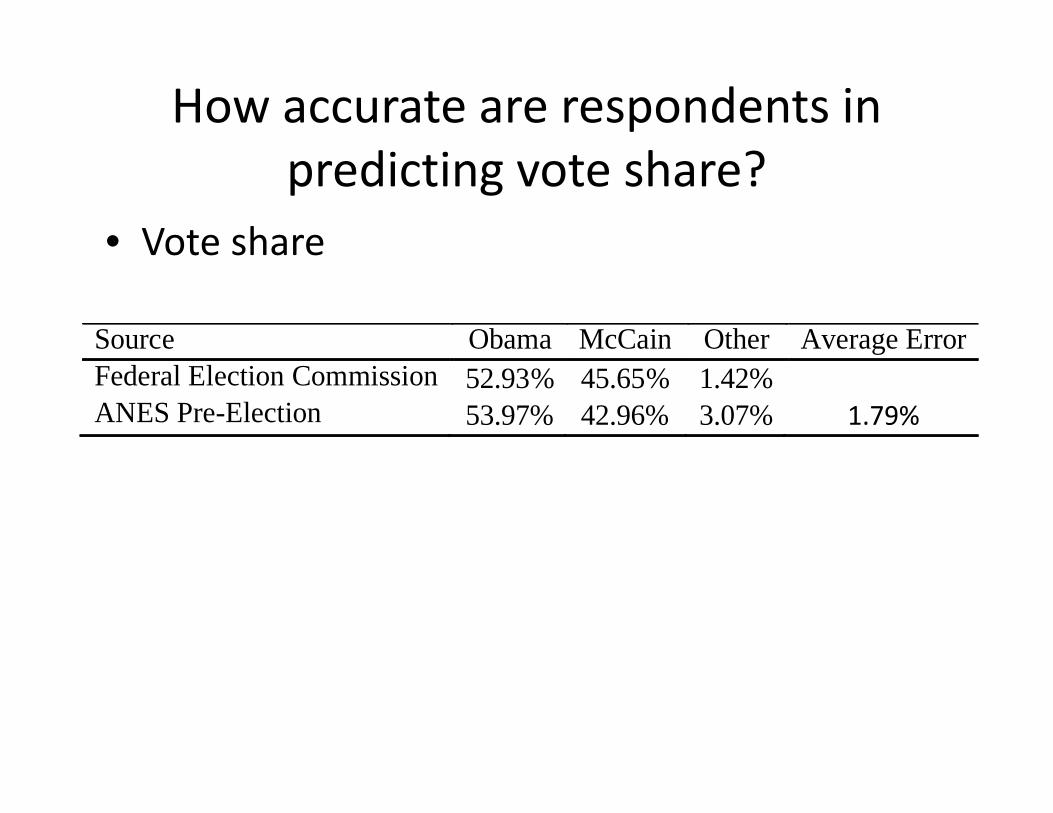
How accurate are respondents in predicting vote share?
Source Obama McCain Other Average ErrorFederal Election Commission 52.93% 45.65% 1.42% ANES Pre-Election 53.97% 42.96% 3.07% 1.79%�
• Vote share
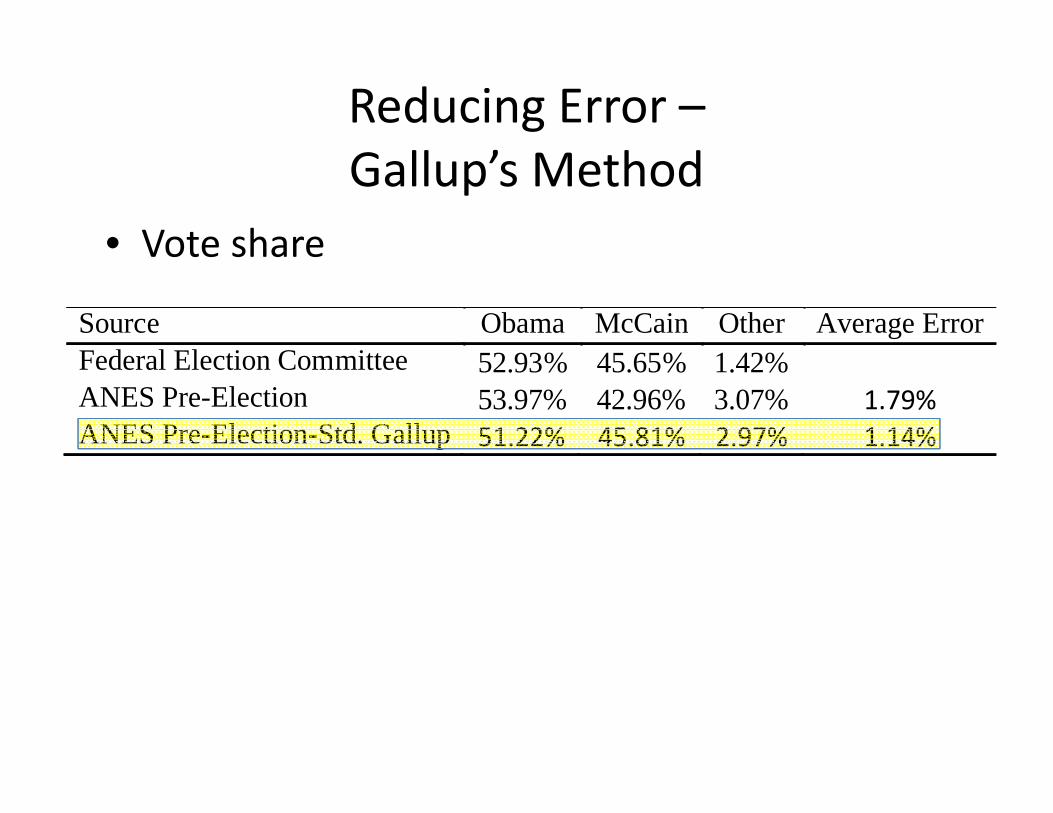
Reducing Error –Gallup’s Method
Source Obama McCain Other Average Error Federal Election Committee 52.93% 45.65% 1.42% �ANES Pre-Election 53.97% 42.96% 3.07% 1.79%�ANES Pre-Election-Std. Gallup 51.22% 45.81% 2.97% 1.14%�
• Vote share

Logistic Regression of Gallup’s MethodPredictors� Coef.�How�much�thought�have�you�given�to�the�election?�
0.44**��
Do�you�know�where�to�vote?� 0.87**��
Have�you�voted�in�your�precinct?� 0.18��
How�often�do�you�vote�in�national�elections?�
0.37��
How�likely�are�you�to�vote?� 0.96**��
Do�you�intend�to�vote?� 2.29**��
Did�you�vote�in�the�2004�presidential�election?�
1.23**��
� �**p < .01
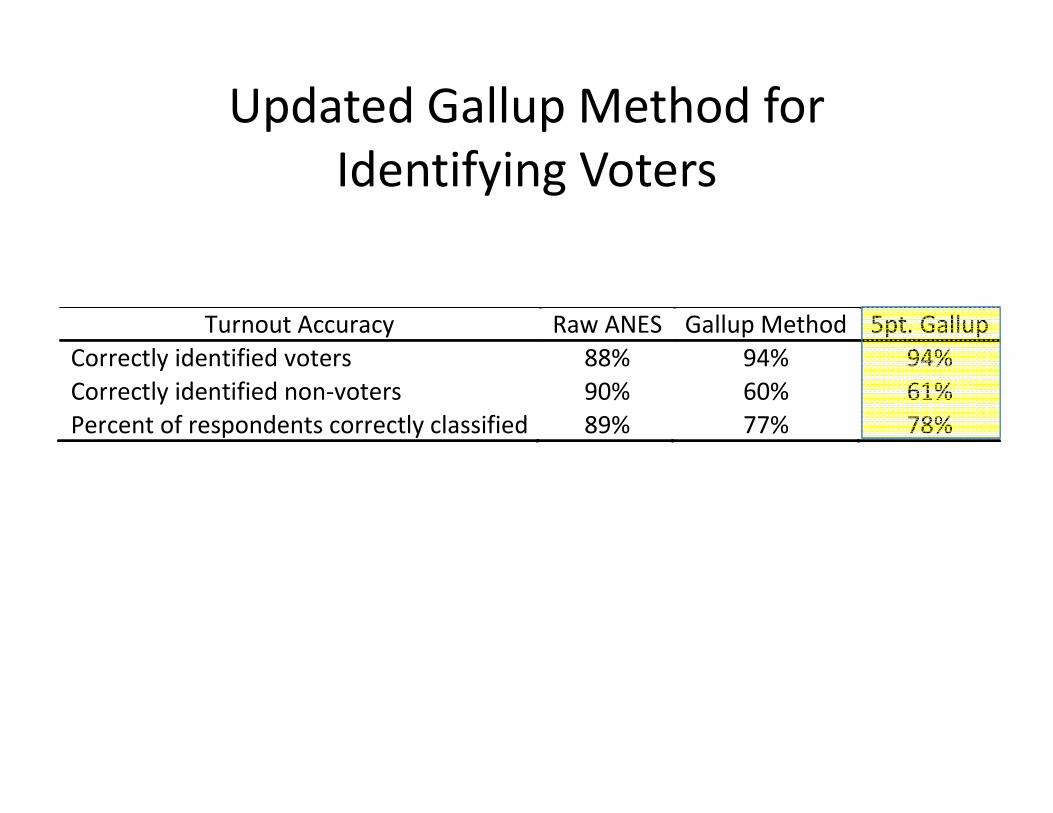
Updated Gallup Method for Identifying Voters
Turnout�Accuracy� Raw�ANES� Gallup�Method� 5pt.�Gallup�Correctly�identified�voters� 88%� 94%� 94%�Correctly�identified�non‐voters� 90%� 60%� 61%�Percent�of�respondents�correctly�classified�� 89%� 77%� 78%�

Updated Gallup Method for Vote Share Accuracy
Source Obama McCain Other Average ErrorFederal Election Commission 52.93% 45.65% 1.42% �ANES Pre-Election 53.97% 42.96% 3.07% 1.79%�ANES Pre-Election - Std. Gallup 51.22% 45.81% 2.97% 1.14%�ANES Pre-Election - 5pt Gallup 51.45% 45.21% 3.34% 1.28%�
Additional Measures
• Rosenstone & Hansen, 1993• Holbrook et al, 2001• Krosnick, Visser, & Harder, 2010
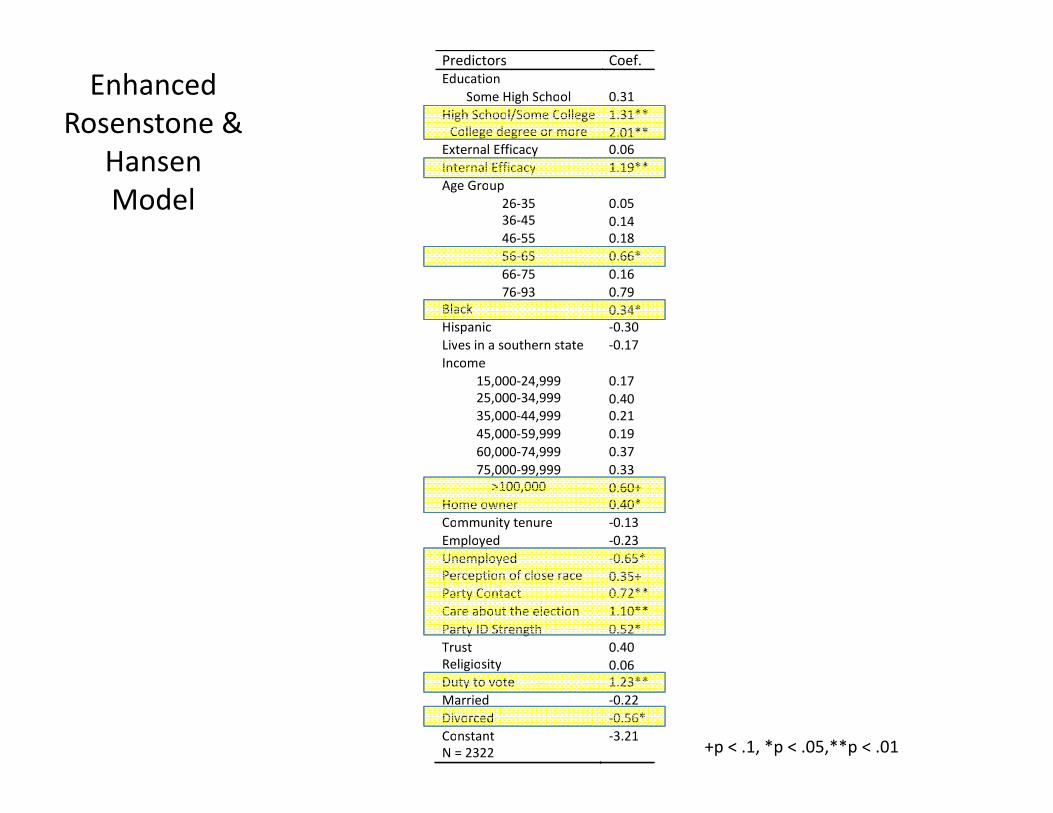
Enhanced Rosenstone &
Hansen Model
Predictors� Coef.�Education� �
Some�High�School� 0.31�High�School/Some�College� 1.31**�College�degree�or�more� 2.01**�
External�Efficacy� 0.06�Internal�Efficacy� 1.19**�Age�Group� �
26‐35� 0.05�36‐45� 0.14�46‐55� 0.18�56‐65� 0.66*�66‐75� 0.16�76‐93� 0.79�
Black� 0.34*�Hispanic� ‐0.30�Lives�in�a�southern�state� ‐0.17�Income� �
15,000‐24,999� 0.17�25,000‐34,999� 0.40�35,000‐44,999� 0.21�45,000‐59,999� 0.19�60,000‐74,999� 0.37�75,000‐99,999� 0.33�
>100,000� 0.60+�Home�owner� 0.40*�Community�tenure� ‐0.13�Employed� ‐0.23�Unemployed� ‐0.65*�Perception�of�close�race� 0.35+�Party�Contact� 0.72**�Care�about�the�election� 1.10**�Party�ID�Strength� 0.52*�Trust� 0.40�Religiosity� 0.06�Duty�to�vote� 1.23**�Married� ‐0.22�Divorced� ‐0.56*�Constant� ‐3.21�N�=�2322� � +p < .1, *p < .05,**p < .01
Full model
• Gallup predictors• Expanded Rosenstone & Hansen predictors• Adding “voted in a primary”
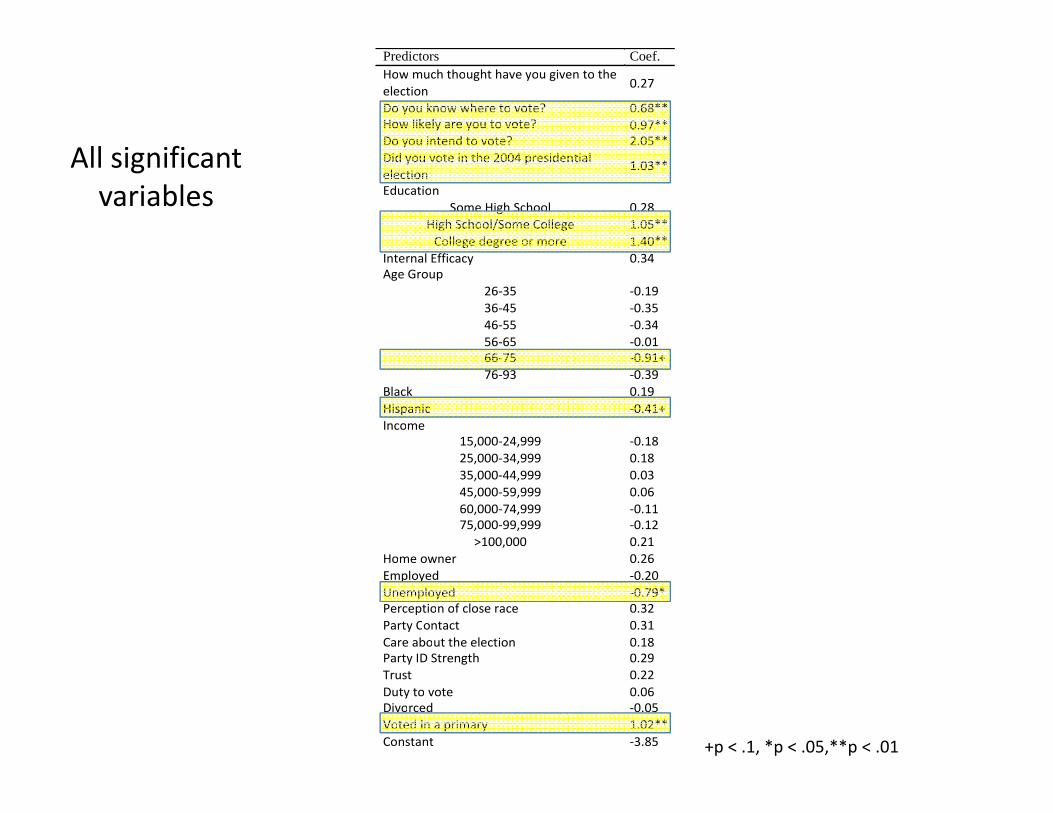
All significant variables
Predictors Coef.How�much�thought�have�you�given�to�the�election 0.27�
Do�you�know�where�to�vote? 0.68**�How�likely�are�you�to�vote? 0.97**�Do�you�intend�to�vote? 2.05**�Did�you�vote�in�the�2004�presidential�election
1.03**�
Education Some�High�School 0.28�
High�School/Some�College 1.05**�College�degree�or�more 1.40**�
Internal�Efficacy 0.34�Age�Group
26‐35 ‐0.19�36‐45 ‐0.35�46‐55 ‐0.34�56‐65 ‐0.01�66‐75 ‐0.91+�76‐93 ‐0.39�
Black 0.19�Hispanic ‐0.41+�Income
15,000‐24,999 ‐0.18�25,000‐34,999 0.18�35,000‐44,999 0.03�45,000‐59,999 0.06�60,000‐74,999 ‐0.11�75,000‐99,999 ‐0.12�
>100,000 0.21�Home�owner 0.26�Employed ‐0.20�Unemployed ‐0.79*�Perception�of�close�race 0.32�Party�Contact 0.31�Care�about�the�election 0.18�Party�ID�Strength 0.29�Trust 0.22�Duty�to�vote 0.06�Divorced ‐0.05�Voted�in�a�primary 1.02**�Constant ‐3.85�
+p < .1, *p < .05,**p < .01

Predicted probabilities
• Generated using the full regression model • Creates a probability of voting for each respondent based on their responses to all of these items
• Can test different cut‐points to find the most accurate predictions

Predicted probabilities• Matching FEC turnout %
Source� Obama� McCain� Other� Average�Error�Federal�Election�Commission� 52.93%� 45.65%� 1.42%� �ANES�Pre‐Election�� 53.97%� 42.96%� 3.07%� 1.79%�ANES�Pre‐Election�‐�Std.�Gallup� 51.22%� 45.81%� 2.97%� 1.14%�ANES�Pre‐Election�‐�5pt�Gallup� 51.45%� 45.21%� 3.34%� 1.28%�ANES�Probability�‐�FEC�turnout� 53.52%� 43.30%� 3.18%� 1.57%�
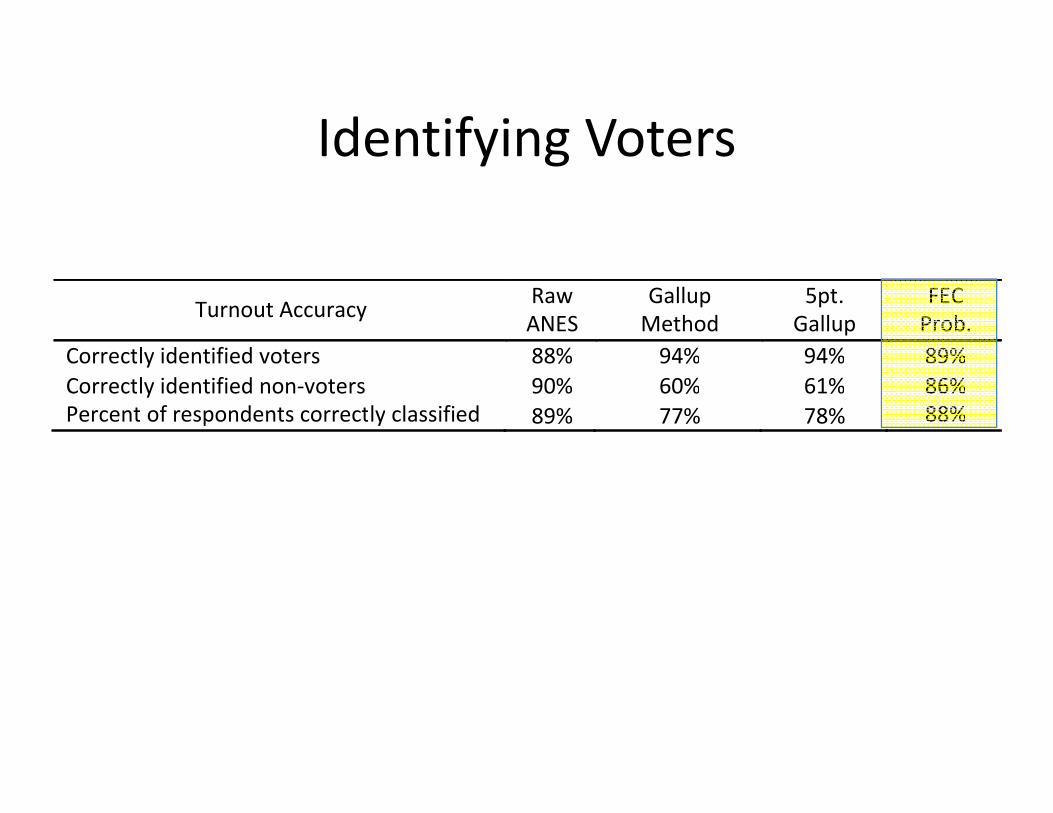
Identifying Voters
Turnout�Accuracy� Raw�ANES�
Gallup�Method�
5pt.�Gallup�
FEC�Prob.�
Correctly�identified�voters� 88%� 94%� 94%� 89%�Correctly�identified�non‐voters� 90%� 60%� 61%� 86%�Percent�of�respondents�correctly�classified�� 89%� 77%� 78%� 88%�
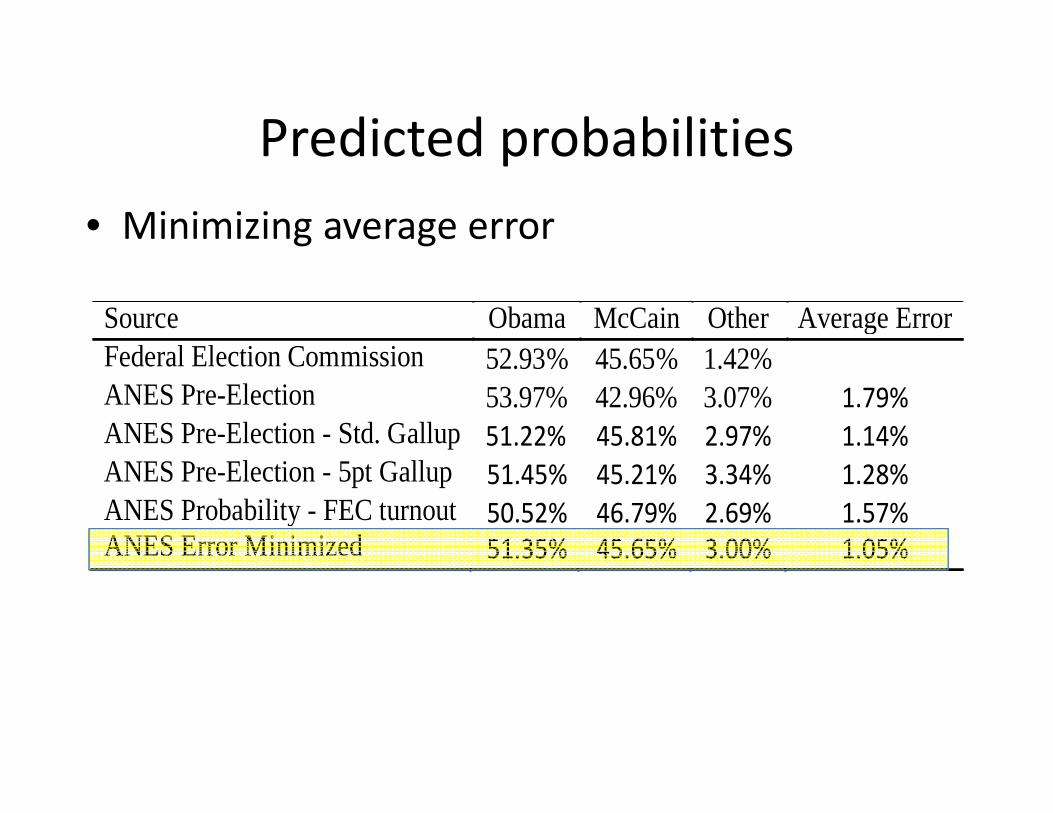
Predicted probabilities• Minimizing average error
Source Obama McCain Other Average ErrorFederal Election Commission 52.93% 45.65% 1.42% �ANES Pre-Election 53.97% 42.96% 3.07% 1.79%�ANES Pre-Election - Std. Gallup 51.22% 45.81% 2.97% 1.14%�ANES Pre-Election - 5pt Gallup 51.45% 45.21% 3.34% 1.28%�ANES Probability - FEC turnout 50.52% 46.79% 2.69% 1.57%�ANES Error Minimized 51.35% 45.65% 3.00% 1.05%

Identifying Voters
Turnout�Accuracy� Raw�ANES�
Gallup�Method�
5pt.�Gallup�
FEC�Prob.�
Error�Min.�
Correctly�identified�voters� 88%� 94%� 94%� 89%� 93%�Correctly�identified�non‐voters� 90%� 60%� 61%� 86%� 71%�Percent�of�respondents�correctly�classified�� 89%� 77%� 78%� 88%� 82%�
Using Gallup’s Own Data
• Final 2008 Gallup pre‐election poll– Oct 31‐Nov 2– 3050 respondents (RDD & cell)– 1950 likely voters

Comparison with Gallup
Source Obama McCain Other Average ErrorFederal Election Commission 52.93% 45.65% 1.42% �ANES Pre-Election 53.97% 42.96% 3.07% 1.79%�ANES Pre-Election - Std. Gallup 51.22% 45.81% 2.97% 1.14%�ANES Pre-Election - 5pt Gallup 51.45% 45.21% 3.34% 1.28%�ANES Probability - FEC turnout 50.52% 46.79% 2.69% 1.61%�ANES Probability - ANES turnout 51.09% 45.96% 2.95% 1.86%�ANES Error Minimized 51.35% 45.65% 3.00% 1.05% Gallup Final Pre-election Poll 55%� 44%� 1%� 1.38%�

Conclusions
• Vote share accuracy– Using likely voter models can improve prediction accuracy
– Gallup‐like models are good but may or may not be the best
– Assigning predicted probabilities minimizes error– ANES vs. Gallup
Conclusions
• Turnout accuracy– ANES vote intent– Gallup method– Probabilistic approaches

Acknowledgements
• Jon Krosnick• Matt DeBell• Catherine Wilson