lima’s metro. - investorrelations.granaymontero.com.pe · mega project “parques del agustino
TRANSCRIPT

2
13.0
12.0
11.0
10.0
9.0
8.0
7.0
6.0
5.0
4.0
3.0
2.0
1.0
0.0
1997 1998 1999 2000 2001 2002 2003 2004 2005 2006 2007 2008 2009 2010 2011 2012
Founding of Gramonvel
Gramonvel and Morris & Montero merge to become Graña y Montero
Transition to a new generation lead by Jose Graña (current Chairman of the Board)
Diversification plan starts after 50 years with the incorporation of GMD, GMI, GMP
Construction of the Four Seasons Hotel in Mexico City
G&M is awarded its first public concession. Incorporation of Concar
G&M goes public on the Lima Stock Exchange
G&M successfully issues a Securitized Bond in the Peruvian Capital Market. Incorporation of Norvial
G&M is awarded the North IIRSA and South IIRSA concessions in a JV with Odebrecht and Andrade Gutierrez
The company sells Larco Mar. Later that year, G&M acquires CAM in Chile. GMV and Urbi win the bid to develop the Cuartel de San Martin Project. G&M is awarded the concession contract of La Chira
GyM, in partnership with Odebrecht is awarded the construction of the first tranche of Lima’s Metro. G&M is awarded the concession for the operation of the Metro’s Line 1
11.40
1933 1949 1972 1983 1990 1994 1997 2003 2006 2008 2010 2011 2012
GyM acquires 74% of Vial y Vives, a Chilean engineering and construction company
Incorporation of Survial
Viva GyM starts the construction of low income housing mega project “Parques del Agustino”
Note: Historical Stock Exchange data as of March 29th, 2013
2007

3
93.7%
89.4%
50.1%
99.9%
99.9%
75.0%
50.0%
95.0%
99.6%
88.7%
100.0%
65.1%
74.0%
50.4%
98.1% *

4
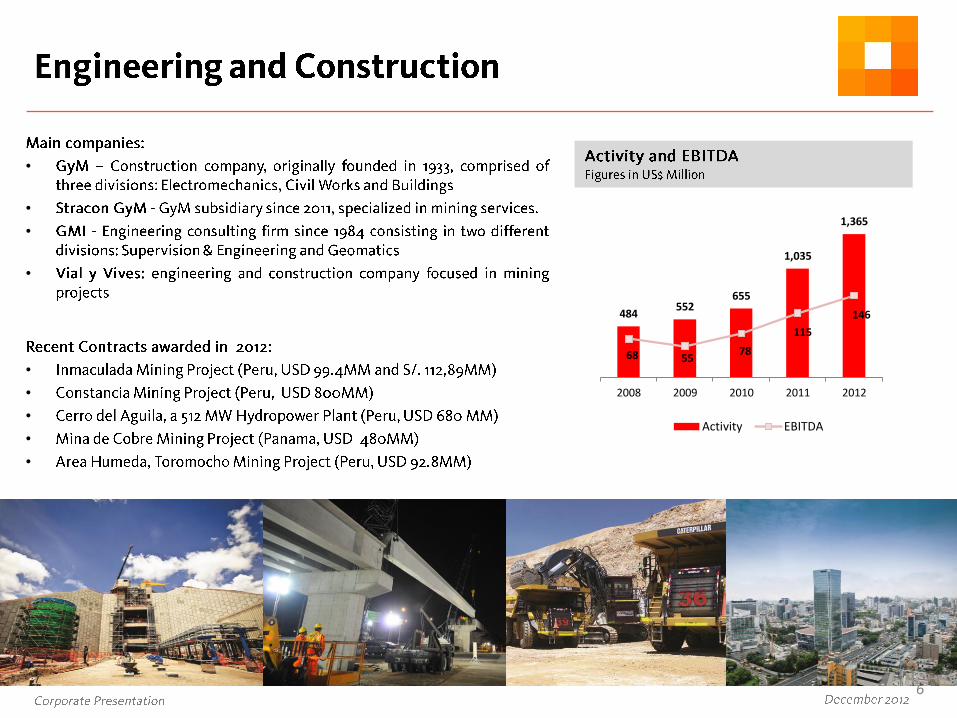
Engineering & Construction
US$1,364.9 MM 65%
Services US$424.7 MM
20%
Infrastructure US$205.6 MM
10%
Real Estate US$94.1 MM
5%
Engineering & Construction
US$147.9 MM 49%
Services US$43.7 MM
15%
Infrastructure US$81.3 MM
27%
Real Estate US$27.6 MM
9% Engineering & Construction US$64.0 MM
56%
Services US$19.8 MM
17%
Infrastructure US$26.0 MM
23%
Real Estate US$4.9MM
4%

6
•
•
•
•
•
•
•
•
•
484 552
655
1,035
1,365
68 55 78
115
146
0
50
100
150
200
250
300
0
200
400
600
800
1,000
1,200
1,400
1,600
2008 2009 2010 2011 2012
Mill
are
s
395484
552655
1,035
1,615
5468
55
78
115124
0
50
100
150
200
250
300
050
100150200250300350400450500550600650700750800850900950
1,0001,0501,100
2007 2008 2009 2010 2011 2012
Mill
are
s
Activity EBITDA

7
•
•
•
•
•
•
•
•
•
75 90
122
150
206
33 42
67 66
84
0
50
100
150
200
250
300
0
50
100
150
200
250
2008 2009 2010 2011 2012
Mill
are
s
06
26
42 43
76
0-2
15
2314
20
2007 2008 2009 2010 2011 2012
Activity EBITDA

8
61
90
54
94
5
10 14
28
0
10
20
30
40
50
60
0
10
20
30
40
50
60
70
80
90
100
2009 2010 2011 2012
Mill
are
s
•
•
•
•
•
•
•
•
1,190 2,177 1,244 1,368
Units delivered
61
90
54
79
5
1014
27
0
10
20
30
40
50
60
0
10
20
30
40
50
60
70
80
90
100
2009 2010 2011 2012 LTM
Mill
are
s
Activity EBITDA

9
•
•
•
109125 131
182
469
525
3546 40
64
97 93
0
50
100
150
200
250
300
350
400
0
100
200
300
400
500
600
2007 2008 2009 2010 2011 2012 LTM
Mill
are
s
Activity EBITDA
56 67
101
362
425
11 14 20
45 44
0
50
100
150
200
250
300
350
400
0
50
100
150
200
250
300
350
400
450
2008 2009 2010 2011 2012
Mill
are
s


11
47 46
90
107 114
0
20
40
60
80
100
120
2008 2009 2010 2011 2012
601 755
947
1,573
2,035
0
500
1,000
1,500
2,000
2,500
2008 2009 2010 2011 2012
119 117
191
246
303
0
50
100
150
200
250
300
350
2008 2009 2010 2011 2012
CAGR(2008-2012) : 35.7% CAGR(2008-2012) : 24.8%
CAGR(2008-2012) : 26.4%
7.8%
6.2%
9.5%
6.8%5.6%
21.2%
15.1%16.7%
14.9%
13.7%
19.7%
15.5%
20.2%
15.6%
14.9%
0%
5%
10%
15%
20%
25%
2008 2009 2010 2011 2012
Net Mg Gross Mg EBITDA Mg

12
Activity 1,364,904 205,590 94,124 424,666 2,034,171
GROSS PROFIT 159,946 52,074 33,989 40,743 279,132
Operating and administrative expenses (62,660) (12,022) (6,824) (41,303) (100,815)
Other Income (Expenses) (756) (961) (671) 28,846 29,142
OPERATING PROFIT 96,530 39,092 26,494 28,286 207,459
Financial Income (Expenses) 657 (7,938) (1,419) (3,347) (12,152)
Other 11,170 1,083 516 1,362 8,859
PRETAX PROFIT 108,357 47,835 25,591 26,300 204,166
Income Tax (34,464) (15,041) (7,827) (2,210) (60,594)
Minority interest (9,445) (6,764) (12,912) (4,246) (29,909)
NET PROFIT 64,448 26,030 4,851 19,844 113,663
EBITDA 147,934 81,297 27,639 43,749 303,304
Financial Keys
Gross Margin 11.7% 25.3% 36.1% 9.6% 13.7%
Net Margin 4.7% 12.7% 5.2% 4.7% 5.6%
EBITDA Margin 10.8% 39.5% 29.4% 10.3% 14.9%
Financial Debt 118,659 72,521 33,716 42,510 331,429
Financial Debt / Equity 0.21 0.22 0.23 0.87 0.48
Financial Debt /EBITDA 0.80 0.89 1.22 0.97 1.09
ROE 12.9% 9.8% 11.9% 49.3% 20.6%
Services CONSOLIDATED Statement of Income
(Thousands of US$)
Engineering &
Construction Infrastructure Real Estate

13
Statement of Income
(Thousands of US$) 2008 2009 2010 2011 2012
Activity 600,803 755,183 947,098 1,573,156 2,034,171
Gross Profit 127,145 113,992 158,358 234,241 279,132
Operating Profit 93,869 77,488 142,209 180,090 207,459
Pretax Profit 74,073 78,624 142,765 177,102 204,166
Minority Interests (2,099) (5,345) (8,434) (17,472) (29,909)
Net Profit 46,846 46,490 89,997 107,184 113,663
Depreciation & Amortization 24,749 39,910 48,678 65,183 95,845
EBITDA 118,617 117,398 190,960 245,274 303,304
Balance Sheet
(Thousands of US$) 2008 2009 2010 2011 2012
Total Assets 490,486 741,777 927,668 1,369,568 1,957,125
Cash 45,712 137,229 242,259 244,044 305,807
Financial Debt 140,194 130,218 122,064 196,458 331,429
Total Equity 194,325 286,391 409,010 538,778 696,197
Financial Keys
Gross Margin 21.2% 15.1% 16.7% 14.9% 13.7%
Net Margin 7.8% 6.2% 9.5% 6.8% 5.6%
EBITDA Margin 19.7% 15.5% 20.2% 15.6% 14.9%
Financial Debt /EBITDA 1.18 1.11 0.64 0.80 1.10
Financial Debt /Equity 0.72 0.45 0.30 0.36 0.48
EBITDA / Financial Expenses 11.53 8.09 29.60 65.12 23.39
ROE 25.2% 17.7% 24.1% 23.1% 20.6%

14
36% 13% 22% 11% 19% Areas
Engineering & Construction Services Infrastructure Real Estate GMH
54% 46% Term
Short Long
12% 88% Currency
National Foreign
40% 40% 20% Type of Debt
Working Capital Leasings Medium and Long Term Credits
140.1 130.2 122.1
196.5
331.4
1.18x 1.11x
0.64x
0.80x
1.10x
0.00
0.20
0.40
0.60
0.80
1.00
1.20
1.40
0
50,000
100,000
150,000
200,000
250,000
300,000
350,000
2008 2009 2010 2011 2012
Financial Debt Financial Debt / EBITDA

15
100.3
56.0
124.9
183.1
352.3
2008 2009 2010 2011 2012
Engineering & Construction
46%
Services 5%
Infrastructure 34%
Real Estate 14%
Others 1%
2008 2009 2010 2011 2012 TOTAL %
Engineering & Construction 13,248 17,640 22,879 68,127 163,503 285,398 34.9%
Services 51,047 8,777 47,151 40,334 15,593 162,902 19.9%
Infrastructure 12,453 13,720 4,941 44,745 118,335 194,194 23.8%
Real Estate 18,811 15,547 44,184 27,281 50,298 156,121 19.1%
Others 4,766 327 5,758 2,563 4,564 17,978 2.2%
100,325 56,011 124,913 183,050 352,293 816,593 100.0%

16
Engineering & Construction
62%
Infrastructure 18%
Real Estate 2%
Services 18%
Private 72%
Public 12%
Cofinanced Concessions
5%
Private Concesisons
11%
Mining 45%
Oil and Gas 9%
Power 18%
Water and Sewers 4%
Real Estate 3%
Transportation 19%
Others 2%
830 1,281
1,883
3,075
4,573
1.38
1.70
1.97 1.92
2.25
-
0.50
1.00
1.50
2.00
2.50
-
500
1,000
1,500
2,000
2,500
3,000
3,500
4,000
4,500
5,000
2008 2009 2010 2011 2012
Total Backlog Backlog/Activity
CAGR(2008-2012) : 53.2%

17
Initial Executed Total
Backlog Backlog Total IQ - 2012 IIQ - 2012 IIIQ - 2012 IVQ-2012 Backlog 2013 2014 2015+
GyM 1,812,325 1,293,149 2,372,989 369,214 178,524 249,181 1,576,070 2,892,165 1,198,280 921,259 772,627
GMI 27,312 71,755 77,669 16,034 14,650 29,189 17,796 33,226 33,226 0 0
ENGINEERING & CONSTRUCTION 1,839,637 1,364,904 2,450,658 385,248 193,174 278,370 1,593,866 2,925,391 1,231,506 921,259 772,627
NORVIAL 96,544 33,595 37,440 7,652 8,112 20,692 985 100,389 34,367 36,621 29,402
SURVIAL 39,305 12,073 47,198 28,818 5,996 -10,923 23,307 74,430 34,375 23,051 17,004
CANCHAQUE 7,522 2,684 3,865 865 642 1,875 484 8,702 3,357 2,672 2,672
LA CHIRA 13,656 16,075 150,614 -203 5,944 3,583 141,289 148,194 65,788 79,777 2,629
LINEA 1 METRO DE LIMA 135,398 28,642 88,960 2,637 23,856 21,705 40,763 195,715 53,346 68,334 74,035
GMP 259,914 112,521 155,967 78,845 17,967 25,549 33,607 303,361 113,068 102,526 87,766
INFRASTRUCTURE 552,338 205,590 484,044 118,613 62,516 62,479 240,435 830,792 304,302 312,980 213,510
VIVA GYM 289,856 94,124 -87,306 38,402 20,805 -27,676 -118,838 108,426 88,440 19,665 321
REAL ESTATE 289,856 94,124 -87,306 38,402 20,805 -27,676 -118,838 108,426 88,440 19,665 321
GMD 87,707 81,545 78,668 13,242 13,176 26,344 25,906 84,830 47,509 37,320
CONCAR 172,112 95,502 275,407 12,326 146,983 104,044 12,054 352,017 204,134 73,127 74,756
CAM 256,258 248,259 428,878 120,497 30,961 87,392 190,028 436,878 139,674 107,515 189,689
SERVICES 516,078 425,306 782,953 146,065 191,120 217,780 227,988 873,725 391,317 217,962 264,445
ELIMINATIONS -122,866 -55,113 -96,959 -48,363 -9,473 -11,692 -27,431 -164,713 -78,299 -53,270 -33,144
TOTAL 3,075,042 2,034,810 3,533,389 639,966 458,142 519,261 1,916,020 4,573,621 1,937,266 1,418,596 1,217,758
2.25Backlog / Activity (12 months)
Company/PeriodNew Requests Annual Backlog

18
3,814 4,260
5,746
9,641
11,399
2008 2009 2010 2011 2012
Collaborators December 2012
Engineers 3,657
Others 1,918
Technicians 5,824
Total Employees 11,399
Workers 11,855
Consortiums 4,973
Total Collaborators 28,227
Subcontractor 4,452
Total Work Force 32,679

19
Graña y Montero is member of the “Companies Circle of LATAM Corporate
Governance Roundtable” since 2008

20
-
2
4
6
8
10
12
-
5
10
15
20
25
30
35
40
Mar-12 Apr-12 May-12 Jun-12 Jul-12 Aug-12 Sep-12 Oct-12 Nov-12 Dec-12 Jan-13 Feb-13 Mar-13
Trad
ed V
olu
me
( S/
. MM
)
Pri
ce (
S/.
)
Data as of March 29, 2013
Shares (million) 558.284
Market Cap (US$ MM) 2,457.79
52 week high 11.65
52 week low 7.50
Daily Avg. Traded Volume Last 3M (US$ MM) 2.415
Daily Avg. Traded Volume Last 6M (US$ MM) 1.967
Daily Avg. Traded Volume Last 12M (US$ MM) 0.909
Closing Price 11.40
Pension Funds 38.0%
Internal Shareholders
36.1%
Other 25.9%
