limnologica - core.ac.uk · tation species composition and abundance from the reference...
TRANSCRIPT

ELSEVIER Limnologica 34,283-301 (2004)
http://www.elsevier.de/limno LIMNOLOGICA
Ecological classification of macrophytes and phytobenthos for rivers in Germany according to the Water Framework Directive
Jochen Schaumburg 1.*, Christine Schranz 1, Julia Foerster 2, Antje Gutowski 3, Gabriele Hofmann 4, Petra Meilinger 1, Susanne Schneider s, Ursula Schmedtje 1
~ Bayerisches Landesamt f0rWasserwirtschaft, MOnchen, Germany 2 Universit~t Bremen FB 02 (Biologie/Chemie), Bremen, Germany 3 Bremen, Germany 4 GlashOtten-Schlol3born, Germany STechnische Universit~t MOnchen, Limnologische Station, Iffeldoff, Germany
Received: March 16, 2004 • Accepted:August 4, 2004
Abstract
A new assessment system for macrophytes and phytobenthos in German rivers meeting the requirements of the Water Framework Directive (WFD) of the European Community is de- scribed. Biocoenotic types based on biological, chemical and hydromorphological data from over 200 river sites covering the main ecoregions, hydromorphological stream types and degradation forms have been defined. For developing a classification system the quality ele- ment macrophytes and phytobenthos was divided into three components: macrophytes, ben- thic diatoms and remaining phytobenthos. For macrophytes seven types including one sub- type, for benthic diatoms 14 types including three subtypes and for the remaining phytoben- thos five fiver types were identified. The benthic vegetation at reference condition was de- scribed for most of the river types. Degradation is characterised as deviation in benthic vege- tation species composition and abundance from the reference biocoenosis. For classification in five ecological status classes, several metrics were developed and used in combination with existing indices. For some of the described river types additional investigations are nec- essary before a classification system can be developed.
Key words: Water Framework Directive - aquatic plants - macrophytes - phytobenthos - diatoms - ecological classification - assessment - reference conditions - species groups - rivers
Introduction
According to the Water Framework Directive (WFD; European Union 2000) the member states of the Euro- pean Union are obliged to assess and report on the eco- logical status of all rivers exceeding a catchment area
size of 10 km=. This status shall be determined by the bi- ological quality elements phytoplankton, macrophytes and phytobenthos, benthic invertebrate fauna and fish fauna. Physical and chemical properties of the water bodies are to be used along with the hydromorpbological situation of the rivers as supporting elements. For each
*Corresponding author: Jochen Schaumburg, Bayerisches Landesamt for Wasserwirtschaft, Lazarettstral3e 67, D-80636 MLinchen, Ger- many; Phone: 0049 89 9214 1468, Fax: 0049 89 9214 1131; e-mail: joch en.schaumburg@lfw, bayern.de
0075-9511/04/34/04-283 $ 30.00/0 Limnologica (2004) 34,283-301

284 J. Schaumburg et al.
of the biological quality elements, the taxonomic com- position and abundance of the taxa have to be deter- mined, and five classes of ecological status (high, good, moderate, poor, bad) have to be defined following nor- mative definitions in the Directive. The determination of the ecological status has to be done type-specifically, i.e. for each 'type' of running water, reference conditions have to be identified, and degradation described by quantifying the deviation in species composition and abundance from those that would be present at reference conditions. No method fulfilling these demands exists in Germany for macrophytes and phytobenthos. Therefore a four year project to develop a new classification sys- tem for implementing the Water Framework Directive for macrophytes and phytobenthos in German rivers was initiated. The aim of this paper is to give an overview of the concepts followed within the project, and present some important results. The complete results for all river types are published in the final report of the project (SCHAUMBURG et al. 2005). An English version of the mapping method including the classification system can be downloaded from the homepage of the Bavarian Water Management Agency (see SCHAUMBURG et al. 2004; http://www.bayern.de/lfw).
Material and Methods
Sampling design Existing knowledge about different sampling methods and approaches for a classification of macrophytes and phytobenthos to determine the ecological status of rivers and existing data on species distribution were compiled and evaluated in a literature study (SCHMEDTJE et al. 2001a). About 200 river sites all over Germany (Fig. 1) were chosen so that the main ecoregions in Germany (ILLIES 1978) and different river types (ScHMEDTJE et al. 2001b) were covered.
In order to develop a classification system, the quality element "macrophytes and phytobenthos" was divided into three components: (a) macrophytes (including vas- cular plants, submerged Bryophytes and Charophytes), (b) benthic diatoms and (c) remaining phytobenthos. This differentiation was necessary due to the different spatial and temporal occurrence and distribution of these components, i.e. the different indication of environmen- tal conditions as well as the different sampling routines. Macrophytes are rooted to the sediment and are long last- ing organisms whilst diatoms typically have short gener- ation times and respond quickly to changes in environ- mental conditions. The number of sites and collections for each component is shown in Table 1. In addition data from 76 sites of the Austrian alpine region were included into the data set as these sites have the same geomorpho- logical characteristics as German sites in that ecoregion.
At each sampling site, biological, hydrological and morphological data were recorded (SCHAUMBURG et al. 2005). Chemical and physical data of the sites were re- ceived from the official monitoring programs of the re- gional water authorities.
Mapping, sampling and material treatment Macrophytes were mapped once during the main vegeta- tion period (mid June to mid September). Surveys were taken out in ecologically homogenous sections of run- ning waters, i.e. sections without major changes in cur- rent velocity, shading, sediment composition or land utilisation of the adjacent area as well as without tribu- taries or other influxes. The length of the survey site was approximately 100 m. All plants rooting below the mid- dle water were recorded. An underwater viewing aid, and additionally - in deep or turbid waters - a rake with a long handle was used. In deep rivers, where wading was impossible, plants were investigated from the banks by raking an area of the streambed as far as possible from the bank. Plant abundance was estimated accord- ing to a five-point-scale established by KOHLER (1978): 1 = very rare; 2 = rare; 3 = common; 4 = frequent; 5 = abundant, predominant. Submerged and emergent growths of macrophytes were recorded separately. Abundance of plant taxa appearing submerged as well as emergent at the site were noted separately. Structural features of the survey site, such as current velocity, aver- age width and average water depth were recorded. Addi- tional information about general and physico-chemical features of the site, e.g. ecoregion, water hardness and influence of groundwater, were gathered.
A seasonal fluctuation in benthic diatom communi- ties with important changes of the species composition can be detected (e.g. EN6ELBERG 1987). These changes differ between river types. Therefore, in order to develop the classification samples were taken three times a year in spring, summer and autumn. This enabled the com- munities to be characterised and a decision about which season would be the best for sampling in the future to be made. Samples were taken according to the European Standard EN 13946 (CEN 2003) where type specific natural substrates allocated over the whole streambed in
Table 1. Numbers of rivers, sites, samples and taxa found; in brack- ets: together with Austrian sites.
Macrophytes Benthic diatoms Remaining phytobenthos
Rivers 183 (198) 173 (216) 98 (143) Sites 218 (239) 201 (295) 126 (196) Samples 576 (694) 245 (380) No. oftaxa found 206 573 239
Limnologica (2004) 34,283-301

Classification of macrophytes and phytobenthos in rivers 285
x Sampling sites
x x
# x
xX
x
xx x
x
,XX
X X
X
X x X
x x x
x ~ x
x ~,x x xx x
x x ~ ~ x Xx x %,~v x
X x ~ ,,2~ "
x
X x X x X
X X
X X
~x x k__
× ~ ..
X X X X j
X xlxXxx xX x l x x x
Fig. 1. Map of German investigation sites for benthic plants in rivers.
Limnologica (2004) 34,283-301

286 J. Schaumburg et al.
a constantly submerged area were chosen. Areas with high current velocity, the littoral zone and shady patches were avoided, except where they were characteristic for the type. Additional criteria such as substrate composi- tion, light conditions etc. were noted. In rivers with high to moderate current velocity hard substrates such as stones were chosen. At least five stones of a size that were not moved by mean hydrological conditions were selected from locations throughout the site. The diatom layers were abraded with a spoon or spatula from the top sides of the stones or the other chosen substrates. In slow flowing rivers the procedure deviated from EN 13946 and the diatom sample was taken from soft substrates such as sand, gravel and organic matter by lifting it care- fully with a spoon. The suspension was stored in a con- tainer. The material was fixed with formaldehyde with a final concentration of 1% to 4%. The material was cleaned by boiling in hydrochloric acid, followed by ox- idation using concentrated sulphuric acid and potassium nitrate. After washing, the cleaned frustules were mount- ed in Naphrax and identified under oil immersion at a magnification of 1000x. Nomenclature follows I~,AM- MEl~ & LANGE-B~RTALOT (1986, 1988, 1991a, 1991b).At least 500 frustules were counted and species abundance was calculated as percentage occurrences.
For mapping the remaining phytobenthos, a multiple habitat sampling was carried out on a section (rivers 50 m, streams 20 m) in order to get a representative sample. The sampling procedure was developed in con- cordance with the method proposed by ROTT et al. (1997) and BARBOUR et al. (1999). Macroscopically visi- ble stands of algae were mapped and sampled, and fur- ther samples for microscopic analysis were taken from different kind of substrates as well as from different situ- ations in regard to current velocity, degree of shading, and depth. On average, 4-6 subsamples per site were taken. Samples were preserved by Lugol's solution or by cryo-preservation. Benthic algae were determined to species level whenever possible. Algae of the orders Zygnematales, Vaucheriales and Oedogoniales were kept in the laboratory but only in few cases reproductive organs were developed. Hence, these taxa could be de- termined to genus level only. The abundance of species was estimated on a 5-score scale (see Table 2).
85 sites were sampled twice (winter 2000/01 and summer 2001) to account for possible seasonal variation in the species data.
Data treatment
For analysing the biocoenosis data (taxa and abundance) cluster analyses, correspondence analyses (CA) and canonical correspondence analyses (CCA) (TEa Bm~AK 1996) were used. Transformation for some of the abun- dance data was necessary as described by the following.
Table 2. Estimation of abundance of non-diatom benthic algae using a 5-score scale.
Estimated Description abundance
dominant, covers more than 1/3 of the riverbed (>33%) abundant, but covers less than 1/3 of the riverbed (5-33%) just visible in the field (covers max. 5%) or microscopically dominant microscopically abundant microscopically rare
For macrophyte data, relationship between the five degrees of estimation and the actual quantity of the sub- merged macrophytes can be described best by a function y = x 3 (MELZER 1988; KOHLER & JANAUER 1997). There- fore the ordinal values of the five-point Kohler-scale were x3-transformed into quantitative values ("quanti- fies"). Median values were calculated from the available chemical and physical data. Biological data were anal- ysed by cluster analysis (average linkage within groups, distances cosinus; SPSS). Similarities in the species composition and the abundance of the species were in- vestigated by means of vegetation tables (species-by- site matrix).
In an analogous manner, the abundance-values of the remaining phytobenthos were squared to get a better ap- proximation of the degree of covering in the field. Pure- ly planktonic taxa which were noted in the species lists of remaining phytobenthos were excluded from statisti- cal analysis. For the multivariate analyses (CA, CCA; CANOCO 4.5), from the chemical data average values per sampling site per season (winter: October through March; summer: April through September) were calcu- lated. These data were transformed by logarithmic trans- formations. For univariate analyses, an average value per sampling site was calculated for each environmental parameter of interest. Sites were grouped into classes and presence-absence data of species were used to cal- culate the percentage of sites per class where each taxon was found.
The analysis of the Diatom data was done by using cluster analyses (average linkage within groups, dis- tances cosinus; SPSS), correspondence analyses and canonical correspondence analyses (TER BRAAK 1996; CANOCO). Furthermore similarities in species compo- sition and abundance were analysed by means of vegeta- tion tables (species-by-site matrix). Additionally ecolog- ical indices such as trophic state (e.g. CORING et al. 1999; KELLY 1996; ROTT et al. 1999); saprobic state (ROTTet al. 1997) and salinity (ZIEMANN 1999) were calculated.
Limnologica (2004) 34,283-301

Classification of macrophytes and phytobenthos in rivers 287
Results
Reference sites For developing a river typology, sites with only very minor human impacts were used. Only sites showing nearly undisturbed physico-chemical (e.g. pH, salinity, saprobic and trophic status), hydromorphological and biological conditions were chosen. As this is not a best available approach, for some river types only few refer- ence sites could be detected. In the REFCOND Guid- ance of the EU (WALHN et al. 2002) was defined that
high ecological status is equal to reference conditions. In the present project a total of 74 reference sites resulted to develop the typology for the three plant components.
Biocoenotic typology To (1) distinguish different types of running water, and (2) compare these types with the geomorphologic types developed by SCHMEDTJE et al. (2001b), the taxonomic composition and abundance of the species found at the reference sites were compared by statistical methods,
Table 3. Biocoenotic river types for benthic plants in Germany.
Ecoregion Macrophytes Remaining phytobenthos Diatoms
Alpine MP(G) lowland rivers in mountainous PB 1 Alpine rivers D la regions areas, incl. subtype MPG
(influenced by groundwater) D lb
Fore- MRK fast flowing rivers and brooks PB 2 Rivers of the fore- D 3 alpine of mountainous areas alpine region regions (hard water) D 2a
D 2b
calcareous alpine rivers, catchment area < 1000 km 2 calcareous alpine rivers, catchment area > 1000 km 2
. . . . . . . . . . . . . . . . . . . . . . . . . . .
siliceous rivers, catchment area <1000 km 2 calcareous rivers, catchment area <1000 km 2 rivers, catchment area > 1000 km 2
Central MP(G) lowland rivers in mountainous areas, PB 3 siliceous rivers of mountains incl. subtype MPG (influenced by Central mountains
groundwater) MRS fast flowing rivers and brooks of
mountainous areas (soft water) Mg big streams of mountainous areas
D 4 Central mountain rivers of variegated sandstone and crystalline basements catchment area < 100 km 2
D 6 Central mountain rivers of volcanic regions, catchment area < 100 km 2
D 5 Central mountain rivers of variegated sandstone and crystalline basement catchment area > 100 km 2 and < 1000 km 2
MP(G) lowland rivers in mountainous areas, PB 4 incl. subtype MPG (influenced by groundwater)
MRK fast flowing rivers and brooks of mountainous areas (hard water)
Mg big streams of mountainous areas
calcareous rivers of Central mountains and lowlands of northern Germany
D 7a Central mountain rivers of loess- and keuper regions, catchment area < 1000 km 2
D 7b calcareous Central mountain rivers, catchment area <1000 km 2
D 8 calcareous Central mountain rivers, catchment area > 1000 km 2
Lowlands TN medium sized lowland rivers of PB 4 calcareous rivers of D 9 calcareous lowland rivers of northern of northern Germany Central mountains and Germany, catchment area <1000 km 2 northern lowlands of northern Germany Germany
. . . . . . . . . . . . . . . . . . . . . . . . . . . . . . . . . . . . . . . . . . . . . . . . . . . . . . . . . . . . . . . . . . . . . . . . . . . . . . . . . . . . . . . . .
TR fast flowing rivers and brooks PB 5 organic and siliceous D 10 of northern Germany lowland rivers of
northern Germany TNg big lowland streams of D 11
northern Germany
calcareous lowland rivers of northern Germany, catchment area > 1000 km 2
organic and siliceous lowland rivers of northern Germany, catchment area < 1000 km 2
Limnologica (2004) 34,283-301

288 J. Schaumburg et al.
8~ 8 m[J
o
c
r -
¢¢J c - 03
O0
r2=
r -
-¢2J
8 t.9
LA
E
N d re"
$ >
x 4.a
> ,
C4
o b
4 - -
.l..o
U
flJ
4
e-,
oz/q2,t/od olopoJ]O ~
!/Ilellnu eapotJ
~!~,ua, oeue~ eapo]:~ IOU/UJ eutua7 .
(~uqns) uan~au~a cun!ue6~ed~ .
m;eu/.~)ad uolagome~o d i ~ U i m l e d ~!',]e,u,,~;,uuez
u~n~eMds wnlpfqdo!mfk~j
snd~ uo~a6ouJe~Od
('uJqns) snjei/aqum snuJoln~]
e~enbe-s!lle6eue e)!uOiaA i
('u~qns) sue;!nlg e!sa~.(I9 ]
('~Jqn~) ea~eu!punse ~!~eNq d i
('v.'qns) e~ojfUOlO~SS!;SO~gg j SnllXqdoq)p~ x ~uel~.nlt ",~ ] m#,gt]dotRJ; snln)UnUe~t i
~uez!n# m/n)unu~*
('u~qns) ~leut~qN umfl2a2seN ]
wnuedg tun~)!Potd#7 i eqd~ow,~lod e!.~ue~3JeF~
e~jd~n.~ ~#auo~a!tte9 i
i i + !
IIIIIIIIIIII+HIIII IIII!
$ - . L - I _ L L A _
eo]~aJ~o?;ue sfNUfluo4
e~efopun e[uede)~ wn~!pnl/ad uJm~uopoq~!(1
Lunaluafi~e um/O~
m3!leflbe m~op!guD
~;oq,~ue,'flod mqdX~so]!~) ~nlnS!p!s uopott~4o!~
~OlOZ~ q +un,~9 d~ u~n~'~1
etnSuesn~qo oq)~,,,~!]iP?
xeua; ~un!~J4q~#eoJS/iH al:,le/,~nlj wn/gal~,flq#z~o.~E~fH
umup!zg ue~nauo,~eO a~eln4P u~m~aqff~pe, z8 tunp!m 1 enuNuo~E/;H
~unlnqe~n; ~npatf~fq~ex 8 mso.uenbs snqdlape!p!dq~
alemW ~un!go~oq~u,(~
~n~un#e snpepou~doJQ
uJn,~eu.tq~nt ~u~/~t8
+
?i
Illlll
llIII
Limnologica (2004) 34,283-301

Classification of macrophytes and phytobenthos in rivers 289
such as cluster analyses and correspondence analyses. As a result for macrophytes (M) seven types including one subtype, for benthic diatoms (D) 14 types including three subtypes and for the remaining phytobenthos (P) five river types could be defined. The description and overlap of these types is shown in Table 3.
A more detailed description how these types were de- rived is given in FOERSTER et al. (2004), MEILINGER (2003) and SCHAUMBURG et al. (2005). The main de- scriptors of the biocoenotic fiver types for the assess- ment with macrophytes and phytobenthos according to the WFD are the following:
- ecoregion (according to ILLIES 1978) (MPD) - fluvial landscape (BRIEM 2003) (D) - dimension of catchment area (D) - mean width (M) - mean depth (M) - current velocity (M) - effect of ground water (M) - water hardness (MP) - acid capacity (P).
Special attention was paid to parameters which are in- dependent or nearly independent of anthropogenic im- pacts.
Steps to the classification
In order to develop a classification system according to the normative definitions of WFD, biocoenotic refer- ence conditions had to be defined for the different bio- coenotic types, and deviations from these reference con- ditions had to be quantified to define the good, moder- ate, poor and bad status classes. The classification sys- tems were developed separately for each group and were combined later to give an integrated method for the whole benthic plant community (entire quality element). For the development of the system, the three groups fol- lowed the same underlying notion: reference taxa were named and distinguished from taxa which indicate dif- ferent degrees and forms of degradation. In some cases, additional metrics were used (see below). The following results show exemplary how different types, reference conditions, the classification system in the three plant components and finally for the entire quality element of the benthic plant community in rivers and streams were developed.
Macrophytes
Biocoenoses of emergent water plants in running waters show a high degree of natural variability. Therefore, no change in taxonomic composition and abundance of emergent macrophytes is evident with increasing degra- dation of river sites. In contrast, submerged macrophytes
(hydrophytes) do show differences in taxonomic compo- sition and abundance. Using vegetation tables (species- by-site-matrix) for each river type, reference biocenoses were identified and the shift in vegetation with increas- ing degradation was shown. Table 4 shows an example matrix using sites of the river type "fast flowing rivers and brooks of mountainous areas (hard water)" in rows and species (with their abundance according to the KOHLER-scale) in columns.
Reference sites (bold letters) are placed at the top of the sites. They provide a point of reference to which the remaining sites can be compared. Species occurring mainly at reference sites are placed in the left part of the table. Subsequently, all other sites and species are ar- ranged in the table due to their similarity or dissimilarity of their species compositions compared to the reference sites. Thus, river sites are sorted by their deviations from the anthropogenic undisturbed reference sites, as demanded in the WFD. Sites with the highest deviation in species composition and abundance from reference sites are placed at the bottom of the table. Additionally, species are arranged according to their occurrence at reference sites, i.e. taxa occurring at reference sites are placed at the left hand side, taxa not or only rarely oc- curring together with reference-taxa are placed at the fight-hand side of the table. For developing an indica- tion system, macrophyte species are classified into groups of ecologically similar taxa, separately for each river type:
- S p e c i e s g r o u p A contains taxa showing high abun- dance at reference sites and low or no abundance under non-reference conditions. These taxa belong to the type- specific reference biocoenosis.
- S p e c i e s g r o u p C are those taxa rarely found under reference conditions. They usually have high abundance at sites with very low or no abundance of Group A taxa.
- S p e c i e s g r o u p B taxa show no preference for refer- ence or non-reference conditions. They occur together with taxa from species group A and species group C.
These species groups are consistent with existing macrophyte autecology (MEILINGER 2003). Macrophytes described in the literature but not found in our river sites were incorporated into the relevant species group. A complete taxa list including type-specific classification into species groups can be found in SCHAUMBURG et al. (2004, http://www.bayeru.de/lfw). As a measure of the deviation of a biocoenosis' species composition and abundance from an unaffected reference, the so-called reference index (RI) was used (Formula 1):
nA n c
R / = i=1 i=1 * 1 0 0 ng
Qg~ i=1
Limnologica (2004) 34,283-301

290 J. Schaumburg et al.
where: RI = reference index; QAi = quantity of the i-th taxon from species group A; Qci = quantity of the i-th taxon from species group C; Qgi = quantity of the i-th taxon of all groups (A, B, C); hA= total species number of taxa from species group A; n c = total species number of taxa from species group C; ng= total species number of taxa from all groups (A, B, C).
The RI is an expression of the "plant quantity" of type-specific sensitive taxa compared to the "plant quan- tity" of insensitive taxa, and is therefore a tool for esti- mating the deviation of observed macrophyte communi- ties from reference communities. The resulting index values range from + 100 (only species group A taxa) to - 100 (only species group C taxa).
Reference indices for each site are calculated, and the range of RI values occurring on reference sites is defined as a benchmark for ecological quality class "high" ac- cording to the WFD. Based on the vegetation tables, type-specific limiting values of the reference index are set according to the guidelines of Annex V of the WFD. These values are used to calculate index classes for the entire quality element (see below).
For some river types, further metrics are used in addi- tion to the calculated values of the reference index to de- fine the ecological status of a site. For river type TN (medium sized lowland rivers of the Central lowlands of Germany) additional metrics such as number of taxa, evenness, and plant quantity of C-taxa ~30% (MEILINGER 2003) are used. For the assessment of the quality component macrophytes, a certain total plant quantity (as described in the chapter Data treatment) of plants at a site is considered necessary. The minimal re-
quired abundance depends on the river type. For a de- scription of the requirements needed for an assessment of river sites based on macrophytes, see MEILINGER (2003). If the required abundance values are not reached, the assessment of the component is considered inconclusive.
Benthic diatoms
In order to develop a classification according to the WFD numerous existing metrics as well as new devel- oped ones were tested (SCHAUMBURG etal. 2005). The best results were achieved by combining four metrics. The first metric "species composition and abundance" meets the requirements of the WFD best. Two lists of reference-species were developed, one for calcareous and another one for siliceous river sites. The included species are limited to oligotrophic and mesotrophic rivers. In regions with heterogeneous geology in the catchment areas, both lists can be used. Additionally it was necessary to create special lists of reference species for each river type. These lists contain species which are more tolerant concerning the trophic state, in case of the large rivers even indicators for eutrophic conditions. These species are ubiquists which are already abundant in high and good ecological status. A classification with- out them would be impossible in those rivers. The refer- ence species lists were completed by species which were not found at the sampling sites. The autecology of these species is well known from unpublished data, expert knowledge and literature studies. The numbers of species of the several types are summarised in Table 5.
Table 5. Numbers of species in type-specific species groups of rivers.
Species group Biocoenotic river type
Macrophytes MRK MRS MP(G) TN Reference 62 28 51 54 Indifferent/tolerant 53 70 60 42 Indicator of degradation 34 26 26 9 Indicator of acidification 10
. . . . . . . . . . . . . . . . . . . . . . . . . . . . . . . . . . . . . . . . . . . . . . . . . . . . . . . . . . . . . . . . . . . . . . . . . . . . . . . . . . . . . . . . . . . . . . . . .
Remainig phytobenthos P3 P4 P5 Reference 14 17 9 Indifferent/tolerant 37 28 15 Indifferent/degradation 21 21 10 Indicator of degradation 2 2 1
. . . . . . . . . . . . . . . . . . . . . . . . . . . . . . . . . . . . . . . . . . . . . . . . . . . . . . . . . . . . . . . . . . . . . . . . . . . . . . . . . . . . . . . . . . . . . . . . .
Benthic diatoms Reference
Dlab D2a D2b D3 D4 D5 D6 DTa D7b D8 D9 DIO 2 11 13 7 6 10 10 10 12 11 28 42
. . . . . . . . . . . . . . . . . . . . . . . . . . . . . . . . . . . . . . . . . . . . . . . . . . . . . . . . . . . . . . . . . . . . . . . . . . .
Type-independent Reference, siliceous 123 Reference, calcareous 87
Limnologica (2004) 34,283-301

Classification of macrophytes and phytobenthos in rivers 291
The summed up percentages of the abundance of both kinds of reference species at a site are used for the classi- fication.
As second metric, the trophic state as one of the main criteria for the distribution of diatoms is used for the classification system (Fig. 2).
For rivers in the high and good status a high resolu- tion for nutrient poor conditions has to be reached. The best differentiation for these conditions was recorded using the Trophic-Index from ROTT et al. (1999). The range of the trophic index occurring on reference sites was defined as a benchmark for high ecological quality, the class boundaries were set according to the guidelines of Annex V of the WFD. For diatom types where no sites with high ecological quality exist (e.g. larger rivers), the range of trophic conditions was widened, resulting in a species composition on a lower trophic level. For rivers of the Central lowlands of Germany with a high trophic level in good status the existing classification systems for determination of the trophic state are not useful. In this river type the saprobic index from RoTT et al. (1997) was proved to be a more adequate tool. Compared to the trophic index, the saprobic index can be used in a larger range of degradation in rivers affected by higher human pressure. Both metrics "species composition and abun- dance" as well as "trophic index or saprobic index" are combined by averaging after the values have been con- verted to a comparable scale (0-1).
For the classification of acidified rivers in the Central mountains an acidification tool is needed. A special list
of acidification indicators was developed. The species of this list are also elements of the reference list for siliceous river sites. But at high ecological status only a few individuals are to be recognised. If the abundance- sum of the acidification indicators concerned exceeds a defined percentage of the biocoenosis, the result of tro- phy- and reference-taxa calculation will be devaluated. In a similar way, the calculation will be devaluated if the degree of salinity in a waterbody exceeds a certain amount (SCHAUMBURG et al. 2004) using the "Halobien- index" of ZIEMANN (1999) as a metric.
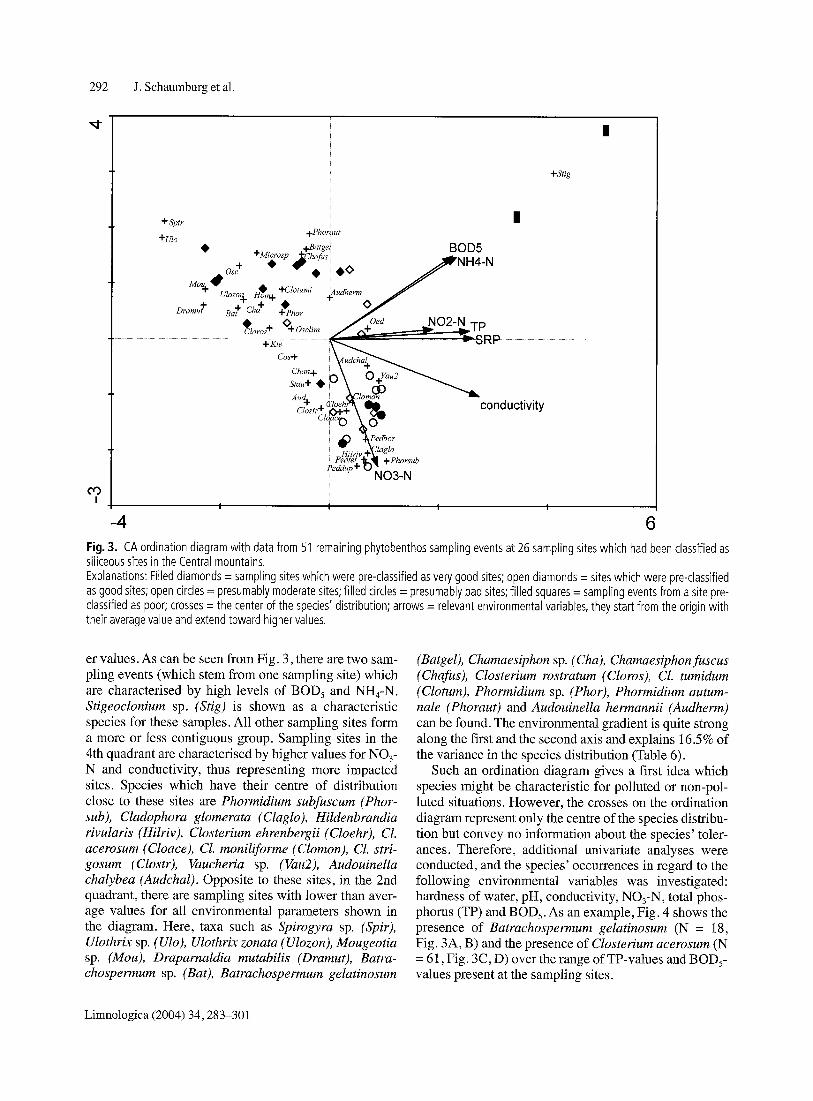
Remaining phytobenthos In order to develop an assessment method, information was gathered about the distribution of taxa with regard to relevant environmental factors. Multivariate analysis within each type were performed to see (a) whether there was a grouping of species and sites and (b) which envi- ronmental factors would explain the distribution of the species. These analyses were most successful for the sites belonging to PB-type 3, i.e. siliceous sites in the Central mountains. Fig. 3 shows the first and second axes of a CA ordination diagram.
Sampling sites which lie closely together show a sim- ilar species composition. The crosses represent the cen- tre of each species' distribution. Environmental vari- ables which have a significant influence on the species distribution are depicted as arrows. They start from the origin with their average value and extend towards high-
O
[ ]
~ , , . n ~ u - Zq5 ,~_~ ,~ • D ~ [ ] ~ u u []
~ o ~ [] r~ []
A
[]
-0.0 [ ] [ ]
+6.0
Fig. 2. DCA, diatom-biocoenoses of all in- vestigated river sites. Classification according to KELLY (1996). Index-value: 1.00-1.99 = circles; 2.00-2.99 = squares; 3.00-3.99 = triangles; 4.00-4.99 = rhombs.
Limnologica (2004) 34,283-301
292 J. Schaumburg et al.
-t-Stig
| + Sptr
+Ulo +Phor~ut • + . . ,+Batgei BOD5
+ ~,~o~,p ~choh <> j ~ e N H 4 _ N _o~o • i • //"
Mo,~ f i / / "
• ÷ ~ , / O , d N O 2 - N --,-,-, Cloros "l'Oscdm / ~ " - - - ~..-v l r"
....................................................................................................... g~:~ ......................................... ~ - - - S R P .......................................................................................................
i
c,o,,,+ f o ~ ~_ conduct,v,ty
-m,~ +V!.glo
~' NO3-N CO
I l I l t
-4 6 Fig. 3. CA ordination diagram with data from 51 remaining phytobenthos sampling events at 26 sampling sites which had been classified as siliceous sites in the Central mountains. Explanations: Filled diamonds = sampling sites which were pre-classified as very good sites; open diamonds = sites which were pre-classified as good sites; open circles = presumably moderate sites; filled circles = presumably bad sites; filled squares = sampling events from a site pre- classified as poor; crosses = the center of the species' distribution; arrows = relevant environmental variables, they start from the origin with their average value and extend toward higher values.
er values. As can be seen from Fig. 3, there are two sam- pling events (which stem from one sampling site) which are characterised by high levels of BOD5 and NH4-N. Stigeoclonium sp. (Stig) is shown as a characteristic species for these samples. All other sampling sites form a more or less contiguous group. Sampling sites in the 4th quadrant are characterised by higher values for NO3- N and conductivity, thus representing more impacted sites. Species which have their centre of distribution close to these sites are Phormidium subfuscum (Phor- sub), Cladophora glomerata (Claglo), Hildenbrandia rivularis (Hilriv), Closterium ehrenbergii (Cloehr), CL acerosum (Cloace), Cl. moniliforme (Clomon), Cl. stri- gosum (Clostr), Vaucheria sp. (Vau2), Audouinella chalybea (Audchal). Opposite to these sites, in the 2nd quadrant, there are sampling sites with lower than aver- age values for all environmental parameters shown in the diagram. Here, taxa such as Spirogyra sp. (Spir), Ulothrix sp. (Ulo ), Ulothrix zonata ( Ulozon ), Mougeotia sp. (Mou), Draparnaldia mutabilis (Dramut), Batra- chospermum sp. (Bat), Batrachospermum gelatinosum
(Batgel), Chamaesiphon sp. (Cha), Chamaesiphon fuscus (Chafus), CIosterium rostratum (Cloros), Cl. tumidum (Cloture), Phormidium sp. (Phor), Phormidium autum- hale (Phoraut) and Audouinella hermannii (Audherm) can be found. The environmental gradient is quite strong along the first and the second axis and explains 16.5% of the variance in the species distribution (Table 6).
Such an ordination diagram gives a first idea which species might be characteristic for polluted or non-pol- luted situations. However, the crosses on the ordination diagram represent only the centre of the species distribu- tion but convey no information about the species' toler- ances. Therefore, additional univariate analyses were conducted, and the species' occurrences in regard to the following environmental variables was investigated: hardness of water, pH, conductivity, NO3-N, total phos- phorus (TP) and BODs. As an example, Fig. 4 shows the presence of Batrachospermum gelatinosum (N = 18, Fig. 3A, B) and the presence of Closterium acerosum (N = 61, Fig. 3C, D) over the range of TP-values and BOD 5- values present at the sampling sites.
Limnologica (2004) 34,283-301

Classification of macrophytes and phytobenthos in rivers
Table 6. Variance of distribution of remaining phytobenthos species; results of CA analysis (Fig. 3).
293
Axes 1 2 3 4 Total inertia
Eigenvalues 0.474 0.452 0.399 0.339 5.606 Speciesienvironment correlations 0.755 0.862 0.278 0.469 Cumulative percentage variance
of species 8.5 16.5 23.6 29.7 of species-environment relation 19.1 42.8 45.0 50.3
. . . . . . . . . . . . . . . . . . . . . . . . . . . . . . . . . . . . . . . . . . . . . . . . . . . . . . . . . . . . . . . . . . . . . . . . . . . . . . . . . .
Sum of all eigenvalues 5.606
09
c -
I 3 .
E ~3 ~o
100
80
60
40
20
100
80
60
40
20
0
TP (mg 1-1)
A
=,l,=,°,n ,I 6 d o
m.. .~ o o
100 '
80-
60.
40.
20.
0
C
=H,nlH=, O ~ O 4 c O
o d o o
BOD 5 (mg I -I)
B
, I , , , , , , i , , , , , , i , , , , , , , , i , , , , ,
o o d o
II I=l
lOO
80
60
40
20
~ 0
D
I I I I I I I I I I I I I ' I I I H
~- ~ ~ b- 0~ d -g ai ,4 ~ ~ cd ~ co N d ,~ d o o d d ~
N=20 33 26 26 22 7 4 1 0 0 0 1 0 1 0 0 1 N=O 1717222317144 2 1 2 1 1 0 1 0 0 0 0 0 0 0 1
Fig. 4. Records of Batrachospermum ge/atinosum (A, B) and Closterium acerosum (C, D) in relation to the range of values for TP (A, C) and BOD5 (B, D). Below, the absolute number of sampling sites per class (N) is given,
Batrachospermum gelatinosum occurs at sites of moderate values of TP and BODs. Closterium acerosum could be found over almost the whole range of TP-val- ues, this species also tolerates high values of BOD 5. Ad- ditional information about the species distribution was gathered from the literature and compiled in a database. These sources of information (multivariate, univariate and literature data) jointly provided indication on toler- ances and preferences of taxa with regard to geomor- phology (pH, conductivity, hardness), trophy, and sapro-
by (NO3-N, TP, BODs). Based on these results, species were classified into 4 categories:
A: sensitive species, characteristic of a certain type of water bodies;
B: less sensitive species, more widely distributed, indi- cating good conditions;
C: tolerant species, indicating eutrophication, when present in high abundance;
D: species prefers strongly eutrophicated conditions.
Limnologica (2004) 34,283-301

294 J. Schaumburg et al.
So far, 84 taxa were grouped into these categories. Further investigations will hopefully yield more useful species, which then can be added to the list of indicative species. For the assessment of the ecological status of the sampling sites an index was developed which takes into consideration the abundance of the type-specific in- dicator species. Different weighting was assigned to the four indicator groups. The index is calculated by formu- la (2):
B / - ° = = i-1 * 100 n~ n~ n c n D
i=1 i=l i=1 i=1
where: QAi (Qsi, Qci, Qoi) is the squared abundance of a taxon i belonging to category A (B, C, D) with i in the summations running over all taxa belonging to A (B, C, D), i.e. i from 1 to n A (~, c, D), respectively.
Theoretically, the index lies between +100 (only species from category A are present) and -100 (only species from category D are present). Type-specific limits were set to derive the five ecological quality classes. In order to calculate an index and to derive the ecological status class of a sampling site, at least 5 indicative species have to be found, or (if there axe less species present) the total sum of the squared abundance must be _> 16. A more detailed example of the calculation of this index is given in GUTOWSKI et al. (2004). At present we were able to de- velop type-specific systems for an assessment of the eco- logical status of a sampling event for PB-types 3,4 and 5. Due to a lack of data no assessment routine could be pro- posed yet for types 1 and 2 (see Table 3).
Entire quality element For the classification of the entire quality element macrophytes and phytobenthos according to the WFD the three single components had to be combined to one system. As described above, for each component rele- vant types were defined and lists of reference and other indicator species were compiled. Table 5 shows the number of the species used.
Indices for the macrophytes, diatom and remaining phytobenthos components are calculated as shown above. After converting to a comparable scale (0-1), the index values are combined by averaging. To delimit dif- ferent quality classes, type-specific borders were set. An example is given in Table 10.
The assessment of the ecological status is based pri- marily on the classification of taxa to different groups which are either characteristic for reference conditions or which indicate different degrees of deviation from such conditions. Additionally, parameters like dominant
species (M), number of taxa (MP), evenness index (M), trophic index after ROTT et al. (1999) (D), saprobic index after ROTT et al. (1997) (D), salinity index ("Halobienin- dex") after ZIEMANN (1999) (D) and acidification status (D) are taken into consideration as well. Therefore, the proposed classification system is an integrated system to indicate the changes of benthic plant biocoenoses in species composition and abundance at different levels of degradation as well as the degree of some major impacts like eutrophication, acidification, and salinisation.
As mentioned above, for the assessment of the quality elements minimal necessary abundances are laid down specifically for each river type. For the summed quanti- ties, percentage of species and number of taxa for macro- phytes as well as for the coverage and number of taxa of remaining phytobenthos restrictions are to be recognised. If these requirements are not met, the assessment of the component is considered unsafe and will not be included in the assessment of the entire quality element.
Following these principles, it was possible to estab- lish a classification method for 5 macrophyte types, in- cluding one subtype, 3 phytobenthos types and 13 di- atom types, including three subtypes. For the classifica- tion of the entire quality element macrophytes and phy- tobenthos, the following example is given.
Example: Application of the classification system
In order to assess the ecological status of a sampling site by means of macrophytes and phytobenthos, the follow- ing steps have to be taken:
- asignation of the sampling site to the relevant type; - mapping and sampling the benthic flora; - compilation of species list including abundance; - calculation of the indices for each component separately; - calculation of additional metrics, if necessary; - calculation of the index for assessment for the entire
quality element; - determination of the ecological status.
Table 7. Typology attributes of the river "Mordgrundbach".
Attribute Value
Ecological region (according to ILLIES 1978) Fluvial landscape (BRIEM 2003) Dimension of catchment area Mean width Depth category Current velocity Effect of ground water Water hardness Acid capacity
Central mountains crystalline basement < 100 km 2 2.5m 1 (0-30 cm) 3 (0.1-0.3 m s -I) none < 1.4 mmol/I < 1.4 mmol/I
Limnologica (2004) 34,283-301

Classification of macrophytes and phytobenthos in rivers 295
Table 8. Macrophyte- and phytobenthos-data of river "Mordgrundbach" (all components sampled once in summer). Explanations: * A: taxa showing high abundance at reference sites and low or no abundance under non-reference conditions. C: taxa rarely found under reference conditions. They usually have high abundance at sites with very low or no abundance of Group A taxa. B: taxa show no preference for reference or non-reference conditions. They occur together with taxa from species group A and species group C. • * R: reference taxon, T: type-specific reference taxon. • ** A: sensitive species, characteristic of a certain type of water bodies. B: less sensitive species, more widely distributed, indicating good con- ditions. C: tolerant species, indicating eutrophication, when present in high abundance. D: species prefers strongly eutrophicated conditions.
Macrophytes Benthic diatoms
Taxon name Species Abundance Acidi- Taxon name Species Abund- group* (KOHLER 1978) fication group** ance
Agrostis stolonifera B 1 (%) Callitriche hamulata A 2 Chiloscyphus polyanthos A 2 Gomphonema sp. 0.2 Fontinalis antipyretica C 3 5omphonema ofivaceum R 0.6 1.2 2 Glyceria f/uitans B 2 var. minutissimum Men tha Iongifo/ia 2 5omphonema parvulum- 3.6 Myosotis nemorosa 2 Sippen Nasturtium sp. 1 Meridion circulate 1 2.5 2 Petasites a/bus 2 Meridion circulare R 0.2 1.2 2 Phalaris arundinacea B 2 var. constrictum Ranuncu/us aquafi/is B 3 Navicu/a cryptocepha/a 1.7 3.5 4 Ranuncu/us repens 2 Navicu/a exi/is R 0.6 2 1 Rhynchostegium riparioides C 3 Navicula gregaria 0.6 3,5 4 Veronica beccabunga 1 Navicu/a ignota R 0.2 1,8 2
Benthic diatoms
Taxon name Species Abund- Trophic Trophic Acid- group** ance value weight ifica-
(%) (ROTT (RoTT tion 1999) 1997)
Achnanthes helvetica R 1.3 0.6 3 Achnanthes kranzii R 2.3 Achnanthes lanceolata 2.7 3.3 3 Achnanthes lanceolata
ssp. frequentissima 0.6 2.8 3 Achnanthes minutissima R 37.2 1.2 1 Achnanthes oblongella R 0.4 1 2 Amphora pediculus 0.4 2.8 2 Cocconeis placentula T 2.9 2.6 2 Cymbella minuta R 0.6 2 1 Cymbella naviculiformis R 0.4 1.8 1 Cymbella silesiaca 0.4 Cymbella sinuata T 0.6 2.1 1 Diatoma anceps R 0.2 0.3 2 Diatoma mesodon R 2.9 0.7 4 Eunotia exigua R 0.2 O. 5 3 Eunotia incisa R 0.2 0.6 2 Eunotia minor R 3.6 Eunotia rhomboidea R 0.2 0.6 2 Fragilaria bicapitata 0,4 1,1 1 Fragilaria brevistriata 0.4 3 1 Fragilaria capucina 1 Fragilaria capucina T 18,8 1,1 2
var. gracilis Fragilaria construens T 1.5 2.3 2
f. renter Fragilaria exigua R 1 0.6 2 Fragilaria pinnata 0.6 2.2 1 Fragilaria ulna 2.5 3.5 4 Fragilaria ulna acus- 0.2 1.8 2
Sippen Fragilaria virescens R 0.4 1.4 1
X
var. acceptata Navicu/a/anceo/ata 1.5 3.5 4 Navicula minima 0.2 2.9 2 Navicu/a rhynchocepha/a 0.4 2.3 1 Navicula suchlandtii R 1.5 0.6 2 Nitzschia acidoclinata R 1.2 2.3 2 Nitzschia amphibia 0.2 3.8 5 Nitzschia dissipata 0.6 2.6 1
van media Pinnularia sp. 0.4 Pinnularia schoenfelderi R 0.2 Pinnularia silvatica R 0.2 Pinnularia subcapitata R 0.2 0.9 2 Stauroneis kriegerii R 0.2 3.3 2 Surirella brebissonii 0.4 3.6 5 Surirella roba 0.2 0.6 2 Tabellaria flocculosa R 0.6 0.8 2
X X
X
Trophic Trophic Acid- value weight ifica- (RoTT (RoTT tion 1999) 1997)
Remaining phytobenthos
Taxon name Species Abundance group*** (Table 2)
Aphanocapsa 1 Chamaesiphon B 1 Chantransia B 2 CIosterium moniliferum var. concavum C 1 Closterium rostratum A 1 Clostefium strigosum vat. elegans C 1 C/osterium tumidulum B 1 Closterium tumidum A 1 Cosmarium 2 K/ebsormidium 1 Lemanea B 4 Microspora 1 Oedogonium £ 1 Phormidium 1 Scenedesmus I Staurastrum 1 Tribonema B 1
Limnologica (2004) 34,283-301
296 J. Schaumburg et al.
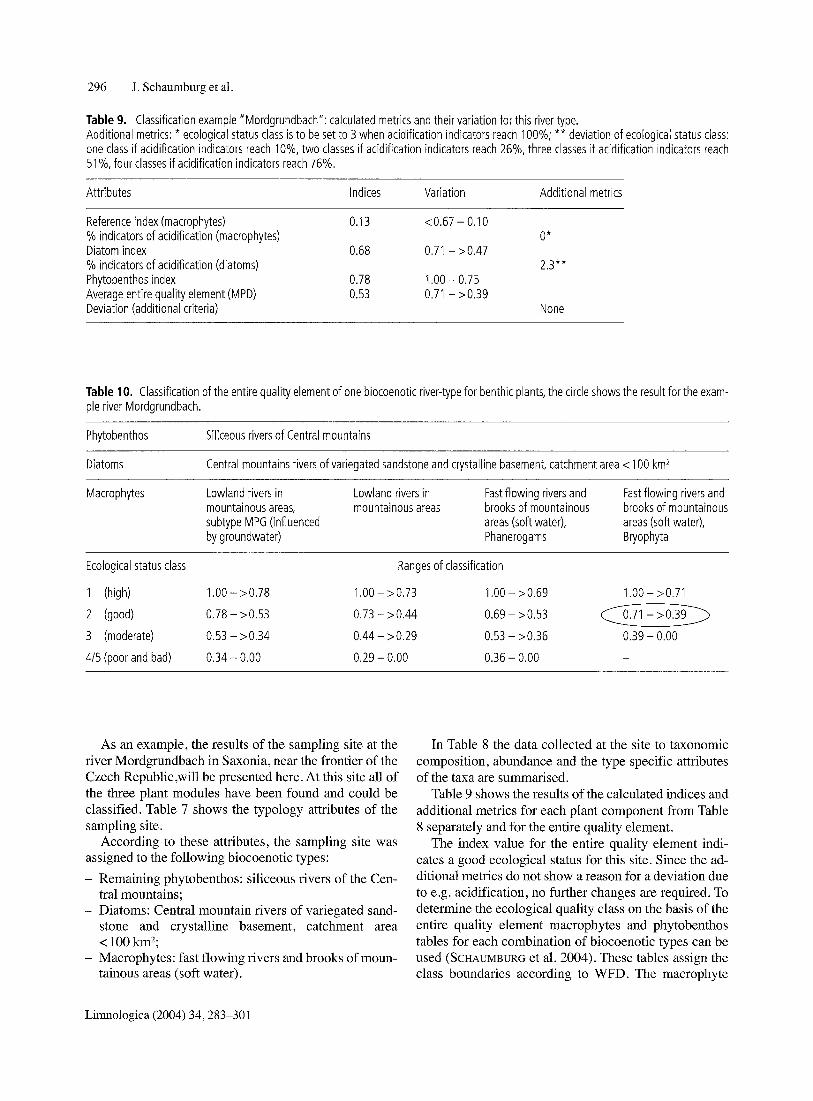
Table 9. Classification example "Mordgrundbach": calculated metrics and their variation for this river type. Additional metrics: * ecological status class is to be set to 3 when acidification indicators reach 100%; ** deviation of ecological status class: one class if acidification indicators reach 10%, two classes if acidification indicators reach 26%, three classes if acidification indicators reach 51%, four classes if acidification indicators reach 76%.
Attributes Indices Variation Additional metrics
Reference index (macrophytes) % indicators of acidification (macrophytes) Diatom index % indicators of acidification (diatoms) Phytobenthos index Average entire quality element (MPD) Deviation (additional criteria)
0.13 <0.67- 0.10
0 .68 0.71 - > 0 .47
0.78 1.00-0.75 0.53 0.71 ->0.39
O ~
2.3**
None
Table 10. Classification of the entire quality element of one biocoenotic river-type for benthic plants, the circle shows the result for the exam- ple river Mordgrundbach.
Phytobenthos Siliceous rivers of Central mountains
Diatoms Central mountains rivers of variegated sandstone and crystalline basement, catchment area < 100 km 2
Macrophytes Lowland rivers in Lowland rivers in mountainous areas, mountainous areas subtype MPG (influenced by groundwater)
Fast flowing rivers and brooks of mountainous areas (soft water), Phanerogams
Fast flowing rivers and brooks of mountainous areas (soft water), Bryophyta
Ecological status class Ranges of classification
1 (high) 1.00 - >0.78 1.00 - >0.73 1.00 - >0.69 1.00 - >0.71
2 (good) 0.78 - >0.53 0.73 - >0.44 0.69 - >0.53 ~ - >0.39._______.~
3 (moderate) 0.53 - >0.34 0.44 - >0.29 0.53 - >0.36 0.39 - 0.00
415 (poor and bad) 0.34 - 0.00 0.29 - 0.00 0.36 - 0.00 -
As an example, the results of the sampling site at the river Mordgrundbach in Saxonia, near the frontier of the Czech Republic,will be presented here. At this site all of the three plant modules have been found and could be classified. Table 7 shows the typology attributes of the sampling site.
According to these attributes, the sampling site was assigned to the following biocoenotic types:
- Remaining phytobenthos: siliceous rivers of the Cen- tral mountains;
- Diatoms: Central mountain rivers of variegated sand- stone and crystalline basement, catchment area < 100 km2;
- Macrophytes: fast flowing rivers and brooks of moun- tainous areas (soft water).
In Table 8 the data collected at the site to taxonomic composition, abundance and the type specific attributes of the taxa are summarised.
Table 9 shows the results of the calculated indices and additional metrics for each plant component from Table 8 separately and for the entire quality element.
The index value for the entire quality element indi- cates a good ecological status for this site. Since the ad- ditional metrics do not show a reason for a deviation due to e.g. acidification, no further changes are required. To determine the ecological quality class on the basis of the entire quality element macrophytes and phytobenthos tables for each combination of biocoenotic types can be used (ScHAUMBURG et al. 2004). These tables assign the class boundaries according to WFD. The macrophyte
Limnologica (2004) 34,283-301

Classification of macrophytes and phytobenthos in rivers 297
and phytobenthos community indicate a good ecological quality for this sampling site (Table 10).
Discussion
Benthic aquatic plants are an important part of the river- ine environment. They are primary producers, provide habitats for animals and stabilise sediments. Numerous human impacts can be detected by the use of aquatic plants. They are indicators of eutrophication and are sen- sitive to acidification or salinisation. Hence macro- phytes and phytobenthos are an important and useful quality element for an assessment according to the WFD.
Macrophytes Macrophyte response to anthropogenic river habitat dis- turbance allows them to be used as bioindicators. Aquatic plant communities respond to degradation with changes in taxonomic composition, as well as an increase or de- crease of plant abundance (KoI4LER 1975). Additionally, rooted aquatic plants link sediment and overlying water and are therefore able to indicate conditions in both river compartments (ScHNEiDeR & MELZEk 2003). Beside this spatial integration, macrophytes can also integrate tem- poral changes because of their relatively long generation times, which include at least one vegetation period up to several years. These features make them very suitable in- dicators for the purposes of the WFD. As a further advan- tage, aquatic macrophytes can be recorded relatively eas- ily in the field, and their determination is normally not time consuming or expensive.
Aquatic macrophyte biocoenoses in some cases show a high degree of natural variability. Therefore, the at- tempt to develop an assessment tool for river sites based on helophytes proved unsuccessful. A depopulation of macrophytes can occur as a result of anthropogenic in- fluences, e.g. eutrophication, but can also be due to flowing velocity or shading, i.e. natural reasons (STRAND & WEISNER 1996). Therefore, the absence of macro- phytes at a river site cannot be interpreted as degrada- tion. An indication of the ecological status by macro- phytes requires a certain minimum plant quantity. If this type specific plant quantity is not met and the reasons of the absence cannot be clarified, the reference index (RI) must be denoted as inconclusive (for description of type specific requirements see MEm~ER 2003). In that case, the macrophyte component must be excluded of the classification of the entire quality element. Further prob- lems could occur with the fact that an assessment system could not be developed for three of the macrophyte river types (Mg, TR, TNg, see Table 3) due to insufficient data.
Compared to other biological groups (e.g. diatoms), species numbers of macrophyte biocoenoses are rela- tively low. Therefore, type-specific species groups were developed on the basis of vegetation tables (species-by- site matrices, see Table 4) containing the data collected in the field. Macrophytes described in the literature but not found in our river sites, were incorporated in the rel- evant species group (MEmlN~ER 2003 for review). Thus, the classification of submerged taxa into ecologically similar groups of species provides good assessment sys- tem applicability and furthermore allows a controlled addition of new taxa, if necessary. The reference index for macrophytes is a tool for describing the deviation of the observed macrophyte communities from reference conditions. Therefore, every factor affecting the taxo- nomic composition and abundance of aquatic macro- phytes is detected.
Benthic diatoms Diatoms and their demands and habitats have been known since the beginning of the 20 th century (KoLK- WlTZ & MARSSON 1908). Because of the short generation time, they are able to build a new biocoenosis in a few weeks. In case of changing environmental matters, a modification in taxonomic composition and abundance is indicating those impacts immediately. Diatoms are widespread and can be found in almost all running wa- ters. Therefore diatoms are a suitable organism group according to WFD.
Their ability for indicating nutrients, salinity, acidifi- cation and saprobic status was used in the past for es- tablishing several indices for monitoring running wa- ters (e.g. KELLY 1996; ROTT 1997, 1999; COt~IN6 et al. 1999; ZmMat,~ 1999). Some of these indices are mod- ules of the developed assessment system. Trophic index, saprobic index and summation of reference taxa abundance are modules for calculating the diatom index. All of these modules are based on taxonomic composition and abundance, as demanded by the WFD. The developed system for diatoms is effectual for near- ly all German river types. Only small siliceous and or- ganic stamped brooks and rivers of Northern Germany cannot be evaluated yet because of insufficient data. The additional criteria acidification and salinity indi- cate forms of human impacts which cannot be identi- fied by the other modules (except acidification by macrophytes).
Remaining phytobenthos Benthic algae are a main component of the flora of run- ning waters which are embedded into the flow-balance of input and output of matter. They are important prima- ry producers and are among the first to accumulate inor-
Limnologica (2004) 34,283-301

298 J. Schaumburg et al.
ganic phosphorus and nitrogen. By reacting to environ- mental conditions, phytobenthos gives an integrated pic- ture of influences to the water body and may tell us about the status of nutrients, thermal and oxygen condi- tions, salinity, acidity, and toxic influences. Therefore analysing this component may give valuable informa- tion for the monitoring routine and can make the presently applied methods more robust (see FRmDR~CH 1996; ELORANTA & KWANDRANS 1996; PIPP & ROTT 1996).
Unfortunately, no long-lasting research tradition using benthic algae excluding diatoms and Charales as indicators has been established in Germany so far, and data to classify the species according to the ecological status is deficient. Taxonomical and nomenclatural problems make things even harder. For practical use there is a guidance for trophic indication, which includes about 15 macroscopically visible benthic algae of differ- ent taxonomic level (MAUCH et al. 1995, 1998). Most of them are eutraphent taxa. Based on a literature study, SCHMEDTJE et al. (1998) classified 138 non-diatom taxa of benthic alga with regard to trophic indication. Many of them indicate the oligo- and mesotrophic range. In Austria, however, an extensive database exists which gives indicator values for benthic algae in running wa- ters. These allow to indicate trophic and saprobic condi- tions as well as the geochemical type of water (Roaq" et al. 1997, 1999). For Germany, new analyses were neces- sary in order to characterise the algal flora associated with different ecological regions.
In this paper, we present our attempt to elaborate an evaluation of ecological status for some types of running waters in Germany on the basis of analyses of data of 13 classes of benthic algae (excl. diatoms and Charales) at 152 sites all over Germany. A first method to assess the ecological status of running water by means of benthic algae was developed which is in accordance with WFD. Further investigations are definitely necessary to consol- idate the evaluations made so far and to work out further details. Additional sampling sites in the alpine and fore alpine region need to be characterised by own investiga- tions. In our studies the calcareous sites in the Central mountains and the Central lowlands seemed to be espe- cially heterogeneous and need further investigation. Or- ganic sites (influenced by peat) in the Central Lowlands proved also to be interesting.
Further investigations will probably also allow to add more indicator species to the type-specific lists. This would improve the basis of assessment and enhance its applicability. Therefore, the autecology of species has to be investigated by correlating the occurrence of species with physico-chemical data of the sampling site. In the ideal case ecophysiological studies in the laboratory would support work in the field.
Entire quality element A common problem of all new developed classification systems concerning the WFD is the lack of naturally undisturbed reference sites in some regions of Germany. In this study, sites with only very minor human impacts were used to develop river typologies and to acquire type specific species groups. To compensate low num- bers of reference sites within some types, literature re- view and expert knowledge were used supplementary (see SCHAUMBURG et al. 2005).
The comparison with the abiotic typology (20 types) from SCHMDTJE et al. (200 lb) allows the following con- clusions: (1) There is less differentiation of water bodies across Germany with the single benthic plant compo- nents, i.e. for classification with the quality element macrophytes and phytobenthos fewer types are needed. (2) There is quite good agreement between the biocenot- ic plant types and the abiotic types. The original abiotic typology of SCHMEDTJE et al. (2001b) has been further developed by POTT6mSSER & SONMERHXUSER (2004). Compared to this typology there is some more differen- tiation with the biocoenotic plant types in a few cases e.g. volcanic streams in the Central mountains of Ger- many. Because of the overlap of the types of the three single plant components there are 19 reasonable theoret- ical combinations of these biocoenotic types of macro- phytes, diatoms and remaining phytobenthos. But for practical purposes there will be fewer because not all of the theoretical combinations really occur.
The three components of the entire quality element in some cases show differences in the calculated results of one site although in most cases these results are compa- rable. The expected differences can be explained by the biological differences in occurrence, growth and life- time of the elements. Macrophytes are long living organ- isms and are rooted to the sediment, therefore they inte- grate environmental conditions for a longer time. Di- atoms can raise new populations in a very short time, therefore they react very quick to environmental changes. They show quite different seasonal aspects of appearance over a year. Remaining phytobentos con- tains both, short reacting species and longer lasting ones.
According to our present experience, for the entire quality element macrophytes and phytobenthos two samplings per year are recommended to cover important situations for assessment: one in summertime for all three components and a second one in autumn only for diatoms and remaining phytobenthos. In the alpine and fore alpine ecoregion the latter two should be sampled in late winter or early spring. When sampling all compo- nents at the same time, attention should be paid to a spe- cial order. To avoid damage to one of the components one should start with sampling the diatoms, then the re- maining phytobenthos, and end with the macrophytes.
Limnologica (2004) 34,283-301

Classification of macrophytes and phytobenthos in rivers 299
The classification system as developed and present- ed here allows for the assessment of the ecological sta- tus of sampling sites at rivers in Germany by means of macrophytes and phytobenthos. Like all the upcoming suggestions of new ecological classification systems, it must be seen as a first draft, and further research in this area is necessary to validate the results and fill existing gaps. For the use of macrophytes and diatoms numer- ous tools and metrics which are useful for the WFD (e.g. trophic indices) already exist. A completely new dimension for routine monitoring is to adapt these met- rics to ecoregions and regional types respectively. An- other challenge are the normative definitions for the quality dements . It is not trivial to define references and the deviations from these references. There are at least two aspects to recognize. First the variations of the biocoenosis (i.e. taxa composition and abundance) and second the reasons for these variations mostly coming from human activities which are summarised as impacts of pressures. The classification should not only express the measurement of these impacts with some of the existing metrics, but should also reflect the reaction of the biocoenosis to these impacts expressed by the deviation of taxonomic composition and abun- dance from the reference conditions. The classification system is in accordance with the criteria laid out in WFD. It is based on biocoenotic data, on the species composition and the abundance of the species of the en- tire quality element of macrophytes and phytobenthos. It takes into consideration the different characteristics of different types of rivers, and the assessment of the ecological status is done by comparing the actual situa- tion in regard to the community composition to type- specific reference conditions. The plant community will indicate mostly the trophic status of the fiver and react to eutrophication. However, additional criteria are available which allow for the detection of other forms of human impacts, such as acidification and increased salinity. The EU-Classification-guidance (ECOSTAT 2003) proposes to average indices which will react to similar impacts on the level of each quality element, whereas effects of different impacts (like acidification and eutrophication) cannot be averaged because some species are reference indicators according to eutrophi- cation but indicators of degradation according to acidi- fication. Hence these impacts have to be considered separately. Therefore we included the metrics which express eutrophication into the plant classification modules which were averaged at the end, but degrada- tions other than eutrophication (as shown by the addi- tional metrics) can lead to a subsequent lowering of the ecological status class.
Also further human pressures which are not ex- pressed by additional metrics can be detected with our classification. The reference index is a tool for describ-
ing the deviation of the observed benthic plant commu- nities from reference conditions. Therefore, every factor affecting the taxonomic composition and abundance of benthic plants is detected. The classification system therefore provides an integrating assessment of the eco- logical status rather than simply indicating trophic sta- tus. It combines scientific demands with the aims of ap- plicability. The requirements of the European Water Framework Directive are thus fulfilled. In the years 2004 and 2005 a test in practice gives us the possibility to show deficiencies but also the applicability of the pro- posed method.
Acknowledgements
We are grateful to the Environmental Ministry of Austria for allowing us using data from Austrian rivers in the alpine re- gion, to Peter Pfister for sampling some of the sites, sharing his experience and a lot of useful discussion about our system, to Gerhard Welzl for helping us in all statistical affairs, to Di- eter Mollenhauer for support and advice, to the German Min- istry for Education and Research for funding the project (No. 0330033) and to LAWA (L~inderarbeitsgemeinschaft Wasser) for financial support (project No. O11.03).
References
BARBOUR, M. T., GERRITSEN, J., SNYDER, B. D. & STRIBLING, J. B. (1999): Rapid bioassessment protocols for use in streams and wadeable rivers: Periphyton, benthic macroinverte- brates and fish, 2nd edition. EPA 841-B-99-002. U.S. Envi- ronmental Protection Agency; Office of Water; Washington, D.C.
BRIEM, E. (2003): Gewgsserlandschaften der Bundesrepublik Deutschland. ATV-DVWK Arbeitsbericht, Hennef.
CEN - Comit6 Europten de Normalisation (2003): Europ~ii- sche Norm EN 13946. Wasserbeschaffenheit - Leitfaden zur Probenahme und Probenaufbereitung von benthischen Kieselalgen in Flieggew~issern, 17 pp.
CORING, E., SCHNEIDER, S., HAMM, A. & HOFMANN, G. (1999): Durchgehendes Trophiesystem auf der Grundlage der Tro- phieindikation mit Kieselalgen. DVWK Materialien 6,219 pp.
ECOSTAT - Water Framework Directive Common Imple- mentation Strategy Working Group 2 A 'Ecological Status' (2003): Overall Approach to the Classification of Ecological Status and Ecological Potential. http://www.umweltdaten.de/ wasser/Ecological_Classification_Guidance.pdf
ELORANTA, P. ~% KWANDRANS, J. (1996): Testing the use of di- atoms and macroalgae for river monitoring in Finland. In: WNITTON, B.A. & ROTT, E. (eds.), Use of algae for monitor- ing rivers. II. Proceedings of an International Symposium held at Vill near Innsbruck, pp. 119-124. Innsbrnck.
ENGELBERG, K. (1987): Die Diatomeen-Ztnose in einem Mit- telgebirgsbach und die Abgrenzung jahreszeitlicher Aspek- te mit Hilfe der Dominanz-Identit~it. Arch. Hydrobiol. 110 (2): 217-236.
Limnologica (2004) 34,283-301

300 J. Schaumburg et al.
European Union (2000): Directive 2000/60/EC of the Euro- pean Parliament and of the Council of 23 October 2000 es- tablishing a framework for Communities in the field of water policy, Official Journal of the European Communi- ties, L 327/1,22.12.2000.
FOERSTER, J., GUTOWSKI, A. & SCHAUMBURG, J. (2004): Defin- ing types of running waters in Germany using benthic algae: a prerequisite for monitoring according to the Water Framework Directive. Journal of Applied Phycology (ac- cepted).
FRIEDRICH, G. (1996): The use of algae for monitoring rivers in the proposed EU directive on the ecological quality of wa- ters. In: WrIITTON, B. A. & ROTT, E. (eds.), Use of algae for monitoring rivers II. Proceedings of an International Sym- posium held at Vill near Innsbmck, pp. 193-196. Innsbruck.
GUTOWSKI, A., FOERSTER, J. & SCHAUMBURG, J. (2004): The use of benthic algae excluding diatoms and charales for the assessment of the ecological status of running fresh waters: a case history from Germany. Oceanological and Hydrobio- logical Studies, University of Gdansk. Vol. XXXIII, No. 2: 3-15.
ILLIES, J. (1978): Limnofauna Europaea - Eine Zusammenstel- lung aller die europ/iischen Binnengew~isser bewohnenden mehrzelligen Tierarten mit Angaben fiber ihre Verbreitung und Okologie. Gustav Fischer Verlag, Stuttgart.
KELLY, M. G. (1996): The trophic diatom index. Bowburn Consultancy, R&D Technical Report E2: 1-148.
KOHLER, A. (1975): Submerse Makrophyten und ihre Gesellschaften als Indikatoren der Gew~isserbelastung. Beitr. naturk. Forsch. Stidw.-Dtl. 34: 149-159.
KOHLER, A. (1978): Methoden der Kartierung yon Flora und Vegetation von Sfigwasserbiotopen. Landschaft + Stadt 10 (2): 73-85.
KOHLER, A. & JANAUER, G. (1997): Zur Methodik der Unter- suchung von aquatischen Makrophyten in FlieBgew~issern. In: STEINBERG, C., BERNHARDT, H., KLAPPER, H. (eds.), Handbuch Angewandte Limnologie, Kap. VIII 1.1.3, pp. 1-22. ecomed Verlagsgesellschaft Landsberg.
KOLKWITZ, R. & MARSSON, M. (1908): Okologie der pflanz- lichen Saprobien. Ber. Dtsch. Bot. Ges. 26a: 505-519.
KRAMMER, K. & LANGE-BERTALOT, H. (1986): Stigwasserflora von Mitteleuropa, Bacillariophyceae. 2/1: Naviculaceae. Gustav Fischer, Stuttgart, 876 pp.
KRAMMER, K. & LANGE-BERTALOT, H. (1988): StiBwasserflora von Mitteleuropa, Bacillariophyceae. 2•2: Bacillariaceae, Epithemiaceae, Surirellaceae. Gustav Fischer, Stuttgart, 596 pp.
KRAMMER, K. & LANGE-BERTALOT, H. (1991a): StiBwasser- flora von Mitteleuropa, Bacillariophyceae. 2/3: Centrales, Fragilariaceae, Eunotiaceae. Gustav Fischer, Stuttgart, 576 pp.
KRAMMER, K. & LANGE-BERTALOT, H. (1991b): SfiBwasser- flora von Mitteleuropa, Bacillariophyceae. 2/4: Achnan- thaceae. Gustav Fischer, Stuttgart, 437 pp.
MAUCH, E., HAMM, A., SCHAUMBURG, J., SCHMEDTJE, U. & SCHMIDT, W.D. (1995): Hinweise zur Kartierung der Tro- phie von FlieBgew~issern in Bayern. Anleitung der bayeri- schen Wasserwirschaftsverwaltung, Stand 18.09.1995, Mfinchen, pp. 1-4.
MAUCH, E., HAMM, A., SCHAUMBURG, J., SCHMEDTJE, U. & SCHMIDT, W.D. (1998): Hinweise zur Kartierung der Tro- phie yon Flieggew~issern in Bayern. Anleitung der bayeri- schen Wasserwirschaftsverwaltung, Stand 22.05.1998, Mfinchen, pp. 1-7.
MEILINGER, P. (2003): Makrophyten als Bioindikatoren zur leitbildbezogenen Bewertung von FlieBgew~issern. Ein Beitrag zur Umsetzung der EG-Wasserrahmenrichtlinie. Dissertation, TU Mfinchen, http://tumb 1 .biblio.tu- muenchen.de/publ/diss/ww/2003/meilinger.html
MELZER, A. (1988): Der Makrophytenindex - Eine biologi- sche Methode zur Ermittlung der N~arstoffbelastung yon Seen. Habilitationsschrift an der Fakult~it ffir Chemie, Biologie und Geowissenschaften der TU Mtinchen, 249 pp.
PIPe, E. & ROTT, E. (1996): Recent developments in the use of benthic algae (excluding diatoms). In: WI-IITTON, B. A. & ROTT, E. (eds.), Use of algae for monitoring rivers II. Pro- ceedings of an International Symposium held at Vill near Innsbruck, pp. 160-165. Innsbruck.
POTTGIESSER, T. & SOMMERI-IJ~USER, M. (2004): Die Flieg- gew~issertypologie Deutschlands: System der Gew~isser- typen und Steckbriefe zu den Referenzbedingungen. In: STEINBERG, C., CALMANO, W., WILKEN, R.-D. & KLAPPER, H. (eds.), Handbuch Angewandte Limnologie, 19. Erg.Lfg. 7/04, VIII-2.1:1-16 + Anhang. ecomed Verlagsgesellschaft Landsberg.
ROTT, E., HOFMANN, G., PALL, K., PHSTER, P. & PIPP, E. (1997): Indikationslisten ffir Aufwuchsalgen. Teil 1: Sapro- bielle Indikation. Bundesministerium fiir Land- und Forstwirtschaft, Wien, 73 pp.
ROTT, E., PFISTER, P., VAN DAM, H., PIPP, E., PALL, K., BINDER, N. & ORTLER, K. (1999): Indikationslisten ffir Aufwuchsal- gem Teil 2: Trophieindikation sowie geochemische Pr~iferenz, taxonomische und toxikologische Anmerkun- gen. Bundesministerium ffir Land- und Forstwirtschaft, Wien, 248 pp.
SCHAUMBURG, J., SCHMEDTJE, U., K(3PF, B., SCHRANZ, C., SCHNEIDER, S., MEILINGER, P., STELZER, D., HOFMANN, G., GUTOWSKI, A. & FOERSTER, J. (2004): Handlungsanweisung ftir die 6kologische Bewertung yon FlieBgew~issern zur Umsetzung der EU-Wasserrahmenrichflinie: Makrophyten und Phytobenthos; http://www.bayern.de/lfw/projekte/ welcome.htm
SCHAUMBURG, J., SCHMEDTJE, U., KOPF, B., SCHRANZ, C., SCHNEIDER, S., MEILINOER, R STELZER, D., HOFMANN, G., GUTOWSKI, A. & FOERSTER, J. (2005): Makrophyten und Phytobenthos in Flfissen und Seen. Leitbildbezogenes Be- wertungsverfahren zur Umsetzung der EG-Wasserrahmen- richtlinie. Bayerisches Landesamt ftir Wasserwirtschaft. In- formationsbericht Heft 1/05.
SCHMEDTJE, U., GUTOWSKI, A., HOFMANN, G., LEUKART, P., MELZER, A., MOLLENHAUER, D., SCHNEIDER, S. & TREMP, H. (1998): Trophiekartierung von aufwuchs- und makrophy- tendominierten FlieBgew~issern. Informationsberichte des Bayerischen Landesamtes ffir Wasserwirtschaft 4/98, 501 pp.
SCHMEDTJE, U., KOPF, B., SCHNEIDER, S., MEILINGER, P., STELZER, D., HOFMANN, G., GUTOWSKI, A. & MOLLEN-
Limnologica (2004) 34,283-301

Classification of macrophytes and phytobenthos in rivers 301
HAUER, D. (2001a): Leitbildbezogenes Bewertungsver- fahren mit Makrophyten und Phytobenmthos. ATV-DVWK (eds.), Hennef, 281 pp.
SCHMEDTJE, U., SOMMERtL~USER, M., BRAUKMANN, U., BRIEM, E., HAASE, P. & HERING, D; (2001b): "Top-down - bottom up"-Konzept einer bioz6notisch begriindeten Fliel3- gew~issertypologie Deutschlands. In: Deutsche Gesellschaft ftir Limnologie (DGL) (Hrsg.), Tagungsbericht 2000 (Magdeburg), Tutzing 2001,147-151.
SCHNEIDER, S. & MELZER, A. (2003): The Trophic Index of Macrophytes (TIM) - a new tool for indicating the trophic state of running waters. Int. Rev. Hydrobiol. 88: 49-67.
STRAND, J. A. & WEISNER, S. E. B. (1996): Wave exposure re- lated growth of epiphyton: implications for the distribution
of submerged macrophytes in eutrophic lakes. Hydrobiolo- gia 325:113-119.
TER BRAAK, C. J. F. (1996): Unimodal modals to relate species to environment. DLO Agricultural Mathematics Group, Wageningen, 263 pp.
WALLIN, M., WlEDERHOLM, T. & JOHNSON, R. K. (2002): Guid- ance on establishing reference conditions and ecological status class boundaries for inland surface waters. Produced by CIS Working Group 2.3 - REFCOND. 5th and final draft, Stand 20.12.2002.89 pp.
ZlEMA~, H. (1999): Bestimmung des Halobienindex. In: TOMPLING, W. VON & FRIEDRICH, G. (Hrsg.), Biologische Gew~isseruntersuchung. Methoden der Biologischen Ge- w~isseruntersuchung 2, pp. 310-313.
Limnologica (2004) 34,283-301