limpopo green economy plan - department of …€¦ · where the goods and services provided by...
TRANSCRIPT

LIMPOPO
GREEN ECONOMY PLAN
INCLUDING
PROVINCIAL CLIMATE CHANGE RESPONSE
June 2013
PREPARED BY DR ANTOANETA LETSOALO
Manager Environmental Research and Planning
The heartland of southern Africa – development is about people!
Evridiki Towers, 20 Hans van Rensburg Street, POLOKWANE, 0700, Private Bag X9484, POLOKWANE, 0700
Tel: 015 293 8300, Fax: 015 295 5297, website: http\\www.Limpopo.gov.za

1
TABLE OF CONTENTS
EXECUTIVE SUMMARY …………………………………..………….……………….2 CHAPTER 1: INTRODUCTION - WHY GREEN ECONOMY …………….………..4
CHAPTER 2: WHICH COLOUR IS THE ECONOMY OF LIMPOPO……….……10
CHAPTER 3: KEY FOCUS AREAS OF THE GREEN PLAN –
NATIONAL AND PROVINCIAL PRIORITIES……………………...17 Sustainable Production and Consumption…………………….….…..……18 Water Management ……………………………….……………..………..…….19 Sustainable Waste Management Practices…………………………..……..22 Clean Energy and Energy Efficiency…………………………………..……..24 Resource Conservation and Management …………………………………28 Agriculture, Food Production and Forestry…………………………………29 Green buildings and the built environment............................................. 31 Sustainable Transport and Infrastructure………………………..………….33 Green Municipalities ……………………………………………………..……..34 Cross-cutting…………………………………….……………………….…........37
CHAPTER 4: IMPLEMENTATION PLANS PER KEY FOCUS AREA…..……..41
Sustainable Production and Consumption……………………...…..………41 Water Management ……………………………….……………..…..…….…….42 Sustainable Waste Management Practices…………………………………43 Clean Energy and Energy Efficiency…………………………………………44 Resource Conservation and Management ……………………….…………45 Agriculture, Food Production and Forestry……………………….…………47 Green buildings and the built environment................................................48 Sustainable Transport and Infrastructure………………..………….………49 Green Municipalities ………………………………………..………………..….50 Cross-cutting…………………………………….………………………..….…...51
CONCLUSION…………………………………………………………………………..52

2
Executive Summary
It is an exciting time in the history of Limpopo Province – there is an opportunity for all members of society to participate in credible economic activities. The Green Economy is local production and consumption, efficient use of energy and water and care of natural and created resources. It is a new way of thinking, planning and living. It provides socially and environmentally just solutions to economic exclusion and resource degradation. Limpopo Province has the potential to be the national pioneer in the Green Economy. The advantages of the province are:
1. Perfect geographic situation to develop a variety of green industries and economies of scale; 2. Invaluable mineral resource base for local beneficiation; 3. Unexploited biodiversity resources for green tourism and payment for ecosystem services; 4. Vibrant young population to enthusiastically engage in new, innovative and developmental economic activities.
The Green Economy in Limpopo will grant coupled benefits for the economy and the environment. The goals of the Limpopo Green Economy plan are:
Short Term: Generate Jobs Improve Environmental Quality
Medium Term: Create Enabling Conditions for Green Growth Change Behavioral and Production Patterns
Long-Term: Build a New Economic/Environmental Paradigm for Limpopo
The above will be implemented through specified initiatives in the following key focus areas: 1. Sustainable Production and Consumption 2. Water Management 3. Sustainable Waste Management Practices 4. Clean Energy and Energy Efficiency 5. Resource Conservation and Management 6. Agriculture, Food Production and Forestry 7. Green buildings and the built environment 8. Sustainable Transport and Infrastructure 9. Green Municipalities 10. Cross-cutting
The envisaged hierarchy of interventions is as follows: 1.Immediate policy decisions and enforcement can start Green Economy practices today on:
local, sustainable consumption and production,
green procurement,
green buildings,
sustainable transport,
energy efficiency,
water efficiency,
waste minimization.

3
2.Short to Medium Term Legislation and Policy Review and Coordination
To create enabling setting for a Green Economy the provincial government must communicate clear policy messages to the general community, industry and business and all public servants.
Municipal by-laws and all provincial policies and legislation must be reassessed to support the Green Economy model.
Coordination of all Green Activities and their inclusion in performance management is a mandatory condition for success.
3.Low capital investment and long term sustainability projects with huge potential for job creation:
Management of Alien Plants with further product development
Recycling with added production of biogass, paper, plastic. These can be located in practically all local municipalities, because the resource base is existing and unlimited, and no complex technical skills are needed. Just these two projects, multiplied by at least two teams in every local municipality have the potential to create no less than 1 000 long term sustainable green jobs. 4.Long Term Industrial Developments Energy security is a major component in the implementation of the LEGDP. Limpopo has the potential to develop several tier renewable energy complex, some components of which are:
Production of electricity through Concentrated Solar Plants (CSP) The province has favorable solar radiation and abundant land to build concentrated solar plants with generation capacity of not less than 100 MW, its geographic situation will allow transmission and sale to Zimbabwe, Botswana, Mpumalanga, Gauteng. Potential for further increase of generating capacity with the advance of technology is unlimited.
Production of electricity off the grid by small (5 MW) solar power plants There are dwellings where Eskom’s grid would not reach as it is not economically viable, which justifies such an investment and ensures delivery of services.
Production of components for solar panels Silicon reserves and the second biggest silicon smelter in the world are in Limpopo and in Polokwane. Industrial enterprises to beneficiate the resource by creating local employment and development of the human resource of the province must be created.
Production of solar chargers for cell phones, small scale electrical devises can be initiated and franchise further developed.
5.Long Term Human Resource Development The disturbing tendency of outmigration from the province of university graduates and matriculates due to lack of job opportunities can be turned around through the Green Economy initiatives. The major awareness campaigns around reasonable consumption, energy efficiency, water use, waste management, green buildings must be conducted by the youth of the province. As they are those who would experience the grave consequences of the current barbaric use of resources, appreciating the need of change in behavior can provide young people with meaningful engagement through political, church, neighborhoods, schools, universities, etc. networks. Introduction of technical subjects to the curricula of tertiary institutions and creation of specific FET colleagues in the province must take priority. The Green Economy has the potential to bring better life to the people in Limpopo. The province is identified as a Climate Change “hop-spot” – building resilient communities through green economy thinking, planning and implementation is our response to the challenge. The integrity of its political leadership and citizenry can make it happen.

4
Chapter 1
Introduction – Why Green Economy?
The main objective of Limpopo Employment Growth and Development Plan (LEGDP) 2009-2014 is to improve the quality of life of the people in the Province. It is envisaged, that this will be done by introducing economy, which:
1. Will create decent jobs, foundation to sustainable livelihoods 2. Create reliable health care infrastructure 3. Afford for the building of houses of acceptable standard 4. Provide social development 5. Result in comprehensive rural development, food security and land reform.
We hereby propose that the attention of the leadership and citizenry of the province is focused on the Green Economy, as the opportunity for successful accomplishment of the above objective and its specific tasks. The Green Economy is:
Environmentally sustainable, based on the belief that our biosphere is a closed system with finite resources and a limited capacity for self-regulation and self-renewal. We depend on the earth’s natural resources, and therefore we must create an economic system that respects the integrity of ecosystems and ensures the resilience of life supporting systems. A ecological economy: Globally humankind has been exploring ecosystem services for the last 10 000 years. Ecosystem services are all benefits people derive from nature: Provisioning – food, timber, water; Regulating – climate, disease, nutrient cycles regulation, Supporting – soil formation, Cultural – aesthetic and educational, places of worship, etc. Because of the elasticity and flexibility of natural systems, we still enjoy the plethora of benefits ecosystem services provide. However, since the beginning of the industrial revolution, we have significantly changed many variables in the Earth System. Through agriculture and urbanization, we are introducing new land use, which competes with the natural habitat of plants and animals, leading to their extinction, which is now measured at a rate 1 000 times higher than its natural background. A low carbon economy: the carbon level of economic activities in South Africa is disturbingly high. We are the 13th biggest emitter of Carbon Dioxide (CO2) in the world. Continuing to operate in the current energy from coal production paradigm will compromise our position as an international player and challenge our own energy security. A circular economy: an economy in which the waste from one production/consumption process is circulated as a new input into the same or a different process. Currently, the waste from all aspects of human activities creates pollution, as we release new chemical products and substances in the soil, rivers, oceans, air thus threatening to destroy the living web on which our lives depend.
Socially just, founded on the conviction that culture and human dignity are precious resources that, like our natural resources, require responsible stewardship to avoid their depletion. We must create a vibrant economic system that ensures all people have access to a decent standard of living and full opportunities for personal and social development. The indigenous ways of life, culture preservation and transfer, knowledge dissemination, land, water and resource use, food production, settlement maintenance, etc are a rich source to explore and respect.
Locally rooted, based on the belief that an authentic connection to place is the essential pre-condition to sustainability and justice. The Green Economy is a global aggregate of individual communities meeting the needs of its citizens through the responsible, local production and exchange of goods and services.

5
The Green Economy is the tool to strong sustainability. South Africa has a proud history of championing the sustainability agenda. We hosted the Johannesburg Summit on Sustainable Development in 2002 and have mainstreamed sustainability in all national planning. Our current understanding of the concept is best presented in the National Strategy on Sustainable Development and Action Plan (NSSD) 2011-2014, where the goods and services provided by healthy ecosystems create the basis for socio-political and economic interactions, all grounded in good governance.
Figure 1: Sustainability Paradigm Sources: National Framework on Sustainable Development 2008; National Strategy on Sustainable Development and Action Plan (NSSD) 2011-2014
Figure 2: Translating development challenges into green development opportunities Source: Programmes in Support of Transitioning South Africa to a Green Economy, DBSA 24, 2011

6
Figure 3: Pathway to a green economy
Source: Programmes in Support of Transitioning South Africa to a Green Economy, DBSA 24, 2011
Figure 4: Phases of the Green Economy Programme Development Source: Programmes in Support of Transitioning South Africa to a Green Economy, DBSA 24, 2011

7
Figure 5: Summary of Green Economy Programmes and Enabling Platforms Source: Programmes in Support of Transitioning South Africa to a Green Economy, DBSA 24, 2011 Limpopo Province has the potential to be the national pioneer in the Green Economy. The advantages of the province are:
Perfect geographic situation to develop various green industries and economies of scale;
Invaluable mineral resource base for local beneficiation;
Unexploited biodiversity resources for green tourism and payment for ecosystem services;
Vibrant young population to enthusiastically engage in new, innovative and developmental economic activities.

8
The goals of the Limpopo Green Economy plan are:
Short Term: Generate Jobs Improve Environmental Quality
Medium Term: Create Enabling Conditions for Green Growth Change Behavioral and Production Patterns
Long-Term: Build a New Economic/Environmental Paradigm for Limpopo
The above will be implemented through specified initiatives in the following key focus areas: 1. Sustainable Production and Consumption 2. Water Management 3. Sustainable Waste Management Practices 4. Clean Energy and Energy Efficiency 5. Resource Conservation and Management 6. Agriculture, Food Production and Forestry 7. Green buildings and the built environment 8. Sustainable Transport and Infrastructure 9. Green Municipalities 10. Cross-cutting
The envisaged hierarchy of interventions is as follows: 1.Immediate policy decisions and enforcement can start Green Economy practices today on:
local, sustainable consumption and production,
green procurement,
green buildings,
sustainable transport,
energy efficiency,
water efficiency,
waste minimization.
2.Short to Medium Term Legislation and Policy Review and Coordination
To create enabling setting for a Green Economy the provincial government must communicate clear policy messages to the general community, industry and business and all public servants.
Municipal by-laws and all provincial policies and legislation must be reassessed to support the Green Economy model.
Coordination of all Green Activities and their inclusion in performance management is a mandatory condition for success.
3.Low capital investment and long term sustainability projects with huge potential for job creation:
Management of Alien Plants with further product development
Recycling with added production of biogass, paper, plastic. These can be located in practically all local municipalities, because the resource base is existing and unlimited, and no complex technical skills are needed. Just these two projects, multiplied by at least two teams in every local municipality have the potential to create no less than 1 000 long term sustainable green jobs. 4.Long Term Industrial Developments Energy security is a major component in the implementation of the LEGDP. Limpopo has the potential to develop several tier renewable energy complex, some components of which are:

9
Production of electricity through Concentrated Solar Plants (CSP) The province has favorable solar radiation and abundant land to build concentrated solar plants with generation capacity of not less than 100 MW, its geographic situation will allow transmission and sale to Zimbabwe, Botswana, Mpumalanga, Gauteng. Potential for further increase of generating capacity with the advance of technology is unlimited.
Production of electricity off the grid by small (5 MW) solar power plants There are dwellings where Eskom’s grid would not reach as it is not economically viable, which justifies such an investment and ensures delivery of services.
Production of components for solar panels Silicon reserves and the second biggest silicon smelter in the world are in Limpopo and in Polokwane. Industrial enterprises to beneficiate the resource by creating local employment and development of the human resource of the province must be created.
Production of solar chargers for cell phones, small scale electrical devises can be initiated and franchise further developed.
5.Long Term Human Resource Development The disturbing tendency of outmigration from the province of university graduates and matriculates due to lack of job opportunities can be turned around through the Green Economy initiatives. The major awareness campaigns around reasonable consumption, energy efficiency, water use, waste management, green buildings must be conducted by the youth of the province. As they are those who would experience the grave consequences of the current barbaric use of resources, appreciating the need of change in behavior can provide young people with meaningful engagement through political, church, neighborhoods, schools, universities, etc. networks. Introduction of technical subjects to the curricula of tertiary institutions and creation of specific FET colleagues in the province must take priority.

10
Chapter 2
Which Colour is the Economy of Limpopo* This chapter provides an overview of the economic performance of the province from 1996 to 2011.
1. Real Economic Growth Rate for 2011
Statssa GDP 2011
Due to the economic recession faced by many countries in 2009, South Africa and its provinces has weathered the storm and going through steady growth. However, the global concern on climate change remains a threat to our future. The growth rates were boasted by the hosting of the 2010 FIFA world cup. Most provinces (including Limpopo) were able to maintain the steady growth rates in 2011. Limpopo’s economic growth rate in 2011 was attributable to a contribution of mining at 29.4 percent, government services at 16 percent and finance, real estate and business services at 14 percent. The growth rate was however dampened by declining contributions of 2.5 percent in agriculture, forestry and fishing, 2.5 percent in manufacturing and 2.5 percent in construction.
2. Average Real Economic Growth Rate
Statssa GDP 2011
*This chapter is developed by Mr M Mapatha, Manager Economic Research, LEDET
0.0
0.5
1.0
1.5
2.0
2.5
3.0
3.5
4.0
4.5
WC EC NC FS KZN NW GP MP LP SA
Province 3.6 3.4 2.2 2.5 3.6 2.7 4.0 2.5 2.2 3.5
Pe
rce
nta
ge
Real Economic Growth Rate - 2011
0.00.51.01.52.02.53.03.54.0
WC EC NC FC KZN NW GP MP LP
Province 3.4 2.9 2.1 2.3 3.4 2.3 3.7 2.9 3.2
SA 3.3 3.3 3.3 3.3 3.3 3.3 3.3 3.3 3.3
Pe
rce
nta
ge
Average Annual Economic Growth Rate 1996-2011
11
The average annual real economic growth rate for Limpopo between 1996 and 2011 is 3.2 percent, ranked number four amongst the nine provinces. The province with the highest average annual growth rate is Gauteng at 3.7 percent, Western Cape and Kwa Zulu Natal both at 3.4 percent. The provinces that achieved the least average annual growth rate are North West, Free State and Northern Cape at 2.3, 2.3 and 2.1 percentages respectively.
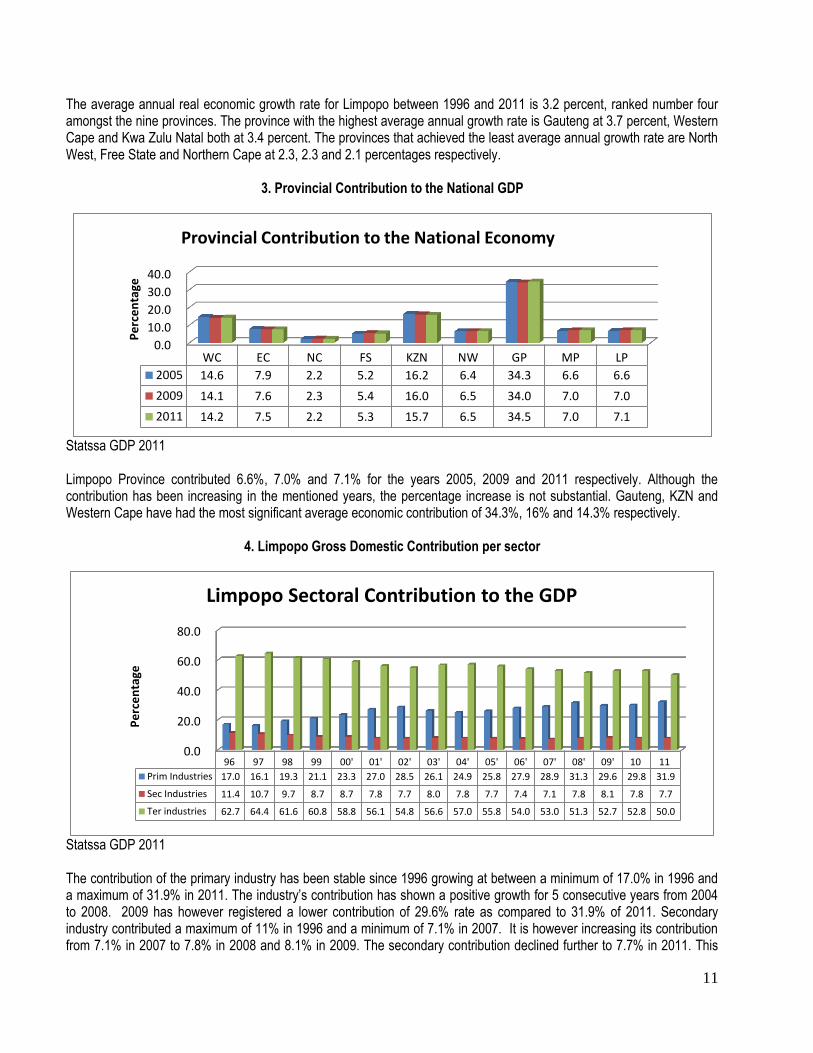
3. Provincial Contribution to the National GDP
Statssa GDP 2011 Limpopo Province contributed 6.6%, 7.0% and 7.1% for the years 2005, 2009 and 2011 respectively. Although the contribution has been increasing in the mentioned years, the percentage increase is not substantial. Gauteng, KZN and Western Cape have had the most significant average economic contribution of 34.3%, 16% and 14.3% respectively.
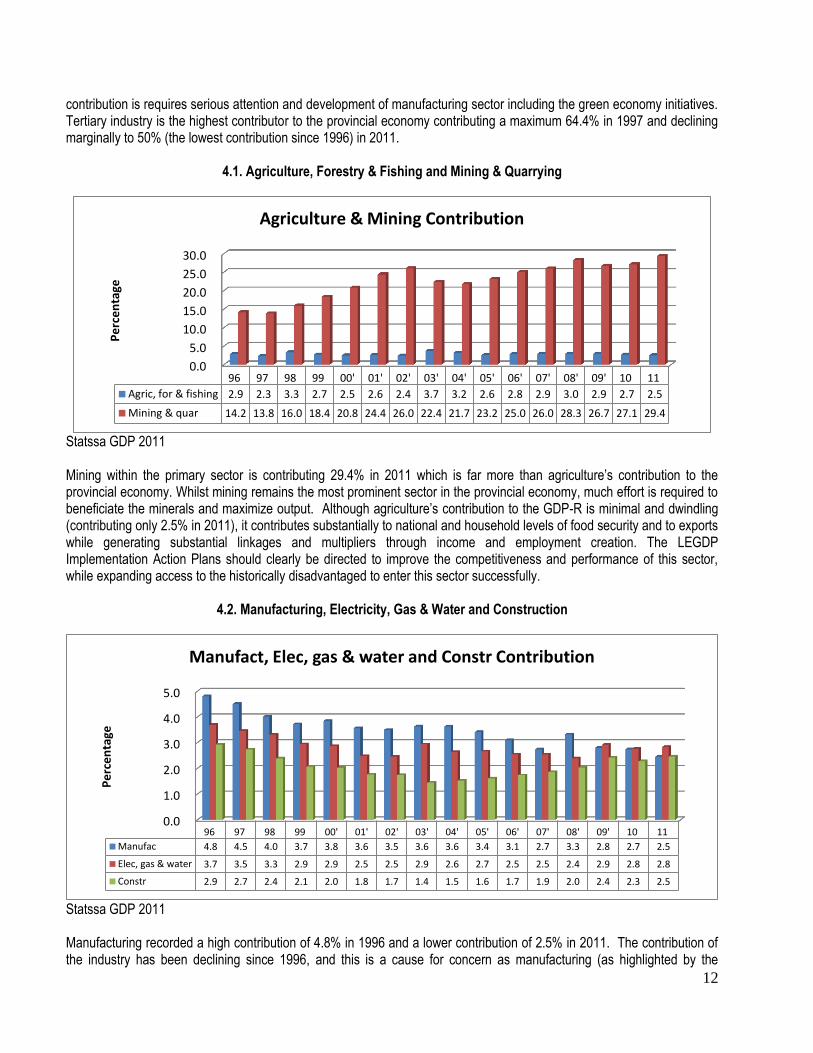
4. Limpopo Gross Domestic Contribution per sector
Statssa GDP 2011 The contribution of the primary industry has been stable since 1996 growing at between a minimum of 17.0% in 1996 and a maximum of 31.9% in 2011. The industry’s contribution has shown a positive growth for 5 consecutive years from 2004 to 2008. 2009 has however registered a lower contribution of 29.6% rate as compared to 31.9% of 2011. Secondary industry contributed a maximum of 11% in 1996 and a minimum of 7.1% in 2007. It is however increasing its contribution from 7.1% in 2007 to 7.8% in 2008 and 8.1% in 2009. The secondary contribution declined further to 7.7% in 2011. This
0.0
10.0
20.0
30.0
40.0
WC EC NC FS KZN NW GP MP LP
2005 14.6 7.9 2.2 5.2 16.2 6.4 34.3 6.6 6.6
2009 14.1 7.6 2.3 5.4 16.0 6.5 34.0 7.0 7.0
2011 14.2 7.5 2.2 5.3 15.7 6.5 34.5 7.0 7.1
Pe
rce
nta
ge
Provincial Contribution to the National Economy
0.0
20.0
40.0
60.0
80.0
96 97 98 99 00' 01' 02' 03' 04' 05' 06' 07' 08' 09' 10 11
Prim Industries 17.0 16.1 19.3 21.1 23.3 27.0 28.5 26.1 24.9 25.8 27.9 28.9 31.3 29.6 29.8 31.9
Sec Industries 11.4 10.7 9.7 8.7 8.7 7.8 7.7 8.0 7.8 7.7 7.4 7.1 7.8 8.1 7.8 7.7
Ter industries 62.7 64.4 61.6 60.8 58.8 56.1 54.8 56.6 57.0 55.8 54.0 53.0 51.3 52.7 52.8 50.0
Pe
rce
nta
ge
Limpopo Sectoral Contribution to the GDP
12
contribution is requires serious attention and development of manufacturing sector including the green economy initiatives. Tertiary industry is the highest contributor to the provincial economy contributing a maximum 64.4% in 1997 and declining marginally to 50% (the lowest contribution since 1996) in 2011.
4.1. Agriculture, Forestry & Fishing and Mining & Quarrying
Statssa GDP 2011 Mining within the primary sector is contributing 29.4% in 2011 which is far more than agriculture’s contribution to the provincial economy. Whilst mining remains the most prominent sector in the provincial economy, much effort is required to beneficiate the minerals and maximize output. Although agriculture’s contribution to the GDP-R is minimal and dwindling (contributing only 2.5% in 2011), it contributes substantially to national and household levels of food security and to exports while generating substantial linkages and multipliers through income and employment creation. The LEGDP Implementation Action Plans should clearly be directed to improve the competitiveness and performance of this sector, while expanding access to the historically disadvantaged to enter this sector successfully.
4.2. Manufacturing, Electricity, Gas & Water and Construction
Statssa GDP 2011 Manufacturing recorded a high contribution of 4.8% in 1996 and a lower contribution of 2.5% in 2011. The contribution of the industry has been declining since 1996, and this is a cause for concern as manufacturing (as highlighted by the
0.0
5.0
10.0
15.0
20.0
25.0
30.0
96 97 98 99 00' 01' 02' 03' 04' 05' 06' 07' 08' 09' 10 11
Agric, for & fishing 2.9 2.3 3.3 2.7 2.5 2.6 2.4 3.7 3.2 2.6 2.8 2.9 3.0 2.9 2.7 2.5
Mining & quar 14.2 13.8 16.0 18.4 20.8 24.4 26.0 22.4 21.7 23.2 25.0 26.0 28.3 26.7 27.1 29.4
Pe
rce
nta
ge
Agriculture & Mining Contribution
0.0
1.0
2.0
3.0
4.0
5.0
96 97 98 99 00' 01' 02' 03' 04' 05' 06' 07' 08' 09' 10 11
Manufac 4.8 4.5 4.0 3.7 3.8 3.6 3.5 3.6 3.6 3.4 3.1 2.7 3.3 2.8 2.7 2.5
Elec, gas & water 3.7 3.5 3.3 2.9 2.9 2.5 2.5 2.9 2.6 2.7 2.5 2.5 2.4 2.9 2.8 2.8
Constr 2.9 2.7 2.4 2.1 2.0 1.8 1.7 1.4 1.5 1.6 1.7 1.9 2.0 2.4 2.3 2.5
Pe
rce
nta
ge
Manufact, Elec, gas & water and Constr Contribution

13
LEGDP) is a strategic industry to grow the economy and to create jobs. This sector is currently receiving national attention through the Industrial Policy Action Plan and the recently launched new growth path. The Electricity, gas and water industry made the highest contribution of 3.7% in 1996 and the lowest 2.3% in 2008, the contribution has picked up again since 2008 to 2011. The green economy is particularly expected to play a key role in this sector due to climate change and increased demand for energy in the province. The construction industry contributed 2.5% to the provincial economy; this sector’s contribution is the least significant contributor within the secondary industry since 1996.
4.3. Wholesale, Retail, Motor trade, Catering & Accommodation and Transport, Storage & Communication
Statssa GDP 2011 The contribution of wholesale, retail, catering and accommodation industry has been declining since 1996 however it remains an important sector to the provincial economy. The sector has contributed 10.8% compared to 5.4% contribution made by transport, storage and communication sector. The transport, storage and communication sector is expected to increase in the future due to government plans to roll-out ICT programmes and other logistics initiatives linked to the SEZ and SIP programmes.
4.4. Finance, Real Estate & business services, Personal Services and General Government services
Statssa GDP 2011
0.0
2.0
4.0
6.0
8.0
10.0
12.0
14.0
16.0
96 97 98 99 00' 01' 02' 03' 04' 05' 06' 07' 08' 09' 10 11
Wholesale, retail and motor trade; catering andaccommodation
14.2 13.4 12.4 12.3 12.7 12.2 11.2 11.4 11.7 11.1 10.6 10.2 10.5 10.1 10.7 10.8
Transport, storage and communication 7.0 7.0 6.8 7.1 7.7 7.3 7.5 7.8 8.5 8.4 7.5 6.9 6.7 6.6 6.3 5.4
Pe
rce
nta
ge
Wholesale & trade and Trans & communication Contribution
0.0
5.0
10.0
15.0
20.0
25.0
96 97 98 99 00' 01' 02' 03' 04' 05' 06' 07' 08' 09' 10 11
Finance, real estate … 17.4 17.3 16.4 15.9 14.4 14.4 14.2 15.1 14.4 14.9 15.2 15.2 14.5 14.8 14.1 14.0
Personal services 5.0 4.9 4.7 4.7 4.8 4.5 4.5 4.7 4.7 4.7 4.4 4.4 4.1 4.4 4.0 3.8
General government 19.1 21.8 21.3 20.8 19.2 17.7 17.3 17.5 17.7 16.6 16.3 16.3 15.6 16.8 17.6 16.0
Pe
rce
nta
ge
Finance, Personal and Gov services
14
General Government Services is one of the biggest contributor within the tertiary sector and to the provincial economy. The sector contributed 16% in 2011 as compared to financial and personal services which contributed 14% and 3.8% respectively. The situation whereby government services one of the biggest contributor to the provincial economy is not healthy nor sustainable because an economy underpinned by a strong consumption and credit extensions is not desirable as compared to an economy underpinned by a strong production.
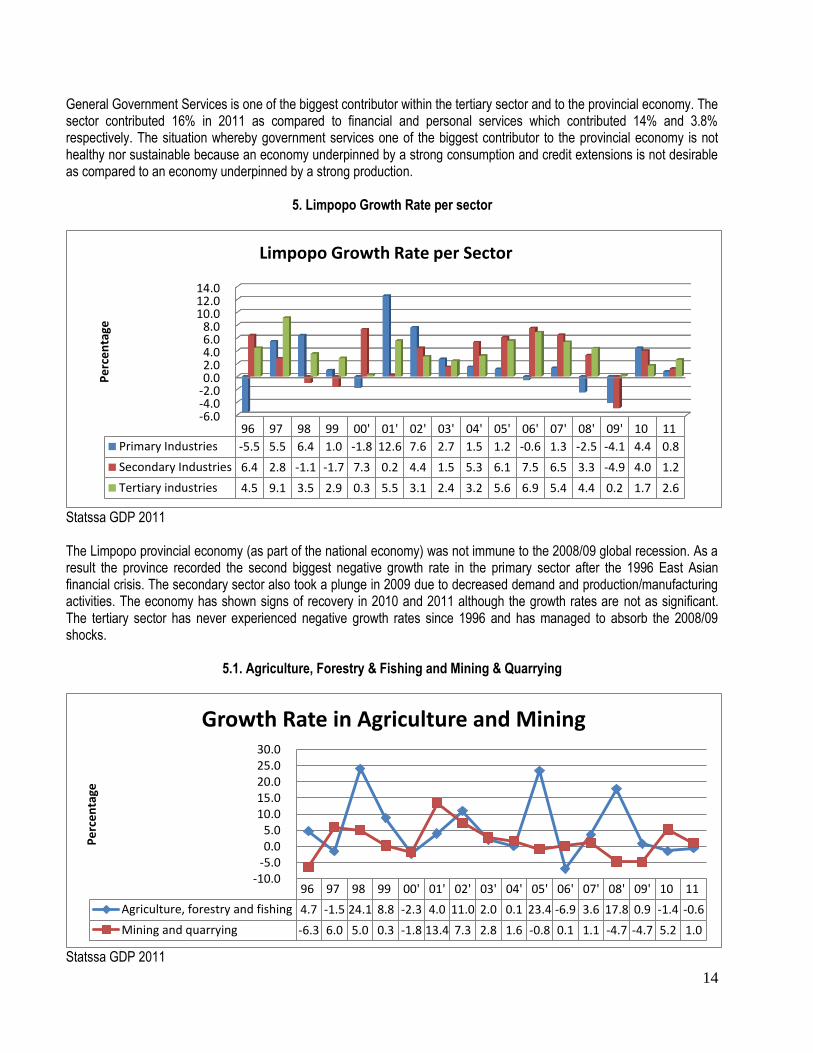
5. Limpopo Growth Rate per sector
Statssa GDP 2011 The Limpopo provincial economy (as part of the national economy) was not immune to the 2008/09 global recession. As a result the province recorded the second biggest negative growth rate in the primary sector after the 1996 East Asian financial crisis. The secondary sector also took a plunge in 2009 due to decreased demand and production/manufacturing activities. The economy has shown signs of recovery in 2010 and 2011 although the growth rates are not as significant. The tertiary sector has never experienced negative growth rates since 1996 and has managed to absorb the 2008/09 shocks.
5.1. Agriculture, Forestry & Fishing and Mining & Quarrying
Statssa GDP 2011
-6.0-4.0-2.00.02.04.06.08.0
10.012.014.0
96 97 98 99 00' 01' 02' 03' 04' 05' 06' 07' 08' 09' 10 11
Primary Industries -5.5 5.5 6.4 1.0 -1.8 12.6 7.6 2.7 1.5 1.2 -0.6 1.3 -2.5 -4.1 4.4 0.8
Secondary Industries 6.4 2.8 -1.1 -1.7 7.3 0.2 4.4 1.5 5.3 6.1 7.5 6.5 3.3 -4.9 4.0 1.2
Tertiary industries 4.5 9.1 3.5 2.9 0.3 5.5 3.1 2.4 3.2 5.6 6.9 5.4 4.4 0.2 1.7 2.6
Pe
rce
nta
ge
Limpopo Growth Rate per Sector
96 97 98 99 00' 01' 02' 03' 04' 05' 06' 07' 08' 09' 10 11
Agriculture, forestry and fishing 4.7 -1.5 24.1 8.8 -2.3 4.0 11.0 2.0 0.1 23.4 -6.9 3.6 17.8 0.9 -1.4 -0.6
Mining and quarrying -6.3 6.0 5.0 0.3 -1.8 13.4 7.3 2.8 1.6 -0.8 0.1 1.1 -4.7 -4.7 5.2 1.0
-10.0-5.00.05.0
10.015.020.025.030.0
Pe
rce
nta
ge
Growth Rate in Agriculture and Mining

15
The growth in the agriculture sector has demonstrated high volatility, peaking at 24.1% in 1998 and dropping to a low negative 6.9% in 2006. The sector further experienced negative growth rates in 2010 and 2011 with 1.4% and 0.6% respectively. This is a concern for the province as agriculture in the one of the strategic pillars and the biggest employer in the provincial economy. Mining is one of the highly sensitive sectors and integrated to the global economy. The mining growth rates has declined for two consecutive years i.e. in 2008 and 2009, both at negative 4.7%. The sector has demonstrated positive signs of recovery in 2010 and 2011 with 5.2% and 1.0% respectively. Although the percentage contribution for this industry to the provincial economy is the highest (at 29.4% in 2011), deliberate strategic interventions are required to transform or industrialise it through value addition.
5.2. Manufacturing, Electricity, Gas & Water and Construction
Statssa GDP 2011 The importance of Manufacturing in the economy cannot be overemphasized; worldwide research has demonstrated that manufacturing has the capability to create more labour absorbing activities. The province’s manufacturing sector has not been doing well since 1996 and requires some serious attention. Although the sector has experienced a good growth rate of 6.0% in 2010 its contribution to the provincial economy remains inadequate to address the provincial economic challenges. Electricity, gas and water remains one of the most important sector as an enabler to the growth of the economy. The sector’s growth rate peaked in 2003 at 17.3% and was hardest hit in 2009 during the global recession at negative 4.5%. Construction industry has shown significant growth rates since the announcement and preparation of hosting the FIFA 2010 World Cup peaking at 13.4% in 2006 and maintaining the healthy growth rates until 2009 despite the global financial crises.
96 97 98 99 00' 01' 02' 03' 04' 05' 06' 07' 08' 09' 10 11
Manufacturing 1.5 2.7 -0.8 1.4 6.1 3.4 1.6 -1.5 5.0 4.3 6.9 6.3 3.3 -10.9 6.0 1.7
Electricity, gas and water 14.0 5.0 1.7 -3.0 5.8 -4.4 3.8 17.3 6.5 5.3 4.7 2.9 -2.4 -4.5 4.0 0.9
Construction 7.1 0.1 -5.4 -6.0 12.5 -0.1 11.4 -12.7 4.1 11.7 13.4 12.2 11.4 4.9 0.9 0.8
-15.0
-10.0
-5.0
0.0
5.0
10.0
15.0
20.0
Pe
rce
nta
ge
Growth Rate in Manufact, Elec, gas & water and Construct
16
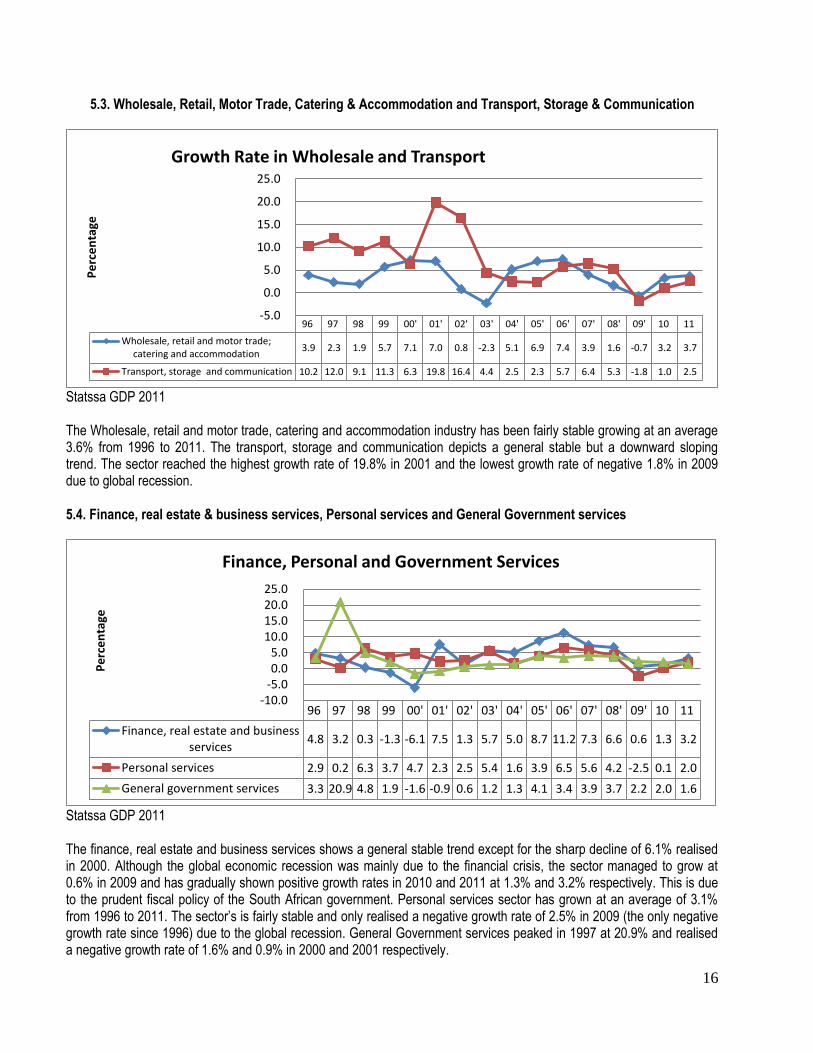
5.3. Wholesale, Retail, Motor Trade, Catering & Accommodation and Transport, Storage & Communication
Statssa GDP 2011 The Wholesale, retail and motor trade, catering and accommodation industry has been fairly stable growing at an average 3.6% from 1996 to 2011. The transport, storage and communication depicts a general stable but a downward sloping trend. The sector reached the highest growth rate of 19.8% in 2001 and the lowest growth rate of negative 1.8% in 2009 due to global recession. 5.4. Finance, real estate & business services, Personal services and General Government services
Statssa GDP 2011 The finance, real estate and business services shows a general stable trend except for the sharp decline of 6.1% realised in 2000. Although the global economic recession was mainly due to the financial crisis, the sector managed to grow at 0.6% in 2009 and has gradually shown positive growth rates in 2010 and 2011 at 1.3% and 3.2% respectively. This is due to the prudent fiscal policy of the South African government. Personal services sector has grown at an average of 3.1% from 1996 to 2011. The sector’s is fairly stable and only realised a negative growth rate of 2.5% in 2009 (the only negative growth rate since 1996) due to the global recession. General Government services peaked in 1997 at 20.9% and realised a negative growth rate of 1.6% and 0.9% in 2000 and 2001 respectively.
96 97 98 99 00' 01' 02' 03' 04' 05' 06' 07' 08' 09' 10 11
Wholesale, retail and motor trade;catering and accommodation
3.9 2.3 1.9 5.7 7.1 7.0 0.8 -2.3 5.1 6.9 7.4 3.9 1.6 -0.7 3.2 3.7
Transport, storage and communication 10.2 12.0 9.1 11.3 6.3 19.8 16.4 4.4 2.5 2.3 5.7 6.4 5.3 -1.8 1.0 2.5
-5.0
0.0
5.0
10.0
15.0
20.0
25.0
Pe
rce
nta
ge
Growth Rate in Wholesale and Transport
96 97 98 99 00' 01' 02' 03' 04' 05' 06' 07' 08' 09' 10 11
Finance, real estate and businessservices
4.8 3.2 0.3 -1.3 -6.1 7.5 1.3 5.7 5.0 8.7 11.2 7.3 6.6 0.6 1.3 3.2
Personal services 2.9 0.2 6.3 3.7 4.7 2.3 2.5 5.4 1.6 3.9 6.5 5.6 4.2 -2.5 0.1 2.0
General government services 3.3 20.9 4.8 1.9 -1.6 -0.9 0.6 1.2 1.3 4.1 3.4 3.9 3.7 2.2 2.0 1.6
-10.0-5.00.05.0
10.015.020.025.0
Pe
rce
nta
ge
Finance, Personal and Government Services

17
Chapter 3
Key Focus Areas of the Limpopo Green Economy Plan: National Perspective and Provincial Priorities
This chapter traces the development of the green economy thinking in South Africa. It is based on the document derived from the national Green Economy Summit in 2010 and the results of the processes which took place since: the preparation and hosting the conference of the parties of the United Nations Framework Convention on Climate Change (COP17 of UNFCCC) in Durban, 2011 and the Rio+20 Sustainability Summit in Brazil, 2012. It also highlights some of the specific circumstances in Limpopo in all key focus areas.
Figure 6: South Africa Policy Drivers behind a Green Economy Source: LEDET Strategic Planning January 2013, Trotter, SCIR

18
1. Sustainable Production and Consumption
National Considerations Although South Africa has progressed well in encouraging and promoting sustainable consumption and production (SCP) there are a number of challenges that need to be addressed. In many instances the challenges presented below present opportunities for strengthening SCP efforts in the country:
Gaps in environmental data remain, which greatly hamper efforts to make better policy decisions. There is also a general need to improve the availability of quantified data on the environmental, economic and social costs and benefits of implementing cleaner production practices.
The low cost of resources such as water and electricity has in the past contributed to patterns of production and consumption that are wasteful and inefficient. This situation has been exacerbated by the generation and treat-ment of waste which are costly from a financial and health perspective.
South Africa is faced with low rates of academic achievement in mathematics and science and a severe shortage of entrepreneurial and technology transfer skills and mechanisms.
The skills shortage has been compounded by weak cohesion in research programmes, shortage of market-focused research and a relatively low tendency among academics to commercialize research.
The SCP initiatives remain fragmented. Insufficient co-ordination in government departments regarding the triple bottom line for sustainable development means that there is a lack holistic approach to the entire production and consumption cycles.
Inadequate enforcement of legislation and implementation of policy is a key constraint to promoting SCP in South Africa.
Limited funding through government revenue structures as well as a lack of appropriate incentives such as eco-nomic instruments has constrained the implementation of SCP related projects.
Inadequate education about energy efficiency and waste minimization and recycling, to name just two key SCP objectives, has resulted in high rates of consumption by consumers.
The lack of incentives and penalties has meant that unsustainable patterns of consumption have been encour-aged.
Policy and Governance Requirements There is need for macro-economic analysis, research, global and national support which will translate to meeting demands of consumers in terms of improving efficiency while at the same time making business sense. Cleaner production need to be driven from national economic strategy. What must be done now?
Build awareness on the benefits of SCP
Encourage more players to adopt SCP practices in order to develop a competitive market and create job opportunities;
Provide a clear, credible and independent guide to consumers;
Embark on education campaigns that would encourage consumers to purchase products with lower environmen-tal impacts;
Embark on campaigns that would assist behavioural change as part of implementation of various technologies to work successfully;
Enhance local content in government procurement.
Limpopo Priorities
Align the sustainability plans of all industrial sectors in Limpopo with the National Sustainable Development
Strategy and Action Plan
Establish Limpopo as Green Tourism Destination Nationally and Internationally
Green Limpopo Tertiary Sector

19
2. Water Management National Considerations Threats, Challenges and Opportunities for Action Currently there are about 19 water resource management areas in S.A. and a quarter (five) of the total 19 water manage-ment areas experience water shortages (present scenario). A further quarter has water surpluses and remainder are in balance. Shortages will become more prevalent if proper attention is not given to providing more water (scenario 2025).
Figure 7: Current State and Projections for Water Availability at Main SA Catchments Source: South Africa Second National Communication to the UNFCCC, 2011
Although there are some inherent benefits in relation to transboundary management of water resources, the accompanying challenges to realise the full potential of benefit-sharing at transboundary level cannot be ignored. The following are among the crucial ones synonymous within the South African context.
Disproportionate distribution of water resources:
The agricultural sector consumes 62% of the total water resource. It is concerning to note that this sector is not yielding benefits in proportion with consumption patterns;
In the domestic arena (27%) the urban area far outweighs the proportion which the rural areas consume the resource with 23% and 4% respectively.
Inter-basin water transfers are expensive - cost recovery of water services serve as a barrier to access to safe water by poor people;
Ageing water infrastructure and limited access – costly to maintain infrastructure;
Some economic activities are impacting negatively on water quality and the environment (acid mine drainage) – due to resource constraints and lack of capacity, it is often difficult to monitor and assess the quality of water with more emphasis placed on water quantity instead;
Unlawful use of water – in certain areas people make illegal connections while others, use water intended for domestic use for agricultural purposes;
Demand outweighs supply – demand of water usage has over the years increased in all sectors, making it difficult to provide good quality water to consumers;
20
Human settlements – with increased urbanisation and movement of people to areas close to work opportunities, a number of settlements have surfaced as result. Often these settlements have no adequate reticulation systems or are sometimes of poor quality making it easy for groundwater to be polluted resulting in, groundwater not being a viable option;
Abundance of ocean water – some areas are experiencing drought despite an abundance of ocean water;
Insufficient data, data limitations and poor information about the cultural, social, and political norms of the existing population often hinder development of an effective planning strategy;
Disparities in intellectual capital and technological innovation which are essential for sustainable management.
The physical nature of a river basin can confound efforts to manage the basin's resources; because basins are irregular and receive water flows from multiple sources, difficulties are often encountered when attempting to divide a basin into discrete, manageable subunits;
Further, the stochastic nature of rainfall forecasting makes prediction and control of the water problematic;
Limited potential for further resource development in most areas. The following are potential areas where action could be taken:
Use national development goals or water-related challenges as a starting point;
Secure commitment at the highest level, but ensure a broad base of support which reaches down to the grass-roots;
Involve high-level officials in water-related sectors from the outset and assign the task of developing a strategy to a multi-sectoral steering group;
Stakeholders awareness of the scarcity of water can lead to meaningful involvement in the different process;
Create adequate knowledge base to make informed decisions;
Acknowledgement that water is an integrator of all sectors when it comes to sustainable development;
Ensure a realistic plan of implementation that includes a clear definition of roles and responsibilities, a sound financing strategy, provision for capacity-building and systems to monitor progress and make adjustments as needed;
Optimising the contribution of water for growth and development requires the consideration of complex links between activities that influence and are influenced by how water is developed and managed and how a more efficient use of the water as a limited resource can be secured;
Policy and Governance Requirements Water policy impacts economic development and in turn macro-economic policy impacts sustainable water use. Upstream land use decisions impact downstream water availability and water management decisions impact land degradation. Given the numerous and complex links between activities that influence and are influenced by how water is developed and managed, a more coherent and integrated approach makes good sense. Effective coordination among various government departments need to be promoted. This will in turn improve resource management and scientific understanding of the water cycle through cooperation in joint observation and research, and for this purpose encourage and promote knowledge-sharing and provide capacity building and the transfer of technology. What needs to be done now?
1. Mainstreaming water- it is critical that water is put at the forefront of planning, not an after-thought; 2. Strengthening sectoral co-operation; 3. Strengthen institutional and regulatory capacity; 4. Improve water management; 5. Addressing service backlogs- assess persistent backlogs and devise strategy for service delivery; 6. Changing water use behaviour - effect change in behaviour by regulation, self-regulate, use of market-based in-
struments and awareness and education.

21
Limpopo Priorities
Facilitate Water Security in Limpopo by creating awareness
Efficient use of water in mining
Alternative water storage
Improved Reticulation systems
Recycling of water from sewage farms
Reduce water in agricultural consumption
Water harvesting from fog and rain
STP biogas production
Catchment management
Reduced house hold consumption
Regulate swimming pools
Figure 8: State of River Ecosystems in Limpopo Source: Limpopo State of the Environment Report 2006
22
3.Sustainable Waste Management Practices National Considerations Threats, challenges, and opportunities for action
The business sector indicate that although there was appreciation for the enabling policy environment within the waste management discourse, there was rising concern about government’s ability to enforce adherence to the policies. Fur-thermore, according to business sector there was a tendency for government to be too interventionist through red tape and inflationary business costs for implementing green waste management. These interventions tended to digress from business’ drive to ensure that it does business in an efficient manner, while contributing to the agenda of green waste man-agement. Some businesses were doing more than others, and were not getting the recognition they deserved. Furthermore, the introduction of the waste management hierarchy presents the added challenge of managing the transition in business practice from the current waste management system while ensuring that waste management measures are environmen-tally sustainable. Waste management also presents an opportunity to address climate change. The recycling industry for example typically creates new products with a lower use of energy, and hence carbon emissions, than the use of virgin material. Therefore support to the recycling sector is typically a GHG mitigation action. The removal of organic materials from the waste stream for use as aerobic composting material will also reduce methane emissions due to anaerobic digestion and is typically a job creating process. Similarly, the use of waste as fuel in cement kilns or other waste-to-energy processes both displaces fossil fuels and also reduces landfill gas formation. The relevance of the waste management sector in the alleviation of poverty is unquestionable, but the contribution of this sector needs to be upscale in order to maximize the impact. Policy and governance requirements
The current legislative framework was permissive of greater impact with regard to the green waste management agenda, but could benefit from further engagements between the DEA and several stakeholders, especially business and local government. The Act, and its effective functioning, could be sufficiently encapsulated in the review of the strategy docu-ment. The biggest policy and regulatory challenge was ensuring that the green waste management agenda took into account the need for a capital and labour intensive approach thus ensuring job creation and associated poverty alleviation and community ownership of the agenda. What must be done now?
1. There is need for government to improve efficiency of the legislation by intervening for impact and less intervening
where the green waste management does actually work. Monitoring that business and other stakeholders are compliant with existing waste management legislation also means reinforcing good “green waste management” practice by introducing an incentive scheme, couple with penalties for poor green waste management.
2. There is further a need for government to allow, through administrative and funding support, foe the private sector
to innovate in green waste management thus inculcating ownership of the waste management hierarchy.
3. The extent of ownership and practice of the green waste management agenda by municipalities is cause for con-
cern and speaks to poor communication lines between national government and municipalities on this imperative. Through existing structures at SALGA, the DEA needed to ensure representation of the green waste management agenda thus accessing the complex and efficient network afforded by organised local government. This network would not only allow for effective messaging with municipalities, but would further provide a network for the sharing of positive lessons and models from elsewhere in the world and the country.
23
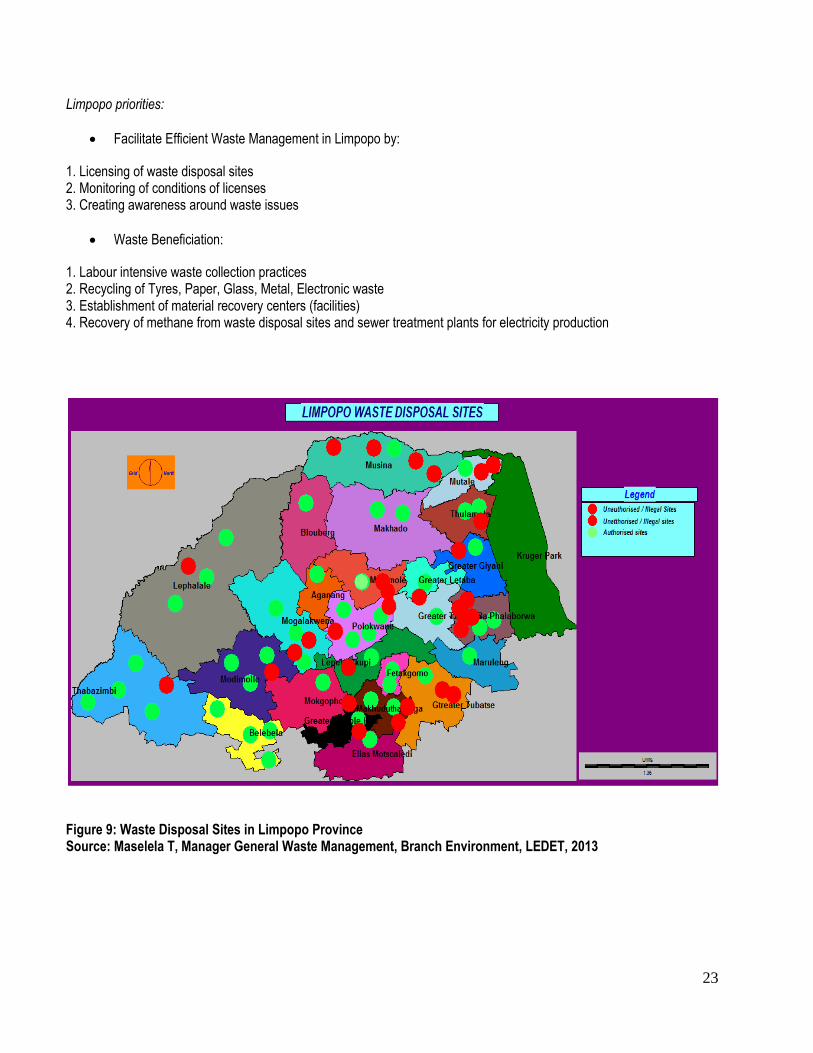
Limpopo priorities:
Facilitate Efficient Waste Management in Limpopo by:
1. Licensing of waste disposal sites 2. Monitoring of conditions of licenses 3. Creating awareness around waste issues
Waste Beneficiation:
1. Labour intensive waste collection practices 2. Recycling of Tyres, Paper, Glass, Metal, Electronic waste 3. Establishment of material recovery centers (facilities) 4. Recovery of methane from waste disposal sites and sewer treatment plants for electricity production
Figure 9: Waste Disposal Sites in Limpopo Province Source: Maselela T, Manager General Waste Management, Branch Environment, LEDET, 2013

24
4. Clean Energy and Energy Efficiency National Considerations Threats, challenges, and opportunities for action The fossil fuels dominate the energy sector, with coal providing 75% of the fossil fuel demand and accounting for more than 90% of electricity generation. In 2009, the energy sector contributed 80% of the country’s greenhouse gas emissions (DEA, 2009). Growing awareness of the threat of climate change, rising prices for fossil fuels, growing concerns over energy supply security and recent electricity price increases will be driving factors to increase an interest on making re-newable energy more and more competitive in South Africa. To couple with that, the National Energy Regulator of South Africa (NERSA) approved Renewable Energy Feed-In Tarrifs (REFIT) to stimulate the development of renewable energy sector. Evidence of climate change has become more com-pelling and the South African Cabinet has strengthened its commitment by approving a Long Medium Term Mitigation Scenarios which provides various scenarios for the deployment of clean and renewable energy technologies. Renewable Energy Technology can also be implemented in decentralized off-grid applications, which simply means that more jobs can be created in rural areas of South Africa to alleviate poverty and increase energy security of supply. Jobs in construction, fabrication (SWH), installing, operating, and maintaining renewable energy systems tend to be more local in nature and can thus benefit unemployed rural poor in South Africa. Based on the cabinet approved long-term mitigation scenarios (LTMS), the most stringent of which inter alia suggests that around 50 per cent of South Africa’s energy would have to come from renewable sources in 2050. Assuming this equates with a target of 15 per cent of electricity from renewables in 2020, 36,400 new direct jobs and 109,100 indirect jobs could be created. In addition, as many as 700,000 people could be employed in biofuels. If South Africa generates just 15% of total electricity use in 2020 using Renewable Energy Technology, it will create 36 400 new direct jobs, without taking any jobs away from coal-based electricity. Over 1.2 million direct and indirect jobs would be generated if a portion of South Africa’s total energy needs, including fuels, were sourced with Renewable Energy Technologies by 2020. Policy and Governance Requirements Clean energy alternative a cross-cutting issue among various sectors and need coordination. In addressing policy and gov-ernance issues the following should be emphasized:
• Strengthen LTMS and linkages to other policy mechanisms e.g. IRP2, IPAP; • Enforce energy efficiency & savings targets; • Incentivise switch to cleaner technology; • Behaviour change through fiscal interventions e.g. tax policy, measures; • Set aggressive long term targets to stimulate industrialisation, set-up of local manufacturing.
What can be done now? 1. Build awareness on the benefits of Clean Energy and Alternative technologies country wide; 2. Promote and encourage the development of renewable and environmentally sound electricity generation tech-
nologies; 3. Encourage more players to enter the generation industry in order to develop a competitive power market through
the IRP and Independent Systems Market Operator (ISMO); 4. Implement renewable energy target and specific plan for expanding our capacity in renewable energy; 5. Set ambitious targets for boosting electricity generation through alternative and clean energy;
What can be done in the medium to long term? A need to address skills shortages in the sector; Stimulate the development of new and renewable sources of energy through various mechanisms such as incentives, etc.; More support to Research and Development in the sector; Embark on campaigns that would assist behavioural change as part of implementation of various technologies to work successfully.

25
Figure 10: South African Green House Gas Emissions Source: Long Tern Mitigation Scenarios, 2010
Figure 11: Proposed Mitigation Measures to Bridge the Emissions Gap Source: Long Tern Mitigation Scenarios, 2010

26
Limpopo Priorities Energy security is a major component in the implementation of the LEGDP.
A. Limpopo has the potential to develop several tier renewable energy complex: 1. Production of electricity through Concentrated Solar Plants –
the province has favorable solar radiation and land to build plant(s) with generation capacity of not less than 100 MW; its geographic situation will allow transmission and sale to Zimbabwe, Botswana, Mpumalanga, Gauteng. Potential exists for further increase of generating capacity.
2. Production of electricity off the Grid by small (5 MW) solar power plants - There are dwellings where Eskom’s grid would not reach as it is not economically viable.
3. Production of components for solar panels - Silicon reserves and the second biggest silicone smelter in the world are in Limpopo and in Polokwane. Industrial enterprises to beneficiate the resource by creating local employment and development of the human resource of the province can be created.
4. Production of solar chargers for cell phones, small scale electrical devises can be initiated and franchise further developed.
5. Bio-gas generation at agricultural farms
B. Energy Efficiency 1. Issue regulations for use of electricity in all public buildings (provincial government, municipalities, schools,
hospitals, community centers) 2. Assess energy efficiency in all public buildings 3. Retrofit all public buildings accordingly 4. Use solar panels for all street lights (bulk procurement, local production, installation) 5. Create public awareness on energy efficiency together with Eskom and NGOs
C. Human resource development
1. Introduce energy efficiency modules in study curriculum 2. Limpopo FET college for renewable energy artisans
Thus, the actions in the implementation plan are as follows:
Facilitate awareness creation about energy security
Facilitate Energy efficiency in Limpopo by:
1.Monitoring consumption in government buildings 2. Off Grid power generation, where possible (provincial nature reserves) 3. Bio fuels / Bio gass production 4. Solar water heaters installations in new buildings 5. Solar panels production in Limpopo
Develop capacity for generation of electricity from renewable sources

27
Figure 12: Solar Radiation in Limpopo: January Source: GAP4, LEDET&CSIR, 2011

28
5. Resource Conservation and Management National Considerations Threats, challenges and Opportunities for action The human demand on natural ecosystems has had an adverse impact. It is thus critical that the human footprint on natural eco systems be reduced. These are key areas of challenges that could also be opportunities to introduce strategies that mitigate these adverse effects.
The current scenario on the preservation of the ecosystem comes with perverse incentives that are more harmful than what they are intended to achieve. There is an absence of standards to determine what is “conservation” friendly. For instance, increased price charged for “organic” products, the markets is not yet ready for biodiversity friendly products;
The Human Development Index illustrates that demand exceeds supply in the mining of minerals. The waste pro-duction in South Africa poses both a challenge and an opportunity for viable economic ventures;
Target setting remains a challenge, there are no clear targets outlined;
Science base to measure impact is not yet conclusive, Scientists and economists need to generate the baselines;
Defining incentives for resource efficiencies or resource gains. There needs to be a split from conservation gain to conservation control e.g. the issue on hunting in a protected area is an issue for further discussion in legislature;
Defensive cost – cost of non action, meaning that the cost structure for business is not well managed by the government;
Future economic gains from conservation need to be articulated clearly.
The value of biodiversity and ecosystem services is not adequately captured by current economic instruments, ecosystem service assessment need to be reviewed. A connected landscape where different elements are clustered together lead to rapid urbanization which puts pressure on basic facilities. As a result the resilience of landscape is decreased and this poses risks for floods, sand transport, storms, etc. The opportunity here is in mainstreaming and enhancing biodiversity friendly production landscapes that are well planned. The invasion of alien species poses a big threat to the ecosystem. Climate change implications are not accounted for in figures and the projected future could be more. More emphasis needs to be placed on prevention work. There needs to be comprehensive funding mechanism to cater for entire ecosystem functioning. Policy Governance Requirements South Africa as a developing country needs to generate its own perspective for a green economy paradigm. The country needs stable policies for the longer term (unaffected by changes in government) to make a green economy possible. The following are policy governance requirements.
Enhance regulatory systems for improved synergy between conservation and production industries.
Split commercial game output management from regulatory control.
Commercial wildlife ranching proposes a model that is separate from biodiversity and conservation.
Global competitiveness for biological products.
What can be done now? 1. Interdisciplinary knowledge generation on embedded systems; 2. Knowledge transfer into planning instruments that ensure landscape sustainability and maintenance; 3. A more engaged civil society; 4. The government should provide an empowering framework for conservation of the ecosystem and biodiversity; 5. Expedite the National Land Degradation Fund as a vehicle for enabling civil society support for green economy
restoration and conservation initiatives; 6. Expand funding partnerships between conservation and development funds for implementation demonstrations.
29
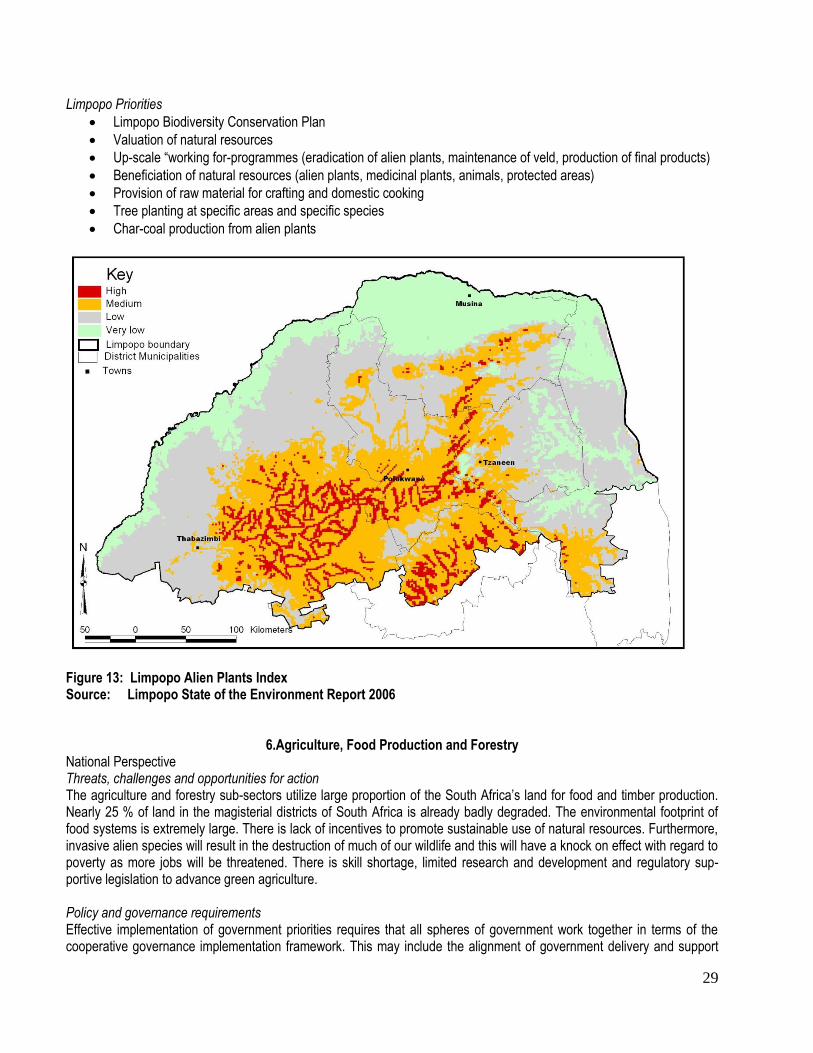
Limpopo Priorities
Limpopo Biodiversity Conservation Plan
Valuation of natural resources
Up-scale “working for-programmes (eradication of alien plants, maintenance of veld, production of final products)
Beneficiation of natural resources (alien plants, medicinal plants, animals, protected areas)
Provision of raw material for crafting and domestic cooking
Tree planting at specific areas and specific species
Char-coal production from alien plants
Figure 13: Limpopo Alien Plants Index Source: Limpopo State of the Environment Report 2006
6.Agriculture, Food Production and Forestry National Perspective Threats, challenges and opportunities for action The agriculture and forestry sub-sectors utilize large proportion of the South Africa’s land for food and timber production. Nearly 25 % of land in the magisterial districts of South Africa is already badly degraded. The environmental footprint of food systems is extremely large. There is lack of incentives to promote sustainable use of natural resources. Furthermore, invasive alien species will result in the destruction of much of our wildlife and this will have a knock on effect with regard to poverty as more jobs will be threatened. There is skill shortage, limited research and development and regulatory sup-portive legislation to advance green agriculture. Policy and governance requirements Effective implementation of government priorities requires that all spheres of government work together in terms of the cooperative governance implementation framework. This may include the alignment of government delivery and support
30
programmes to fast track agrarian reform and support War on Poverty campaign. Furthermore, there is a need to embark on a legislative review process to ensure relevance of existing legislation. What must be done now?
Communication from National to local level needs co-ordination and local government should participate in the inter-governmental technical committees. It is important to establish the roll out of the policies by local government. There needs to be a proper awareness raising strategy created and the extension services workers trained in awareness rising on the green economy. Initiate the incentive schemes for the initiatives contributing positively to the green economy
What must be done in medium to long term?
1. The legislation governing invasive species need to be reviewed as this has the potential to create more jobs. 2. There is a need to create a body to monitor the use of resources and enforcement of the law. 3. There is a need to increase research and development to support the green economy.
Limpopo priorities
Organic and local production in agriculture
Urban agriculture
Water efficiency
Appropriate crops
Feed lots regulation
Companion agriculture
Permaculture
Production of bio fuel resources
Seed bank
Food labeling
Food banks
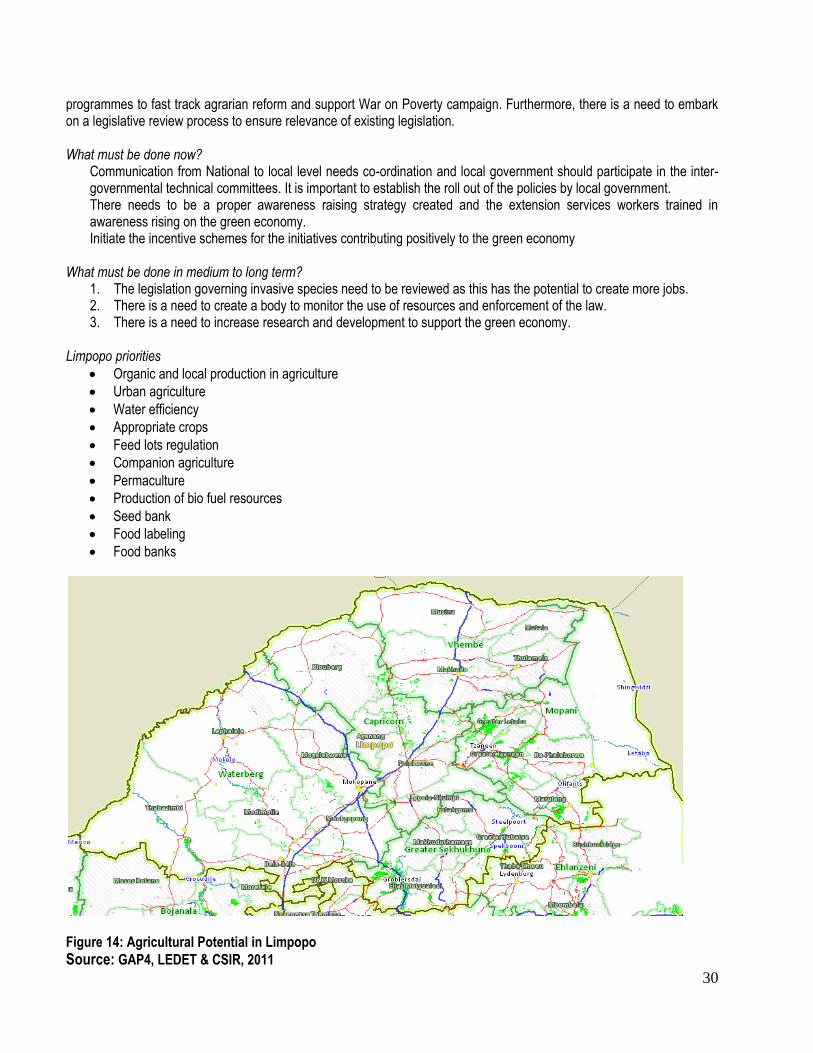
Figure 14: Agricultural Potential in Limpopo
Source: GAP4, LEDET & CSIR, 2011

31
7. Green buildings and the built environment National Considerations Threats, challenges, and opportunities for action The green buildings can have a dramatic impact on reducing energy consumption and production of greenhouse gases be-cause 30% of the world’s greenhouse gasses are produced by buildings; more than the transport sector. Furthermore, 40% of the world’s energy is consumed by buildings through direct consumption and via ‘embodied energy’ in products which consumed energy in the production and transport. Other than energy, buildings are estimated to use 15% of the world’s potable water supplies and produce 40% of the world’s waste. An opportunity that therefore exists proposes that green buildings can reduce consumption by 30 – 70% by addressing the issue of resource depletion, pollution of land, water and air, and addressing the current unsustainable pattern of de-velopment. According to the Green Building Council of South Africa a range of independent studies confirm that buildings certified by Green Building Councils can consume 85% less energy and 65% less potable water and send 69% less waste to landfill than non-certified buildings. So, if buildings consuming 40% of the world’s energy can cut that amount by 85%, it is clear that they can have a huge impact both on climate change, and (highly topical in South Africa) on reducing electricity demand. The building sector is regarded as the area where the most cost-effective, quickest and easily-attainable cuts in CO2 can be achieved. There is also the challenge of getting the property industry to buy into the concept of green building. This challenge seeks to tackle the more conservative views on building, by offering explanations and arguments for why the sector needs to adopt the green building approach. This requires investment in awareness-raising and lobbying. The perception that green building costs more than conventional building further complicates this issue; and experience has shown this to be a falla-cy. Green buildings reduce cost over the lifecycle and shows reduction in operational cost, compared to business as usual. Another benefit is that while much can be achieved without additional cost and using standard technologies, even more can be achieved with newer, often very basic, technologies that deal with energy-saving, water-saving, materials, etc., and this can have a stimulatory effect on the local economy. The sector has an opportunity to retrofit old buildings with green materials and technologies. This is a necessary evil because there are currently older “non-green” buildings than there are green buildings, and therefore a need to redress the damage caused by these buildings on the environment and its people. South Africa currently has to import most green materials and technologies but now has the opportunity to start producing its own through deliberate and earmarked government incentive scheme. It is however heartening to note that local manu-facturers and suppliers are beginning to respond to the call for green materials and technologies, but still require private and government funding to grow this response. There is also currently dire shortage of “green building” skills in South Af-rica necessitating that skilled and experienced professionals in this field be imported from other parts of the world. There is also a need for a more creative approach in making decisions on the alternative options available for green buildings overcoming preconceptions. The above threats and challenges however present a myriad of opportunities for the South African economy thus re-orien-tating our building sector and industry towards a low-carbon economy, with shared responsibility between the following stakeholders:
• Government departments with a stake in the green economy can demonstrate leadership in this area by proposing legislation that will compel the sector to behave appropriately within the green economy; • The private sector is hereby directly challenged to invest in the necessary production and acquisition of materials and technologies that support the green buildings agenda; • The private sector and government also have the joint responsibility to stimulate the local economy thus creating job opportunities for the people of South Africa within the building sector; • Local government has the responsibility to show leadership in this regard by developing new building specifications for its suppliers in line with green building standards.

32
Policy and governance requirements There was a need for an integrated sustainability strategy for the built environment which would be supported by policies and implementation mechanisms that ensure sustainability is integrated into planning, design, construction and manage-ment of the built environment. There was a need for the building councils to set minimum standards to support sustainabil-ity. This legislative and planning work however needed to be coupled with effective support and incentives to implement, and not rely on the will of building sector for implementation and interpretation. Effective policing would have to be coupled with enforceable penalties for non-compliance. Furthermore, there is a need to legislate minimum sustainability standards for existing and new buildings, using internationally recognized standards regarding energy, water, waste, daylight, ventilation, etc. These standards would be enforced for existing buildings through reporting, for example the issuing of Energy Performance Certificates on intervals. In new buildings, these would be enforced through stringent building regulations. What must be done now?
1. The state of some buildings in South African towns and cities presents an opportunity for the government and the private sector to launch a retro fitting programme that seeks to ensure that these older buildings are renovated in an environmentally suitable manner, while preserving the great historical value held by these buildings.
2. There is dire need to educate both the industry and consumers of the benefits of green building so as to create demand and investment into green buildings thus enthusing the sector regarding the commercial, economic and financial benefits of green building.
3. The Green Buildings Council in collaboration with other built environment councils needed to encourage building companies to approach for voluntary ratings so as to compile a reliable and up-to-date record of which companies were compliant with the green building movement.
4. Government needed to lead by example in the move towards green building by examining its current building specifications and the impact these had on climate change. Furthermore government needed to re-examine its list of preferred service providers ensuring that those building professionals who are willing to transform to green building are positively reinforced in this regard, while those resisting change are penalized or incentivized to change behaviour.
5. Investment to unlock local technology required for green buildings 6. Effective legislation enforcement requires trained, motivated building inspectorate in all municipalities.
Government needs to address understaffing at national, regional and local level and alignment of national provincial and local bylaws in support of Green buildings
What must be done in the medium to long term?
1. Government needs to lobby stakeholder opinion and develop the necessary legislation to compel behavioural change within the building sector towards green building.
2. There is further a need for the Green Building Council to set minimum green standards as part of building con-sensus on the delivery timeline for zero carbon homes. Furthermore, the Green Buildings Council needs to also set overall performance targets for the sector, ensuring that - with government - there is regulated policing on per-formance against these targets.
Limpopo Priorities:
Green all government buildings in Limpopo
Proper Town planning based on Green principles

33
8. Sustainable Transport and Infrastructure
National Considerations The transport industry has taken several steps to reduce CO2 emissions and other environmental impacts, notably those associated with fossil-fuel combustion. Combined with growing demands for mobility, many eco-innovation initiatives have focused on increasing the energy efficiency of vehicles and other forms of transportation, while at the same time improving safety. Threats, challenges, and opportunities for action The major challenges and opportunities in this area could be derived from the understanding of the problem statement re-garding the industry itself. In this regard, the issues of structural fragmentation related to land usage, infrastructure, regu-lations and operations are key drivers in understanding the obstacles and at the same time deduce strategies to tackle them. The bottom line however is that the implementation of a sustainable transportation programme has a much bigger potential for the sector in terms of contributing to the agenda for the green economy on the one hand and also create sustainable jobs on the other. The following were listed as areas that pose both the challenges and opportunities for the sector:
Whereas the taxi industry continues to show disgruntlement with new arrangements like the BRT, therein lies an opportunity to move operators from second to first economy (i.e. from taxi owners to bus owners/ operators);
New jobs created through bus operation like maintenance, fare collection, security can be quite sustainable moving into the future;
Testing next generation climate friendly buses including ethanol, CNG, and biodiesel buses in order to gain operational, environmental, and financial data on their impact;
The Expanded Public Works Programme has secured funding for infrastructure projects, specifically road projects and it is envisaged that some funding will be used to create green jobs within these projects;
Development of NMT infrastructure and green jobs around 2010 roads projects;
Promotion of regional and international collaborations through structures like SADC and AU engagements and protocols, International Civil Aviation Organization and International Maritime Organization, including the Inter-national agreements across all modes of transport;
Development of new policy direction around issues like climate response strategy for the transport sector, energy efficiency framework for the transport sector including cleaner fuel technologies & alternative fuels;
Putting more emphasis on the introduction of electric and hybrid vehicles to mitigate climate change;
Develop comprehensive rail policy and programmes aimed at addressing inefficiencies in the rail sector thus promoting it as viable option for transportation of both goods and passengers;
Conduct a complete review of Civil Aviation Policy to address emission reduction on the air space thus taking a lead in the global arena;
Compile an updated Green House Gas inventory;
Enhance the use of existing infrastructure like the natural gas pipelines, existing distribution channels of LPG, existing petrol/diesel stations for biodiesel/bioethanol blends, including charging EVs at home or shopping malls or airports;
Promotion of modal shifts, favouring transport modes with high transport and fuel efficiency, e.g. high-speed passenger trains or rail such as the Johannesburg to Durban high speed passenger train as well as shifting freight from road to rail.
Policy and governance requirements In order to promote faster development in this sphere, there is a need for a more user friendly policy and government inter-vention to enhance competition for new innovations, business ideas and strategies to manage the environmental impact on the transportation system. Some of the issues requiring the aforementioned intervention are:
Consideration of subsidising cost to convert a vehicle to an aftermarket alternative fuel system;
Consideration of exempting taxis and buses powered by alternative fuels from paying road tax;
Consideration of exempting import duties and encouraging the setting up of manufacturing facilities in South Africa for things like toolkit development, dispensers, cylinders, batteries, etc;
34
Highly accessible and flexible loans to start up refuelling stations and related industries;
Availability of land in industrial areas at below prevailing market prices;
Reducing the cost and time required to acquire licenses/ approvals;
Enforcement of higher emissions standards and getting polluting vehicles off the road;
Guide to financing and technology choices nationally;
Land use requirements for nodes;
Densification programme on BRT routes through urban design;
Package of investment portfolios for developers within the corridors;
Secondary policy interventions like. non-motorised interventions and greening.
What can be done now? 1. Continued investment and maintenance of transport infrastructure; 2. Foster and enhance Private and Public Partnerships; 3. Transport policies that take into consideration land use patterns and environment to promote sustainability; 4. Promote network design and network systems management as opposed to isolated routes or “corridors” 5. Monitor transport costs continuously and consistently.
What can be done in the medium and long term?
1. Develop transport policies that take into consideration land use patterns and environment to promote sustainability; 2. Localize manufacturing, innovation and promote export products and services; 3. Promote network design and network systems management as opposed to isolated routes or “corridors” ; 4. Update old transport infrastructure and systems design standards; 5. Introduce new transport infrastructure and systems design standards
Limpopo priorities:
Public transport
Road maintenance
Synchronize the traffic lights
No single trips in government
Urban design for energy efficiency (bicycle roads, no car zones)
Solar traffic lights
Solar street lights
Alternative energy vehicles
Regulations to reintroduce rail transport
Collection points (logistic hubs) for agricultural production
9 Green Municipalities National Considerations Threats, challenges and Opportunities for action As carbon intensive cities, developing in a manner well beyond our ecological footprint it will be a mammoth task to transform the current models and designs of South African cities into green cities. Currently there are single houses, each on its own plot, the earth stripped bare prior to construction, a reliance on coal-fired electricity, a wasteful approach to resource-use and engineering systems that support a single-minded focus on consumption. Cities are serviced by expen-sive tarred roads catering for private cars rather than public transport. After consumption unwanted waste is removed, ef-fluent piped away and the storm water is channelled away. For the current projects like retrofitting and the installations of SWH, the implementation rate is very slow and there are challenges to find ways to accelerate this implementation. There is much resistance currently to the new ideas for the implementation on clean energy solutions to buildings. Another significant development is densification also has much resistance to this new recommendation. There have been some policies and plans developed to address the challenges of

35
renewable energy, however the national policy process has a long way to go in ensuring the appropriate policies in place with specific regulations that can be implemented in an integrated and systematic way involving the stakeholders from national to local government. Political commitment to the green economy is not widely established and this is due to the fact that there is not enough information that outlines the impact of a green economy on the social and economic issues. The environmental benefits seem to trade off benefits for socio-economic factors. A key challenge therefore in addressing a green city is to address the concerns and perception that are being held by politicians and general public about the costs and benefits of a green economy. Investing in skills and knowledge creation to apply green technologies to the cities is an urgent challenge. There is the opportunity to unlock economic opportunities through new industries - solar, urban agriculture, water harvesting, transport (bicycle highways, rental), recycling and tourism. The South African National SWH Strategic Framework and Implementa-tion Plan include targets to install 1 million SWH in the next 5 years. There is a potential to remove 1-2 power stations from the grid if a national roll out of SWH is achieved. This in turn has a positive outlook for the creation of jobs within a green economy strategy A bus rapid transit, light rail, metro rail, bike paths and pedestrian walkways result in reduced congestion (not green congestion), lower maintenance and operation costs of the transport network. This will in turn lower pollution and health costs. There can be synergies found with water, energy and waste. Successful urban development programmes that address environmental issues are based on public awareness but rely on the fact that there is a need to combine integrated planning and the delivery of infrastructure with regulation and fiscal interventions to create markets for green products and services. Policy and governance requirements South Africa however needs an integrated approach to green growth that will stimulate the development of green cities and towns. Regulations for urban planning is critical as well as the regulation for new buildings. All of these will be a catalyst for the green city concept. Policy documents need a clear financial benefit case for the end user if legislation is to be uncontroversial and a proper monitoring and evaluation framework must be created and communicated inter governmentally. Local municipalities need to be given the mandates to enforce these regulations. What can be done now?
1. Install SWH in all new houses; 2. There is a need for awareness raising and up skilling on solutions to green cities; 3. There is a need for clear guidelines on legislation / regulations that address the issues of
rebates/subsidies/grants, low-interest loans, tax concessions, import duties, quality control, government & industry support and awareness programmes;
4. National Framework required which will assist roll out and creative initiatives ( better evaluation in land use management plans, higher density and move from car to public transport)
5. Establishing meaningful Public Private Partnerships (PPP) to support green economy interventions through common synergies
6. Identify lever to provide the resource to make the economic change possible ( e.g. Lolland’s Green Growth Policy identified increase in taxes as first step towards a green economy revival)
7. Opportunity to unlock economic opportunities through new industries - solar, urban agriculture, water harvesting, transport (bicycle highways, rental), recycling, tourism
8. Apply efficient spatial development frameworks which supports public transport, pedestrian and cycle routes, production-orientated cities’ reuse of resources such as stormwater and grey-water, green buildings with lower electricity and water demand, appropriate technology such as solar water geysers and photovoltaic panels that feed the grid and supply electricity to a mixed-use city environment, waste minimised, reused, recycled, infrastruc-ture based on green engineering services, incentives for densification and or productive use of land, eradicate legacy of sprawling apartheid city. Make use of buffer strips for densification or urban agriculture and promote mixed-use and mixed income communities – bring people closer to work opportunities to reduce need for transport, align land-uses with public transport and pedestrian routes.
9. Focus not only on carbon and emissions but also on the very pressing issue for South Africa of water security

36
10. Price ecosystem goods and natural systems as part of infrastructure that supports society/life – “custodian” jobs become economically important, especially compared against cost of cleaning up later.
11. Municipalities as custodians of the environment should focus not on service delivery only but on custody of the environment (waste collection and disposal or water provision vs integrated approach that involves protection of resources, collection, sorting and reselling of waste, closed-looped water system.
12. There is a need for development of natural capital indicators and defining the carbon sync value of ecosystems within our cities. Unleash carbon financing for sustainable energy interventions in RDP households
13. Focus on long term plan and short term achievements Limpopo Priorities
Green Municipality Competition
Sustainability practices in 5 district and 25 local municipalities are assessed based on:
1. Waste management
2. Water management
3. Energy management
4. Landscape
5. Public participation
6. Governance and capacity building
Review all municipal by-laws, IDPs, Sector Plans
Calculate Ecological footprint of municipalities
Figure 15: Results from the Limpopo Green Municipality Competition 2012 Source: Manoko A, Manager Environmental Governance, LEDET 2013 Map: Fouche P, GIS, LEDET 2013

37
10 Cross-cutting Issues National Considerations The transition into a green economy needs to be managed carefully, ensuring that all the aspirations of the different stakeholders are managed, and that roles and responsibilities are assigned. There are currently too many green plans that are hardly linked to performance management. As part of managing the transition it was felt it is also important to look at existing case studies of good green behaviour in the South African context; an investigation of who is doing what, where and what the inspirational lessons to be learnt for the rest of the economy are. This, it was argued, would give the message that indeed the green economy already lives in South Africa but needs further enhancement. Green Jobs and the Extended Public Works Programme There is a need to move away from the tendency to think of green jobs as mainly semi-skilled and unskilled jobs. It was felt that all professions can point to green jobs within their own professions and that these could be highly skilled and technical jobs in fields such as science and technology, academia, other technical services like engineering and even in local government administration. The EPWP should look at improving the quality of the jobs it offers, especially within rural communities, focusing on job protection. There is a tendency to rely on the EPWP and other job creation initiatives by government. There was a need to put pressure on business to take some of this responsibility thus giving relief to the public purse. The EPWP is not the desired end state in relation to job creation in South Africa and should not be relied upon to provide highly skilled and technical jobs, especially for a green economy. Policy and Regulatory Imperatives There is needed for a concerted effort in the management of stakeholder relations between government and the private sector, pre and post legislation, to ensure the representation of a broad myriad of views and aspirations in resultant policies and strategies. DEA will conduct a survey of current policy and legislation within the green economy space, so as to assess gaps and avoid duplication. There are immediate short-term gains to be made with regard to policy and legislative work and that these low-hanging fruit could score some quick and effective victories for the green economy agenda, thus contributing to the management of the perception about this agenda. The DEA would start thinking about the introduction of trade-offs for sustainable development, with particular reference to the value attached to any sector-specific efforts at creating green jobs. Sectors There is currently insufficient mechanisms for the government to track and monitor progress regarding the transition into the green economy. There is an argument that the State of the Environment Report is not sufficient for this task and needs to be boosted by other tools and mechanisms for monitoring. T he following are the additional sector-specific issues raised: Energy The Summit acknowledged that by all indications, the high carbon trajectory would soon enough become a trade issue and that if South Africa does not act urgently and decisively in lowering its carbon footprint, it would be vulnerable to the dictates of developed and “greener” economies of the world. The DEA was challenged by the Summit to review its 2030 targets by agreeing to ensure that by 2030 50% of South Africa’s energy comes from renewable energy resources, espe-cially in light of the number of coal-fired power stations facing closure in the next ten years. There was furthermore a call that in light of our communities’ entrenched reliance on fossil fuels, the DEA and its partners needed to launch a massive awareness raising and educational campaign targeting civil society. This campaign would also seek to take lessons from South Africa’s poorest communities who are resilient in the face of poverty on how even renewable energy resources could be given an even longer life; resilience that might be needed in the future. The monopoly of Eskom as the single buyer of energy was noted with some concern with the resultant suggestion that there needed to be space and funding made available to encourage the creation of competitive green and non-renewable energy resource buyers. At this point the DEA did indicate that government was already in the process of investigating this possibility. There was also a feeling that it was perhaps necessary for South Africa to consider the diversification of renewable resources by looking at utilising nuclear energy. The problems around the disposal of this alternative (waste

38
management) were considered but the Summit acknowledged that in that it is carbon free, it needed to be given closer at-tention. The Summit also felt that South Africa needed to look at its energy storage systems so as to ensure that there would be sufficient energy supply on and off peak seasons. Waste Management The Summit cautioned that the definition of waste management should not see waste as something to dispose of neces-sarily but should rather see it as another possible renewable resource that can be converted into energy while also adding the benefit of creating more green jobs. Green Buildings There is fact in the assertion that green building is in fact costly. Experience dictates that in the South African context, the initial capital investment is high due to the fact that there is lack of competition in the green building materials sector and merchandise is therefore sold at a much higher price than is the case in Europe and the USA where there is tough competition among suppliers. The Summit therefore felt that government needs to regulate in such a way that service pro-viders across sectors are compelled to invest in green technologies, creating healthy business competition and therefore affordable prices. Agriculture and Forestry The main challenge in this sector is the evident insufficient research and development funding for research and develop-ment. This necessitates a conversation between the DEA, the Department of Agriculture, Forestry and Fisheries, the Department of Science and Technology (or its research institutes) and the Department of Higher Education and Training (or its individual universities). Finance and Fiscal Considerations There was broad recognition of the fact that South Africa has the opportunity to access international public finance like that which is available from the Copenhagen Accord. South Africa however needs to urgently look at what programmes it wishes to prioritise and how these should be packaged to access funding. Furthermore it was felt that there was need to start identifying and defining the key fiscal elements of a green economy growth path. The fact that municipal revenue in South Africa continues to rely on the volume of sales of services based on non-renew-able resources was identified as key in influencing behavioural change towards adopting a green economy at the local government level. Summit submitted that because the reduction of profits would never be in the interest of business or municipalities, government needed to encourage, incentivise and mainstream the sale of energy derived from renewable resources. Furthermore it was felt that some of the market reforms necessary included subsidy reforms such as the re-moval of state subsidies from fossil fuels, thus influencing behavioural change. Considering that the whole South African economy is geared towards chasing the Gross Domestic Product (GDP), summit felt that there may very well be a need to augment GDP indicators to bring value to environmental and natural capital. In so doing there would further be a need to therefore identify and measure the amount of natural capital needed by various sectors of the South African economy, thus also making these sectors responsible for natural capital preservation. Limpopo Priorities:
Mainstream the Green Economy in all provincial documents
Create a research hub on green economy in Limpopo
Monitor and evaluate Green Economy
Initate a national Green Economy Indaba and make it an annual event

39
The Green Economy is the necessary tool for Climate Proofing of planning and behavior. The following figures illustrate the link between social and economic variables and vulnerability of communities to climate change.
Figure 16: Vulnerability to Climate Change Index for Local Municipalities in South Africa Source: Fiscal and Financial Commission, National Treasury, 2012
Figure 17: Vulnerabilities of Local Municipalities in South Africa to Climate Change Source: Fiscal and Financial Commission, National Treasury, 2012
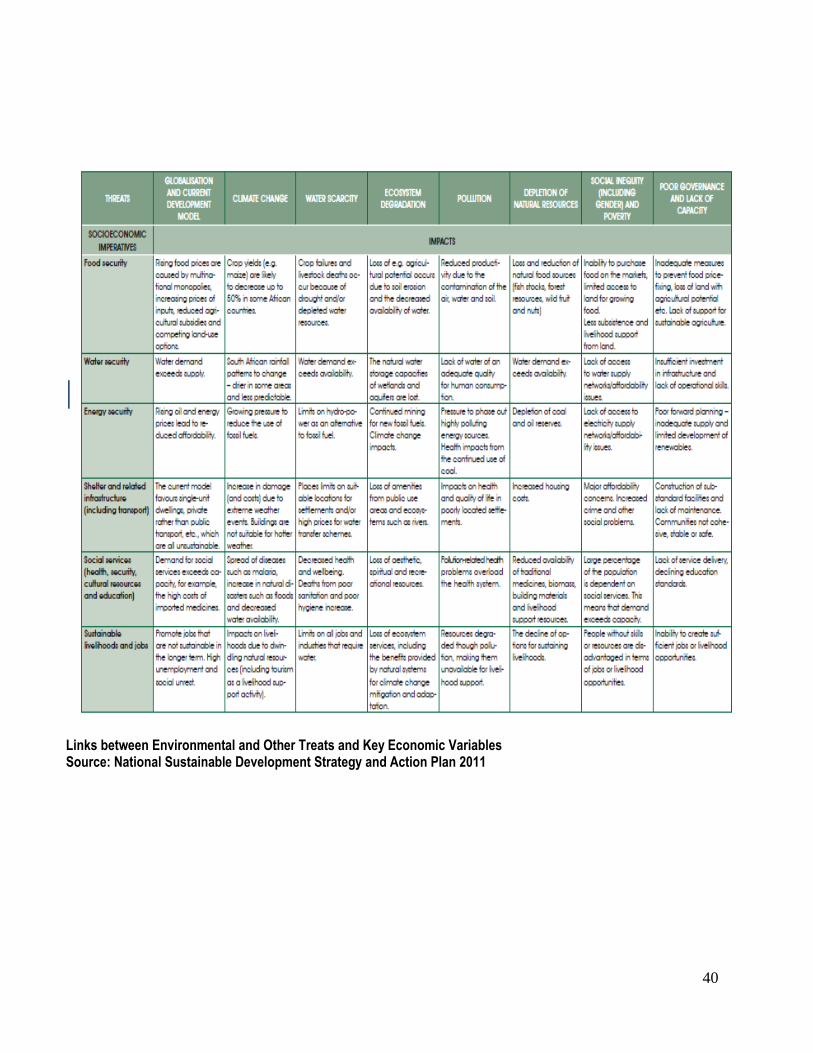
40
Links between Environmental and Other Treats and Key Economic Variables Source: National Sustainable Development Strategy and Action Plan 2011

41
Chapter 4 Implementation Plans per Key Focus Area
Goals Long-Term: Build a New Economic/Environmental Paradigm for Limpopo Medium Term: Create Enabling Conditions for Green Growth
Change Behavioral and Production Patterns Short Term: Generate Jobs
Improve Environmental Quality
Key Focus Area 1. Sustainable Production and Consumption
Initiative Target Indicators Lead Agent
Goals
Immediately By 2014 2014-2020 2020-2050 ST
MT
LT
Align the sustainability plans of all industrial sectors in Limpopo with the National Sustainable Development Strategy and Action Plan
Introduce all major industrial sectors to the Strategy and all other relevant policy documents
All industrial sectors have formulated their sustainability commitments
Set targets for reduced emission and cleaner production are achieved at 50%
Towards Zero Carbon and waste industries in Limpopo
Reduction in external resources Improved air quality Green House gas emissions
LEDET Waste Management Sector Development EES LEDA
X
X
X
Establish Limpopo as Green Tourism Destination Nationally and Internationally
Acquaint tourism operators with the Green Stay SA Tourism Self-assessment Tool
Set sustainability targets and initiate self-assessment of all tour operators
At least 50% of all tourism operators participating in the Green Stay SA Tourism Self-assessment
All tourism operations green
Reduced environmental impact on natural resources
LEDET Tourism LTP
X
X
X
Greening Limpopo Tertiary Sector
Create awareness among banking, retail, educational and other services institutions about the environmental impact of their operations
All tertiary institutions in Limpopo have formulated their sustainability commitments
At least 50% of all operations with reduced carbon and ecological footprints
All Limpopo Tertiary operation carbon neutral
Improved environmental quality in Limpopo
LEDET LEDA
x
x
x

42
Goals Long-Term: Build a New Economic/Environmental Paradigm for Limpopo Medium Term: Create Enabling Conditions for Green Growth
Change Behavioral and Production Patterns Short Term: Generate Jobs
Improve Environmental Quality
Key Focus Area 2. Water Management
Initiative Target Indicators Lead Agent Goals
Immediately By 2014 2014-2020 2020-2050 ST MT LT
Facilitate Water Security in Limpopo by Creating awareness
Improve awareness of general public on the water situation in Limpopo
Constantly inform the general public of the water situation in Limpopo
All households, businesses, industries, public buildings have formulated a water efficiency plan
All households, businesses, industries, public offices are using water efficiently
Decreased water consumption
Department of Water Affairs LEDET Communications EES
X X X
Efficient use of water in mining
All mines recycle water
Water Security in Limpopo
Water resources of high quality and comfortable quality for domestic, industrial and ecological use
DM X X X
Alternative water storage
DWA X X X
Improved Reticulation systems
Local Municipalities
X X X
Recycling of water from sewage farms
All water from SP recycled
Local Municipalities
X X X
Reduce water in agricultural consumption
LDA Commercial farmers
X X X
Water harvesting from fog and rain
50% of households harvest
Local Municipalities Industry
X X X
STP biogas production
Local Municipalities
X X X
Catchment management
Water Affairs LEDET
X X X
Reduced house hold consumption
Limpopo Citizens
X X X
Regulate swimming pools
All SP in Limpopo regulated
Local Municipalities
X X X

43
Goals Long-Term: Build a New Economic/Environmental Paradigm for Limpopo Medium Term: Create Enabling Conditions for Green Growth
Change Behavioral and Production Patterns Short Term: Generate Jobs
Improve Environmental Quality
Key Focus Area 3. Sustainable Waste Management Practices
Initiative Target Indicators
Lead Agent Goals
Immediately By 2014 2014-2020 2020-2050 ST
MT
LT
Facilitate Efficient Waste Management in Limpopo by: 1.Licensing of Waste disposal sites 2.Monitoring of conditions of licenses 3. Creating awareness around waste issues
Improve the awareness of stakeholders around waste issues
Improved waste management in Limpopo
Improved waste management in Limpopo
Improved waste management in Limpopo
Decreased generation of waste
LEDET Waste Management EES
x
x
x
Waste Beneficiation: 1.Labour intensive waste collection practices 2.Recycling of Tyres, Paper, Glass, Metal, Electronic waste 3.Establishment of material recovery centers (facilities) 4.Recovery of methane from waste disposal sites and sewer treatment plants for electricity production
Improve the awareness of stakeholders around waste beneficiation
Establish at least 1 recycling center in Limpopo for the different waste types
Create waste reclaiming facilities at 50% of the Licensed Waste Disposal Sites
Build waste beneficiation facilities at all municipal waste disposal sites
Jobs created/ reduction of volumes
LEDET SMME Sector development LEDA Municipalities
x
x
x

44
Goals Long-Term: Build a New Economic/Environmental Paradigm for Limpopo Medium Term: Create Enabling Conditions for Green Growth
Change Behavioral and Production Patterns Short Term: Generate Jobs
Improve Environmental Quality
Key Focus Area 4. Clean Energy and Energy Efficiency
Initiative Target Indicators
Lead Agent
Goals
Immediately By 2014 2014-2020 2020-2050 ST
MT
LT
Facilitate awareness creation about energy security
Use all opportunities to focus public attention on the provincial and national energy security issues
Engage all municipal energy forums
Make energy efficiency awareness a visible feature at all entities in Limpopo
Efficient Use of Energy in all entities in Limpopo
Decrease of energy use from non-renewable resources
DE Eskom LEDET EES Municipalities
x
x
x
Facilitate Energy efficiency in Limpopo by: 1.Monitoring consumption in government buildings
2. Off Grid power generation, where possible (provincial nature reserves) 3. Bio fuels / Bio gass production 4. Solar water heaters installations in new buildings
Appoint energy officers in all public entities Conduct feasibility studies
Monitor and regulate consumption Start installation
Energy efficiency is a main sustainability commitment in industry, public service, retail, education, etc in Limpopo 50% of all NR with off-grid renewable energy
Efficient Use of Energy in all entities in Limpopo
Amount of energy (KW) produced locally , jobs, reduction in fossil fuel usage
x
x
x

45
5. Solar panels production in Limpopo
Develop capacity for generation of electricity from renewable sources
30% of energy generated by use of renewable sources
x
x
x
Goals Long-Term: Build a New Economic/Environmental Paradigm for Limpopo Medium Term: Create Enabling Conditions for Green Growth
Change Behavioral and Production Patterns Short Term: Generate Jobs
Improve Environmental Quality
Key Focus Area 5. Resource Conservation and Management
Initiative Target Indicators
Lead Agent Goals
Immediately By 2014 2014-2020 2020-2050 ST MT LT
Limpopo Biodiversity Conservation Plan
Finalize the plan (subject to financial and human resources)
Create awareness of the plan and mainstream it in relevant provincial documents
Update the plan periodically and acquaint the broader public with its significance. LBCP is considered in all development projects in Limpopo
Establish a sound network of ecological infrastructure to provide reliable ecosystem services in Limpopo
Area (ha)
of land restored
Reduction of pressure on natural resources
LEDET Biodiversity
x
x
x
Valuation of natural resources
Calculate the monetary value of as many as possible natural resources
Develop a research plan for further valuation of ecosystem services/ natural
Create awareness of the economic value of Limpopo ecological infrastructure
Facilitate sound economic decisions based on the value of natural resources
LEDET Biodiversity
x
x
x

46
currently traded at markets
resources in Limpopo
Up-scale “working for-programmes (eradication of alien plants, maintenance of veld, production of final products)
DEA Working for- programmes
x
x
x
Beneficiation of natural resources (alien plants, medicinal plants, animals, protected areas)
LEDET Sector development SONR Biodiversity
x x x
Provision of raw material for crafting and domestic cooking
LEDET Biodiversity
x x x
Tree planting at specific areas and specific species
LEDET Biodiversity
x x x
Char-coal production from alien plants
LEDET SMME
x x x
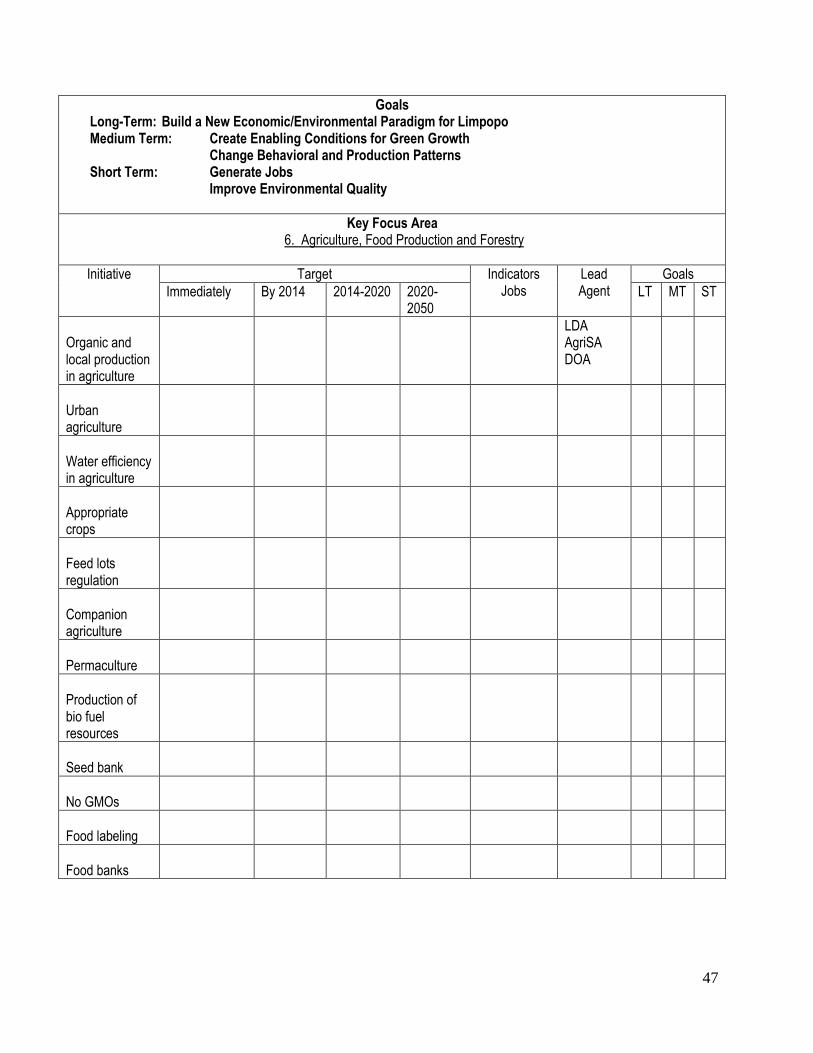
47
Goals Long-Term: Build a New Economic/Environmental Paradigm for Limpopo Medium Term: Create Enabling Conditions for Green Growth
Change Behavioral and Production Patterns Short Term: Generate Jobs
Improve Environmental Quality
Key Focus Area 6. Agriculture, Food Production and Forestry
Initiative Target Indicators Jobs
Lead Agent
Goals
Immediately By 2014 2014-2020 2020-2050
LT MT ST
Organic and local production in agriculture
LDA AgriSA DOA
Urban agriculture
Water efficiency in agriculture
Appropriate crops
Feed lots regulation
Companion agriculture
Permaculture
Production of bio fuel resources
Seed bank
No GMOs
Food labeling
Food banks

48
Goals Long-Term: Build a New Economic/Environmental Paradigm for Limpopo Medium Term: Create Enabling Conditions for Green Growth
Change Behavioral and Production Patterns Short Term: Generate Jobs
Improve Environmental Quality
Key Focus Area 7. Green Buildings and the Built Environment
Initiative Target Indicators
Lead Agent Goals
Immediately By 2014 2014-2020 2020-2050
LT MT ST
Green all government buildings in Limpopo
Create awareness among public employees about green buildings
Conduct energy, insulation and water efficiency audits in all government buildings
radually retrofit all government buildings All new buildings to adhere to the green building standards
All publicly owned buildings in Limpopo are green
Reduced energy and water consumption in public buildings Reduced waste generation
OfP
x
x
x
Proper Town planning based on Green principles
Municipalities
x
x
x
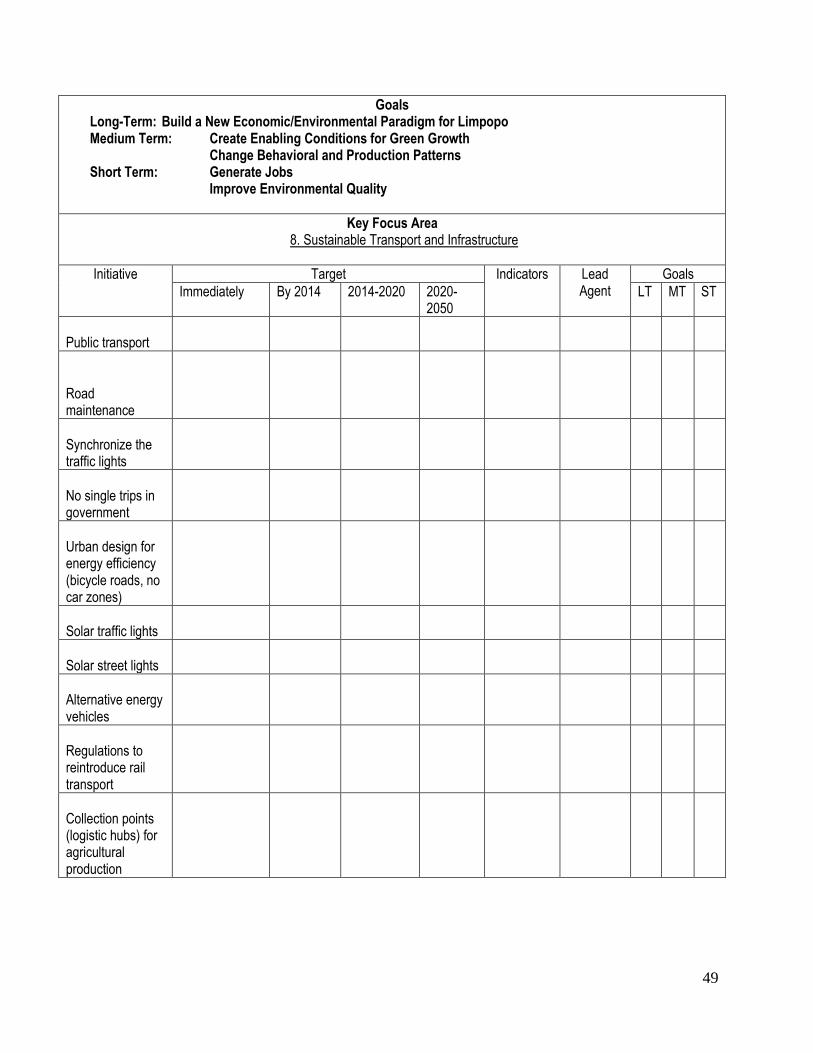
49
Goals Long-Term: Build a New Economic/Environmental Paradigm for Limpopo Medium Term: Create Enabling Conditions for Green Growth
Change Behavioral and Production Patterns Short Term: Generate Jobs
Improve Environmental Quality
Key Focus Area 8. Sustainable Transport and Infrastructure
Initiative Target Indicators Lead Agent
Goals
Immediately By 2014 2014-2020 2020-2050
LT MT ST
Public transport
Road maintenance
Synchronize the traffic lights
No single trips in government
Urban design for energy efficiency (bicycle roads, no car zones)
Solar traffic lights
Solar street lights
Alternative energy vehicles
Regulations to reintroduce rail transport
Collection points (logistic hubs) for agricultural production

50
Goals Long-Term: Build a New Economic/Environmental Paradigm for Limpopo Medium Term: Create Enabling Conditions for Green Growth
Change Behavioral and Production Patterns Short Term: Generate Jobs
Improve Environmental Quality
Key Focus Area 9. Green Municipalities
Initiative Target Indicators
Lead Agent Goals
Immediately By 2014 2014-2020 2020-2050 ST MT LT
Green Municipality Competition Sustainability practices in 5 district and 25 local municipalities are assessed based on:
1. Waste
management
2. Water
management
3. Energy
management
4. Landscape
5. Public
participation
6. Governance and
capacity building
Evaluate the Green municipality reports since 2003 and make specific recommendations to municipalities
Facilitate the development of sustainability statement of all district and local municipalities based on the National Sustainable Development Strategy and Action Plan and the National Climate Change Response White Paper
Continue facilitating sustainability practices at local level by annual engagement in the Green Municipality Competition
Local municipalities are the core of resilient and self-reliant communities in Limpopo
Municipal sector plans aligned with all relevant national programmers Integration of sustainable development principles in municipal IDPs
LEDET EES District and Local Municipalities
x
x
x
Review all municipal by-laws, IDPs, Sector Plans
x
x
x
Calculate Ecological footprint of municipalities
Reintroduce the concept to municipalities
Develop methodology relevant to Limpopo
Calculate the ecological footprint of 50% of local municipalities
Calculate the ecological footprint of all of local municipalities And use the tool to monitor sustainability at local level
x
x
x

51
Goals Long-Term: Build a New Economic/Environmental Paradigm for Limpopo Medium Term: Create Enabling Conditions for Green Growth
Change Behavioral and Production Patterns Short Term: Generate Jobs
Improve Environmental Quality
Key Focus Area 10. Cross-cutting Aspects of the Green Economy
Initiative Target Indicators Lead Agent
Goals
Immediately By 2014 2014-2020 2020-2050 LT MT ST
Mainstream the Green Economy in all provincial documents
Assess the current state of stake-holder engagement in the green economy through sterco
Create awareness of the Green Economy Plan in all spheres of society
Green economy is a founding principal in all provincial planning
Green economy is a founding principal in all provincial planning
Higher quality of Planning and strong sustainability in Limpopo
LEDET OfP
x
x
x
Create a research hub on green economy in Limpopo
Create a data base of Green Economy Research in Limpopo
Initiate research on the identifies gaps
Implement research findings in Planning
Contribute to the new economic /environmental paradigm for Limpopo
Developed Human Capacity
LEDET University of Limpopo University of Venda
x
x
x
Monitor and evaluate Green Economy
Identify working monitoring and evaluation tools and use them
Identify specific working monitoring and evaluation tools for the Green economy
Green Economy deliverables are part of Performance Management System in all sector departments and local government
Green Economy deliverables are part of Performance Management System in all sector departments and local government
Better service delivery
LEDET
x
x
x
Initiate a National GE Indaba in Limpopo make it a annual event
LEDET
x
x
x

52
Chapter 5
Conclusion
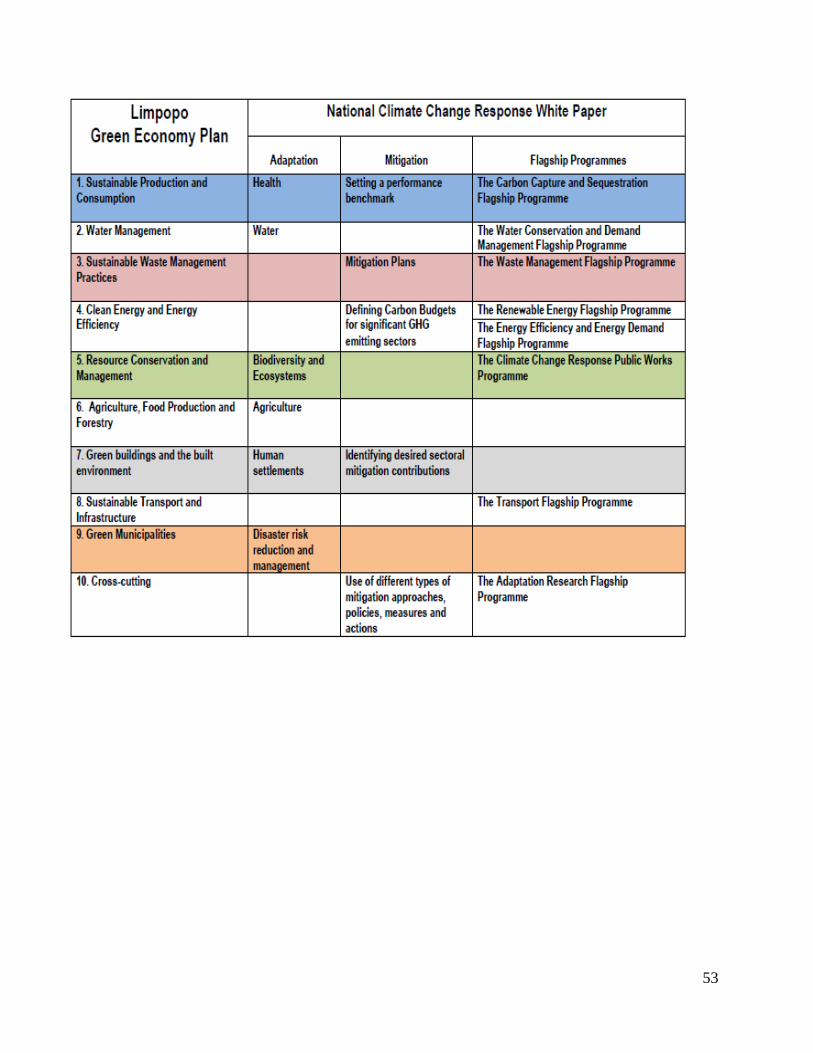
53

54