lincoln laboratory evaluation of tcas ii logic version 6 ... · lincoln laboratory evaluation of...
TRANSCRIPT

Project Report ATC-240
Lincoln Laboratory Evaluation of TCAS II Logic Version 6.04a
Volume I
A.C. Drumm
h ■Mr;rs fWJsS
Lincoln Laboratory MASSACHUSETTS INSTITUTE OF TECHNOLOGY
LEXINGTON, MASSACHUSETTS
21 February 1996
Prepared for ihe Federal Aviation Administration.
Document is available to the public through the National Technical Information Service,
Springfield, Virginia 22161.
19960315 054

This document is disseminated under the sponsorship of the Department of
Transportation in the interest of information exchange. The United States Government assumes no liability for its contents or use thereof.

TECHNICAL REPORT STANDARD TITLE PAGE
1. Report No.
ATC-240
2. Government Accession No.
4. Title and Subtitle
Lincoln Laboatory Evaluation of TCAS II Logic Version 6.04a, Volume I
7. Author(s)
Ann C. Drumm
9. Performing Organization Name and Address
Lincoln Laboratory, MIT 244 Wood Street
Lexington, MA 02173-9108
12. Sponsoring Agency Name and Address Department of Transportation Federal Aviation Administration
Systems Research and Development Service Washington, DC 20591
15. Supplementary Notes
3. Recipient's Catalog No.
5. Report Date 21 February 1996
6. Performing Organization Code
8. Performing Organization Report No.
ATC-240
10. Work Unit No. (TRAIS)
11. Contract or Grant No.
13. Type of Report and Period Covered
14. Sponsoring Agency Code
This report is based on studies performed at Lincoln Laboratory, a center for research operated by Massachusetts Institute of Technology under Air Force Contract F19628-95-C-0002.
16. Abstract
This report documents the Lincoln Laboratory evaluation of the Traffic Alert and Collision Avoid- ance System II (TCAS II) logic version 6.04a. TCAS II is an airborne collision avoidance system required since 30 December 1993 by the FAA on all air carrier aircraft with more than 30 passenger seats operating in U.S. airspace. Version 6.04a is a logic version mandated by the FAA by 30 December 1994 in order to correct a potential safety problem in earlier versions and to make the TCAS logic more compatible with the air traffic control system.
Lincoln Laboratory evaluated the logic by examining approximately two million simulated pairwise TCAS-TCAS encounters, derived from actual aircraft tracks recorded in U.S. airspace. The main goals of the evaluation effort were: (1) to determine if version 6.04a successfully corrected the potential safety problem without introducing new problems; (2) to detect and explain any areas of poor performance; and (3) to understand the performance limits of the logic. Five analysis programs were written to aid in the evaluation, and these programs are described in the report.
There were three phases of the evaluation corresponding to the above three goals. For each phase, the report gives an overview of the evaluation approach taken, a description of the results, and a summary. A description of follow-on activities plus overall conclusions and recommendations are given at the end of the report.
17. Keywords
19. Security Classif. (of this report)
Unclassified
18. Distribution Statement
This document is available to the public through the National Technical Information Service, Springfield, VA 22161.
20. Security Classif. (of this page)
Unclassified
21. No. of Pages
82
22. Price
FORM DOT F 1700.7 (8-72) Reproduction of completed page authorized

EXECUTIVE SUMMARY
This report documents the Lincoln Laboratory evaluation of the Traffic Alert and Collision Avoidance System II (TCAS II) logic version 6.04a.
BACKGROUND
TCAS II is an airborne collision avoidance system, required since 30 December 1993 by the Federal Aviation Administration (FAA) on all air carrier aircraft with more than 30 passenger seats operating in United States airspace. To date, three versions of the TCAS II logic have been flown commercially:
(1) Version 6.02 was the logic version in use at the time that TCAS II was first mandated.
(2) Version 6.04 was made available in late 1992. A non-mandated version, its purpose was to make the TCAS logic more compatible with the air traffic control (ATC) system by reducing the number of nuisance advisories.
(3) Version 6.04a was mandated by the FAA by 30 December 1994 in order to correct a potential safety problem in both the 6.02 and 6.04 versions and to require implementation of the version 6.04 ATC compatibility features.
The potential safety problem occurred most often in a specific encounter geometry, referred to as a Seattle-type encounter. The encounter involved two TCAS-equipped aircraft with opposite sign vertical rates, intending to level-off 1000 feet apart. Each TCAS, unaware of the level-off intent, modeled the intruder as continuing its high vertical rate and selected an altitude crossing maneuver as providing the best vertical separation. Extensive examination of this encounter in simulation uncovered encounter variations in which both (simulated) pilots followed the TCAS advisories correctly, and yet less than 100-feet vertical separation at closest point of approach (CPA) resulted. This was due to a number of factors, including a flaw in the 6.02 and 6.04 logic that could direct the pilot to maintain an incorrect vertical rate. Version 6.04a was intended both to make crossing advisories less likely in pilot level-off situations and to correct the logic flaw so that crossing advisories, when they were issued, would be more likely to work properly.
Lincoln Laboratory had been working since 1991 with the FAA Technical Center (FAATC) in a cooperative effort to assess TCAS logic performance using simulated encounters, and thus both organizations were tasked to evaluate the 6.04a logic. Although FAATC provided the simulated encounters to be evaluated, each organization performed its own distinct evaluation. This reports covers only the Lincoln Laboratory evaluation.
METHODOLOGY
The data analyzed by Lincoln Laboratory were produced by an FAATC simulation program referred to as the Fast-Time Encounter Generator (FTEG). Approximately two million simulated pairwise encounters were run. These encounters were derived from actual aircraft tracks recorded in United States airspace, with large numbers of variations produced by varying key aircraft parameters, including planned altitude separation at CPA and aircraft vertical rates and accelerations. For the FTEG runs, the range of values used for aircraft vertical rates and
in

accelerations slightly exceeded the typical values seen in the airspace, and maneuvers were timed to create worst-case situations for TCAS. This was done deliberately in order to try to characterize the performance limits of the collision avoidance (CAS) logic and to predict problems that could potentially occur. Since there was a period of time in which all three of the above logic versions operated in the airspace simultaneously, the analysis examined pairwise combinations of all three logic versions.
Lincoln Laboratory developed five distinct analysis programs for use in the evaluation. These are described in the report and sample outputs are given. The performance metric used in all of the analysis programs was the vertical separation between the two aircraft at CPA. In general, encounters were either acceptable or unacceptable depending upon whether or not the encounter resulted in an NMAC, or near mid-air collision, defined in this report as a vertical separation of < 100 feet at CPA. The evaluation used the concept of a "planned encounter," i.e., an encounter as it would have unfolded if TCAS were not present. The planned performance was compared to the performance of the different TCAS logic versions to determine if TCAS failed to resolve an existing NMAC or induced an NMAC where none had previously existed.
EVALUATION GOALS
There were three goals of the Lincoln Laboratory 6.04a evaluation:
(1) Compare logic versions 6.04 and 6.04a to determine if the 6.04a changes produced the expected improvements and to determine if any new problems had been introduced. This was a focused effort, using specific analysis programs to evaluate areas of the logic that had changed from version 6.04 to 6.04a.
(2) Do a general evaluation of the 6.04a logic, using all of the Lincoln Laboratory analysis programs, to detect and explain any areas of concern. This effort primarily pinpointed areas in which the 6.04a performance was much worse than the baseline 6.02 performance.
(3) Analyze every 6.04a NMAC produced by the simulation in order to understand the performance limits of the 6.04a logic. For those NMACs deemed likely to occur in the real airspace, discuss possible courses of action to improve the CAS logic performance.
RESULTS
The major findings of the evaluation were as follows:
(1) Logic version 6.04a resolved all Seattle-type encounters in the simulation.
(2) When compared to version 6.04, version 6.04a greatly reduced the number of induced NMACs in all rate-to-level non-crossing geometries (i.e., geometries for which the corresponding planned encounter called for one or both aircraft to level-off without a resulting crossing in altitude). There were fewer crossing RAs issued in each of these geometries and also better results from the crossing RAs that were issued.
(3) When compared to version 6.04, there did not appear to be any new problems introduced by the 6.04a logic.
IV

(4) There were no interoperability problems seem among the 6.02, 6.04, and 6.04a logic versions.
(5) There were no geometries in which 6.04a induced NMACs in more than 2% of the encounters.
(6) There were four geometries in which 6.04a had more than twice the number of NMACs as version 6.02. These were planned crossing encounters that would be expected to occur very rarely in the real airspace. Thus, the increase in NMACs in these geometries was not considered significant.
(7) Situations most troublesome to the CAS logic (all versions, including version 6.04a) include the following:
high vertical rates in one or both aircraft (generally 5000 fpm, sometimes 3000 fpm)
level-off maneuvers in which the planned separation is less than 1000 feet
late planned vertical maneuvers (maneuvers that begin just as the range threshold for issuing an advisory is crossed)
late planned vertical maneuvers that are opposite to the direction of the TCAS advisory.
Overall, the main conclusion was that no encounters were found that indicated a clear safety problem with the 6.04a logic. There are certain situations that the 6.04a logic cannot handle, but there was consensus among the organizations that formed a review group that these situations are not common and can be addressed further with the Change 7 logic.
RECOMMENDATIONS
There were four major recommendations from this study:
(1) Determine if the Change 7 logic improves on the 6.04a performance as expected. Use the Lincoln Laboratory analysis programs to analyze the performance of both the Change 7/Information Release 5 logic and the final Change 7 logic. Note any new problems that occur. Compare in detail the 6.04a and Change 7 performance of the 6.04a NMAC encounters.
(2) Develop a class of encounters in which the aircraft overshoot the planned altitude. Run these encounters in addition to the current set of encounters using the Change 7 logic.
(3) Continue to gather data (airborne TCAS recordings, ARTS data, Mode S sensor monitoring) regarding the frequency in the real airspace of:
high vertical rates (> 3000 fpm),
level-offs in which the planned separation is less than 1000 feet.
Determine if further work needs to be done to improve performance in these areas.
(4) Ensure that aircraft displays are capable of displaying advisory information required by TCAS.

ACKNOWLEDGMENTS
The Lincoln Laboratory 6.04a evaluation was a team effort, and the author would like to thank all of the people involved. Marcia Kastner participated in the early stages of the work and played a key role in the design and development of some of the analysis programs. Barbara Chludzinski and Richard Potts wrote all of the analysis software. In addition, Barbara worked with the FAA Technical Center (FAATC) to review and test parts of the FAATC simulation software. The author also thanks Katharine Krozel of Lincoln Laboratory who helped edit this report.
As described in Section 2 of this report, the data used in the evaluation were provided by FAATC, with Tom Choyce heading a group consisting of Kathryn Ciaramella, Patrick Kelly, and Stuart Searight. FAATC provided copies of their simulation software to Lincoln Laboratory so that duplicate simulation facilities could be set up at Lincoln. In early stages of the evaluation, there were periods of regular teleconferences between Lincoln Laboratory, FAATC, and the FAA TCAS Program Office to discuss findings.
Finally, Lawrence Nivert of the TCAS Program Office was responsible for overseeing this work. He provided both technical and managerial guidance, and his in-depth understanding of all aspects of this work aided greatly in its completion.
vu

TABLE OF CONTENTS
Volume I
Executive Summary iii Acknowledgments vii List of Illustrations ix List of Tables xii
1. INTRODUCTION 1
1.1 Background 1 1.2 Goals of the 6.04a Evaluation 3 1.3 Organization of this Report 4
2. SIMULATION DESCRIPTION 5
2.1 Fast-Time Encounter Generator 5 2.2 Construction of Encounters for Simulation 5 2.3 Partitioning of Simulation Effort 7
3. ANALYSIS PROGRAMS 11
3.1 Matrix Generator Program 13 3.2 Hot-Spot Program 15 3.3 NMAC Characterization Program 18 3.4 NMAC Analysis Program 19 3.5 Performance Statistics Program 26
4. ANALYSIS - PHASE I 29
4.1 Description 29 4.2 Results 29 4.3 Summary 35
5. ANALYSIS - PHASE II 39
5.1 Description 39 5.2 Results 39 5.3 Summary 53
6. ANALYSIS - PHASE III 55
6.1 Description 55 6.2 Results 55 6.3 Summary 59
ix

TABLE OF CONTENTS
(Continued)
7. FOLLOW-UP AND RECOMMENDATIONS 63
7.1 6.04a Review Meeting 63 7.2 Action Item Resolution 64 7.3 General Conclusions and Recommendations 65
REFERENCES 67
Volume II
APPENDIX A SCENARIO DEFINITIONS FOR TCAS II TESTING 69
APPENDIX B TOTAL OF ENCOUNTERS RUN; BREAKDOWN BY ENCOUNTER CLASS AND EQUIPAGE 73
APPENDIX C NMAC TABLES 75
APPENDIX D PARAMETER FILE DESCRIPTION AND PARAMETER FILE PRINTOUT FOR CLASS 9/19 135
APPENDIX E SUMMARY NMAC TABLES 165
APPENDIX F NMACs AS A FUNCTION OF PARAMETER VALUES 175
APPENDIX G NMACs AS A FUNCTION OF LOGIC VERSION 181
APPENDIX H CAS THRESHOLDS, LAYERS, AND SENSITIVITY LEVELS 199
APPENDIX I PERFORMANCE STATISTICS OUTPUTS 201
APPENDIX J NMACS UNIQUE TO 6.04A - TABLES 7.4 AND 9.4 213
APPENDIX K CLASS WEIGHTS 219
APPENDIX L 30 REPRESENTATIVE 6.04A NMAC ENCOUNTERS 221
APPENDIX M MINUTES OF 24 AUGUST 1994 NMAC REVIEW MEETING 315

LIST OF ILLUSTRATIONS
Figure No. Page
1-1 Seattle Enounters. 3
1-2 Fast-time Encounter Generator. 6
2-2 Encounter Classes. (0-9 planned crossing; 10-19 planned non-crossing) 7
3 -1 Lincoln Laboratory Analysis Programs. 12
3-2 Scheme for Generating NMAC Tables. 14
3-3 Sample NMAC Table. 17
3-4 Sample NMAC Summary Table. 17
3-5 Table 19.4 Cell (4,4) NMACs as a Function of Parameter Values 20
3-6 CAS Logic Conditions for Triggering an RA. 22
3-7 Encounter Summaries 23
3-8 Encounter Summary Field Descriptions. 24
3-9 Encounter Summary - Aircraft Altitudes. Data file name= LL919YZH.605; REIT Number=2883, SIM Mode: 2165144 (Source: LL Composite FTEG Run, Dated 07/29/94) 25
3-10 Performance Statistics Program, Class 19. 28
4-1 Seattle Encounters. 31
4-2 Induced NMACs. 32
4-3 Effect of Version 6.04a. Compares Number of NMACs - Versions 6.04 and 6.04a, by Matrix Table. Shaded Areas are Common Encounters. 36
4-4 Effect of Version 6.04a. Compares Number of NMACs (200-ft Separation) - Versions 6.04 and 6.04a, by Matrix Table. Shaded Areas are Common Encounters 37
5-1 Induced NMACs. 40
5-2 Induced NMACs (200-ft separation). 41
5-3 Unresolved NMACs. 42
5-4 Unresolved NMACs (200-ft separation). 43
5-5 Hot-Spot 2.4. Class 2 Induced NMACs. 45
5-6 Hot-Spot 2.4. Class 2 Induced NMACs. 46
5-7 Hot-Spot 7.4. Class 7 Induced NMACs. 47
5-8 Hot-Spot 7.4. Class 7 Induced NMACs. 48
5-9 Hot-Spot8.3. Class 8 Unresolved NMACs. 49
XI

LIST OF ILLUSTRATIONS
Figure No. Page
5-10 Hot-Spot 8.3. Class 8 Unresolved NMACs. 50
5-11 Hot-Spot 8.4. Class 8 Induced NMACs. 51
5-12 Hot-Spot 8.4. Class 8 Induced NMACs. 52
6-1 Representative NMAC Encounters 56
6-2 Representative Encounters, Unresolved NMACs. 60
6-3 Representative Encounters, Induced NMACs. 61
Xll

LIST OF TABLES
Table No. Page
2-1 Versions 6.02, 6.04, 6.04a - Pilot responding 8
2-2 Versions 6.02,6.04a - Pilot responding/Pilot not responding (PNR) 8
2-3 Versions 6.04, 6.04a - Pilot responding/Pilot not responding (PNR) 9
3-1 Class 19 Parameter Variations 18
4-1 Performance Improvement Breakdown 33
xni

1. INTRODUCTION
1.1 BACKGROUND
The Traffic Alert and Collision Avoidance System (TCAS) is an airborne collision avoidance system required since 30 December 1993 by the Federal Aviation Administration (FAA) on all air carrier aircraft with more than 30 passenger seats operating in United States airspace. TCAS works by actively interrogating other nearby transponder-equipped aircraft and tracking the transponder replies. For each aircraft, TCAS computes a tau value, or time-to-closest approach. When this value drops below a specified threshold, typically 25-30 seconds, TCAS issues a vertical command, or resolution advisory, to the pilot.
There are three levels of TCAS. TCAS II is described above and is the only level discussed in this report. TCAS I is intended for aircraft with 10-30 seats and has lesser capability; it displays only traffic advisories (position information) to the pilot, not resolution advisories (RAs). TCAS IV is currently under development and will include horizontal as well as vertical RAs.
In order to make the operation of TCAS more compatible with the existing air traffic control system as well as to correct a potential safety problem with unnecessary crossing resolution advisories, all TCAS-equipped aircraft were required to install a new logic version, known as version 6.04a, by 30 December 1994. Because Lincoln Laboratory and the FAA Technical Center (FAATC) had been working since 1991 in a cooperative effort to assess TCAS logic performance, both organizations were tasked to evaluate the 6.04a logic. The Lincoln Laboratory 6.04a evaluation is the subject of this report.
1.1.1 TCAS Development and Testing
During the development of TCAS, the MITRE Corporation has been responsible for development of the collision avoidance (CAS) logic, i.e., the algorithms that perform threat detection and maneuver selection. Lincoln Laboratory has been responsible for development of the surveillance logic, i.e., the algorithms for maintaining surveillance on other aircraft, and the coordination logic, i.e., the algorithms that ensure complimentary maneuvers between two aircraft in an encounter. It is the CAS logic that is the subject of this evaluation.
Testing of the CAS logic is done by means of software simulation of large numbers of aircraft encounters. MITRE has primary responsibility for the CAS logic testing, especially as it relates to assessing the operational impact and safety of different logic versions. FAATC became involved in the CAS logic testing in order to provide an independent check of performance and to provide an assessment of the strengths and weaknesses of the logic. In 1991, Lincoln Laboratory was tasked to work with FAATC to help organize and analyze the large amount of data produced by the FAATC simulation. The Lincoln Laboratory analysis programs proved to be an excellent predictor of logic problems and have been used to evaluate several versions of the CAS logic.
1.1.2 Logic Versions
In the 6.04a logic evaluation described in this report, there were actually three different logic versions examined - 6.02, 6.04, and 6.04a. This was due to the fact that all three versions operated simultaneously in the airspace for some period of time, and it was necessary to examine the interactions between versions. The three logic versions are described below.
1

Version 6.02 was the logic in use at the time that TCAS was first mandated (30 December 1995). Version 6.02 was considered to be operating as designed, but some controllers and airlines complained of nuisance advisories, primarily close to the ground and in specific airport geometries, notably Dallas-Fort Worth (DFW).
Version 6.04, a non-mandated version, was made available in late 1992 and was implemented by a few of the airlines in order to make the TCAS logic more compatible with the air traffic control system. Version 6.04 reduced the number of nuisance advisories primarily by reducing the protection volume about the TCAS aircraft and by raising the altitude threshold above which advisories would be issued. It also greatly reduced the nuisance advisories at DFW.
Shortly after the introduction of version 6.04, however, a safety problem (see 1.1.3 below) was discovered in both versions 6.02 and 6.04. Version 6.04a was developed to fix this problem. Version 6.04a was mandated in all TCAS installations by 30 December 1994, and in early 1994 Lincoln Laboratory was asked to use its analysis programs to evaluate the version 6.04a logic.
1.1.3 "Seattle" Encounter
The problem in the 6.02 and 6.04 logic occurs most often in a specific encounter geometry and was first brought to the attention of the TCAS community after an incident in Seattle, WA. The encounter geometry involves two TCAS-equipped aircraft with opposite sign vertical rates, intending to level-off 1000 feet apart. (See Figure 1-1.) Each TCAS, unaware of the level-off intent, models the intruder as continuing its high vertical rate and selects an "altitude crossing" maneuver as providing the best vertical separation. The incident in Seattle appeared to be precipitated when one aircraft obeyed the controller and leveled-off, and the other aircraft obeyed TCAS and crossed in altitude.
The general feeling in the TCAS community was that although it was undesirable for TCAS to have issued the crossing advisories, nevertheless if both pilots had followed the advisories, safe separation would have resulted. However, after extensive examination of this encounter in simulations, it was determined that safe separation could not be guaranteed. There were variations of the Seattle encounter in which both (simulated) pilots followed the TCAS advisories correctly, and yet less than 100 feet vertical separation at CPA1 resulted. This was due to a number of factors, including the timing of the pilot level-off and tracker lag in detecting the level-off, plus a logic flaw in the 6.02 and 6.04 CAS logic that could allow the wrong vertical "rate-to-maintain" to be displayed to the pilot (see Section 4.1). Version 6.04a was intended both to make crossing advisories less likely in pilot level-off situations and to correct the logic flaw (so that crossing advisories, when they were issued, would work properly).
A TCAS near mid-air collision, or NMAC, is defined as simultaneous altitude separation of < 100 feet and
horizontal separation of < 0.1 nmi. The simulations referenced in this report assume zero horizontal
separation; and thus in this report, vertical separation alone is used to determine NMAC status. In the
actual Seattle encounter described above, the horizontal separation was greater than 0.1 nmi, so a true
NMAC would not have occurred, regardless of the vertical separation.

Planned encounter
Encounter with Pilots following TCAS advisories
Figure 1-1. Seattle encounter.
1.2 GOALS OF THE 6.04A EVALUATION
There were three goals of the 6.04a evaluation:
(1) Compare logic versions 6.04 and 6.04a to determine if the 6.04a changes produced the expected improvements and to determine if any new problems had been introduced. This was a focused effort, using specific analysis tools to evaluate areas of the logic that had changed from version 6.04 to 6.04a.
(2) Do a general evaluation of the 6.04a logic, using all of the Lincoln Laboratory analysis programs, to detect and explain any areas of concern. This effort primarily pinpointed areas in which the 6.04a performance was much worse than the baseline 6.02 performance.
(3) Analyze every 6.04a NMAC produced by the simulation in order to understand the performance limits of the 6.04a logic. For those NMACs deemed likely to occur in the real airspace, discuss possible courses of action to improve the CAS performance.
The 6.04a evaluation effort was organized into three phases, each phase addressing one of the above goals.

1.3 ORGANIZATION OF THIS REPORT
Section 1 provides background on TCAS development and testing, including descriptions of the three CAS logic versions used to date. It also describes the major goals of the 6.04a evaluation effort.
Section 2 discusses the FAATC software simulation facility that provided the data analyzed by Lincoln Laboratory in this effort. The types of encounters present in the United States airspace are described, along with the process of defining large numbers of representative encounters used as inputs to the simulation.
Section 3 describes the five programs developed by Lincoln Laboratory to analyze the simulation outputs. The operation of each program is explained, and sample outputs are given.
Sections 4,5, and 6 correspond to the three phases (or goals) of the evaluation effort. Each section contains an overview of the approach taken, a description of the results, and a summary. Section 7 gives follow-up activities plus conclusions and recommendations.

2. SIMULATION DESCRIPTION
The 6.04a logic evaluation was a collaborative effort, in that the data analyzed by Lincoln Laboratory was produced by the FAATC's TCAS simulation facility. (Note that FAATC also performed their own analysis of the 6.04a logic. The FAATC analysis is not addressed in this report.)
2.1 FAST-TIME ENCOUNTER GENERATOR
The FAATC's TCAS simulation facility, referred to as the Fast-Time Encounter Generator (FTEG), allows execution of large numbers of encounter geometries in a short period of time. The FTEG consists of two main parts: the CAS logic, and an outer shell that calls the CAS logic once per second and handles the CAS inputs and outputs. Figure 2-1 shows the basic FTEG operations.
Because of the large numbers of encounters run (see Section 2.3), only summaries of key encounter outputs could be recorded. These summary files, called Encounter Recorded Data (ERD) files, were provided by FAATC to Lincoln Laboratory and were the basis for most of the Lincoln Laboratory analysis. However, to allow for a more detailed analysis of limited numbers of encounters, Lincoln Laboratory maintained a duplicate copy of the FTEG. For FTEG runs done at Lincoln Laboratory, it was possible to obtain a second-by-second print-out of aircraft position information and CAS logic variables.
Several versions of the CAS logic can reside in the FTEG. For the 6.04a evaluation, logic versions 6.02, 6.04, and 6.04a were present. TCAS-TCAS encounters were run with all pairwise combinations of the three logic versions, allowing comparison of 6.04a performance with that of earlier versions and detection of any interoperability problems between versions.
2.2 CONSTRUCTION OF ENCOUNTERS FOR SIMULATION
The simulated encounters used as inputs to the FTEG were based on, but not limited to, actual aircraft tracks recorded in United States airspace. The MITRE Corporation [1] generated a large database of pairwise aircraft encounters from aircraft tracks recorded at ARTS sites throughout the United States before the introduction of TCAS into the airspace. Using this encounter database, MITRE defined 10 encounter geometries (Figure 2-2), which encompassed all of the aircraft maneuvers observed. Each geometry was then divided into two classes, based on whether or not the aircraft crossed in altitude. The lower-numbered classes (0-9) are those in which the aircraft cross in altitude. The higher-numbered classes (10-19) are those in which the aircraft do not cross in altitude. Classes 0/10 share the same geometry, as do classes 1/11,..., 9/19.
For the FTEG simulation, large numbers of encounters were defined for each of the 20 classes by varying key parameters for each of the two aircraft in the encounter. These parameters included: planned altitude separation at CPA, vertical rate for each aircraft, vertical acceleration for each aircraft, time of acceleration for each aircraft, and altitude band in which the encounter took place. In the FTEG, the range of values used for aircraft vertical rates and accelerations slightly exceeded the typical values seen in the airspace. For example, FTEG vertical rates generally varied from -5000 fpm to +5000 fpm in steps of 2000 fpm, and FTEG vertical accelerations varied from -0.35g to +0.35g in steps of O.lg. This was done deliberately in order to try to characterize the

LOOP EACH SECOND FOR DURATION
OF ENCOUNTER
C START J
CREATE AIRCRAFT POSITION
I UPDATE
AIRCRAFT POSITION
I RUN CAS
LOGIC
I EXECUTE
PILOT RESPONSE
I COLLECT
DATA
I OUTPUT
SUMMARY DATA
f END J
SCENARIO DEFINfTION
FILES
SECOND-BY/ SECOND /(OPTIONAL) DATA
ENCOUNTER RECORDED
DATA (ERD),
Figure 2-1. Fast-time Encounter Generator.

CLASS 0/10 CLASS 1/11 CLASS 2/12 CLASS 3/13 CLASS 4/14
CLASS 5/15 CLASS 6/16 CLASS 7/17 CLASS 8/18 CLASS 9/19
u ^
(line segments with arrows represent aircraft vertical profiles.)
Figure 2-2. Encounter classes. (0-9 planned crossing; 10-19 planned non-crossing).
performance limits of the CAS logic and to predict problems that could potentially occur. Parameter variations used for each class are shown in Appendix A, "Scenario Definitions for TCAS II Testing."
In addition to varying aircraft rates, accelerations, etc., the equipage of each aircraft was varied, e.g., Mode C, TCAS version 6.02, TCAS version 6.04, and TCAS version 6.04a. In order to assess CAS logic performance, it was necessary to have the concept of a "planned encounter," i.e., an encounter as it would have unfolded if TCAS were not present. This was accomplished by running a particular geometry with a TCAS non-responding aircraft in an encounter with a Mode C aircraft. The performance of various TCAS equipages could then be compared to the planned encounter, to see if TCAS failed to resolve an existing NMAC or induced an NMAC where none had previously existed.
2.3 PARTITIONING OF SIMULATION EFFORT
In the 6.04a evaluation, because of the large number of encounters defined, there were three separate FTEG data collection/analysis efforts. The three tables below show the combinations of logic version and pilot response used in each of the three efforts. An x in a cell means that particular equipage/response combination was run. For example, in Table 2-1, an x in the 6.02

row and Mode C column means that encounters were run in which Aircraft 1 was equipped with TCAS version 6.02 and Aircraft 2 was Mode C equipped. For all encounters in Table 2-1, both TCAS pilots responded properly to the TCAS advisory. In Tables 2-2 and 2-3, there were encounters in which one pilot did not respond to (ignored) the TCAS advisory. See Appendix B for a breakdown of the numbers of encounters run in each table.
Table 2-1
Versions 6.02, 6.04, 6.04a Pilot responding
Aircraft 2
Aircraft 1 Mode C 6.02 6.04 6.04a
ModeC X X X
6.02 X X X X
6.04 X X X X
6.04a X X X X
Table 2-2
Versions 6.02, 6.04a Pilot responding/Pilot not responding (PNR)
Aircraft 2
Aircraft 1 Mode C 6.02 6.04a 6.02 PNR 6.04a PNR
ModeC X X
6.02 X X X X X
6.04a X X X X X
6.02 PNR X X
6.04a PNR X X

Table 2-3
Versions 6.04, 6.04a Pilot responding/Pilot not responding (PNR)
Aircraft 2
Aircraft 1 ModeC 6.04 6.04a 6.04 PNR 6.04a PNR ModeC X X
6.04 X X X X X
6.04a X X X X X
6.04 PNR X X
6.04a PNR X X
The full Lincoln Laboratory analysis as described in Sections 4,5, and 6 of this report was performed only on the Table 2-1 dataset (both pilots responding). Simulation results for the Table 2-2 and Table 2-3 datasets were examined briefly, but because overall performance is quite poor2
when one pilot does not respond to the advisory, it was deemed unproductive to analyze the encounters in depth. The fact that the pilot did not respond was felt to completely overshadow any other factors contributing to the poor performance.
Results for the Table 2-2 and Table 2-3 datasets were examined to see if any logic version was substantially better or worse than any other version when one pilot did not respond to the advisory. This did not appear to be the case; there was no significant difference in performance between versions when one pilot did not respond.
2 Note that when the pilot does not respond to the advisory, the simulation uses the planned maneuver, which may in some cases result in the aircraft moving opposite to the sense of the TCAS advisory, a
worst-case condition. In the Table 2-2 and 2-3 datasets, with one pilot not responding, up to 35% of the
encounters in some classes resulted in unresolved NMACs and up to 10% of the encounters in some
classes resulted in induced NMACs. (See Section 3.1.1 for definitions of unresolved and induced
NMACs.) Keep in mind, when discussing NMAC percentages produced by the FAATC simulation, that
the FAATC simulated encounters do not (are not intended to) exactly replicate the statistics of the actual airspace. As described in Section 2.2, the purpose of the FAATC simulation is to characterize the
performance limits of the CAS logic, to understand under what circumstances CAS functioning breaks
down. NMAC percentages given in this report do not reflect NMAC percentages that would occur in the real airspace.

3. ANALYSIS PROGRAMS
A block diagram showing the FAATC simulation facility and the Lincoln Laboratory analysis programs is given in Figure 3-1. There are five main analysis programs, described in detail in the subsections below. Main inputs to the analysis programs are the FAATC Encounter Recorded Data (ERD) files. As described in Section 2, Lincoln Laboratory maintained a duplicate copy of the FAATC simulation, and second-by-second data inputs from the Lincoln Laboratory simulation were also used by one of the analysis programs.
The performance metric used in all of the analysis programs was the vertical separation between the two aircraft at CPA. In general, encounters were either acceptable or not acceptable depending upon whether or not the encounter resulted in an NMAC, or near mid-air collision, defined as a vertical separation of < 100 feet at CPA. (Horizontal separation for an NMAC is defined to be < 0.1 nmi, but the FAATC simulations used in this effort assumed zero horizontal separation, and thus horizontal separation was not a factor.) All of the analysis programs can be adapted to use a criterion other than the NMAC; and indeed, as described later, in some cases performance was assessed using a larger vertical separation.
As described in Section 2, a key element in the measurement of performance was the "planned encounter," i.e., an encounter as it would have unfolded if TCAS were not present. This planned performance was compared to the performance of various TCAS equipages to determine if TCAS failed to resolve an existing NMAC or induced an NMAC where none had previously existed. According to international guidelines, for every 100 existing NMACs, the goal is for TCAS to be able to resolve 90 NMACs without inducing more than 2 NMACs.3 Thus, it is accepted that TCAS will not be able to resolve all NMACs, but there is a very low tolerance for TCAS-induced NMACs.
Referring to Figure 3-1, a brief summary of the five analysis programs is as follows. The Matrix Generator Program is the first program run and provides a means for very quickly and clearly understanding CAS logic performance (in terms of NMACs) as a function of encounter class (classes 1-20) and equipage pair (6.04a vs. 6.04a, 6.04a vs. 6.02, etc.). In cases where a detailed analysis is not required or possible, this single program can provide extremely useful overview performance information, both in absolute terms and in relative terms between the different logic versions.
The Hot-Spot Program takes the outputs of the Matrix Generator Program and identifies "hot-spots" or areas of poor performance. These hot-spots are then examined in more detail, first by the NMAC Characterization Program and then by the NMAC Analysis Program. The NMAC Characterization Program identifies particular parameters (vertical rate, acceleration, etc.) or combinations of parameters associated with the hot-spots. The NMAC Analysis Program scans through the encounter data for each of the hot-spots, providing a summary of key encounter
Note, again, that the FAATC simulation results cannot provide a direct measure of TCAS performance
with respect to the international goals because the FAATC simulated encounters are not weighted according to their occurrence in the real airspace.
11

2
a.
C
S 2
.8
8
s
■ i\S
S 2 8 g II) Olltü *i£8
12

elements, e.g., the sequence of advisories for each aircraft, timing delays in the issuing of advisories, etc.
Finally, the Performance Statistics Program is run on all of the input data. This program provides statistics on the frequency and performance of altitude crossing advisories.
3.1 MATRIX GENERATOR PROGRAM
The purpose of the Matrix Generator Program is to provide an easy-to-read summary of the number of NMACs as a function of encounter class and equipage pair and to provide a description of key parameters associated with those NMACs. Specifically, the Matrix Generator Program reads ERD files and generates two sets of outputs: NMAC tables and parameter files. The Matrix Generator Program is unique among the five Lincoln Laboratory analysis programs in that it was coded at FAATC based on Lincoln Laboratory specifications. The other four analysis programs were produced solely by Lincoln Laboratory.
3.1.1 NMAC Tables
There are five NMAC tables, or matrix tables, for each encounter class. The Matrix Generator Program generates these tables according to the scheme shown in Figure 3-2. First, the TCAS encounters for each class are divided into two groups: those whose corresponding planned encounter resulted in an NMAC and those whose corresponding planned encounter did not result in an NMAC. From the first group (planned NMACs), the program then looks at the vertical separations produced when the aircraft in the encounters are equipped with TCAS. The encounters are then divided into three subgroups:
A: neither aircraft had a resolution advisory (RA), but an NMAC resulted (TCAS had a missed detection);
B: at least one aircraft had an RA, but still an NMAC resulted (TCAS couldn't resolve the original bad situation);
C: at least one aircraft had an RA, but there was no NMAC (TCAS resolved the original bad situation).
From the second group (planned non-NMACs), the program then looks at the vertical separations produced when the aircraft in the encounters are equipped with TCAS. The encounters are then divided into three subgroups:
D: neither aircraft had an RA, and there was no NMAC (TCAS correctly did not perceive there to be a problem);
E: at least one aircraft had an RA, and there was an NMAC (TCAS induced an NMAC);
F: at least one aircraft had an RA, and there was no NMAC (TCAS issued a "nuisance" RA).
From the six subgroups, five tables are formed:
Table 1 = subgroup A (unresolved NMACs with no RA, i.e., missed detections),
Table 2 = subgroup B (unresolved NMACs with at least one RA)
13

TCAS ENCOUNTERS IN WHICH CORRESPONDING PLANNED
ENCOUNTER RESULTED IN NMAC
I NEITHER AIRCRAFT
HAD RA (MISSED DETECTION)
1 AT LEAST ONE
AIRCRAFT HAD RA
I NMAC NMAC NO
(UNRESOLVED) (UNRESOLVED) NMAC (A) (B) (C)
1
TCAS ENCOUNTERS IN WHICH CORRESPONDING PLANNED
ENCOUNTER DID NOT RESULT IN NMAC
I NETHER AIRCRAFT
HADRA
NO NMAC
(D)
1 AT LEAST
ONE AIRCRAFT HADRA
£—-J NMAC
(INDUCED) (E)
NO NMAC (NUISANCE)
(F)
Table x.l: number of unresolved NMACs with neither aircraft having an RA (missed detections) (A)
Table x.2: number of unresolved NMACs with at least one aircraft having an RA (B)
Table x.3: total number of unresolved NMACs (A+B)
Table x.4: number of induced NMACs (E)
Table x.5: number of nuisance RAs (F)
Figure 3-2, Scheme for generating NMAC tables.
14

Table 3 = Table 1 + Table 2 = total number of unresolved NMACs.
Table 4 = subgroup E (induced NMACs)
Table 5 = subgroup F (nuisance RAs)
Tables are labeled based on the encounter class and table number, e.g., Table 1.4 corresponds to class 1, induced NMACS. Generally, out of the five tables, tables 3 and 4, unresolved NMACs and induced NMACs, were used most frequently. Table 5, nuisance RAs, would require a larger vertical separation threshold to be of use. Currently, in Table 5, an RA is considered a nuisance RA if the vertical separation between the two aircraft is as little as 101 feet! Any further analysis of Tables x.5 should be postponed until a better definition of nuisance RA has been developed and new Tables x.5, based on the new definition, have been generated.
A sample table, Table 19.4, is shown in Figure 3-3. (Class 19 is the class in which the Seattle encounter occurs.) Note that the logic version "6.05" appears in the row and column labels. For compatibility with FAATC, some programs use the term "6.05" instead of "6.04a;" FAATC did this to more easily automate switching among logic versions. Throughout this report, the term 6.05 should always be considered equivalent to 6.04a. Note also that the table header refers to "simulation truth." The determination of an NMAC uses "true" simulation altitudes, i.e., the simulation's altitude inputs to the CAS logic, not the CAS tracked altitudes. Because of this, the Matrix Generator Program generates the NMAC tables with the results of the FTEG simulation from only one aircraft point of view, since simulation truth is the same for both aircraft points of view.
As shown in Figure 3-3, the number of planned TCAS-TCAS encounters is twice the number of planned TCAS-Mode C encounters, since in the TCAS-TCAS encounters, Mode S ID is varied and each geometry is run first with Aircraft 1 having the low Mode S ID and then with Aircraft 2 having the low Mode S ID. The varying of ID is necessary because the CAS air-to-air coordination logic differs slightly based on Mode S ED. If both aircraft select the same sense RA, the low ID aircraft prevails and the high ID aircraft must reverse sense. In some circumstances, the high ID aircraft delays up to three seconds in displaying an RA in order to guard against the pilot of the high ID aircraft seeing a coordination-induced reversal.
A full set of 100 NMAC tables (20 classes, 5 tables per class) is given in Appendix C.
3.1.2 Parameter Files
The parameter files provide a quick summary of parameter values for each of the NMAC encounters. Each line in a parameter file corresponds to one encounter. Since there is too much data to print each line on a single page, the lines have been broken up into three parts. Appendix D contains a complete description of the parameters in all three parts, as well as a sample parameter file printout for class 9/19.
3.2 HOT-SPOT PROGRAM
The purpose of the Hot-Spot Program is to identify areas of concern, defined as matrix table cells for which either: (1) logic versions 6.04 and/or 6.04a have more than twice the number of NMACs as version 6.02, or (2) both pilots respond properly to the advisories, yet more
15

than 2% of the encounters result in NMACs. Matrix table cells that satisfy the criteria in items (1) or (2) are said to be "type 1 hot-spots" or "type 2 hot-spots," respectively.
The outputs of the Hot-Spot Program are a compressed form of the NMAC tables called summary NMAC tables. The summary NMAC tables have the same table numbers as the NMAC tables from which they are derived, but there are only two summary NMAC tables per encounter class (tables x.3 and x.4, unresolved and induced NMACs), instead of five, as in the original NMAC tables. In addition, the numbers in the summary NMAC tables are not raw counts, but rather percentages (percentage of NMAC encounters out of the total number of encounters run) to allow for easy recognition of type 1 and/or type 2 hot-spots.
A full set of 40 summary NMAC tables (20 classes, 2 tables per class) is given in Appendix E.
3.2.1 Summary NMAC Tables
Figure 3-4 shows a sample summary NMAC table, Summary NMAC Table 19.4, which combines the cells from NMAC Table 19.4, shown in Figure 3-3. The formulas for deriving the numbers in the summary NMAC tables are as follows. Let Ni be the normalizing number for TCAS-Mode C cells in an NMAC table, and let N2 be the normalizing number for TCAS-TCAS cells. (Note that N2 = 2*Ni.) Let ajj be the entry in the i-th row and j-th column of an NMAC table, and let bjj be the entry in the i-th row and j-th column of a summary NMAC table. Then bij is derived as follows in Figures 3-3 and 3-4.
bn = a22/N2*100 bi2 = a33/N2*100 bi3 = a44/N2*100
bi4 = (a23+a32)/(2*N2)* 100 bi5 = (a24+a42)/(2*N2)* 100 bi6 = (a34+a43)/(2*N2)* 100
b2i = (ai2+a2i)/(2*N0*100 b22 = (ai3+a3i)/(2*Ni)*100 b23 = (ai4+a4i)/(2*Ni)*100
3.2.2 Type 1 Hot-Spot
As described above, the basic definition of a type 1 hot-spot is that logic versions 6.04 and/or 6.04a have more than twice the number of NMACs as version 6.02, the baseline version. An additional requirement is that the number of NMACs be large enough to be significant, defined generally as 1 percent of the encounters run. This significance threshold can be changed as desired. For example, in some of the analyses performed, Lincoln Laboratory generated NMAC tables and summary NMAC tables using non-standard NMAC definitions (e.g., 200 feet and 300 feet). In these cases, the number of NMACs increased dramatically, and the significance threshold was increased to 2%.
The word "twice" in the statement, "versions 6.04 and/or 6.04a have more than twice the number of NMACs..." is called the ratio threshold. Table cells that satisfy the ratio threshold criteria are indicated in Figure 3-4 by double asterisks (**). Table cells that also satisfy the significance threshold criteria are indicated by double greater-than signs (»). Thus, type 1 hot- spots are indicated in the summary NMAC tables by the symbols **».
16

MITRE encounter class: 19 "planned=NON CROSSING" Date processed: 6/21/94 TCAS Logic Version 6.04a; All aircraft responding. June 1994
Table 19.4
Number of induced NMACs (based on simulation truth)
Normalizing number* for TCAS-Mode C cells: 4008 Normalizing number* for TCAS-TCAS cells: 8016
<*nuiriber of planned encounters that did not result in an NMAC, based on simulation truth)
Aircraft 2 A Mode C 6.02 6.04 6.05 i Mode C — 48 132 115 r c 6.02 69 197 194 101 r a 6.04 68 223 233 105 f t 6.05 35 140 176 36
1
Figure 3-3. Sample NMAC table.
MITRE encounter class: 9, 19 Date processed: 6/23/94
Based on FAA Technical Center data of : 3/25/94 All TCAS Responding
Failure : separation at CPA <= 100 ft based on simulation truth
Ratio threshold (**) = 2.00 Significance threshold (») = 1.0
Table 19.4 — Percent of induced failures
6.02 only
6.04 only
6.04A only
6.02 / 6.04
6.02 / 6.04A
6.04 / 6.04A
TCAS-TCAS 2.458 2.907 0.449 2.601 1.503 1.753
One Mode C 0.961 2.495 ** »
1.871 — — —
Figure 3-4. Sample NMAC summary table.
17

3.2.3 Type 2 Hot-Spot
A type 2 hot-spot occurs when both pilots respond properly to the advisories, yet more than 2% of the encounters result in NMACs. Because in the dataset being evaluated, all pilots responded properly, any cell in the summary NMAC tables with a number greater than 2 is a type 2 hot-spot. Special attention was given to type 2 hot-spots in tables x.4, i.e., induced type 2 hot- spots. In these table cells, TCAS took an originally benign situation and induced (caused) an NMAC in more than 2% of the encounters.
3.3 NMAC CHARACTERIZATION PROGRAM
The purpose of the NMAC Characterization Program is to identify particular parameters (vertical rates, accelerations, etc.) or combinations of parameters associated with the hot-spots. There are two variations of the NMAC Characterization Program. The first variation looks at the NMACs occurring in a particular matrix cell and determines the frequency of certain parameters or parameter combinations. The second variation looks at the NMACs occurring in a particular matrix table and determines which NMACs are common to which versions of the logic. The programs may be most easily understood by the two examples below.
3.3.1 NMACs as a Function of Parameter Values
The first program variation determines the frequency of certain parameters or parameter combinations associated with a given set of NMACs. For example, consider class 19. As shown in Table 3-1 (taken from Appendix A), there are eight parameters in class 19.
Table 3-1
Class 19 Parameter Variations
Parameter Range Step Size No. of Steps
alt sep @ CPA -1000,1000 ft 250 9
vertical rate 1 1000, 5000 fpm 2000 3
vertical rate 2 -5000, 5000 fpm 2000 6
vert accel 1 -.15,-.05 .1 2
vert accel 2* .05, .35 .1 4
time accel 1 25 sec 1
time accel 2 20, 30 sec 5 3
alt 1 at CPA 3700, 7500 ft 3800 2
* Sign of acceleration is opposite sign of vertical rate
Now look at Table 19.4 (Figure 3-3) and at a particular cell (4,4) in that table, i.e., Class 19, induced NMACs, versions 6.04a/6.04a. The table shows that there were 36 NMACs in that cell.
Figure 3-5 shows an output from the first NMAC Characterization Program corresponding to that same cell. Note that the headings on the top right of the table correspond to the eight parameters in Table 3-1 above. For each of the eight parameters (plus a ninth - Mode S ID), the
18

output shows the frequency with which particular parameter values occurred in the 36 NMACs. For example, looking at the column labeled "count," we see that of the 36 NMACs, there were 16 in which Aircraft 2 had the higher Mode S ID and 20 in which Aircraft 1 had the higher Mode S ID. Likewise, moving down the column, we see that 2 of the NMACs had a planned separation of 1000 feet, 6 had a planned separation of 500 feet, 9 had a planned separation of -750 feet, and 19 had a planned separation of -500 feet. This type of output shows quickly whether any parameter value was especially troublesome.
The program next looks at all possible combinations of parameter values taken two at a time, and determines the number of times each parameter pair occurs, e.g., how many times an NMAC occurs with both aircraft having vertical rates of, say, 5000 fpm. The program then looks at all possible combinations of parameter values taken three at a time, then four at a time, etc. The print-outs from each program iteration allow quick recognition of parameter combinations responsible for a significant proportion of the NMACs.
Appendix F lists NMACs as a function of parameter values for all classes, tables x.3 and x.4 (unresolved and induced NMACs), 6.04a/6.04a. Only the case of parameters taken one at a time is included.
3.3.2 NMACs as a Function of Logic Version
The second program variation looks at the NMACs occurring in a particular matrix table and determines which NMACs are common to which versions of the logic. For example, in Table 19.4 (Figure 3-3), the 6.04/6.04 cell shows 233 NMACs, while the 6.04/6.04a cell shows 36 NMACs. This program allows us to answer questions such as, "Are the 36 6.04a/6.04a NMACs a subset of the 233 6.04/6.04 NMACs? Did the 6.04a logic introduce new NMACs not present in the 6.04 logic?"
Appendix G lists NMACs as a function of logic version for all classes, tables x.3 and x.4 (unresolved and induced NMACs), versions 6.04/6.04 and 6.04a/6.04a.
3.4 NMAC ANALYSIS PROGRAM
The purpose of the NMAC Analysis Program is to understand why an NMAC occurred for one particular TCAS equipage pair and not another, e.g., why a 6.04a/6.04a encounter had an NMAC but a 6.02/6.02 encounter did not. The program output is a set of encounter summaries, giving key information about the motion of both aircraft, the CAS logic thresholds in use, the specific event that triggered the RA, and the sequence of RAs. For the 6.04a analysis, three sets of encounter summaries were always printed together, allowing quick comparison of the differences between logic versions 6.02,6.04, and 6.04a.
19

oo
oo i oo
mh- r*.ro
•NX mu — o<i- O
i moo i • «MtOfM '
CO i i i * i ■ i i iiiiiiiitit*ii>*>*<
i i i i i i i i «tiittiiiitiiiiiiii
-NU I CJ«J I
«»»-0 EUU
"O 111 4NMI- *DU< 3<ee
•■^
o X
«i«-i-
«KOC
0.11I UM
in in in in in in m ►0 0 CM «-If-CM
itiiitii i i i t i i i ••••••••iiii I I I I I I I I IIIIIII OOOOOOO til«!
I I I I I I I I I I I I I I I I
in in o*-
■ oo ■ ■
i i i i ■ i
OOOO
I I I I I ■ I I i OOOO IIIIIIIIIIIIII I I I I I I I I I OOOO ill • • •
OOOO mtorom
oo o ■ l i I l l OO Olil******1*1'111*1
I • I I • I OO O I I I I • • IIIIIII oo o «-in rn
oooo oooo
it •■••if iiiiiiitiiiiiiiiiii
i■OOOOii IIIIIIIIIIIIIIIIIII
oomo omMn «— i •
3
5»
2
O «
<3
0
m
•o 3
> i.» WO
•>*» O _. «U HE • — fl-d **••-.£ — BO 3Q.U X
-O E H- E O ozu
^*. E-O I- O E ZUZ 3 OIMM uuu
uuu C<Ot «I 3 «MO 0*0 111 «< <- u.«-0
UUI I <
3 -I O. O ec u OL3 -IO -JQ£
< ►
o< Of —I O-U
llllll IIIIIIIIIIIIIIIIIII tlllll IIIIIIIIIIIIIIIIIII
«OOCM-OOOOO «*ror*-»C0in«-«-r'll'>*Ol>--l>*-Or«.r«*rvJ**CM »-CM «- CM «-»-IM CM«-CM
oooooooo OOOOOOOOOOOOOOOOO»-«- OOOOOOOO 00000000000000«-«-«-00 OOOOOOOO OOOOOOOOOOOOOOOOOOO OOOOOOOO OOOOOOO«— «-«-«-«-«-«-OOOOO OOOOOOOO 00000*-«-000000000000 OOOOOOOO 0«-«-«-«-00000000000000 OOOOOO«-«- «-000000000000000000 OOv-t-t-v-OO OOOOOOOOOOOOOOOOOOO «-«—OOOOOO OOOOOOOOOOOOOOOOOOO
«-«-CM IM CM CM**«* ^c0e0e0C0O<0eMCMIMCM«M«M«M«0«0e0<0«0 •-•-KiioioMroioiOfMCMCMinin
«-«-«- CM CM
m in mm in in in in minininmininininmininmininmininm *o*0'0'0'0>o*0'C %ü*0*0*0*0*0*0*0*0*0*0*0*0*0*0*0*0*0*0
mtnminmmmin in in m in in in mm in in in mm in mm in in m *0*0*0<0<0<0*g«0 *O*O*0*O*O*O*O*O*O*O-0*0*0*0*0*0*0*0*0
** ******** ****** ************ ** ****************** ******
**************** ^*^ ************************ **********
**************** ** ****************************** ******
OOOOOOOO OOOOOOOOOOOOOOOOOOO
3
.3.
I
2. 3
20

3.4.1 RA Trigger Program
As a part of the NMAC Analysis Program, an RA Trigger function was run for each aircraft to determine what test in the CAS threat logic was the last test to be satisfied, i.e., what test triggered the issuing of the RA. This information can be useful in understanding the timing of an encounter, in particular why one version of the logic issued an RA much earlier or later than another version.
The basic conditions for triggering an RA are satisfied when two tests (range and altitude) are satisfied in the CAS logic [2], as illustrated in the flowchart in Figure 3-6. Both tests use the concept of tau, or "time to closest approach." The range test requires that TAUR (a modified form of the range tau) be less than TRTHR (range tau threshold). The altitude test can be passed by following one of the three paths illustrated. These paths compare the values REL_Z (relative altitude between the two aircraft), PVMD (predicted vertical miss distance), TAUV (vertical tau), and HMD (horizontal miss distance) to the thresholds ZTHR (altitude threshold), TVTHR (vertical tau threshold), and DMOD (modified distance threshold) and the value TRTRU (true range tau, i.e., range/range rate). See Appendix H for a summary of CAS thresholds, layers, and sensitivity levels.
Even when both the range test and altitude test are satisfied, the RA may not be issued immediately because one of a number of delays may be in effect. For example, there can be a delay of up to three seconds in posting an RA in the higher-ID aircraft in a coordinated encounter. The list of possible delays is shown as a part of the Encounter Summary field descriptions in Figure 3-8.
3.4.2 Encounter Summaries
A sample set of three encounter summaries is shown in Figure 3-7 with a description of the fields in Figure 3-8.
A brief look at the encounter summaries illustrates the kinds of information quickly provided. First, by looking the first line, fourth field of each summary (achieved vertical separation), one can tell immediately that version 6.02 did not have an NMAC (achieved separation = 1004.89 feet), while both versions 6.04 and 6.04a had NMACs (achieved separation = -28.78 feet). Looking at the fourth and fifth lines, in version 6.02, AC2 issued an RA ("limit climb to 2000 fpm") at time 34 seconds (26 seconds prior to CPA, which occurs at 60 seconds), and AC1 issued an RA ("maintain climb") at time 38 seconds. The RAs were non-crossing, i.e., did not cause the aircraft to cross in altitude. In contrast, in both versions 6.04 and 6.04a, the RAs came much later, at times 44 seconds and 46 seconds for AC1 and AC2, respectively. (This was due to the smaller 6.04 and 6.04a tau values (TAUR, TAUV) and smaller altitude threshold value (ZTHR); see second line.) By time 44 seconds, the geometry was significantly different from that at 34 seconds, and with version 6.04 and 6.04a both aircraft issued crossing commands (AC1 issued a "descend" RA, later changed to an "increase descend," and AC2 issued a "climb" RA, later changed to an "increase climb.")
21

Range Test:
Altitude Test:
TAUR < TRTHR
£ IREL_ZI<ZTHR
and IPVMDI < ZTHR
PASSED
Path 1
and
or
1 IREL_ZI > ZTHR
and IREL_Z ratel < ZDTHR
TAUV < TVTHR and
l IPVMDI > ZTHR
and TAUV < TRTRU
PASSED -*
Path 3
Figure 3-6. CAS logic conditions for triggering an RA.
22

00 ro ro ^ in m CE) CE>
co
CE)
CO rH W W Q Q Q 1-3
X
H
o ro in o CO o r- CO >*
PS o CE> C2> o CE) to, o <E> CE) w o o PS o H o r-
ro o
ro W EH
o r- ro £5 o i-H PS o 00 .J *z o CO 1-3
O o r3 O w o w o 2 o w CJ CJ T o ►-3 H ro Q H O ro Q M z
II o — — o
II o — CJ Z w
II o — o 2 o § s u S o ^•^ ( ( 1 a o ,—. r—I
2 M CM z M CM Q 3 o M CM Q ^ M 1-3 1 X X w. a 1 fct z ►H- 1 h pc oo < z z < a X M < Q >s oo *—' '—» CD ■^^ *—• CO
>—' t—f
o o z o CO o PS M • O • o O IT) 00 o in PS O in
1 • CM CO *r 00 • CM T VO CJ • CM ^" vo • z IT) 1 ro ro O o I ■^ ^ O I ^r ^r &3
o CM <S) e> PS CM <E> C") CM <E> GJ z o U
II ►3 CM
II in rH 3
EH 00 r~
II m rH
EH I
CTl % o 1
o a Ü CO 5 o
1 O PJ CO £ o
I O 04 ^ 00 < r- < CM < • H — — • EH — — 1 EH — — h.
*r m 00 m in 5> o rH N oS CM rH N> ts) rH Kl SI o • J D 1 • ►4 a • *1 r? rH o o
1 u oo « in g o o
1 S § en o o
1 s g in — <2> O — rH o — K CM ^-* CM *«■* CM *->. t§ CTl o CTl CTl CT> o o o o o o
rH • rH t-H i-H • co 00 • ro ro K II o •• CM • • II o • • • • II o • • • • K Q K a s «A
ik 3
#60
PS D
o W iJ g PS D
o S g PS g o g g J < o M — M J < o M rH < < o M M PS in o E-i EH PS EH o EH EH <3* EH o H EH
o o o o CM ro < < ^ ro < < • ro < < c*; o
o *— EH EH o
o
,w' EH EH vo o
*■*• H H
ID > CM CM VO • ro ro CO ■ T •^r o ^-^ CM CM o ^^ ro ro > o .—* «r T
00 in o i-l O co o o rH o o o rH o > r- CM CM > VO • -3« "tf rn lO • in m
o lO VO o vo lO o ID vo E ^ i-H CM §
V rH CM ^ rH CM 05 II o CM CM II o CM CM II o CM CM ^ ^ • ^ ». < • ^ *. CM PS o [M CM *»• PS o PS CM ■5T PS o NI CM O a: o CJ u o aa o O PS O a o S CS3 - H o CTv w • H o en O • H o crv >H <£> IS] ro rH cr> VO N ro rH <J\ VD N ro rH CD
* CTl
►H-
rH rH CTl 1-3
rH
m o CJ J •*r o a r^ «tf o U >A co CJ ro • u ro • CJ 00 o CO o • • • • CO o •• • • 00 II o rH CM CO ii o rH CM CO II o rH CM CM in u CJ CM in o CJ CM m o CJ
,-q \ \ r3 \ \ >J ^ ^ co < < oo
23
< < 00 < <

CO 5 >• z o a. o < 5 -l LU Q
CO
O DC O < <
>-
LU o
>• z o DC u <
«5
q
%
!
ü ü
s
s K S 8
oo i
<*> V. a
24

3.4.3 Encounter Plots
To aid in the interpretation of the encounter summaries, encounter plots were also produced. A shell program was written to automatically operate the Lincoln Laboratory version of the FTEG simulation. For a specified encounter, the shell program made calls to FTEG and produced immediate hard-copy output of the second-by-second encounter summaries from each aircraft point of view. Variations of the shell program were also used to analyze the effects of variations in pilot response delays, run selected encounters geometries (e.g., Seattle encounters), and extract aircraft altitude and altitude rate histories.
Figure 3-9 shows the output of the basic version of the shell program. Here, second-by- second position information is shown for the 6.04a encounter described in Figure 3-7. AC1 is shown starting from the left side of the page with AC 1 time along the bottom of the plot. AC2 is shown starting from the right side of the page with AC2 time along the top of the plot. The RAs issued are superimposed on the aircraft position. As you can see from the plot, AC2 was climbing and had just begun to level off when the climb RA was issued, i.e., the RA was opposite to the intended direction of the aircraft. With a pilot response delay of 5 seconds, there was not enough time to regain the climb momentum and achieve adequate separation.
The encounter summaries and encounter plots were used throughout the 6.04a analysis effort to quickly understand the essence of the encounters.
3.5 PERFORMANCE STATISTICS PROGRAM
The purpose of the Performance Statistics Program is to provide statistics on the frequency and effectiveness of altitude crossing advisories. Figure 3-10 shows a sample output from the Performance Statistics Program for class 19. Performance statistics for the full 20 classes are given in Appendix I.
As shown in Figure 3-10, for each TCAS equipage, there are eight statistics computed:
(1) the percentage of encounters that produced RAs;
(2) the percentage of RAs that were crossing RAs;
(3) the percentage of encounters that produced crossing RAs;
(4) the percentage of crossing RAs that resulted in NMACs;
(5) the percentage of NMACs that were crossing RAs;
(6) the percentage of encounters that resulted in NMACs;
(7) the average warning time in seconds (time of CPA minus time of RA);
(8) the average altitude separation at CPA in feet.
Remember that class 19 is defined as a non-crossing class (i.e., the aircraft do not plan to cross in altitude), but as shown in the second row, for version 6.02 nearly 40% of the RAs issued were crossing RAs. Note also that in the fifth row, for most of the equipage pairs, 100% of the NMACs were crossing RAs. This type of information was important in the 6.04a evaluation effort and is discussed in detail in section 4.2.1.
25

o o o in
o o o o o o CO
o o o CM
o o o
o
o
1 1 1 ■ r——i 1 r 1 1 1 1 r —i 1 1 1 X
/■
o
X
/ CM
O
V X*
X
CO
O X
•
o
■
o—*£ ■
in
o
i X
A » ■
X> 1 x> 1 JO ,
•
CD
CO UJ .'
! *> 1 X»
X) I |X> 1 o '
I 1
X < c c c 1 <
5" T> " ) © : c ; c a «
O a *t
0 «0 rf m
h«. CO in ,, < • 1
I ; •
© © © © D < j •D n n "o
3 3 3 3 .
O
CC as as as as < < < <
CO
O
- \ i
** i \ !
X
3333 T- T- CM CM
O
- \
o X j
o
- \ \ \
o CM i i i i I i ■ t i i . . . .
\ e 1 . . .
CM
O O
O
O CO
o
o CO
o in
o
o CO
o CM
w ■o c o Ü CD
CO c CD
E
o o o in
o o o
o o o CO
o o o CM
o o o
« Ö
199J ui epn;mv
26

Looking at the header information in Figure 3-10, two items need explanation: lines 3 and 4, which state, "Total TCAS-TCAS runs for both points of view : 279616," and "Total incorrectly labeled RAs: 320." According to Appendix A, there were a total of 139,968 TCAS- TCAS encounters run in classes 9/19. (139,968 = 7776 (the number of variations that result from varying the eight class parameters) x 18 (the number of different TCAS-TCAS equipages). Results in Figure 3-10 are given for both aircraft points of view, hence 279,936 total runs processed. Of these, there were 320 encounters in which the determination of "crossing RA" was deemed ambiguous4. These encounters were not used, resulting in a total of 279,936 - 320 = 279,616 runs used in Figure 3-10.
The explanation for the ambiguity in determining crossing RAs is as follows. An RA is considered to be non-crossing from own aircraft point of view if, at the time that own aircraft selects an RA sense, own
tracked altitude (zown) and intruder tracked altitude (zint) are within 100 feet. In addition, an RA is
considered to be crossing from own aircraft point of view if, at the time that own aircraft selects an RA sense, either:
(1) zown > zint and the sense of the RA is descend
or
(2) zown < zint and the sense of the RA is climb.
For some of the encounters in the FAATC simulation, there was an early "potential RA" that did not develop into an RA. That is, the range and altitude tests had passed and the intruder had qualified as a
threat, but the RA was being delayed for some reason (e.g., track firmness). However, by the time the
delay was completed, some threshold had changed (perhaps own aircraft had climbed into a higher
altitude layer with larger tau values) and the intruder was no longer considered a threat. Then, sometime
later in the encounter, the range and altitude tests passed again, and this time an RA was issued.
The problem occurs because the values of zown and zint are not recorded in the ERD files each second.
They are recorded only at a few key times, one time being the time of the first RA. In these "ambiguous" encounters, the values of zown and zint were recorded at the time of the early potential RA and not at the
time of the real RA. Thus, we had no recorded data to use to perform the crossing/non-crossing tests described above. Therefore, these encounters were simply thrown out.
27

MITRE encounter classes: 9,19 Date processed: 6/23/94 Based on FAA Technical Center data of: 6/20/94 Total TCAS-TCAS runs for both points of view : 279616 Total incorrectly labelled RAs : 320
Class 19 TCAS - TCAS Both Responding
I 6.02 | 6.04 | 6.04A | 6.02 / | 6.02 / | 6.04 / I only | only I only | 6.04 | 6.04A I 6.04A
RAs/ | runs (%) |
1 84.761
1 71.041
1 70.591
1 79.991
1 79.711 70.661
Crossing RAs/I RAs (%)I
1 39.681
.1 32.951
1 22.941
1 35.841
1 32.191 28.921
Crossing RAs/I runs (%) |
1 33.631
1 23.411
1 16.191
1 28.671
1 25.661 20.431
Cr. RA NMACs/l cross RAs (%)|
1 6.831
1 11.581
1 2.52|
1 8.47|
1 5.42| 7.901
Cr. RA NMACs/l NMACs* (%)|
1 100.001
1 100.001
1 100.001
1 100.001
1 99.581 99.641
NMACs*/ I runs (%) |
1 2.301
1 2.711
1 0.41|
1 2.431
1 1.401 1.62|
Avg warning I time** (sec)I
1 21.701
1 19.801
1 20.681
1 21.311
1 21.821 20.201
Avg alt sep 1 at CPA* (ft)1
1 937.481
1 863.741
1 970.621
1 917.051
1 972.811 911.84 1
* NMACs and average alt. sep. at CPA are based on simulation truth ** Average warning time includes negative times (ie, RA occurs after CPA)
Figure 3-10. Performance Statistics Program, Class 19.
28

4. ANALYSIS - PHASE I
4.1 DESCRIPTION
The purpose of the Phase I evaluation was to compare logic versions 6.04 and 6.04a to determine if the 6.04a changes had produced the expected improvements and if any new problems had been introduced. The procedure was to first focus on those areas of the logic that had changed in 6.04a and examine the corresponding outputs to see if the expected improvements had materialized. The second effort involved doing a quick overview of all of the classes to see if there were any areas of performance degradation with the 6.04a logic.
There were three main changes made to the 6.04 logic to produce the 6.04a logic, all related to altitude crossing RAs. As stated in reference [3], they were:
• A modification to declare an intruder a threat if, having already qualified in range, it and own aircraft are projected to cross altitudes within the vertical time threshold, even if the aircraft are projected to cross by more than ZTHR ft. This will result in possible early selection of a non crossing RA.
• A modification to permit the Altitude Separation Test (formerly the 600 ft Rule) to operate in all encounter geometries (not just when the TCAS aircraft is level) and for all threat equipages (TCAS, non-TCAS). The threshold will remain at 600 ft for encounters where either own or the intruder is level, or have vertical rates of the same sign. For encounters involving aircraft having opposite sign vertical rates, the threshold is set to 850 ft to provide additional warning time. These modifications will serve as a very strong bias against issuing RAs to cross altitudes.
• A correction of an error that permitted the logic to reduce a higher displayed vertical rate to 2500 feet per minute (fpm) if own aircraft slackened its rate below 2500 fpm. This correction will ensure that the logic continues to display the proper rate-to- maintain in those situations where crossing is necessary rather than displaying a reduced rate that may not adequately resolve the encounter."
Thus, the first two changes were intended to reduce the likelihood that an altitude crossing RA would be issued. The third change corrected a logic error, so that if a crossing RA were issued, the RA would be more likely to work, i.e., the encounter would be more likely to result in safe separation. The effect of each of these three modifications could be easily checked using the Lincoln Laboratory analysis tools.
4.2 RESULTS
4.2.1 Seattle Encounter
The Seattle geometry had been the impetus for the 6.04a logic, and thus the first (and most important) evaluation step was to verify that the 6.04a logic correctly handled the Seattle geometry. As stated in Section 1.1.3 and shown in Figure 1-1, a Seattle encounter involves two TCAS- equipped aircraft with opposite sign vertical rates, intending to level-off 1000 feet apart. To correctly handle the Seattle geometry meant that the 6.04a logic, at best, would issue no altitude
29

crossing RAs, or at worst, would correctly resolve any crossing RAs issued. There would be no cases in which the pilots responded properly yet adequate separation was not achieved.
The Seattle geometry is a subset of class 19, the class in which both aircraft start with a vertical rate and both level-off. The Seattle subset limits the encounters to those in which the two aircraft have opposite sign vertical rates and the planned altitude separation at CPA is 1000 feet. Using the Lincoln Laboratory copy of the FTEG simulation, Lincoln Laboratory ran over 75005
variations of the Seattle encounter. The results are shown in Figure 4-1, an output from the performance statistics program.
The most important piece of information in Figure 4-1 is in the second row. Note that for versions 6.02 and 6.04, approximately 30% of the RAs issued were crossing RAs. For 6.04a, not a single crossing RA was issued. Likewise, as shown in row 6, both versions 6.02 and 6.04 had approximately 6% of the runs result in NMACs, while version 6.04a had no NMACs. This shows that, for the FTEG dataset, 6.04a completely resolved the Seattle encounters.
4.2.2 Other Classes With Crossing RA NMACs
There were other geometries in addition to the Seattle geometry in which (with versions 6.02 and 6.04) crossing RAs were being issued in planned non-crossing encounters with resulting NMACs. The most susceptible geometries were those in which at least one of the aircraft started with a vertical rate and then leveled-off. Looking at Figure 2-2, we see that this applies in four of the 20 classes: 13,16,18, and 19. Class 17 also exhibited some of this susceptibility.
From the matrix generator program, histograms (Figure 4-2) were generated showing the number of induced NMACs for versions 6.04 and 6.04a for these five classes. The first thing to note is the substantial reduction in NMACs with version 6.04a. (In class 19, remember that 6.04a resolved all of the Seattle encounters, not all of the class 19 encounters. The remaining NMACs in class 19 were generally those in which the planned separation between the aircraft was 500 or 750 feet.) In all five classes, there were only three encounters (out of hundreds of thousands of encounters) in which the planned separation was 1000 feet and an NMAC resulted. (These three encounters are examples of one specific geometry that is discussed in Section 7.1. Plots are shown in Appendix K.)
In order to more fully understand the effect of the three 6.04a logic changes on classes 13, 16, 17, 18, and 19, the performance statistics program was used to determine how much of the 6.04a performance improvement was due to the fact that crossing RAs were issued less frequently and how much improvement was due to the fact that crossing RAs were more likely to work when they were issued.
From the scenario definitions in Appendix A, there are 432 variations of the Seattle encounter that result
from varying the class parameters (vertical rates, accelerations, etc.). Multiplying 432 by the number of
different TCAS-TCAS equipage pairs (18) gives 7776 different Seattle encounters. Results in Figure 4-1 are given for both aircraft points of view, hence 15,552 total runs processed. Of these, there were 31 runs
in which the determination of "crossing RA" was deemed ambiguous (see Note, Section 3.5). These
encounters were not used, resulting in a total of 15,521 runs used in Figure 4-1.
30

CM m m
en ..
CM a>
VO >
CO i> to e
£ ° DiÄ
P CD o P J3 id Q M o
>w
co _, ß co a
CD ■p to
§' ß CO
PrH id 4J (1) o W EH
ß -H ■o ß o o, co a>
A P o
co
Ö
CO
6
00 tr r- VO o cn CM t-
•->. < VO «— o r- o cr> r- rH 1* • • • • » • »
■>* o VO in CM <? o CM CO VD o • r~ ■-I rH CM o CM VD
. VO rH CO VD rH
o> o o> rH VD CM CO m ^■< m VO rH O CM CH CM CM
*3> CM O CM « VO "V CTl CO •^ CO O • CO rH rH CM Ch CM VD
• VD CO VO rH
r» VO cn CM O CM rH r~ ■v. 0\ m rH rH O n cr> CO
■q» » • * * • • • • CM O CM rH VD •^ o VD CO CM O - CO CO CM CM o CM >a«
• VO rH CM vo ■ rH
■*S* O o O O o in in P» O o O O o CM CO
< ^ «tf >1 m O o O O o ■* r- O rH r- CM o
• ß m VD O t-t
lO VO r- O O VO t~ r- CO CT> r-l O O m >* r-
■w >i r-. 01 CO ■*!• O in CO m O .H r- CM CM CM O CM co
• ß rH CM VO o i-i
on 00 rH m o o r- in in CO CO r» o VD rH rH * * • • • ■ • •
IN >i ^ CM r» CO o VO -s1 ■*
O rH 00 co CM CM o CM •*}• • ß rH CM
VO o rH
*~^ ^—. -^ «-^ ^ -^ V. ^ >-^ *»—* ^■^
*> CO rt» CO *• CO #> co <*• cv> o +J >■*•>
ST o~ N—<* Ö> 0) ß CO •H *— ß
ftVH
CO
ß ß v» u ■p * -H •H
5 co 2 » * rd * rH < CO co CO s * CO CH
-■*. CO CO co co CO Ü O cn 0) o «I ß O «0 O ß • o ö ß o> g o>
! £S 1-1 ri 1 o 2 ÖS u u
o Ü U 2
2 H 5H <: P
> -u < cd
< en o
M Ä CP J-> -P
M id
3 SS •H CO ^
CD ß -H O ^
"O w CD CD CO g cd -H Ä -p 8 CD fl> rK U > bj cd -H
p ^ < |d «3 tu b> <3 L) CD <u
ß to
Si 3
_6o
31

< o o <o to
O)
immmd
00
to
a ü i_ CD
■»-»
C
O ü c
UJ
3
!
.00
CD
CO
CO CM
sjsiunooug pauuey jo %
32

Table 4-1 summarizes some of the performance statistics outputs. As shown in row 1, in all five classes, the two logic versions produced essentially the same percentages of RAs. As shown in row 2, in all classes except class 17, some improvement resulted from the fact that there were fewer crossing RAs (xRAs) issued. This improvement ranged from class 13, in which the ratio of crossing RAs to RAs dropped from 19% to 15%, a factor of 1.3 improvement, to class 16, in which the ratio of crossing RAs to RAs dropped from 24% to 14%, a factor of 1.7 improvement. The more dramatic improvement occurred, however, from the fact that when crossing RAs were issued, they were more likely to work. As shown in row 3, this improvement ranged from a factor of 1.4 for class 17, in which the ratio of NMACs to crossing RAs to RAs dropped from 24% to 17%, to a factor of 13 for class 16, in which the ratio of NMACs to crossing RAs dropped from 4% to 0.3%.
These results are very positive. The 6.04a logic appears to indeed be operating thus far as intended. However, one issue relevant to Table 4-1 must be mentioned. Some variation has been reported [4] in the ability of aircraft displays to display the correct vertical rate in high-rate encounters. Table 4-1 shows that the logic now properly computes the required vertical rate-to- maintain in crossing encounters. But if the display cannot properly communicate this information to the pilot, then 6.04a will still induce an undesirable number of NMACs because, as shown in row 2, there are still crossing RAs being issued. Aircraft display capability is the subject of a CRF (Change Request Form) for TCAS version 7.0.
Table 4-1
Performance Improvement Breakdown
Class 13 Class 16 Class 17 Class 18 Class 19
6.04 6.04a 6.04 6.04a 6.04 6.04A 6.04 6.04A 6.04 6.04A
RAs/runs 59% 59% 78% 78% 72% 72% 79% 79% 71% 71%
xRAs/RAs 19% 15% 24% 14% 2% 2% 17% 11% 33% 23%
NMACs/xRAs 4% 1% 4% 0.3% 24% 17% 3% 2% 12% 3%
4.2.3 Overview of All Classes
As shown in sections 4.2.1 and 4.2.2, the 6.04a logic changes produced the desired effects in reducing the number of NMACs due to crossing RAs in planned non-crossing geometries. The next step was to briefly examine the performance of 6.04a relative to 6.04 in all encounter classes to look for any 6.04a performance degradation.
Using the NMAC Characterization Program, we looked at the unresolved and induced NMACs (tables x.3 and x.4) for all 20 classes for the two cells 6.04/6.04 and 6.04a/6.04a. All of the NMACs in the two cells were examined to see which NMACs were common to the two versions and which NMACs were unique to either version 6.04 or 6.04a. Figures 4-3 and 4-4 show all of the tables for which there was any difference in the operation of 6.04 and 6.04a. That
33

is, in all other x.3 and x.4 tables, the NMACs in cell 6.04/6.04 were the identical to the NMACs in cell 6.04a/6.04a.
Figure 4-3 uses the standard NMAC (100-ft separation at CPA) as the performance metric. Figure 4-3 uses a 200-ft separation as the performance metric. Throughout the evaluation effort, it was standard practice to use both 100-ft and 200-ft separations, and sometimes a 300-ft separation, to ensure that nothing substantially different happens when a different standard of performance is used. The thinking was that achieved separations of 100-200 feet, while not NMACs, are still less than the TCAS separation goal and warrant concern. Because the shapes of Figures 4-4 and 4-5 are almost identical (just different by a factor of 2), the conclusion was that nothing substantially different occurs (no new areas of concern appear) when a larger performance metric is used. Therefore, a detailed examination was done only of Figure 4-3.
Four things stand out immediately in Figure 4-3:
(1) Out of the 40 tables examined (20 classes, tables x.3 and x.4 for each class), only 11 tables had differences in NMACs between versions 6.04 and 6.04a. Of these 11 tables, all but one (6.3) are tables of induced NMACs, i.e., tables x.4.
(2) Looking at tables 6.3 and 6.4, we see that for class 6, version 6.04 had more induced NMACs and version 6.04a had more unresolved NMACs.
(3) In all of the tables shown except two (16.4 and 17.4), 6.04a introduced some new NMACs that were not present with 6.04.
(4) There are three tables in which 6.04a performance was worse than 6.04 (6.3, 7.4, and 9.4).
Regarding item (2), the trade-off between unresolved and induced NMACs in versions 6.04 and 6.04a can be explained by (and is an excellent example of) the first two 6.04a modifications listed in Section 4.1. All of the class 6 unresolved NMACs unique to version 6.04a (see table 6.3, second bar) have a planned separation of 0 feet. In this encounter, 6.04a modification 2 comes into play. Both versions of the logic select a crossing RA. Version 6.04a holds off issuing the RA because of the altitude separation test, waiting for the aircraft to come within 850 feet of each another. The RA then comes too late to be effective. Version 6.04 does not use the altitude separation test in this geometry. Here, the RA comes earlier and provides adequate separation.
All of the class 6 induced NMACs unique to version 6.04 (see table 6.4, first bar) have a planned separation of -250 or -500 feet. In this encounter, 6.04a modification 1 comes into play. The threat is projected to cross in altitude, but with more than ZTHR projected separation. Version 6.04a goes ahead and issues a non-crossing RA early. Version 6.04 waits until the projected separation drops below ZTHR and gives a crossing RA too late to be effective. The bottom line is that this trade-off between unresolved and induced NMACs is understood, and the trade-off is in the right direction. That is, given a choice between types of NMACs, we would like 6.04a to have unresolved NMACs rather than induced NMACs.
Regarding item (3), all of the new NMACs introduced by version 6.04a were examined by the NMAC Characterization Program. All of the new NMACs were very slight variations of existing NMACs, i.e., no new situations were introduced by 6.04a.
34

Regarding item (4), the new NMACs in tables 7.4 and 9.4 were examined to see why 6.04a produced more NMACs than 6.04. Like the NMACs in table 6.3, the 7.4 and 9.4 NMACs were readily explained by the 6.04a modifications described in section 4.1. The introduction of a very small number of new NMACs in these tables was considered acceptable in exchange for the great improvement in other tables. The new 7.4 and 9.4 NMACs are described in detail in Appendix J.
4.3 SUMMARY
The results of the Phase I evaluation were as follows:
(1) The version 6.04a logic resolved all Seattle-type encounters in the database.
(2) Version 6.04a greatly reduced the number of induced NMACs in all rate-to-level non-crossing geometries. There were fewer crossing RAs issued in each of these geometries and also better results from the crossing RAs that were issued.
Note - For aircraft displays that cannot properly display the required vertical rate-to- maintain, there will be less reduction in the number of induced NMACs.
(3) Version 6.04a had slightly more NMACs than 6.04 in 3 out of 40 NMAC tables (20 classes, unresolved and induced NMACs). These increases were not considered significant.
(4) There were no 6.04/6.04a interoperability problems seen. In all tables except one, the intermix (6.04/6.04a or 6.04a/6.04) performance fell between that of the corresponding single versions (6.04/6.04 or 6.04a/6.04a). In one table (9.4) the intermix performance was slightly better.
35

CO CD
CO Ü < CO
>S CD
O
lö c "2
•C CO "*
ToXX*
CO
o q CD CD
II II
CO CO .Q JD
■55-g ^~ CM
"fr O) T—
B rj- Ä CO 3 T" ■ O
TJ-
NM
AC
s m
on E
nc
N
ft Tf
CD
"* c5^ 10
CD JD CO C
omp
hade
d
"* 1- to
CO X <3 .
»*
TO 2 io
n 6.
0 ix
Tab
l
Oi
Ver
s M
atr
"tf ?* CO
Effe
c 6.
04a,
"* K
gure
4-3
. 6.
04 a
nd
■* '$% CD 0
B
CO CD
CO C\J
SJ9JUn00U3 p9UUB|d JO % SB SQVWN
36

ü < (0 lü 2< 73 5
£1 »83
X> CO «ID JE
*Z » ii •cco^t 'S XX
«s q q CD CD
ll II
co cc
"■" CM
cd
«fr CD
in
CO
«*
cd
«*
■st- cd
co CD
0
■8 .X "v-
<° ** CM o
sjejunooug peuuBid jo % SB SQVIAJN
Iss
5 «
c a
.x
ll y « 4-2
s
37

5. ANALYSIS - PHASE II
5.1 DESCRIPTION
The purpose of the Phase II evaluation was to do a general evaluation of the 6.04a logic, using all of the Lincoln Laboratory analysis programs, to detect and explain any areas of poor performance. As described in Section 3.2, the term "areas of poor performance" was defined by the Hot-Spot Program to be any matrix table cells for which either: (1) logic version 6.04a had more than twice the number of NMACs as version 6.02, the baseline version; or (2) both pilots responded properly to the advisories, yet more than 2% of the encounters resulted in NMACs. Once the Hot-Spot Program had pinpointed these cells, then the NMAC Characterization Program, the NMAC Analysis Program, and the Performance Statistics Program were used to understand the causes and significance of the poor performance.
5.2 RESULTS
5.2.1 Hot-Spot Program
The Hot-Spot Program looked first for type 1 hot-spots, i.e., table cells for which logic version 6.04a had more than twice the number of NMACs as version 6.02. There were four type 1 hot-spots that occurred in tables 2.4,7.4, 8.3, and 8.4.
The program looked next for type 2 hot-spots, i.e., table cells for which both pilots responded properly to the advisories, yet more than 2% of the encounters resulted in NMACs. There were no type 2 hot-spots with version 6.04a. This is important since with version 6.04, there were two type 2 hot-spots, the most notable being class 19 (the Seattle class) with nearly 3% of the encounters resulting in induced NMACs.
Figures 5-1 through 5-4 show histograms of the number of NMACs (as a percentage of the number of planned encounters) per class for each of the 20 classes. Figures 5-1 and 5-2 show induced NMACs, with Figure 5-1 using the standard 100-ft separation as the performance metric and Figure 5-2 using a 200-ft separation. Figures 5-3 and 5-4 show unresolved NMACs, with Figure 5-3 using a 100-ft separation and Figure 5-4 using a 200-ft separation. It is easy to see the type 1 hot-spots in tables 2.4, 7.4, 8.3, and 8.4. Note that although there were no type 2 hot-spots, tables 2.4, 7.4, and 8.4 came very close, and table 8.3 was next in line with more than 1% of the encounters resulting in induced NMACs. Thus, all four tables warrant further examination as having poor 6.04a performance both in an absolute and relative sense.
It is important to note that all four hot-spots occur in classes of planned crossing encounters, and planned crossing encounters do not occur frequently in the United States airspace. According to MITRE documentation [1], the percentages of the MITRE United States encounter database represented by these classes are as follows:
Class 2 0.04%
Class 7 0.02%
Class 8 0.05%
39

CO l_
o o c
UJ
CD C c CO
Encounter Class
<o
c
o Ü c
LU ■o
CD C
_eö
0 f=*M
10 11 12 13 14 15 16 17 18 19
Encounter Class
Figure 5-1. Induced NMACs.
40

w CD ■»—«
o ü c:
LU ■a CD c c aj Q.
6.02 6.04 6.04A
123456789
CO i— CD ■i—<
13 O Ü c
LU ■a
CD c c _CÖ
0 10 11 12 13 14 15 16 17 18 19
Encounter Class
Figure 5-2. Induced NMACs (200-fi separation).
41

w
a o o c: LU T3 CD C c
OL
m 6.02 @ 6.04 M 6.04A
Encounter Class
i_ CD
■*—•
C
o Ü c
ULJ
<D
CL
0 10 11 12 13 14 15 16 17 18 19
Encounter Class
Figure 5-3. Unresolved NMACs.
42

£
o Ü c
111
CD
£Z
CL
CO l_ CD ■»—>
c
O Ü
Lii ■o CD c c: CO
6.02 6.04 6.04A
Encounter Class
8
o 10 11 12 13 14 15 16 17 18 19
Encounter Class
Figure 5-4. Unresolved NMACs (200-fi separation).
43

Thus, classes 2, 7, and 8 together account for approximately 1/10 of 1 percent of the United States database. This should be taken into account when assessing the impact of these hot-spots. Appendix K shows the class weights (percentages of database) for each of the 20 classes.
5.2.2 NMAC Characterization Program, NMAC Analysis Program, and Performance Statistics Program
The NMAC Characterization Program, NMAC Analysis Program, and Performance Statistics Program were run for each of the four hot-spots. Results are shown in Figures 5-5 through 5-12, with two figures (pages) per hot-spot. The first page for each hot-spot shows summary outputs from the NMAC Characterization Program and the Performance Statistics Program plus a plot from the NMAC Analysis Program. The second page shows the NMAC Analysis Program's comparison of the three logic versions 6.02, 6.04, and 6.04a.
Looking at hot-spot 2.4, we see in Figure 5-5 that 100% of the table 2.4 6.04a/6.04a NMACs had a pattern of aircraft motion like that shown in the plot. That is, Aircraft 1 was given a climb RA, and Aircraft 2 was given a descend RA. Because of the high vertical rate of Aircraft 2 and the lateness of the RA, Aircraft 2 was not able to arrest its climb rate and get turned around in time to avoid the NMAC. Note that this encounter is not one that would be deliberately set up by ATC: The aircraft are converging in range. Both are flying level, separated by less than 1000 feet vertically. Twenty seconds before closest approach, the lower aircraft suddenly accelerates strongly and climbs through the other aircraft's altitude. This is not similar to the Seattle encounter, in which TCAS took a benign situation and induced an NMAC. This is a situation in which there was a serious error before TCAS became involved. Because class 2 overall represents only 0.04 % of the U.S. encounters and because this encounter would not be expected to occur deliberately in the airspace, the 2.4 hot-spot was deemed to be not a concern.
Note on page two of the hot-spot 2.4 material (Figure 5-6), that the version 6.02 logic successfully resolved this encounter. This is because of the larger thresholds used in 6.02. The original aircraft separation (715 feet) violated the 6.02 altitude threshold. As soon as the range threshold passed (25 seconds), preventive RAs were given to both aircraft ("limit climb to 500 fpm" to the lower aircraft and "limit descent to 500 fpm" to the higher aircraft). Thus, the planned Aircraft 2 acceleration was limited, and the two aircraft passed without incident. In contrast, with the 6.04a logic, the altitude threshold was not violated until Aircraft 2 had already achieved a substantial climb rate. Instead of the full 25 seconds to maneuver (as with 6.02), both aircraft had only 12 seconds between the issuance of the RA and CPA.
Looking at the plots for hot-spots 7.4, 8.3, and 8.4 (Figures 5-7, 5-9, and 5-11 respectively), we see the same type of situation. That is, in all of these encounters, the two aircraft are converging, either both level or one with a small vertical rate; and shortly before CPA one or both aircraft maneuvers abruptly towards the other. Again, because these classes represent only a very small percentage of the U.S. encounters and because these encounters would not be set up deliberately by controllers, these remaining three hot-spots were deemed to be not a concern. Even though the encounters in 7.4 and 8.4 were technically called induced NMACs (meaning TCAS took a benign situation and induced an NMAC), common sense would say that this is not true. The encounter without TCAS was technically considered benign because the separation at CPA was greater than 100 feet vertically. But this is far from a benign encounter without TCAS. There will always be some encounters that TCAS cannot resolve, and in fact is not expected to resolve.
44

NMAC Characterization
100% had pattern below 96% - AC2 rate = 5000 fpm 94% - AC2 accel = .25 or .35 96% - AC2 accel time = CPA-20s 60% - planned separation = -500 ft
Performance Statistics
98% of RAs were non-crossing 38% of NMACs were non-crossing
7000 120 110
6000
03
<D ■o 3
5000
4000
ENCOUNTER SUMMARY - AIRCRAFT ALTITUDES Data File Name=LL212OZL605; REIT Number=1196
SIM M0DE2165044 (Source: LL Composite FTEG Run, Dated 07/22/94)
20 100 90 80 70 -I 1
60 50 —i 1 1—
40 30 10
A/C 1 Own Altitude A/C1 Own Altitude (as planned) A/C 2 Own Altitude A/C 2 Own Altitude (as planned)
I
i \
ICL
CL
7000
6000
IDES
3000
II PRÄ
-V OES-
!•*.
5000
JC*S.,
4000
f10fl6*ra««XXWWKlWOO«i»»XJWCKX»WIXW»»OH<XX<**r~ 3000
PRA _L
10 20 30 40 50 60 70
Time in Seconds
80 90 100 110 120
Figure 5-5. Hot-Spot 2A. Class 2 Induced NMACs.
45

en
Q
o CO m m (H; <2J
c/> ►4 W L> Q M M
o m t2>
►H o
00 in CE)
CO W Q
2 2 X X 2 2
CO LU CC
is CO^:
111 CD
ü§ Ü
LU
CO rH <3« m es; (H>
OS o w O . EH - o 2 o CM rH t-H O o r- Q o O ■■c oo ►3 ►q c_> 2 II W ,—, ,—,
1 CD
2 M o 3 3 2 ^q . X X
M < o 2 2 CO CM to | o PS o c_> • O ■qi «s«
1 m • ro 00 2 O 2
CM o (2) s>
II m m
£ m Q O CM ►H i-q o <
CO H o — — 00 OS OS rH D D in o o < < • o H EH
in • CM o
CTi CTi CM TH tH
II o
" ' "• PS
o § § 33 < o M H PS H o
m En EH
CM v < < o o
o EH H CO • o CM CM
o —' CM CM to m O rH > r- CM CM
,—s CO VD ►■3 o rH CM OS S
o CM CM
CM OS ^ rn CM O CC o u ►O
EH • CM w vo co o rH CM CM i—i
CM
CD in o CJ >-H
O CTi o rH 11 o rH CM rH m CJ O
►H I -^ \ CO «< <
os w EH
O c_> 2 «I CD 2 M
CO
CO
O OS o 21
o 2
co
1
Od ■531 o
CO
>
OS
o
o CM
r- CO
o CM
1
O
o
m CM
o o
o o 00
►H
o CM
< EH
o CM
II ~ o
OS D o < o EH O
m
o o
o o ^ o co
o a
o OS 33 o EH CO O
O
II O m
I-H" 1
CO
00
►4
s > ►3
CO ►H
O 00
H EH
< EH
00 00 o
ID
EH O CM rH CM
>-H u
u
CO
CO W Q
Q
Q
CD
C2>
EH EH O O Pd OJ
CO
O 00
EH
00 00 rH •q. CO CM
CM
CM
U
CM
CJ
OS w EH
O U 2 W| CD 2 H
CO
CO
O OS u 21
o 2
00
I
CM
03 OS
O
co >
OS
< o
CO en
o o 00
2 M
O
CM
EH
o CM
OS ID
IS
o o CD
os 33 EH to
.-5 CO
o CM
r- 00
o CM
I
O
o
m CM
o o
o o o in
o
ö
o
o
o
o
o o m
I
CD
►3
O
s >
<2J
CO l-H
o 00
H EH
< EH
o in CO
CO
CM rH CM
u
o
CO
CE)
CO
W Q
Q
Q
CD
C2)
EH EH O O 04 0J
CO rH
o 00
M EH
EH
rH m CO CM CM ^. CM N
CM rH CM
►H C_>
CM
C_>
0
1 "a
CJ a "a
<*! Q
o
I
I
3 _60
46

NMAC Characterization
97% had pattern below 95% - one or both AC ±5000 fpm (33% both) 56% - AC1 accel = .15 AC2 accel distributed among -.15, -.25, -.35 planned separation distributed among 250, 500, 750
Performance Statistics
97% of RAs were non-crossing 99% of NMACs were non-crossing
10000 120
9000
ENCOUNTER SUMMARY - AIRCRAFT ALTITUDES Data File Name=LL717XZL605; REIT Number=8982
SIM MODE-.2165044 (Source: LL Composite FTEG Run, Dated 07/22/94)
110 100 90 80 70 60 50 40 30 20
o A/C 1 Own Altitude pjQ 1 own Altitude {as planned)
* A/C 2 Own Altitude A/C 2 Own Altitude (as planned)
35 8000 u_
•o
7000
6000
IDES
DES
DCL
mm <KK>O««»O<X>»« ♦<K»»«»ooo»«»o<»<»««e©o**
5000
up
CL CL'
oo5i
^
?* 4^ PRA
*6*>
y
10 10000
:»»«»WH<»KK««I««««»««««««*W",«»«,0,"*U"<
PRA
9000
8000
7000
6000
-1 5000
0 -lo 20 30 40 50 60 70 80 90 100 110 120
Time in Seconds
Figure 5-7. Hot-Spot 7.4. Class 7 Induced NMACs.
47

CO LU
CC
is CCO HI CD
Ü
HI
CO l-H o
D u M
o o
a; in r—, ,__^ EH
o r- X g
5 o o
X z 2 o •5J"
CJ o z II w o
1 s CM ID ID Ü M l *r ^* % i-3 <2J tSJ M < CO o CO . o m J X o CM CJ J o
1 m 1 Q CJ
z CM o in 2; oo * ,^^
II o § ' Ü
% 1 fc fcy
m < CO E-< in
CM t- T co VO o *T •5T
1 o e; ro m
C2J
in CM o
EH EH r- o O CO O n o o
x w Q
CM
X oo M D 1
K CC
< En o
< < CM o EH EH O
o —
VO • CM CM o ^-v CM CM
CO lO o O i-H > p» • CM CM o ID ID
HH o i-H CM X u o CM CM
in ,, ^ CM OH v DH CM o re o CJ tu • EH • r- H VO N o t-i r~
~ -3 i-H i—•
in o O ►J CM • CJ CO o .. CT> II in r-H CM CO
CO
r^ CJ ■v. <
CJ
<
CO .J o w
D Ü n
o o
X m , , ^_, EH
O r- x g
§ O m
X z
O co O o 53 II M, o
1 £ CM ID ID O M 1 T •^ z KH <g) <SJ M < CO o CO O m J X o CM o ►M o
1 m 1 Q CJ
z CM o m 2 m ^ ^_^
II o •§ §
% I fcj Si
m < CD EH m
CM r» « T oo VD o T ^r
1 o <2> 00 in
S)
in CM o
EH EH r- o O CO O
II o o
OH W Q
OH
X CO — M D 1
xa X
< EH o 5- < < ^ o EH EH
o *^ • o ID • oo 00
o ^-* oo oo CO o o o t-H > ID . •sr *r
o ID ID 1-3 o i-H CM a; II o CM CM
m v T X »* O CM o za o r- O-i • EH • r-H o ID NJ o r- r~
i-5 i-H r-
m o J CM CJ CD o .. Ol ii m i-H CM OO
^ r~ o CJ
CO < <
r~ CT> ■<? ^ <2) o
CO H1
X o w Ü
Q M Id o EH o Z in r—, , , o
O r- S S CJ o X X Z m z z
1 oo
o
z II
o d H X CM ID ID
S CO CO
HI 1
O X
< o §
o • t3 1 m ^ ii z O CM CJ KH CJ o • 1 a o 3 z in T3 CM — —
►5 in
in II
00
o I I 00
% 1 fe Si §
ID 1
< EH in
CM <J
o "3< «3>
00 "^ o e> oo cu K
r~ in CM o
o
in
EH O CO
EH O
■♦-4
o
I II o OH W PH •J4
32 o Q ja X X
Zi oo
1 — M — tts
< g o E- % °? o o
< EH g «A
ID o
>— — Ü CO • ■sr *r 3 > o ^^ qi ^n 60
o o o r-H £ 1-3 ID • m m « o ID ID o i-H CM
II o CM CM < in *, ^T X ^ N CM o 33 o S N • £H • r- >H ID N o i-H r-
~ hH i-H
in o CJ ^ CM O 00 o ■. cn II m iH CM 00 r— CJ CJ
•J •^ \ CO < <
48

NMAC Characterization
63% had pattern below 100% - planned separation = 0 100% - one or both AC ±5000 fpm (27% both) AC1 accel distributed among .05, .15, .25 67% - AC2 accel = -.15 87% - AC2 accel time = CPA-20S
Performance Statistics
92% of RAs were non-crossing 96% of NMACs were non-crossing
ENCOUNTER SUMMARY - AIRCRAFT ALTITUDES Data File Name=LL818YZL605; REIT Number=8712
SIM MODE:2165044 (Source: LL Composite FTEG Run, Dated 07/22/94)
9000 120 110
8000 **-« *>.
100 90 80 70 60 50 40 30 20
<D
CD X3 3
7000
6000
5000
•«o. ^^« °°o, °°*., •*<•.., *-» •«»..
IDES
"DES"
••eo9«*«oo<»«f«6o««
PRA
" ,r
CL
i: / PRA
KtfJttCmtm%ttXXttHtC3UCtautUXtHC*C»UMXMMKi*HKX1*ttKMKKM*C
A/C 1 Own AWtude A/C 1 Own Altitude (as planned) A/C 2 Own Altitude A/C 2 Own Altitude (as planned)
I . \ . I ■ l
10 20 30 40 50 60 70
Time in Seconds
80
10 9000
8000
7000
6000
5000 90 100 110 120
Figure 5-9. Hot-Spot 8.3. Class 8 Unresolved NMACs.
49

CO ü <
SS OO Q-CO COLU
CO CO CO < —I Ü
CO UJ
cc
is CO^: EC o LU CD br CM
ü LU
VO ID in m <2> C2J
CO CO o 0 w
Q M
0 W Q M o 0 05 0
o 0 W 0 m in — EH m —
Pi r- r—t a r- .—1 r—t r~ ,-_, r—1
EH O 3 EH
0 s 3 O 0
Ol s § O
O X z § 0
m X z
X z
O Z
0 in
X z X z O T o »—* O ro 0 H CO 0
O • Ü . 1 Z II o Z II 0 CD II 0 W. CM w, CM Z CM r*9
1 £ 1 ID o „1 X | CM CM M £ 1 CM CM <J C5 H m in C5 hi m ■ m CO H in in 3 1 2 r3 <s> <s> Z r3 El Ql CO r3 0 <w> M CO CO
< o
m CO
M CO 00
< O
m 0 05 O
< 0
in o CM w o CM CO 1 CM CO 50 o5 O 1 Q i-3 05 O 1 H 1-3 Z O 1 pa i-q
ü .1 m
M O CJ 1 in
Q ü O z m
a ü
Z CO in — ^ Z CM in — — CM m C5 o <-{ «—V o rH r-i to z
II o ES Q z
II 0 EH Q II 0 EH Q 2?
5 1 X tu 1 EH &H n I EH b ^ 2 a g > Q in % > Q
CM < in n < m CM < m eo r- EH CM in EH CM CD EH CM S3 co o o u\ CM 0 O CTl
I 0 0 en
«r m sr CO in ■a« m ■"3* Q CM O <S1 w 1 O <2> e> 0 tSJ e> 1 ^~^ " t—. • ^^
IT) CM
o 3 in CM
0 S 3 00 m CM
0 & s «*■>
o CO H 0 EH H 0 EH EH OÖ 00 o w O 00 0 O O 0 0 O II o in
a 0M II 0 in
CU 0J ac
It 0 m
PH OH -«-4
05 D
1 05 D
1 — — 05 05 1 — — c§- D3 05
< EH
o § 5 as 05 g 0 ^ 5 < g 0 g 5 0 o > < 0 < < 0 0 < < 03 CM ^"^ & EH »31 ^-* EH EH • ■^^ EH EH
O -— 0 — ID
<D O ^ CM CM ID
O. ^^ n CO CO O
"3" •3« •-< O o CM CM 0 0 n n > O 0 "3" •a1 CO m • O rH CO 0 • 0 rH O O rH •A > r~ o CM CM > VD 0 •ST T J 10 p in m *. ID ID «. vo VD 05 ID ID ^ i-3 o rH CM ►3 0 rH CM 0 rH CM
^ 05 II • CM CM 05 II • CM CM « CM CM a
o *. *. 0 ^ ^. << 0 &o CM 05 o u, CM "31 05 0 05 CM T 05 0 N CM £ O ac o o E3 O K 0 O 05 0 33 0 £ N] • EH rH CD W • EH rH 00 O ■ EH rH 00 X \D CQ 1 r-l 00 ID N 1 rH CO <£> CO 1 rH CO
CO r3
i-H CO
00 I-H
i-H CO
00 1-3
rH CO
in o CJ •-3 m O CJ I-H m O O K3 CM • CJ CM CJ CM . <_> t-l o • • •« -H O >■ >■ r-i O .. I— II i-H CM ?*- II rH CM r- II rH CM CO o O co CJ Ü 00 CJ CJ
►3 \ -^ •-H -V \ J •^ \ CO < < CO < < CO < <
50
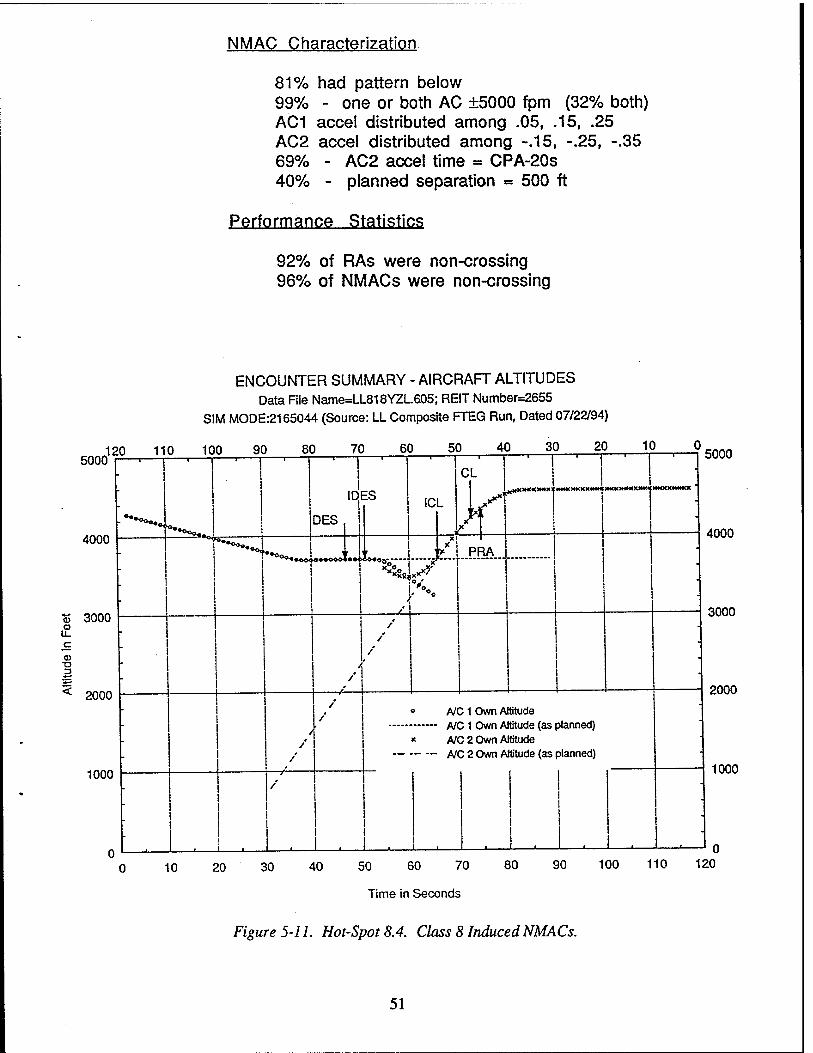
NMAC Characterization.
81% had pattern below 99% - one or both AC ±5000 fpm (32% both) AC1 accel distributed among .05, .15, .25 AC2 accel distributed among -.15, -.25, -.35 69% - AC2 accel time = CPA-20S 40% - planned separation = 500 ft
Performance Statistics
92% of RAs were non-crossing 96% of NMACs were non-crossing
ENCOUNTER SUMMARY - AIRCRAFT ALTITUDES Data File Name=LL818YZL605; REIT Number=2655
SIM MODE:2165044 (Source: LL Composite FTEG Run, Dated 07/22/94)
5000
4000
«5 3000 03 U-
T3 3
2000
1000
. ■ 1 r I 1 1 1 * , .
1 CL
1 1 I
'
•••-... •"-^.
DES
ID ES IC L
1
MMMMK«MWM**M4tCM«XX«*« MKKMWMXMW
•
*«<x *--^
"•^.^ ■ ' ■ ' X * * PRA
' Xxg,
.... .r
V
- /
/ /
/ ■
■ /
. / o A/C 1 Own Altitude
■
■ y
NO, 1 Own Altitude (as planned) A/C 2 Own Altitude ■ X
- / *
. -
- I
■
1 —1
1 , ' t 1 ' , .
5000
4000
3000
2000
1000
10 20 30 40 50 60 70 80 90 100 110 120
Time in Seconds
Figure 5-11. Hot-Spot 8.4. Class 8 Induced NMACs.
51

^1
in «a- in
CO UJ DC
s< sS
LLI cp
g«5 ü HI
o o r-
05 co W o EH . § o
o O "Ü1 o o . z II m w, CM
rnl S 1 CM m C5 H m ^r z KH <S> S) M < o CO ■
CO m CO o CM W 05 o 1 Q r3 o
1 in H CJ
Z CM m — — o rH ,—, , , z
1) O 1 X
5 z z 00 < m rH EH rH
CO o CM *!« o ■^ ■a« in
1 o in CM
o
e>
CO o CO w
00 o w Q N o
m Q a 03 I — D ^
a: < o N N 05 EH • i-3 J
CM o I s
O o
CO - * CM CM o o CM CM
CO in • O rH > C~ o CM CM ». CO CO ►3 o <-H CM 05 ll • CM CM
o ». v CM 05 o h CM o a o u 33 ' EH rH CD w co N 1 rH CD
CD rH CD
m o CJ J m CJ m o < • co II o rH CM CM m CJ CJ
►J \ \ CO < <
r3 (J
o H o r» — oo ,—,
O s O X
o5 O z w 00 o EH • g II m
CM O £ 1 rH r- CJ H m ^r z J e> <2J
wl < o 1
CD in CO z CM W M O I . a H3 CO H CJ CO o o CM in — 03 rH ,__, CJ £ . ,
II O Q 1 x In
§ z a CD < m r- EH rH
00 o r~- in ro q. T
1 o _ C2J GJ
o CM
o £ o CO EH 00 o w O
II o m Q o^
05 1 — D
03 < o NI £ 05 EH • yA
«31 o S £
O O
CO • —* 00 oo o o 00 00
CO o o rH > CD o ■3" "3< ^ CD co t-3 o rH CM 05 II • CM CM
o ,. ^ T 05 o 05 CM o 33 o O 05 • EH rH 00 O CO N 1 rH 00
~ 00 ►H
rH 00
T o CJ iJ m Ü in o. .. CD II o rH CM CM m CJ CJ
>A \ \ CO < <
rH CJ
O rH O r- — 00 , ,
05 o g EH o X
§ o oo o z
O . CJ It m Z CM w 2 1 rH r- 1 H m T u rH CD <S) z < o H CO m CO CO CM w o o 1 a r3 05 M o O o
CM in rH
—
II o ss Q 00 1 X b r^ £ z S CO < in oo
1 EH rH
o m •"3"
O ^ C2J (wj
CO o CM
o ss o CO EH o w O
II o Q (M 33 m 05 05
D 1 — —
< < o N g "S> EH >-H o o
M < ■*— EH
CD o
CO —-* ■^< •«• > o o ^f "3* o O rH
tl CO o in in 05 *. lO co
o rH CM II CM CM < o v
T 05 o N CM O 33 o s Kl
EH rH CO X CD N 1 T~{ 00
-' CO r-< CO
T o CJ rH- m CJ in o CD II o rH CM CM m CJ CJ
J \ \ co < <
1 00
00
i
a 60
52

The four hot-spots discussed in this section are such encounters: two aircraft, close together, making last-minute strong maneuvers towards each other.
5.3 SUMMARY
The results of the Phase II evaluation were as follows:
(1) There were no tables in which 6.04a induced NMACs in more than 2% of the encounters.
(2) There were four tables in which 6.04a had more than twice the number of NMACs as 6.02: tables 2.4,7.4, 8.3, and 8.4.
Encounters in these tables were examined in detail. All were planned crossing encounters that occur with low frequency. The encounters generally involved high vertical rates, planned maneuvers scheduled to occur near tau time, and an RA sense opposite to the planned maneuver. Lincoln Laboratory did not feel that these encounters were of concern. However, Lincoln recommended that a review committee be convened of members of the TCAS community in order to ensure a consensus on these and other matters (see Section 7.1).
(3) There were no interoperability problems seen. In all tables except one, the intermix (6.04/6.04a or 6.04a/6.04) performance fell between that of the corresponding single versions (6.04/6.04 or 6.04a/6.04a). In one table, (9.4) the intermix performance was slightly better.
One item of note: The performance in TCAS-TCAS encounters was better than in TCAS-Mode C encounters except in tables 9.4 and 15.4. There the TCAS-Mode C performance was better because TCAS was able to reverse its sense against the Mode C intruder but could not reverse against the TCAS intruder. TCAS-TCAS reversals have been proposed for inclusion in RTCA DO-185A, the TCAS MOPS for TCAS Change 7.
53

6. ANALYSIS - PHASE III
6.1 DESCRIPTION
The purpose of the Phase El evaluation was to analyze every 6.04a NMAC produced by the simulation in order to understand the performance limits of the 6.04a logic. For those NMACs deemed likely to occur in the real airspace, possible improvements were to be proposed.
The approach taken was to first plot every 6.04a NMAC. For each encounter class, we then grouped together all NMAC plots whose aircraft motion formed a particular "pattern." That is, if all of the plots with a particular pattern were superimposed on one another, the shape of the aircraft paths would appear very similar: all Aircraft 1 received the same advisory; all Aircraft 2 received the same advisory; and the mechanism causing the NMAC appeared to be the same (e.g., lateness of RA, difficulty in arresting a high vertical rate, etc.). Note that in the original planned encounters, all of the encounters in a particular encounter class have the same pattern. It is only after TCAS gets involved and the pilots respond to varying TCAS advisories that many different patterns of aircraft motion emerge. In looking at the outputs of the NMAC Characterization Program, we were able to verify that each pattern had a distinctive set of parameters associated with it. Out of the 20 encounter classes, there were 30 different patterns, or 30 NMAC categories.
Next, from each of the 30 NMAC categories, we chose a "representative encounter" whose parameters best matched the majority of the encounters in that category. Our premise was that if we could understand in depth the failure mechanism for each of these 30 representative NMACs, we would understand the failure mechanisms and performance limits of the 6.04a logic.
6.2 RESULTS
Figure 6-1 gives a breakdown of the 30 representative encounters, showing for each encounter, the table from which it came and the percentage of that table's encounters it represented. Out of the 30 representative encounters, there were 7 unresolved NMACs (tables x.3) and 23 induced NMACs (tables x.4).
For each of the 30 representative encounters, the Lincoln Laboratory version of the FAATC simulation program was run in order to produce a second-by-second print-out of aircraft position and CAS logic variable settings from each aircraft's point of view. Next, for each encounter, both the NMAC Characterization Program and NMAC Analysis Program were run. The Performance Statistics Program was also run for each class. A "packet" similar to the four shown in Figures 5-5 through 5-12 was produced for each representative encounter. These packets (minus the second-by-second print-outs) are included in Appendix L. Each packet included four items:
(1) an annotated plot, showing both Aircraft 1 and Aircraft 2 positions and advisories from time t=0 to t=65 seconds (CPA=60 seconds).
(2) a summary of the outputs from the NMAC Characterization Program and Performance Statistics Program, giving information about the parameter values or combination of parameter values associated with the encounter and the percentage of crossing or non-crossing advisories issued in that class.
55

FILE: C:\PARAMS\GROUP.DAT Tue, 19 Jul 1994
TOTAL 6.04a NMACs AND CHARACTERISTIC 6.04a NMAC GROUPS PER CLASS AND TABLE (Table 3 - Unresolved NMACs; Table 4 - Induced NMACs)
Characteristic NMACs % of NMACs # of % of Data File and REIT in Grp Tbl in Tbl Enc. Enc. Cls Tbl
0 3 Total NMACs
0 4 Total NMACs
1 3 Total NMACs
1 4 Total NMACs
2 3 Total NMACs LL212OZL.605
2 4 Total NMACs LL212OZL.605
3 3 Total NMACs
3 4 Total NMACs
4 3 Total NMACs
4 4 Total NMACs
5 3 Total NMACs
5 4 Total NMACs LL515WZL.605 LL515WZL.605 LL515WZL.605
6 3 Total NMACs LL616WZL.605 LL616WZL.605
6 4 Total NMACs LL616WZL.605
7 3 Total NMACs LL717XZL.605
7 4 Total NMACs LL717XZL.605 LL717XZL.605
8 3 Total NMACs LL818YZL.605 LL818YZL.605 LL818YZL.605
8 4 Total NMACs LL818YZL.605 LL818YZL.605 LL818YZL.605 LL818YZH.605
for Table=
for Table=
for Table=
for Table=
for Table= 0123 5
for Table= 1196 52
for Table=
for Table=
for Table=
for Table=
for Table=
for Table= 1006 5 1195 4 1952 17
for Table= 0081 . 4 5863 10
for Table= 4612 12
for Table= 2538 4
for Table= 2014 5 8982 191
for Table= 0641 4 7305 7 8712 19
for Table= 1385 27 2655 152 3615 4 4970 5
100.0%
100.0%
19.2% 15.4% 65.4%
28.6% 71.4%
100.0
100.0
2.6% 97.4%
13.3% 23.3% 63.3%
14.4% 80.9% 2.1% 2.7%
0
0
0
0
5
52
0
0
0
0
0
26
14
12
196
30
188
16
20
72
304
864
3032
736
2416
120
608
1580
7488
1728
7384
2416
9988
2592
10044
0.0
0.0
0.0
0.0
0.58%
1.72%
0.0
0.0
0.0
0.0
0.0
0.35%
0.81%
0.16%
0.17%
1.96%
1.16%
1.87%
Figure 6-1. Representative NMAC Encounters.
56

.
Characteristic NMACs % of NMACs # of % of Cls Tbl Data File and REIT in Grp Tbl in Tbl Enc. Enc.
9 3 Total NMACs for Table= 0 1158 0.0
9 4 Total NMACs LL919YZH.605 LL919YZH.605
for Table= 1509 14 3523 4
77.8% 22.2%
18 5808 0.31%
10 3 Total NMACB for Table= 0 8 0.0
10 4 Total NMACs for Table= 0 124 0.0
11 3 Total NMACs for Table= 0 0 0.0
11 4 Total NMACs for Table= 0 128 0.0
12 3 Total NMACs for Table= 0 0 0.0
12 4 Total NMACs LL212OZL.605
for Table= 1421 1 100.0
1 2152 0.05%
13 3 Total «MACS for Table= 0 128 0.0
13 4 Total NMACs LL313SZL-605
for Table= 1614 4 100.0
4 4496 0.09%
14 3 Total NMACs for Table= 0 24 0.0
14 4 Total NMACs for Table= 0 256 0.0
15 3 Total NMACs for Table= 0 148 0.0
15 4 Total NMACs LL515WZL.605 LL515WZL.605
for Table= 4283 18 5543 3
85.7% 14.3%
21 2880 0.73%
16 3 Total NMACs for Table= 0 0 0.0
16 4 Total NMACs LL616WZL.605
for Table= 2491 1 100.0
1 2984 0.03%
17 3 Total NMACs for Table- 0 176 0.0
17 4 Total NMACs for Table= 14 5564 0.25% " LL717XZL.605 2732 14 100.0
18 3 Total NMACs for Table= 0 0 0.0
18 4 Total NMACs LL818YZL.605 LL818YZH.605
for Table= 1520 12 3978 5
70.6% 29.4%
17 5508 0.31%
19 3 Total NMACs for Table= 0 570 0.0
19 4 Total NMACs LL919YZH.605 LL919YZH.605
for Table= 2883 11 7162 25
30.6% 69.4%
36 8016 0.45%
TOTAL 639
Figure 6-1. (cont.). Representative NMAC Encounters. 57

(3) outputs from the NMAC Analysis Program giving a summary of the encounter when run with logic versions 6.02, 6.04, and 6.04a. This allows an understanding of how each version's thresholds and timing can affect the outcome of the encounter.
(4) second-by-second print-outs for both aircraft showing aircraft position and CAS logic variable settings.
Figures 6-2 and 6-3 show, for each encounter, merged outputs from the three analysis programs. Figure 6-2 gives information for the seven encounters with unresolved NMACs; Figure 6-3 gives information for the 23 encounters with induced NMACs. Regarding Figure 6-2, the parameter that most stands out is "warning time." Note that for most of the encounters, the RA was given to the pilot 7 or 8 seconds prior to CPA. Assuming a 5-second pilot response delay, this means that the pilot had 2 or 3 seconds to maneuver the aircraft. Clearly, this is not sufficient. Sometimes this late RA was due mainly to a late maneuver by one (or both) of the aircraft. However, sometimes an early RA was deferred, waiting for an intruder to level-off at a safe vertical separation; when the intruder instead leveled-off co-altitude, it was too late for TCAS to resolve the encounter.
Other parameters (columns) appear to exhibit more variation. It appears not to matter particularly whether the RA was crossing or non-crossing (note that these are all planned crossing encounters). Likewise, there is no one delay responsible for the late RAs. Vertical rate does appear to be a factor; in all of the encounters, at least one aircraft had a rate of 5000 fpm.
Regarding Figure 6-3, induced NMACs, the parameter that most stands out is "crossing RA." Most of the induced NMACs seem to occur when non-crossing RAs were issued in planned crossing encounters or when crossing RAs were issued in planned non-crossing encounters. That is, TCAS issued an RA that was opposite to the aircraft's planned maneuver. If the aircraft were moving at a high vertical rate, as some were, then it would take time to arrest the rate and begin moving in the opposite direction. Most of the other parameters exhibit more variation. Note that in only two tables, 9.4 and 19.4, were any of the planned separations equal to 1000 feet. In these two tables, there were three encounters in which the planned separation was 1000 feet and TCAS induced an NMAC. These three encounters were analyzed in depth by MITRE (see Section 7.1).
58

6.3 SUMMARY
From the 639 version 6.04a NMACs that were produced in the FAATC simulation, Lincoln Laboratory determined that there were 30 distinct NMAC categories. A representative encounter from each of the 30 categories was examined in depth. The results were as follows:
(1) For encounters that resulted in unresolved NMACs (7 "representative encounters," representing 53 encounters total), the main conclusion was that the RA was issued too late to be effective.
(2) For encounters that resulted in induced NMACs (23 "representative encounters," representing 586 encounters total), the main conclusion was that the RA sense was generally opposite to the sense of the planned aircraft maneuver. The aircraft was generally just beginning a maneuver when TCAS told it to move in the opposite direction. The time lost in changing direction resulted in insufficient movement in the proper direction.
(3) To determine whether the 6.04a NMAC encounters were likely to occur in the real airspace and if so, to propose logic improvements, Lincoln Laboratory requested that a review committee be formed from the TCAS community to review all 30 representative encounters. The review committee and its actions are described in Section 7.
59

n 5 i_ O d CD E o
Ü o o
5 CO
CM o <
CO
CM
Ü <
o o © o o CO DC
o o
o o
o to
1 o w l_ o o
o o o
o o o
CM
Ü
o in
o m
i
1
d o
o lO
1 o in
o lO
< o CO
» o
o © o . ra o o o o o
CO : o
v>
cc T- Ü
o o o to
»
o o
o o lO
o o CO
l
7 o o 00
0,
-500
er < o » HI T H- Z ^^ ID o to T3 ■D O Ü z l±l UJ
£ c CD
CO ■o o t=
© to CO CD c
w to CD c
O o o
1_
O o o
CD Q
o Ü > CD
co E E 1_
u£ > > ,2 75
*^ •»— £
1 u UJ c (/) O © Ul EC
c c
CD
E <0 CO 00 t>- r^ o> CO CO
Q. UJ CD i-
-C CO CO h^ r^ CO CO CO
DC £ o 1 «i£
3 < a o> D) CO
c c c c z C
i "to co
"to to
CD c "to
to 'to <0
Q UJ
to o o "to to to o o CO o o O
CO o
w o
to o O o
5 o o c
o t c o o o o o
c o
c c c cz
[3 cc z 3 TJ
c o
© c c CO
CO a
o o o o o o o
0. CD to
o d
8 < 5 in ■t
o rr ■f h- a> co T- lO
z
c L 'S i" c\ CM CO
c C !1 ! J
i
c\
1
) O" i tc
- c\
1
t w
! (£
i a
> r-
> TI
» <r. - cc
- If
i
> cc
) tc
cö ! to
8
«■9
e s
>
c ««5
&
cs
3
60

(0 DC CM Ü
<
O O o IO
o o o CO
O O O IO
o o o IO
o o o IO
o o o CO
o o o to
1
o o o IO
o o o
o o o T ^/ CO o E
o o o CO
o o o CO !
o o o ip
o o o f—
o o o CO
1
o o o IO
1
o o o IO
o o o CO
o o o CO
o o o m
o o o to
o o o to
o o o CO
1
o o o IO
o o o CO
o o o to
1
o o o CO
1
o o o CO
o o o 1—
o o o to
o o o CO
o o o to
1
o o o CO
1
- CO er HI
5 o Ü z UJ Ul >
0)
ra EC T- Ü <
o O O O
o o o CO
o o o CO
1
o o o T—
1
o o o IO
1
o o o IO
o o o
o o o
To o E
o o o CO
1
o o o
1
o o o CO
1
CO o o
1
o o o to
1
o o o IO
o o o IO
o o o
o o
o o o IO
o o o CO
o o o
o o o
o o o to
o o o to f
o o o to
1
o o o CO
1
o o o to
1
CO
1 1—
o o o to
1
CO, 1
co Q> Q
u c CD
W
sz k-
TJ k. o o CJ
E *•—
TJ lb-.
o o u I-*
TJ k- o o o
TJ L. o o o
1= >
TJ
o o o
£1 CD CO *■»
CO
CO CO CD E
E
TJ u o o o
TJ k_ o o o
TJ k_ o o Ü
'cö
1
CD >
a. CD co
CO
TJ
o o Ü
TJ
o o o
TJ
o o o
E
Q. CD CO
"cö
"5 1 >
_C0
TJ
o o o
TJ k. o o Ü
a CD CO
15
1 >
_co
TJ k. o o o
to CD
a. CD CO
10
1 UJ to UJ tx QL UJ tr
8 < s z Q Ul Ü =>
O) c "E
1 E
o E CQ
OT T~ CO
co"
CO T—
co"
CO
CO
CM 1—
CM
■<fr
■*"
CO
CO
CO
CO
l-v.
co"
o CO
o CM
en" O)
to T-
to
■«t o CM
IO T—
to"
to
to
o CM
OJ CO
to
c CO
8 i O) E
"co CO o u
1 cz o E
O) E co CO o k. o
1 E o E
ra _E
CO co o k. u
1 E o E
ra E
"co CO o k_ o
1 E o E
ra E CO CO o k. o
1 E o c
ra E
'co CO o k- o
1 E o cz
ra cz
"co to o k. o
1 E o E
ra cz
"co CO o k_ o
1 E o E
ra E
"co CO o k. o
1 E o E
ra _E "to CO 2 o
ra E
"co CO o k. o
1 E o E
ra _E
"co CO o k. u
ra _E
"co CO o Ü
ra E
"co co o k. o
ra E
"co CO o Ü
ra E
"co CO o o
1 E o E
ra E 'to CO o o f E o E
ra c CO CO o k- o
ra cz CO CO
s o
ra E
"to co o o
ra _E "<o co o k. o
ra E
CO co o 1— o
ra E
CO co o k. o
z
■o CO £ C (0 a.
c o
CO k. CO a a>
CO
o
*
to CM
I
o IO CM
i
o IO CM
1
o
■St, %
o- IO CM
1
o o IO
1
o' IO CM
I
o to CM
+1
o IO
o IO CM
o IO CM
o IO
cT o IO
1
o o IO
1 •Si
o IO CM
1
o IO r».
1
o to CM
o o o
o o to
o IO CM o-> (1
o IO
■
o o to
o to If-
o" to CM
1
o o to
1
o o to
o o to
o to CM
o IO
o to CM
o to
o o IO
o o o
o o to
+«
o IO N.
\
o to
)
o
6 z
8 < s z
CM
to IO ■«t 1^ CM
in ■<* IO CO
CM IO •>*
In 1
T™ ■* CO
CO - CM to TT-
IO CM
<o CO to
Q. 3 O k-
O CO 1-
t
CM
1
in
CM
CNT 1
CO
CO* 1 1
IO
1
CO
c\T 1 1
CO
CsT 1
•«3;
en
CO 1
CO*
o
1
CO*
1
OJ
CM
CM" 1
oS
co
t
It CM'
1— 1
CO*
to
1
to
CO
CM I
to
1
to
CO
1 1
co*
o CM
CM
co
JM
1
It o>
CM CM
CM 1
">t
OJ
CO CM
2C
t3 Ü
3 8
«5
to
s _6c
61

7. FOLLOW-UP AND RECOMMENDATIONS
7.1 6.04A REVIEW MEETING
A meeting was held at Lincoln Laboratory on 24 August 1994 to review the version 6.04a NMACs. The following organizations were represented: Lincoln Laboratory, MITRE, FAATC, TASC, Coleman Research Corporation, and the FAA TCAS Program Office.
For each of the 30 representative 6.04a NMACs, we attempted to answer the following questions:
(1) Did we understand the NMAC? What caused it? Was there anything about the logic performance that we could not explain or that seemed wrong? Were we satisfied with the trade-offs made by the logic?
(2) How frequently did we expect this encounter to occur in the airspace? Would it occur only as a result of some breakdown or error in the system, or would it be something that controllers would do on a regular basis?
(3) Would this encounter be affected by any of the version 7 changes? Might the problems go away with version 7?
We flagged encounters that we did not understand and encounters that could occur frequently. Encounters were considered somewhat less urgent if they would be improved by version 7. Version 7 improvements could come from the following: better tracker (faster detection of maneuvers), elimination of coordination delay (earlier posting of RA - earlier pilot response and less time for aircraft contrary motion), TCAS-TCAS reversals, and immediate posting of a crossing RA in both aircraft if a crossing RA is selected by one aircraft. Minutes of the meeting, showing detailed comments on selected encounters, are given in Appendix M.
The summary of the meeting results are as follows:
There were seven specific encounters that were considered not well-understood. The various organizations at the meeting took action items to research the logic and/or run more encounters in order to better explain the seven encounters. The seven encounters (and their specific encounter designations as shown in Table 6-1) are:
(1) Class 515, reit 4283. An increase RA was issued when the aircraft rate was already 3000 fpm.
(2) Class 717, reit 2538. It was believed that with version 7 this encounter would produce no RAs, even though both aircraft would clearly be threats.
(3) Class 818, reit 4970. Version 6.04a had no RAs, but 6.04a had RAs that resulted in NMACs.
(4) Class 818, reit 1520. Many deferrals, one after the other, resulted in a too-late RA.
63

(5-7) Class 919, reits 1738, 4969, 5131. Three encounters induced NMACs when the planned separation was 1000 feet6.
In addition to the seven specific encounters, there were other more general concerns:
Version 6.04a was designed to handle encounters in which aircraft level-off 1000 feet apart, but there are encounters in the real airspace in which a level-off occurs with less than 1000 feet separation. We felt that this would happen most often when aircraft overshoot their assigned altitude. MITRE was tasked to develop a class of "overshoot encounters," to be run along with the current 20 encounter classes.
TCAS cannot handle some high vertical rate encounters. It is expected that some number of these will occur in the real airspace. Lincoln Laboratory agreed to continue its effort to characterize the vertical velocities and accelerations seen both with its Mode S sensor monitoring and with its examination of airborne recorded data.
As mentioned in Section 4, there are some aircraft displays that cannot display the proper rate-to-maintain in high-rate encounters. If these aircraft were involved in high vertical-rate encounters, NMACs could result. A solution to this problem is being pursued as a part of the work on logic version 7.0.
On a more positive note, it was agreed that some of the NMACs labeled "induced" could more accurately be described as "unresolved." That is, without TCAS, the planned encounters resulted in slightly more than 100 feet separation, and with TCAS, the encounters resulted in slightly less than 100 feet separation. While technically considered induced NMACs, these encounters hardly fit the description of TCAS taking a benign encounter and turning it into an NMAC.
Resolution of these items is described in Section 7.2 below.
7.2 ACTION ITEM RESOLUTION
Following the 6.04a review meeting, attendees circulated the results of their assigned action items. A teleconference took place on 10 March 1995 to review the results. With the exception of the FAA Program Office, which was not represented, each organization present at the original 6.04a review meeting had one person participating in the teleconference.
The conclusions were as follows:
All of the specific encounters reviewed are expected to be improved by revisions being made in Change 7. However, this should be verified by running these encounters with the Change 7 logic. This will be done by FAATC and MITRE immediately using the Change 7/Information Release 5 logic. In addition, both FAATC and Lincoln Laboratory are expecting to evaluate the Change 7 logic (both the Change 7/Information Release 5 logic and the final Change 7 logic) using the same encounter database as was used for the 6.04a evaluation. This means that the performance of the Change 7 logic on all of the 30 6.04a representative NMACs will be re- examined two more times.
6 Note - These encounters, though class 19, are not Seattle-type encounters because the aircraft have the same sign vertical rates. In Seattle-type encounters, the two aircraft have opposite sign vertical rates.
64

A question was raised about possible differences in the pilot response model in the MITRE and FAATC simulations. This will be researched immediately and any differences reported.
MITRE is developing a class of overshoot encounters. Details on this work are expected before the distribution of Change 7/Information Release 6.
Regarding high vertical rate encounters, it was noted that the Lincoln Laboratory analysis of airborne recorded TCAS data shows over 5% of the track cycles with rates in excess of 3000 fpm. Thus, we cannot dismiss poor performance of the CAS logic in high vertical rate encounters as something that will not happen. It was agreed that MITRE will try to compare the Lincoln vertical rate distributions derived from the airborne data to the MITRE vertical rate distributions derived from the ARTS database. It was also agreed that in the Change 7 evaluations, FAATC and Lincoln Laboratory will look for specific vertical rate combinations that result in NMACs; MITRE will then determine the frequency of these combinations in the ARTS database.
There was no discussion on the issue of aircraft display capability.
7.3 GENERAL CONCLUSIONS AND RECOMMENDATIONS
7.3.1 Conclusions
In any discussion of NMACs, it is important to remember the following. The simulation encounters were derived from actual recorded aircraft maneuvers. However, the range of values used by the simulation for aircraft vertical rates and accelerations exceeds the typical values seen in the airspace, and maneuvers are timed to purposely create worst-case situations for TCAS. This means that TCAS is not expected to resolve all of the encounters used in this evaluation. The simulation encounters were designed to stress the CAS logic, not to replicate the statistics of the airspace. Any examination of TCAS failures must take into consideration the likelihood that the particular encounters will occur in the real airspace.
General conclusions of the 6.04a evaluation are as follows:
(1) Logic version 6.04a resolved all Seattle-type encounters in the simulation.
(2) When compared to version 6.04, version 6.04a greatly reduced the number of induced NMACs in all rate-to-level non-crossing geometries. There were fewer crossing RAs issued in each of these geometries and also better results from the crossing RAs that were issued.
Note - For aircraft displays that cannot properly display the required vertical rate-to- maintain, there will be less reduction in the number of induced NMACs. This is being addressed in the Change 7 logic.
(3) When compared to version 6.04, there did not appear to be any new problems introduced by the 6.04a logic.
(4) There were no interoperability problems seem among the 6.02, 6.04, and 6.04a logic versions.
(5) There were no tables in which 6.04a induced NMACs in more than 2% of the encounters.
65

(6) There were four tables in which 6.04a had more than twice the number of NMACs as version 6.02. These were all low-frequency planned crossing encounters, and the increase in NMACs in these tables was not considered significant.
(7) Situations most troublesome to the CAS logic (all versions, including version 6.04a) include the following:
high vertical rates in one or both aircraft (generally 5000 fpm, sometimes 3000 fpm)
level-off maneuvers in which the planned separation is less than 1000 feet
late planned vertical maneuvers (maneuvers that begin just as the range tau threshold is crossed)
late planned vertical maneuvers that are opposite to the direction of the TCAS RA.
Overall, the main conclusion is that there were no encounters found that indicated a clear safety problem with the 6.04a logic. There was nothing resembling the severity of the Seattle encounter, in which (with 6.02 and 6.04) TCAS could take a benign, commonly-occurring situation and induce an NMAC. There are certain situations that the 6.04a logic cannot handle, but there is consensus among the organizations that formed the review group that these situations are rare and can be addressed further with the Change 7 logic.
7.3.2 Recommendations
There are four major recommendations from this study:
(1) Determine if the Change 7 logic improves on the 6.04a performance as expected. Use the Lincoln Laboratory analysis tools to analyze the performance of both the Change 7/Information Release 5 logic and the final Change 7 logic. Note any new problems that occur. Compare in detail the 6.04a and Change 7 performance of the 6.04a NMAC encounters.
(2) Develop a class of encounters in which the aircraft overshoot the planned altitude. Run these encounters in addition to the current set of encounters using the Change 7 logic.
(3) Continue to gather data (airborne TCAS recordings, ARTS data, Mode S sensor monitoring) regarding the frequency in the real airspace of:
high vertical rates (> 3000 fpm),
level-offs in which the planned separation is less than 1000 feet.
Determine if further work needs to be done to improve performance in these areas.
(4) Ensure that aircraft displays are capable of displaying RA information required by TCAS.
66

REFERENCES
[1] McLaughlin, M. P. and A. D. Zeitlin, "Safety Study of TCAS II for Logic Version 6.04."
Department of Transportation Report, DOT/FAA/RD-92/22, July 1992.
[2] "Minimum Operational Performance Standards For Traffic Alert and Collision Avoidance
System (TCAS) Airborne Equipment, Volume II, Consolidated Edition." RTCA/DO-185,
23 September 1983.
[3] Lubkowski, David I, "TCAS Logic Version 6.04a Pseudocode and SRS Changes." The
MJTRE Corporation, McLean, VA, F046-L-0056,20 July 1993, letter to Tom Williamson.
[4] TCAS Program Review, 26 July 1994, briefing by Gary Gambarani of Aeronautical Radio,
Inc.
67