linguistic complexity, schematic …jherold08/ed633/martiniello linguistic...the relationship...
TRANSCRIPT
Educational Assessment, 14:160–179, 2009
Copyright © Taylor & Francis Group, LLC
ISSN: 1062-7197 print/1532-6977 online
DOI: 10.1080/10627190903422906
Linguistic Complexity, SchematicRepresentations, and Differential Item
Functioning for English Language Learnersin Math Tests
Maria Martiniello
Educational Testing Service
This article examines nonmathematical linguistic complexity as a source of differential item
functioning (DIF) in math word problems for English language learners (ELLs). Specifically, this
study investigates the relationship between item measures of linguistic complexity, nonlinguistic
forms of representation and DIF measures based on item response theory difficulty parameters
in a state fourth-grade math test. This study revealed that the greater the item nonmathematical
lexical and syntactic complexity, the greater are the differences in difficulty parameter estimates
favoring non-ELLs over ELLs. However, the impact of linguistic complexity on DIF is attenuated
when items provide nonlinguistic schematic representations that help ELLs make meaning of the
text, suggesting that their inclusion could help mitigate the negative effect of increased linguistic
complexity in math word problems.
Assuring valid and fair assessments of subject-based skills for students who are not profi-
cient in English is one of the most pressing and challenging issues confronting large-scale
educational assessment today. English language learners (ELLs) are a very rapidly growing
student group in U.S. public schools. Whereas the general school population increased about
12% in the last decade, ELL enrollment has more than doubled (Kindler, 2002). In 2002,
there were approximately 5 million ELLs in U.S. public schools, comprising 10% of the
primary–secondary school enrollment. Though grouped under one label, ELLs represent a
myriad of national, cultural, and linguistic backgrounds (Kindler, 2002). Although 80% of
these students are Spanish speaking, the remaining 20% speak one of 460 different languages
at home. ELLs are also among the lowest scoring groups in the National Assessment of
Educational Progress (NAEP) mathematics assessment. Close to half of ELLs scored below
Correspondence should be sent to Maria Martiniello, Educational Testing Service, Rosedale Road, MS 09-R,
Princeton, NJ 08541. E-mail: [email protected]
160

LINGUISTIC COMPLEXITY, SCHEMATIC REPRESENTATIONS 161
Basic in the NAEP fourth-grade mathematics tests of 2005, 2007, and 2009 (46%, 44%, and
43%, respectively). By comparison, 18% of non-ELLs in 2005 and 16% in 2007 and 2009
scored below Basic in the same grade level (U.S. Department of Education, 2005, 2007,
2009).
The growing size of this diverse group of students poses considerable challenges to schools
not only in designing instruction but also in interpreting assessment results (National Re-
search Council, 2000) particularly in today’s high-stakes environment. At the federal level,
the No Child Left Behind Act mandates the inclusion of and disaggregated score-reporting
for ELLs in the accountability systems for schools operating with Title I funds (U.S. De-
partment of Education, 2002). The use of testing for high-stakes decisions presupposes that
a student’s test score is an accurate reflection of his or her mastery of a particular content
area, such as math. This assumption, however, might be flawed for the ELL population.
Numerous reports commissioned by the National Research Council discuss the questionable
validity of content-based assessments for students who are not proficient in English (August
& Hakuta, 1997; National Research Council, 2000, 2002). As stated in the 2000 report, “a
test [of proficiency in a content area] cannot provide valid information about a student’s
knowledge or skills if a language barrier prevents the students from demonstrating what
they know and can do” (p. 20). Research suggests that items with unnecessary linguistic
complexity in subject-based assessments such as math are a potential source of bias when
assessing ELLs’ subject mastery (Abedi, 2004; Abedi, Leon, & Mirocha, 2003). Experts
argue for the need to sort out language skills of ELLs from subject-area knowledge (Abedi,
2004; Abedi & Lord, 2001). However, they recognize the difficulty in doing so because
all assessments administered in English are also measures of English proficiency (Ameri-
can Educational Research Association, American Psychological Association; National Council
on Measurement in Education, 1985; August & Hakuta, 1997; National Research Council,
2000).
In an effort to disentangle the confounding of language skills with math proficiency in the
math assessment of ELLs, this study investigated whether the relative difficulty of mathematic
items for ELLs is associated with construct-irrelevant linguistic complexity in word prob-
lems. Employing item response theory (IRT) differential item functioning (DIF) methods, this
study examined the relationship between nonmathematical linguistic complexity of math word
problems and the differential performance of ELLs and non-ELLs. Specifically, it investigated
whether the magnitude of DIF measures (differences in IRT difficulty parameter estimates)
for ELLs versus non-ELLs are associated with item measures of nonmathematical linguistic
complexity in a state fourth-grade mathematics test.
However, mathematics discourse in context integrates linguistic and nonlinguistic modalities
of communication. In addition to text, graphs, equations, and diagrams are an integral part
of math word problems, math textbooks, curriculum standards, and classroom instruction.
Thus, this study also explored the impact of such symbolic and visual representations on
the relationship between text linguistic complexity and DIF for language proficiency status.
Specifically, it investigated whether the effect of nonmathematical linguistic complexity on
DIF was moderated by the nature of symbolic/visual forms of representations present in the
item (i.e., what is the interaction between type of symbolic representations and nonmathematical
linguistic complexity when modeling differences in the IRT difficulty parameter estimates for
ELLs and non-ELLs?).

162 MARTINIELLO
RESEARCH BACKGROUND AND CONTEXT
The language of mathematics has been described as a “unified system of meaning-making”
(Lemke, 2003, p. 1) that integrates the multiple semiotic resources of natural language, technical
math terminology, and nonlinguistic symbolic and visual forms of representation. Successful
math word problem solving requires competently decoding each of these various modalities.
First, students must comprehend the item’s verbal “language in general” or natural language.1
The more complex the text is, the more difficult it will be to process, increasing reading time
and/or leading to misinterpretations of the problem and, in turn, to incorrect solutions (Mestre,
1988). In addition, students need to know the domain-specific terminology of mathematics, that
is, both the specialized vocabulary (i.e., triangle, coordinates) and syntactic structures (greater
than; 10 apples weigh the same as 2 melons) that are typical of math discourse (Abedi, Lord,
& Plummer, 1997; Halliday, 1978; Lemke, 2003; Mestre, 1988). Finally, students also need
to interpret nonlinguistic math symbols and their particular syntax to decode mathematical
meaning, such as in equations, as well as make sense of visual displays, diagrams, graphs, and
figures.
By definition, ELLs have not yet acquired sufficient mastery of the English language to
perform in regular classrooms. Consequently, excessive linguistic complexity is expected to
compromise their understanding of math word problems more than non-ELLs’ understanding.
Consistent with this expectation, this study hypothesized that excessive linguistic complexity in
the natural language of math word problems would function as a source of construct-irrelevant
difficulty (Messick, 1989) for ELLs, making linguistically complex items “irrelevantly more
difficult” for this group than for non-ELLs with equivalent math proficiency, compared to
linguistically simple items. The term linguistic complexity used throughout this study refers to
construct-irrelevant linguistic complexity of the natural language in math word problems, and
not to the math-related terminology that is specific to the construct the math test intends to
measure.
Likewise, because decoding of math word problems often involves both linguistic and
nonlinguistic symbols, the study hypothesized that the presence and type of symbolic/visual
representations in the item would moderate the impact of increased linguistic complexity on
language proficiency DIF.
Previous Research on Linguistic Complexity and Math Performance
of ELLs
According to the literature, the linguistic features of natural language that create comprehension
difficulties for ELLs include vocabulary/lexical complexity (number of low-frequency, abstract,
ambiguous/polysemous, idiomatic, and culture-specific nonmathematical vocabulary terms) and
increased syntactic complexity (measured as mean sentence length in words, item length in
words, noun phrase length, number of prepositional phrases, and participial modifiers, presence
of syntactically complex sentences; i.e., with relative, complement, adverbial and conditional
clauses; Abedi & Lord, 2001; Abedi, Lord, & Hofstetter, 1998; Abedi et al., 1997; Butler,
1The term natural language refers to both the nonacademic or everyday language learned at home and other
informal settings, and also the general, cross-disciplinary academic language learned at school.
LINGUISTIC COMPLEXITY, SCHEMATIC REPRESENTATIONS 163
Bailey, Stevens, Huang, & Lord, 2004; Kim-Wolf et al., 2008; Martiniello, 2006a, 2007b,
2008; Spanos, Rhodes, Dale, & Crandall, 1988).
In the last decade, a few important empirical studies have investigated the relationship
between some of these linguistic features and the difficulty (p value) of math word problems
for ELLs and non-ELLs in elementary, middle, and high school levels (Abedi et al., 2005;
Abedi & Lord, 2001; Abedi et al., 1998; Abedi et al., 1997; Lord, Abedi, & Poosuthasee,
2000; Shaftel, Belton-Kocher, Glasnapp, & Poggio, 2006). Although many of these studies
did, as predicted, find a relationship between linguistic complexity and ELLs’ performance in
math word problems, the effect of specific linguistic features varied from test to test and from
one grade to another.
Of the features studied, only item length has shown relatively consistent negative effects on
item difficulty for ELLs and non-ELLs in a variety of math tests and grade levels in national
and state samples. Longer items exhibited greater p value differences across ELLs and non-
ELLs than shorter items did in the eighth-grade NAEP math test (Abedi et al., 1997) and the
Stanford Achievement Test 9th Edition (SAT9; Lord et al., 2000). Also, longer items showed
lower p values than shorter items for both ELLs and non-ELLs in the fourth-, seventh-, and
tenth-grade Kansas general math assessments (KGMA; Shaftel et al., 2006).
Employing discriminant-function analysis, Abedi et al. (1997) examined the interaction
between item length and language spoken at home on item mean score or p value on the 1990
NAEP eighth-grade math test. Item length was measured as number of lines in the stem and
answer choices (short item: one line, long item: two or more lines). They found that both
long and short items were more difficult for students who always spoke a language other than
English at home than for those that spoke only English (Booklet 9 long items’ means were 0.32
and 0.43, respectively, p < .01; short items 0.46 and 0.53, respectively, p D .12; see Table 15
in Abedi et al., 1997), remarking that the relationship between language spoken at home and
item difficulty was “more evident for the longer items than for the shorter items” (p. 19).
Working with third- and eighth-grade students in Delaware, Lord et al. (2000) estimated
differences in the item p values for ELLs and non-ELLs2 in the SAT9. They correlated these
performance gap indices with item length (now measured in terms of number of words rather
than lines) and found significant correlations in eighth but not in third grade. In eighth grade,
longer items exhibited larger difficulty differences across groups than did shorter items.
Using multiple regression, Shaftel et al. (2006) modeled item p value as a function of item
length (and other linguistic features) for general students, ELLs, and students with disabilities
in the 2000 KGMA administered in Grades 4, 7 and 10. They found no interactions between
pattern of linguistic features and group membership. For the groups combined, the total number
of words in the item was a significant predictor of item p values in seventh grade, although
not in fourth or tenth grade. Not surprisingly, the item p values were greater for the general
population than for ELLs, in all grades.
Results for other linguistic features have been relatively inconsistent. For example, items
with ambiguous or multiple meaning words were more difficult than items with fewer or none
of these features for both ELLs and non-ELLs in the fourth-grade KGMA, but this effect was
not significant in the seventh and tenth grades (Shaftel et al., 2006).
2This study used the terms LEP and EP, Limited English Proficiency and English Proficient.

164 MARTINIELLO
Likewise, the presence of idioms, uncommon words and/or words used in an uncommon
way was not significantly correlated with (unconditional) item p value differences across ELLs
and non-ELLs in a third-grade math subtest of a standardized achievement test (Abedi et al.,
2005). Neither was the presence of low-frequency vocabulary in the third and eighth grade
SAT9 (Lord et al., 2000).
The number of prepositions and pronouns had no effect on item p values for ELLs or non-
ELLs in the KGMA seventh and tenth grades, but their effects were significant in the KGMA
fourth grade (Shaftel et al., 2006). The presence of complex or uncommon syntactic structures
did not show significant correlations with group p value differences in the third-grade math
subtest, whereas the presence of multiple clauses did (r D .32, p D .02; Abedi et al., 2005).
Neither the number of passive voice sentences nor the number of subordinate clauses has shown
significant effect in any of the tests and grades studied (NAEP Grade 8 in Abedi et al., 1997;
SAT9 Grades 3 and 8 in Lord et al., 2000; KGMA Grades 4, 7, and 10 in Shaftel et al., 2006).
Although most linguistic features have failed to show a significant effect on item difficulty
when considered individually, research employing different levels of aggregation of linguistic
complexity indicators suggests that their effect is significant when they are considered together
in a composite scoring of overall linguistic complexity. For instance, Abedi et al. (1997) found
that a linguistic complexity score based on familiarity of nonmathematical vocabulary, presence
of syntactically complex sentences, relative clauses, and abstract format of the item statement
significantly predicted the difference between the item p values for ELLs and non-ELLs in the
NAEP eighth-grade national sample.
These findings suggest that using a composite scoring of overall linguistic complexity (in-
cluding both syntactic and lexical indicators) might be more appropriate in capturing challenges
to text comprehension than using each of the features as individual indicators or aggregating
them under separate categories for vocabulary and grammar.
Consistent across studies is the practice of considering only verbal natural language for
the linguistic complexity analyses, excluding specialized math terminology. In the one study
that did examine math vocabulary, attributes of this vocabulary did predict performance. For
instance, difficulty of math vocabulary was the only “linguistic” feature to show a significant
negative effect on item p values across all grades (4, 7, 10) for both ELLs and non-ELLs in the
KGMA (Shaftel et al., 2006). However, math vocabulary is not a construct-irrelevant feature
of math items. After all, understanding the meaning of math terms of varying difficulty is part
of what a math test intends to measure. Therefore, considering difficult math vocabulary as an
indicator of purely linguistic (rather than mathematical) complexity in items would not help us
distinguish the effect of English language skills from subject knowledge in the performance of
ELLs and non-ELLs.
To identify construct-irrelevant variation in item performance, the studies reviewed relied
mainly on measures of item impact. Their outcomes included either group p values or differ-
ences in group p values for ELLs and non-ELLs. However, to identify items unusually favoring
one group over another, one must look at differences in item performance, in this case difficulty,
for ELLs and non-ELLs matched on their math proficiency (i.e., DIF). A more recent study by
Abedi (2004) overcomes this problem with the use of contingency table methods that condition
on math scores. Abedi examined whether items functioned significantly differently for language
background groups in the 1992 NAEP long-term trend math test using the Mantel-Haenszel
(Holland & Thayer, 1988) DIF statistic. Matching students on total items correct at the block

LINGUISTIC COMPLEXITY, SCHEMATIC REPRESENTATIONS 165
level, Abedi identified some items showing significant DIF against students who always spoke
a language other than English at home. After comparing the number of items flagged for DIF
across groups, he posed that these items were affected by language factors. However, unlike his
previous studies, this one did not analyze the items’ linguistic features. Neither did it examine
the relationship between particular linguistic features and the results of the Mantel-Haenszel
DIF analyses.
Symbolic and Visual Representations in Math Items
Despite the fact that most math word problems include symbols and figures along with text,
none of the studies reviewed have examined the combined effect of linguistic complexity and
nonlinguistic forms of representation on differential item difficulty for ELLs and non-ELLs.
However, the language of mathematics includes more than the natural language on which
the linguistic complexity measures rely. As a multisemiotic system, mathematics discourse
in context integrates multiple modalities of communication. In math textbooks, classroom
instruction, and assessment, students make sense of a particular math word problem using
both the linguistic and nonlinguistic symbols coexisting in such an item (Barton & Neville-
Barton, 2003a, 2003b; Halliday, 1978; Lemke, 2003; Mestre, 1988; O’Halloran, 2000). In
fact, Lemke (2003) found that “competent deployment of mathematical meaning in context is
typically interdependent with both verbal language and visual representations” (p. 12).
In the case of ELLs from diverse age groups, research has shown that nonlinguistic visual
representations are an especially important tool for making sense of math tasks and conveying
math concepts (Barton & Neville-Barton, 2003a, 2003b; Turner, Dominguez, Maldonado, &
Empson, 2006). For instance, during problem-solving discussions, fourth- and fifth-grade ELLs
struggling to express their mathematical ideas through spoken English used representations such
as diagrams and symbols to help them communicate their mathematical thinking (Turner et al.,
2006).
Furthermore, in experimental math tests designed to present similar math questions using
different modalities of representation,3 undergraduate ELLs showed greater understanding of
nonlinguistic or nontextual modes of representation than of textual modes of representation.
They also tended to resort to nontextual modes to make sense of math questions when they could
not understand the English text (Barton & Neville-Barton, 2003a, 2003b). Specifically, under-
graduate ELLs tended to “understand symbolic and graphical questions best, then diagrammatic
questions, and [English] text questions least” (Barton & Neville-Barton, 2003a, p. 8). When the
same questions were presented in two modes (text only and symbols) ELLs chose to work with
the symbolic mode more frequently than with the text-only mode. Also, undergraduate ELLs
and non-ELLs of comparable math ability did not differ in their understanding of math problems
presented in nontextual modes, whereas they did differ in their understanding of text-only math
questions. These findings suggest that ELLs’ difficulty comprehending English text in math
word problems “may be overcome with symbolic, diagrammatic, or graphical understanding”
when math assessments present problems through different modalities of representation (Barton
& Neville-Barton, 2003b, p. 6).
3The five modalities included English text only, mathematical technical text, symbols, diagrams, and graphs.

166 MARTINIELLO
The literature on how students generate visual representations when problem solving in
mathematics provides different categorizations of visual representations that can be helpful in
classifying the types of nonlinguistic representations used in math items. Common across the
classifications reviewed are two basic categories of representations, pictorial and schematic.
Pictorial representations include concrete images (Presmeg, 1986), sometimes called mental
pictures (Andersen, as cited in Johnson, 1987), which depict details of objects described
in the math problem (Hegarty & Kozhevnikov, 1999). Schematic representations are more
abstract than pictorial images. They are meaning structures representing several elements or
parts (i.e., objects, people, events) and their pattern of connections and relationships (i.e.,
causal, part-whole, temporal sequence relationships; Johnson, 1987). This characterization of
schematic representations would include Hegarty and Kozhevnikov’s definition of schematic
representations as those “encoding the spatial relations described in a problem” (p. 684), and
Presmeg’s definition of pattern imagery as “pure relationships depicted in a visual-spatial-
scheme” (p. 43). It could also subsume Presmeg’s category of images of formulae, where
relationships among numbers and variables are represented. This study hypothesized that as
more “schematic” meaning is provided by the symbolic/visual representation in the item, the
more it will attenuate the effects of linguistically complex text on ELLs performance.
METHODS
In this study, the IRT difficulty parameter estimates of ELL and non-ELL fourth graders were
compared for math items of varying linguistic complexity and pictorial or schematic support.
In the first stage of the study, the items’ linguistic complexity was rated, the presence and
type of symbolic/visual representation coded, and measures of IRT DIF (i.e., differences in the
difficulty parameter estimates) were obtained for ELLs and non-ELLs. In a second stage of
analyses, Ordinary Least Square multiple regression was used to model the items’ DIF measure
as a function of the items’ linguistic complexity and the use of schematic representations in
the item.
Instrument
This study analyzed the English version of a state fourth-grade mathematics test. This is a
standards-based achievement test aligned with the state’s mathematics curriculum framework.
It includes five major learning strands: (a) number sense and operations; (b) patterns, relations,
and algebra; (c) geometry; (d) measurement; and (e) data analysis, statistics, and probabilities.
Items were of three types: multiple choice (MC; 29 items scored 0–1), short answer (SA; 5 items
scored 0–1), and open response (OR; 5 items scored 0–4). The 39-item long test was calibrated
using the three-parameter logistic model for MC items, the two-parameter logistic model for
SA items and Samejima’s Graded Response Model for polytomous items.
Sample
The sample comprised 68,839 fourth graders who took the test statewide in the spring of
2003. The focal group included 3,179 ELLs, whereas the reference group included 65,660

LINGUISTIC COMPLEXITY, SCHEMATIC REPRESENTATIONS 167
non-ELLs. Students classified as former ELLs were excluded from the DIF analysis because,
although they were assumed to have acquired sufficient mastery of the English language to
perform in regular classrooms, they are typically not fully proficient in English. Because the
study’s purpose was to examine the linguistic complexity of items written in English, ELLs
taking the test in Spanish were also excluded from the sample.
Measures
DIF. In the unidimensional IRT model applied here, DIF measures were estimated as
the difference between the difficulty parameter estimates of the studied item for ELLs (focal
group) and non-ELLs (reference group), constraining pseudo-guessing (multiple choice only)
and discrimination parameters to be equal across groups.
An all-item anchor DIF approach (Thissen, 2001) was employed, wherein the conditioning
variable or anchor included all the items except the studied item. In this approach, the item
parameters are constrained to be equal for ELLs and non-ELLs for all items in the test, except
the studied item. For the studied item, the values of the difficulty parameters are allowed to vary
across groups, whereas the pseudo-guessing and the discrimination parameters are constrained
to be equal across groups.
Thissen’s IRTLRDIF v.2.0b program was used to estimate item parameters and DIF measures
for the 39-item long test.4 For each studied item, an omnibus likelihood ratio test for item DIF
was estimated comparing a model constraining all item parameters to be constant across groups
and a model allowing all item parameters to vary for the studied item. When this omnibus test
was not significant at the .05 alpha level, the conditional difference between the difficulty
parameter estimates for ELLs and non-ELLs was set to zero. When this omnibus test was
significant at the .05 level, b parameter estimate differences across the groups were estimated,
such that the DIF index b was b for the focal group minus b for the reference group. An item
with a negative DIF index favors ELLs over non-ELLs relative to the rest of the items in the
test. The mean value of this all-item anchor DIF measure is expected to be zero across all
items. Thus, if positive DIF exists for one item, then this approach must yield a corresponding
amount of negative DIF spread across other items, and vice versa.
Test of model assumptions: Unidimensionality. Both the IRT models used to scale the
test and those used here assume that performance on a test reflects an underlying single ability
or proficiency. Unidimensional IRT models tolerate a certain degree of multidimensionality
in test scores, which DIF measures detect at the item level. However, their use would be
precluded in the case of flagrant violations of the unidimensionality assumption. Thus, a
first factor dominance must be confirmed to support the use of a unidimensional model. To
test the appropriateness of modeling the data with a unidimensional IRT model, principal
component analyses of the items were conducted for the ELL and the non-ELL samples
together and separately. Plots of the eigenvalues were generated for each group, confirming that
the first factor was indeed dominant for both groups. Also, the relative size of the eigenvalues
complied with the criterion suggested by Hambleton, Swaminathan, and Rogers (1991) for
4The IRTLRDIF v.2.0b program implements the Bock-Aitkin (1981) marginal maximum likelihood estimation
algorithm. It produces very similar although not identical results to the MULTILOG program (Thissen, 2001).

168 MARTINIELLO
unidimensional model fit. The first eigenvalue was more than five times the size of the second
largest eigenvalue, which in turn was relatively similar to the size of the rest of eigenvalues.
Linguistic Complexity
Indicators of linguistic complexity were gathered from experts’ ratings of the items’ grammat-
ical and lexical complexity as well as a microanalysis of the text’s linguistic complexity. In
this paper, the main predictor was a composite linguistic complexity score for each item. It is
the sum of the standardized ratings for the item’s textual microanalysis, average grammatical
complexity and average lexical complexity across experts.
Expert ratings. For this study, a panel of ten recognized researchers in the field of literacy,
linguistics, and bilingual education was gathered to rate the overall linguistic complexity of each
item and provide grammatical and lexical complexity scores for each item. The scoring rubrics
specified five levels of complexity ranging from 1 (least complex) to 5 (most complex). The
grammatical rubrics identified the presence of simple and/or complex grammatical structures in
the item and determined whether the structures were essential for comprehending the text. The
lexical rubrics identified the word usage frequency of the items’ nonmathematical vocabulary
and its potential impact on text comprehension. When scoring items with lower frequency
words, the expert raters were asked to consider whether their meaning would be hard to derive
from context, and whether they were so central for item comprehension that not knowing them
would interfere with comprehending the item.
As discussed earlier, mathematical words were excluded from the lexical complexity analyses
because they are relevant to the construct the test intends to measure. Therefore, for the lexical
rating, the expert raters were advised to disregard previously identified mathematical words in
their test materials, and concentrate instead on the natural language in which the mathematical
terms were embedded. Identification of the mathematical words in the test was based on the
literature reviewed as well as the judgment of two mathematics teachers, one general classroom
teacher with expertise in bilingual education, and a mathematics curriculum specialist from the
Harvard Graduate School of Education faculty.
Prior to their use by expert raters, both the grammatical and lexical scoring rubrics and the
scoring instructions were pilot-tested with a group of classroom teachers enrolled as master’s
students in an introductory linguistics class at Harvard Graduate School of Education. The
scoring instructions included directions to promote rating consistency within each expert rater
across items in the test. To prevent variations in the leniency of rating or rating drift for each
expert rater, raters were provided with benchmark items to be used as points of reference.
Raters were periodically asked to look back at their ratings for the benchmark items to check
whether their rating of linguistic complexity had become harsher or more lenient as they
progressed through the test. If their rating had drifted, raters were instructed to rescore the
items accordingly.
All items in the test were scored by all ten expert raters in the grammatical complexity
scale and the lexical complexity scale. Repeated ratings of each item were averaged across
the ten expert raters to produce a mean item grammatical complexity score and a mean item
lexical complexity score. These average scores are expected to be much more reliable than the
individual expert ratings (Shrout & Fleiss, 1979). To assess the interrater reliability of expert
LINGUISTIC COMPLEXITY, SCHEMATIC REPRESENTATIONS 169
ratings, intraclass correlation coefficients were estimated using a two-way random effects model
(all experts rate all items; raters and items are considered random effects) for average measure
reliability (reliability of ratings averaged across multiple raters) and absolute agreement (raters
assign identical rather than similar scores). The interrater agreement was high. The intraclass
correlation coefficients were 0.89 for the mean grammatical complexity score and 0.87 for the
mean lexical complexity score.
Microanalysis of the text’s linguistic complexity. As an additional measure of linguistic
complexity, a coding system was developed to identify grammatical elements of complexity
such as number of clauses, noun phrases, verbs, and verb phrases. The coding system captured
the length of these grammatical elements by marking the beginning and ending of each clause
or phrase. Additional codes further specified the syntactic function or type of all elements and
the syntactic order of clauses.
Two linguists were trained to use this micro-analytic coding manual with items from a
different version of the fourth-grade math test. The first linguist coded all 39 items, whereas
the second linguist coded 20% of the items independently and reviewed the first rater’s original
coding for the remaining 80%. The interrater agreement in the microanalytic coding adjusted
for chance agreement was high (Cohen’s � D .89). Discrepancies were discussed and when
needed, items were recoded accordingly. Based on the text microanalysis, linguistic complexity
scores were derived for the items using the same five-level rubrics employed by the panel of
experts.
Nonlinguistic Forms of Representation
Measures of this variable were drawn from experts’ ratings of the items. In addition, student
responses were collected for triangulating the data and informing the final categories of
nonlinguistic forms of representation included as variables in the regression model predicting
DIF. However, students’ responses were not used as predictors in the DIF models.
Student responses. To capture how students use nonlinguistic forms of representation to
scaffold their understanding, think-aloud protocols of the test were administered to 24 fourth-
grade ELLs in six inner-city public schools from the state. The students were first- or second-
generation Latin-American immigrants with at least 2 years of schooling in the United States
and came from homes where Spanish was the primary language. Students were asked to read the
item text aloud and explain whether they could (a) understand the text in English; (b) rephrase
the text in Spanish or English to demonstrate their understanding of its meaning; (c) identify
which aspects (if any) of the English text they could not understand; and (d) figure out what the
item was requiring them to do, even if they could not understand the text in its entirety (e.g.,
by making meaning of nonlinguistic forms of representations in the item, such as equations,
diagrams, and figures).
Items were coded as affording the opportunity to use nonlinguistic representations on the
basis of the interview responses. If at least one of the children successfully relied on the
nonlinguistic representations in the item to scaffold their understanding of the text, the item
was coded 1; all other items were coded 0. Thus, the presence of equations or figures in the

170 MARTINIELLO
item would only correspond to a score of 1 if the ELLs relied on it to understand what the
item was requiring them to do.
Expert ratings. Two raters coded the items according to a categorization scheme of
visual representations in math problem solving derived from Hegarty and Kozhevnikov (1999),
Johnson (1987), and Presmeg (1986). First, all items were coded according to three categories:
text only, primarily pictorial (images depicting concrete objects), and primarily schematic
(visual image or symbols represent spatial or numerical relationships among objects/variables).
The categories were named primarily pictorial or primarily schematic to reflect the fact
that some representations may include features of both categories and that their ultimate
classification is a matter of degree. Coding disagreements between raters were discussed until
a final coding was agreed upon.
The correlation between the experts’ ratings of items as primarily schematic and the students’
use of nonlinguistic representations in the interviews was significant (r D .67, p < .01). In most
cases, the ELLs interviewed relied on primarily-schematic representations to make meaning
of the text that they could not understand entirely, whereas primarily-pictorial representations
were seldom used by interviewees. The strong association between the raters’ judgment of
the schematic qualities of the item’s imagery and students’ reliance on such representations to
elucidate meaning in texts suggested that it would be appropriate to further dichotomize items
according to their schematic qualities. Therefore, the three categories were collapsed into one
dummy variable, schematic representation. Items originally coded as text only or primarily
pictorial were recoded as 0, and items coded as primarily schematic were recoded as 1.
Thus, items coded as nonschematic representations included either text only or text along with
pictorial images of concrete objects, while items coded as schematic representations included
a combination of text and nonlinguistic representations depicting mathematical relationships in
the form of visual-spatial patterns or algebraic expressions. This dummy variable (the experts’
classification of the items as schematic representations) was used as a predictor in the multiple
regression analyses predicting DIF.
Item format. The regression analyses predicting item DIF included the 34 dichotomously-
scored items only, examining two types of item format—SA items, where students construct
brief responses to the item, and MC items.
P value. The p value is the proportion of students who answer the item correctly in the
whole sample, including both ELLs and non-ELLs.
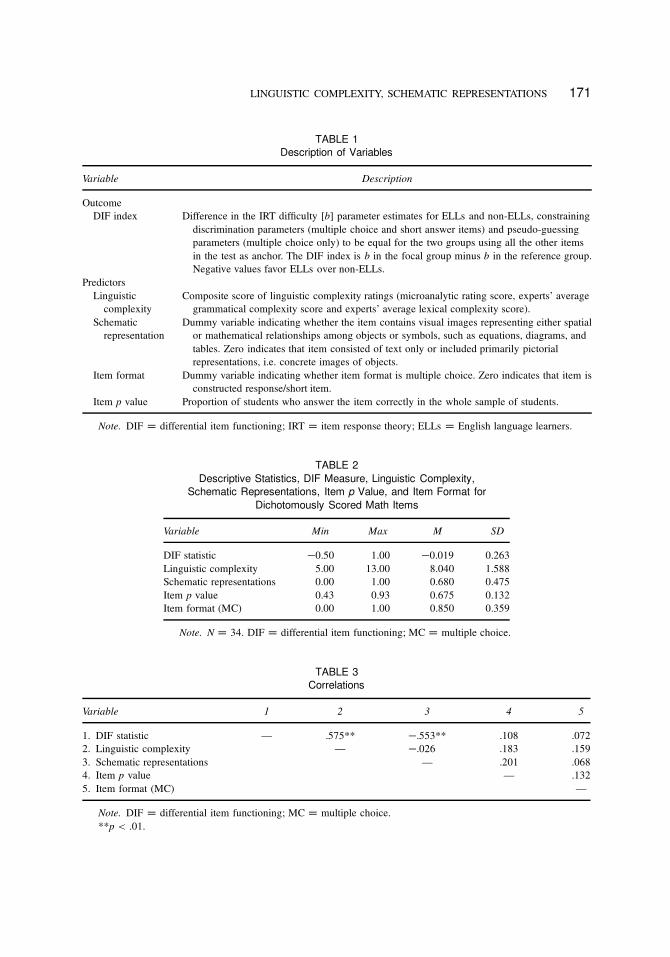
Table 1 summarizes the variables and their description.
RESULTS
Descriptive Statistics and Correlations
Table 2 presents descriptive statistics and Table 3 the bivariate correlation matrix. Linguistic
complexity and schematic representation correlated significantly with measures of DIF (r D .58,
p < .001; r D �.55, p < .001 respectively). On average, items with greater linguistic complexity
LINGUISTIC COMPLEXITY, SCHEMATIC REPRESENTATIONS 171
TABLE 1
Description of Variables
Variable Description
Outcome
DIF index Difference in the IRT difficulty [b] parameter estimates for ELLs and non-ELLs, constraining
discrimination parameters (multiple choice and short answer items) and pseudo-guessing
parameters (multiple choice only) to be equal for the two groups using all the other items
in the test as anchor. The DIF index is b in the focal group minus b in the reference group.
Negative values favor ELLs over non-ELLs.
Predictors
Linguistic
complexity
Composite score of linguistic complexity ratings (microanalytic rating score, experts’ average
grammatical complexity score and experts’ average lexical complexity score).
Schematic
representation
Dummy variable indicating whether the item contains visual images representing either spatial
or mathematical relationships among objects or symbols, such as equations, diagrams, and
tables. Zero indicates that item consisted of text only or included primarily pictorial
representations, i.e. concrete images of objects.
Item format Dummy variable indicating whether item format is multiple choice. Zero indicates that item is
constructed response/short item.
Item p value Proportion of students who answer the item correctly in the whole sample of students.
Note. DIF D differential item functioning; IRT D item response theory; ELLs D English language learners.
TABLE 2
Descriptive Statistics, DIF Measure, Linguistic Complexity,
Schematic Representations, Item p Value, and Item Format for
Dichotomously Scored Math Items
Variable Min Max M SD
DIF statistic �0.50 1.00 �0.019 0.263
Linguistic complexity 5.00 13.00 8.040 1.588
Schematic representations 0.00 1.00 0.680 0.475
Item p value 0.43 0.93 0.675 0.132
Item format (MC) 0.00 1.00 0.850 0.359
Note. N D 34. DIF D differential item functioning; MC D multiple choice.
TABLE 3
Correlations
Variable 1 2 3 4 5
1. DIF statistic — .575** �.553** .108 .072
2. Linguistic complexity — �.026 .183 .159
3. Schematic representations — .201 .068
4. Item p value — .132
5. Item format (MC) —
Note. DIF D differential item functioning; MC D multiple choice.
**p < .01.

172 MARTINIELLO
tended to show positive DIF, that is, DIF favoring non-ELLs over ELLs. Items with schematic
representations were associated with negative DIF favoring ELLs over non-ELLs. Neither the
item format nor the item p value were significantly correlated with the measure of DIF (r D
.072, p D .686; r D .108, p D .543, respectively). There were no significant correlations among
measures of the items’ linguistic complexity, schematic representations, format, and p value.
Regression Analysis: Predicting DIF as a Function of
Linguistic Complexity
A series of Ordinary Least Square multiple regression models were fit to examine the effect
of linguistic complexity on the DIF measure of the dichotomously scored items (MC and
SA items). Table 4 shows two of the fitted models that include both linguistic complexity and
schematic representations. In the final fitted model, both the main effect of linguistic complexity
and its interaction with schematic representations in the item were significant (p < .001). The
model’s adjusted R2 was .663.
The main effect of linguistic complexity on DIF was positive (p < .001), controlling for
the presence and type of symbolic representations in the item. On average, more linguistically
complex items in the test tended to show greater DIF favoring non-ELLs over ELLs, whereas
less linguistically complex items in the test tended to show greater DIF favoring ELLs over
non-ELLs.
As mentioned earlier, the average DIF value approaches zero in this DIF detection method,
and DIF disfavoring non-ELLs in linguistically simple items can be seen as artifactual. In
contrast to our interpretation of potential bias against ELLs in linguistically complex items,
TABLE 4
Regressions of IRT DIF Measures for ELLs
on the Fourth-Grade Math Items’ Linguistic Complexity
and Schematic Representations
Predictors
Unstandardized
Model 1
Coefficients
Final Model
Intercept �0.564** �0.956***
(0.157) (0.205)
Schematic representation �0.298*** 0.424
(0.061) (0.277)
Linguistic complexity 0.093*** 0.141***
(0.018) (0.025)
Interactions
Linguistic Complexity � �0.090**
Schematic Representation (0.034)
Adjusted R2 0.596 0.663
Unadjusted R2 0.620 0.693
Note. Source is Martiniello (2007b). N D 34. IRT D item response
theory; DIF D differential item functioning; ELLs D English language
learners.
�p < .10. *p < .05. **p < .01. ***p < .001.

LINGUISTIC COMPLEXITY, SCHEMATIC REPRESENTATIONS 173
FIGURE 1 Differential item functioning (DIF) as a function of linguistic complexity and schematic
representations. Note. ELL D English language learner. Source: Martiniello (2007b).
we have no reason to believe that linguistically simple items are biased against non-ELLs. The
DIF detection methods used here set the mean value of DIF across items as zero (Angoff,
1993). Thus, the fact that linguistically simple items show DIF disfavoring non-ELLs should
not be cause of concern unless the differences are large enough to represent considerable DIF,
indicating need for item investigation.
Controlling for type of symbolic representations in the item, linguistically complex items
tended to have greater conditional difficulty for ELLs (and therefore a lower expected item
score) than for non-ELLs. At the highest end of the linguistic complexity range, items con-
tained complex grammatical structures that were central for comprehending the item, along
with mostly low-frequency, nonmathematical lexical terms whose meaning was central for
comprehending the item and could not be derived from context.5 Presumably these were
items that students with limited English proficiency simply could not understand. Conversely,
linguistically simple items tended to have lower conditional difficulty for ELLs (and therefore a
greater expected item score) than for non-ELLs. These items contained mostly high-frequency
nonmathematical lexical terms and simple grammatical structures. Some relatively simple items
included a “less familiar” term, but its meaning was derivable from context.
However, the extent of the impact of linguistic complexity on conditional difficulty for ELLs
varied as a function of whether the item had schematic representations. Figure 1 shows a plot of
the final regression model in Table 4 illustrating the interaction effect between these variables.
5A more extensive discussion of the linguistic characteristics of these items is included in Martiniello (2008)
Language and the performance of ELLs in math word problems.

174 MARTINIELLO
The regression line for the effect of linguistic complexity was significantly less steep for
items with schematic representation than for those without. The overall impact of the item
linguistic complexity on DIF was attenuated when ELLs could rely on the nonlinguistic
schematic representations in the item to scaffold their understanding of the text. When items
consisted of text only or text accompanied by pictorial representations, a standard deviation unit
increase in the text linguistic complexity corresponded to a sharper increase in the expected
conditional difficulty differences between ELLs and non-ELLs (0.22) than it would if the item
had schematic representations (0.13).
Additional empirical analyses were performed to test the robustness of the findings with
alternative codings of the variable symbolic/visual representation. Regression models were fitted
substituting the predictor schematic representation for a dummy variable indicating whether the
item consisted of text only (coded 0) or text along with nonlinguistic representations in general
(coded 1). In contrast to the original final model, neither the main effect nor the interaction with
linguistic complexity were significant for this variable, confirming our theoretical assumption
that it is not the mere presence of symbolic/visual representations in the item that matters,
but rather the type of representation that influences the differential difficulty of linguistically
complex items for ELLs.
When regression models identical to those in Table 4 were fitted for a subsample of 29 items,
which combined text and symbolic representations (excluding 5 text-only items), the results
were consistent with those found in the original final model with the 34 dichotomous items;
the effect of linguistic complexity and its interaction with schematic representations remained
significant. In this case, this indicated that the effect of linguistic complexity on DIF was
different for items with schematic and pictorial representations.
Replication Using a Second Measure of DIF
Results of DIF studies may vary depending on the characteristics of the DIF detection method
employed (Camilli & Shepard, 1994). To test the robustness of the IRT DIF findings, regression
models were fit using DIF indices from another DIF detection procedure: the standardization
(Dorans & Kulick, 1986) method. In contrast to the IRT DIF method, the standardization
procedure makes no assumptions about the relationships between item performance and student
ability as IRT models do. Also, its conditioning variable is based on observed total scores and
not on latent ability traits as for IRT. In the standardization procedure, a measure of DIF was
ascertained by estimating the signed average difference between the item p values of ELLs and
non-ELLs conditional on total score on the 39-item long test, assigning greater weight to p value
differences in the range of math scores where most ELLs lie. The standardization procedure
was conducted following the two-stage procedure recommended by Zenisky, Hambleton, and
Robin (2003). The matching variable or total test score was purified by removing three items
with large DIF indices (DIF > .075 or DIF < �.075).
The study findings are very robust regardless of the DIF detection procedure employed.
The correlation between the DIF measures from the IRT and standardization procedures was
very high (r D .93, p < .000). Similarly to the IRT DIF method, with the standardization
method the effect of linguistic complexity on DIF is significant and positive (p < .001) and
there is a significant interaction between linguistic complexity and the presence of schematic
representations in the item (p < .015).

LINGUISTIC COMPLEXITY, SCHEMATIC REPRESENTATIONS 175
DISCUSSION
This study investigated whether linguistic complexity of math word problems functioned
as a source of DIF for ELLs in the dichotomously scored items of a state fourth-grade
mathematics test. Going beyond prior research that looked at linguistic complexity in isolation,
this study acknowledged the multimodality of semiotic representations that characterizes the
deployment of mathematical meaning in the real context of classroom instruction, textbooks,
and assessments. The findings shed light on the prominent role of the text linguistic complexity
and its interaction with nonlinguistic symbolic/visual forms of representation in explaining
differences in the difficulty parameter estimates of math word problems for ELLs and non-
ELLs. Together, these two variables account for two thirds of the variation in DIF measures
across language proficiency groups in the items.
As hypothesized, the greater the items’ grammatical and lexical complexity, the greater
are the differences in difficulty parameter estimates favoring non-ELLs over ELLs. However,
the impact of linguistic complexity on DIF is attenuated when items provide schematic rep-
resentations that help ELLs make meaning of the text, suggesting that their inclusion could
help mitigate the negative effect of increased linguistic complexity in math word items. The
findings indicate that not all nonlinguistic visual representations are equally helpful. Schematic
representations, rather than pictorial illustrations or concrete images of objects, effectively
moderate the influence of increased complexity in text. These schematic representations embody
mathematical relationships, either spatial relationships among objects or patterns, or numeri-
cal/mathematical relationships through mathematical symbols or algebraic expressions.
Construct-Irrelevant Difficulty
DIF signals potential bias, but it is not in itself proof of bias. While a comprehensive evaluation
of bias is beyond the scope of this study, the findings reported here provide evidence supporting
the claim that linguistic complexity is a source of construct-irrelevant difficulty for ELLs in
math word problems. Scores on linguistically complex items capture not only differences in
math proficiency but also differences in English proficiency between ELLs and non-ELLs. The
latter generates disproportionate difficulty for ELLs on these items but not on those with low
linguistic complexity. This questions the extent to which we can interpret the scores of ELLs
in linguistically complex items as indication of their mastery in the particular math content the
items intend to measure.
A substantive review of evidence and a thorough examination of rival hypotheses that might
explain the conditional differential performance of these groups are both needed. For instance,
to confirm the role of linguistic complexity on DIF, linguistic simplification experiments can be
conducted to investigate whether a reduction of item linguistic complexity causes a reduction
of DIF disfavoring ELLs.
Investigating student response processes through cognitive interviews can also be helpful
in examining the role of linguistic complexity on DIF for ELLs. Martiniello (2007b, 2008)
conducted think-aloud interviews with Spanish-speaking ELLs responding to math word prob-
lems with low, moderate, and large DIF indices favoring non-ELLs over ELLs. Items flagged
with large DIF were discussed in depth along with comparison non-DIF items measuring
similar mathematical content but with different levels of linguistic complexity. For each item,

176 MARTINIELLO
curriculum content and linguistic features were analyzed, and DIF information and empirical
item characteristic curves by group presented along with transcriptions of children’s responses
to these items in the think-aloud interviews. Analysis of linguistic patterns across large DIF
items revealed the following features hindering text comprehension for ELLs:
� Syntactic: multiclausal complex structures with embedded adverbial and relative clauses;
long phrases with embedded noun and prepositional phrases; lack of clear relationships
between the syntactic units.
� Lexical: unfamiliar vocabulary, high-frequency words usually learned at home and not in
school; polysemous or multiple-meaning words.
� References to mainstream American culture.
� Test or text layout. Lack of one-to-one correspondence between the syntactic boundaries
of clauses and the lay out of the text in the printed test.
In addition, further studies must investigate alternative sources of DIF, such as potential
systematic differences in the mathematics instruction and opportunities to learn of ELLs and
non-ELLs. In a previous study (Martiniello, 2006b, 2007a) the author examined the role of
curricular learning strands and their interrelation with linguistic complexity and schematic
representations as sources of DIF for ELLs in mathematics items. The two learning strands
data analysis, statistics, and probabilities and patterns, relations, and algebra were significantly
associated with DIF measures in simple regression models, whereas the other three learning
strands were not (number sense and operations; geometry, and measurement). Data analysis,
statistics, and probabilities items tended to show positive DIF favoring non-ELLs over ELLs,
while patterns, relations, and algebra showed negative DIF favoring ELLs. However, the main
effects of these two learning strands on DIF were no longer significant when the effects of item
linguistic complexity and schematic representations were accounted for in the model. This is
probably due to the nature of the intercorrelations among these variables. Items measuring data
analysis, statistics, and probabilities tended to be linguistically much more complex than items
measuring other learning strands in the test, whereas items measuring patterns, relations, and
algebra tended to include more schematic visual representations than the rest of the strands.
The role of these construct-relevant curricular variables and their interactions with linguistic
complexity and schematic representations must be further examined.
Implications
These findings have important implications for both test development and evaluation for the
population of ELLs. Efforts should be made to assess the math proficiency of ELLs by
employing text that is appropriate to their levels of English proficiency. Math items should
avoid complex grammatical structures and low-frequency nonmathematical vocabulary that are
central for item comprehension. Also, DIF studies comparing ELLs and non-ELLs should be
standard procedures for the evaluation of statewide math assessment as ethnic and gender DIF
studies currently are.
Future research should also investigate the differential impact of pictorial and schematic
representations in improving the accessibility/comprehensibility of math word problems for
ELLs. A recent randomized study evaluating the potential value of adding visual representations

LINGUISTIC COMPLEXITY, SCHEMATIC REPRESENTATIONS 177
to text-only math word problems found that illustrative pictures are an ineffective accommo-
dation for the math assessment of ELLs (Moreno, Pirritano, Allred, Calvert, & Finch, 2006).
This result may be attributed to the fact that most, if not all, of the representations utilized
in the cited study were primarily pictorial. The potential of using schematic representations
combined with text in math word problems should be further examined. If the interaction
between linguistic complexity and schematic representations found here is replicated more
generally, this might support the argument for universal design: redesigning assessments in this
manner might ameliorate biases for ELLs without requiring assessment accommodations.
ACKNOWLEDGMENTS
This article is a revised version of the paper “Linguistic Complexity and Item-Anchored DIF
Detection for ELLs in a Mathematics Test” presented at the National Council on Measurement
in Education in 2006, which was included in the 2007 doctoral dissertation “Linguistic Com-
plexity and Differential Item Functioning (DIF) for English Language Learners (ELL) in Math
Word Problems.”
This research was generously supported by the Spencer Foundation Doctoral Dissertation
Fellowship. I thank Daniel Koretz, Catherine Snow, and Jamal Abedi for their feedback on
earlier versions of this article and the many experts who participated as raters in various parts
of this research. They are Diane August, Sylvia Celedón-Pattichis, Donna Christian, Margot
Gottlieb, Liz Howard, Tisa Jiménez, Nonie Lesaux, Young-Suk Kim, Patricia Martinez, Kay
Merseth, Eduardo Mosqueda, Marleny Perdomo, Linda Siegel, Catherine Snow, Anna Szuber,
and Paola Uccelli.
This research was conducted while I was a member of the Harvard Graduate School of
Education. Any opinions expressed in this article are mine and not necessarily of Educational
Testing Service.
REFERENCES
Abedi, J. (2004, April). Differential Item Functioning (DIF) analyses based on language background variables. Paper
presented at the annual meeting of the American Educational Research Association, New Orleans, LA.
Abedi, J., Bailey, A., Butler, F., Castellon-Wellington, M., Leon, S., & Mirocha, J. (2005). The validity of administering
large-scale content assessments to English language learners: An investigation from three perspectives (CSE Tech.
Rep. No. 663). Los Angeles, CA: UCLA Center for the Study of Evaluation/National Center for Research on
Evaluation, Standards, and Student Testing.
Abedi, J., Leon, S., & Mirocha, J. (2003). Impact of student language background on content-based performance: Anal-
yses of extant data (CSE Tech. Rep. No. 603). Los Angeles, CA: UCLA Center for the Study of Evaluation/National
Center for Research on Evaluation, Standards, and Student Testing.
Abedi, J., & Lord, C. (2001). The language factor in mathematics. Applied Measurement in Education, 14(3), 219–234.
Abedi, J., Lord, C., & Hofstetter, C. (1998). Impact of selected background variables on students’ NAEP math
performance (CSE Tech. Rep. No. 478). Los Angeles, CA: UCLA Center for the Study of Evaluation/National
Center for Research on Evaluation, Standards, and Student Testing.
Abedi, J., Lord, C., & Plummer, J. (1997). Final report of language background as a variable in NAEPS mathematics
performance (CSE Tech. Rep. No. 429). Los Angeles, CA: UCLA Center for the Study of Evaluation/National
Center for Research on Evaluation, Standards, and Student Testing.

178 MARTINIELLO
American Educational Research Association, American Psychological Association, National Council on Measurement
in Education. (1985). Standards for educational and psychological testing. Washington, DC: American Psychological
Association.
Angoff, W. (1993). Perspectives on Differential Item Functioning methodologies. In P. W. Holland & H. Wainer (Eds.),
Differential Item Functioning (pp. 67–114). Hillsdale, NJ: Erlbaum.
August, D. E., & Hakuta, K. E. (1997). Improving schooling for language-minority children: A research agenda.
Washington, DC: National Academy Press.
Barton, B., & Neville-Barton, P. (2003a). Investigating the relationship between English language and mathemati-
cal learning. Retrieved March 2006 from http://www.dm.unipi.it/�didattica/CERME3/proceedings/Groups/TG10/
TG10_Barton_cerme3.pdf
Barton, B., & Neville-Barton, P. (2003b). Undergraduate mathematics learning in English by speakers of other
languages. Retrieved March 2007 from http://isis.ku.dk/kurser/blob.aspx?feltidD162713
Bock, R. D., & Aitkin, M. (1981). Marginal maximum likelihood estimation of item parameters: Application of an
EM algorithm. Psychometrika, 46, 443–459.
Butler, F., Bailey, A., Stevens, R., Huang, B., & Lord, C. (2004). Academic English in fifth-grade mathematics,
science, and social studies textbooks (CSE Tech Rep. No. 642). Los Angeles, CA: UCLA Center for the Study of
Evaluation/National Center for Research on Evaluation, Standards, and Student Testing.
Camilli, G., & Shepard, L. (1994). Methods for identifying biased test items. Thousand Oaks, CA: Sage.
Dorans, N. J., & Kulick, E. (1986). Demonstrating the utility of the standardization approach to assessing unexpected
differential item performance on the Scholastic Aptitude Test. Journal of Educational Measurement, 23(4), 355–368.
Halliday, M. A. K. (1978). Language as social semiotic. London: Edward Arnold.
Hambleton, R. K., Swaminathan, H., & Rogers, H. J. (1991). Fundamentals of item response theory. Newbury Park,
CA: Sage.
Hegarty, M., & Kozhevnikov, M. (1999). Types of visual-spatial representations and mathematical problem solving.
Journal of Educational Psychology, 91(4), 684–689.
Holland, P. W., & Thayer, D. T. (1988). Differential item performance and the Mantel-Haenszel procedure. In H.
Wainer & H. I. Braun (Eds.), Test validity (pp. 129–145). Hillsdale, NJ: Erlbaum.
Johnson, M. (1987). The body in the mind: The bodily basis of meaning, imagination, and reason. Chicago: University
of Chicago Press.
Kim-Wolf, M., Herman, J., Kim, J., Abedi, J., Leon, S., Griffin, N., et al. (2008). Providing Validity Evidence to
Improve the Assessment of English Language Learners (CRESST Rep. No. 738). Los Angeles, CA: UCLA Center
for the Study of Evaluation/National Center for Research on Evaluation, Standards, and Student Testing.
Kindler, A. L. (2002). Survey of the states’ limited English proficient students and available educational programs
and services: 2000–2001. Washington, DC: Office of English Language Acquisition, Language Enhancement and
Academic Achievement for Limited English Proficient Students. Washington, DC: U.S. Department of Education.
Lemke, J. L. (2003). Mathematics in the middle: Measure, picture, gesture, sign, and word. Retrieved October 13,
2006, from http://www-personal.umich.edu/�jaylemke/papers/myrdene.htm
Lord, C., Abedi, J., & Poosuthasee, N. (2000). Language difficulty and assessment accommodations for ELLs. Study
commissioned by the Delaware Department of Education.
Martiniello, M. (2006a, April). Linguistic complexity and item-anchored DIF detection for English learners in a math-
ematics test. Paper presented at the National Council on Measurement in Education, Differential Item Functioning
in Special Populations–Paper Session, San Francisco, CA.
Martiniello, M. (2006b, October). Sources of differential item functioning for English learners in word math problems.
Paper presented at the 37th Annual Meeting of the Northeastern Educational Research Association, New York.
Martiniello, M. (2007a, April). Curricular content, language, and the differential performance of English learners
and non-English learners in word math problems. Paper presented at the annual American Educational Research
Association conference, Chicago, IL.
Martiniello, M. (2007b). Linguistic complexity and differential item functioning (DIF) for English language learners
(ELL) in math word problems. Dissertation Abstracts International Section A: Humanities and Social Sciences,
Vol. 68(6-A), 2007. p. 2422. Harvard University. Publisher: US: ProQuest Information & Learning. ISSN: 0419-
4209 (Print).
Martiniello, M. (2008). Language and the performance of English language learners in math word problems. Harvard
Educational Review, 78, 333–368.

LINGUISTIC COMPLEXITY, SCHEMATIC REPRESENTATIONS 179
Messick, S. (1989). Validity. In R. L. Linn (Ed.), Educational measurement (3rd ed., pp. 13–103). New York: American
Council on Education/Macmillan.
Mestre, J. (1988). The role of language comprehension in mathematics and problem solving. In R. Cocking & J.
Mestre (Eds.), Linguistic and cultural influences on learning mathematics (pp. 201–220). Hillsdale, NJ: Erlbaum.
Moreno, R., Pirritano, M., Allred, C., Calvert, D., & Finch, B. (2006, April). The effects of auditory and pictorial aids
on English language learners’ mathematics performance. Paper presented at the annual meeting of the American
Educational Research Association, Chicago, IL.
National Research Council. (2000). Testing English-language learners in U.S. schools: Report and workshop summary
(K. Hakuta & A. Beatty, Eds.). Washington, DC: National Academy Press.
National Research Council. (2002). Reporting test results for students with disabilities and English-Language learners.
Summary of a workshop (J. Anderson-Koenig, Ed.). Washington, DC: National Academy Press.
O’Halloran, K. L. (2000). Classroom discourse in mathematics: A multi-semiotic analysis. Linguistics and Education,
10(3), 359–388.
Presmeg, N. (1986). Visualization in high school mathematics. For the Learning of Mathematics, 6(3), 42–46.
Shaftel, J., Belton-Kocher, E., Glasnapp, D., & Poggio, J. (2006). The impact of language characteristics in mathematics
test items on the performance of English Language Learners and students with disabilities. Educational Assessment,
11(2), 105–126.
Shrout, P. E., & Fleiss, J. L. (1979). Intraclass correlations: Uses in assessing rater reliability. Psychological Bulletin,
86, 420–428.
Spanos, G., Rhodes, N. C., Dale, T. C., & Crandall, J. (1988). Linguistic features of mathematical problem solv-
ing: Insights and applications. In R. Cocking & J. Mestre (Eds.), Linguistic and cultural influences on learning
mathematics (pp. 221–240). Hillsdale, NJ: Erlbaum.
Thissen, D. (2001). IRTLRDIF v.2.0b: Software for the computation of the statistics involved in Item Response Theory
likelihood-ratio tests for Differential Item Functioning. Documentation for computer program. Chapel Hill: L. L.
Thurstone Psychometric Laboratory, University of North Carolina.
Turner, E., Dominguez, H., Maldonado, L., & Empson, S. (2006, April). Facilitating English language learners’
participation in mathematical discussion and problem solving. Paper presented at the annual meeting of the American
Educational Research Association, San Francisco, CA.
U.S. Department of Education. (2002). The Elementary and Secondary Education Act Reauthorization (The No Child
Left Behind Act). Retrieved October 10, 2004, from http://www.ed.gov/legislation/ESEA02/
U.S. Department of Education, National Center for Education Statistics, National Assessment of Educational Progress.
(2005). The nation’s report card: Mathematics 2005. Retrieved November 8, 2006, from http://nces.ed.gov/nations
reportcard/
U.S. Department of Education, National Center for Education Statistics, National Assessment of Educational Progress.
(2007). The nation’s report card: Mathematics 2007. Retrieved October 14, 2009, from http://nces.ed.gov/nations
reportcard/
U.S. Department of Education, National Center for Education Statistics, National Assessment of Educational Progress.
(2009). The nation’s report card: Mathematics 2009. Retrieved October 14, 2009, from http://nces.ed.gov/nations
reportcard/
Zenisky, A., Hambleton, R. K., & Robin, F. (2003). Detection of Differential Item Functioning in large-scale state
assessments: A study evaluating a two-stage approach. Educational and Psychological Measurement, 63(1), 51–64.

Copyright of Educational Assessment is the property of Lawrence Erlbaum Associates and its content may not
be copied or emailed to multiple sites or posted to a listserv without the copyright holder's express written
permission. However, users may print, download, or email articles for individual use.