linguistic relativity and multilingualism
TRANSCRIPT

University of Central Florida University of Central Florida
STARS STARS
HIM 1990-2015
2015
Linguistic Relativity and Multilingualism Linguistic Relativity and Multilingualism
Nicholas M. Casorio University of Central Florida
Part of the Anthropology Commons
Find similar works at: https://stars.library.ucf.edu/honorstheses1990-2015
University of Central Florida Libraries http://library.ucf.edu
This Open Access is brought to you for free and open access by STARS. It has been accepted for inclusion in HIM
1990-2015 by an authorized administrator of STARS. For more information, please contact [email protected].
Recommended Citation Recommended Citation Casorio, Nicholas M., "Linguistic Relativity and Multilingualism" (2015). HIM 1990-2015. 1857. https://stars.library.ucf.edu/honorstheses1990-2015/1857
LINGUISTIC RELATIVITY AND MULTILINGUALISM
by
NICHOLAS M. CASORIO
A thesis submitted in partial fulfillment of the requirements for the Honors in the Major Program in Anthropology
in the College of Sciences and in The Burnett Honors College at the University of Central Florida
Orlando, Florida
Fall Term 2015
Thesis Chair: Dr. Beatriz Reyes-Foster
ABSTRACT
Over the last decade, linguistic relativity has seen a resurgence in research and discourse
on thought, language, and culture. One particular facet of this research, multilingualism, has been
relatively sparse in comparison to the wealth of research available focusing on individual
languages and monolingual speakers. This study represents a preliminary investigation that enters
this arena by focusing specifically on how speakers of English as a second language use English
basic color terms in respect to monolingual speakers. This is done by using a modified
methodology from the World Color Survey as a comparative model of a speaker’s division of
colors. Participants in this study illicit responses for 160 color tiles taken from the Munsell color
chart used as the basis of the World Color Survey.
The results of this study show that three of the ten multilingual participants division of the
color space per English color terms falls outside of the normal range of variation between the
monolingual English speakers who participated in this study. Though future research is needed to
definitively posit the reasons for those participants color maps, this study provides a new window
and inquiry into an under-researched area of linguistic relativity.
ii
ACKNOWLEDGEMENTS
I would like to thank the multitude of people who made this possible and helped me along the way to creating this thesis. Thank you, Dr. Olga Bedoya for going above and beyond
during your own busy schedule to seek out and find students to participate in my survey and taking a genuine interest in not only my study, but myself as a young researcher. I would like to also thank Denise Crisafi for assisting me throughout the process with any questions, queries, or mistakes I had made during the Honors in the Major process. My sincere gratitude is extended to my committee members, Dr. Ty Matejowsky and Dr. Valerie Sims for agreeing to be part of my study and dedicating their time. The office and staff of the Research and Mentoring Program also
deserves equal praise for facilitating and mentoring me from an undergraduate student into an undergraduate student researcher. Their offices and resources were paramount in fostering me as a researcher. My parents, Lisa and John Casorio, also deserve gratitude for always believing in
me and encouraging me to better myself each and every day and instilling in me the drive to work hard and not be discouraged by hurdles or speedbumps along the way. Thank you to
Ashley Chatman for being supportive and present during each step of the way. I would also like to thank my sister, Jamie Casorio, for helping me assemble and organize parts of my study and
for also encouraging me to strive for greatness in academia. None of this would have been possible, however, without the tutelage of Dr. Beatriz Reyes-Foster throughout the entire
process. When I first arrived at the University of Central Florida, I had no idea how to enter the world of research, but Dr. Reyes-Foster fielded me and selflessly dedicated her time and energy to helping me turn an interest into a reality. Her patience, kindness, and direction have made an impact on me that will last a lifetime. To the dozens of friends, family, and instructors who have
also helped me along the way, thank you as well.
iii
TABLE OF CONTENTS
INTRODUCTION .......................................................................................................................... 1
LITERATURE REVIEW ............................................................................................................... 3
Linguistic Relativity........................................................................................................................ 3
Research on Multilingualism and Cognition .................................................................................. 6
Research on Color Terms................................................................................................................ 7
Multilingualism ............................................................................................................................. 10
RESEARCH DESIGN AND METHODOLOGY ........................................................................ 12
World Color Survey Modifications .............................................................................................. 12
Participant Selection and Recruiting ............................................................................................. 13
Survey Design ............................................................................................................................... 14
Comparative Methods ................................................................................................................... 15
DATA ........................................................................................................................................... 17
Original Color Map ....................................................................................................................... 17
Color Map Key ............................................................................................................................. 17
iv
Individual Color Map Results ....................................................................................................... 17
English Agreement Maps .............................................................................................................. 24
Proficient Languages and Language Families .............................................................................. 26
Multilingual Speakers English Acquisition .................................................................................. 27
ANALYSIS ................................................................................................................................... 28
Basic Color Term Frequency ........................................................................................................ 28
Color Map Comparison................................................................................................................. 30
DISCUSSION ............................................................................................................................... 34
CONCLUSION ............................................................................................................................. 37
APPENDIX A: IRB OUTCOME LETTER ................................................................................. 39
APPENDIX B: HRP-508 .............................................................................................................. 41
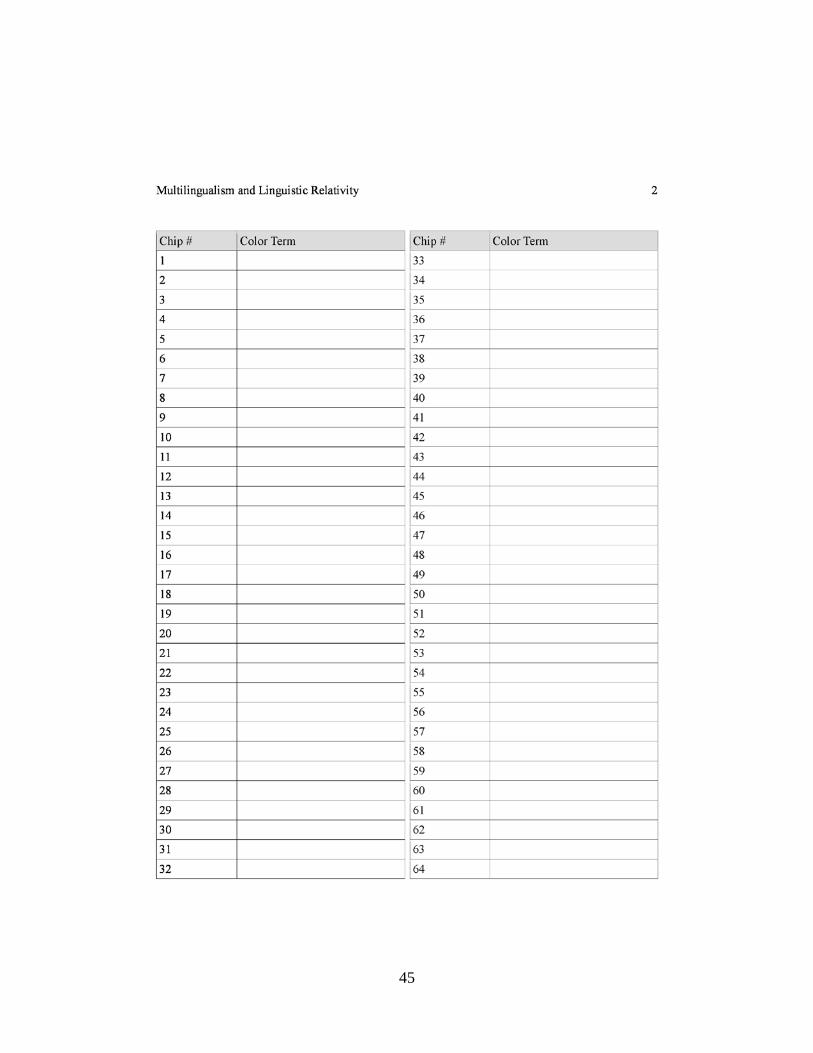
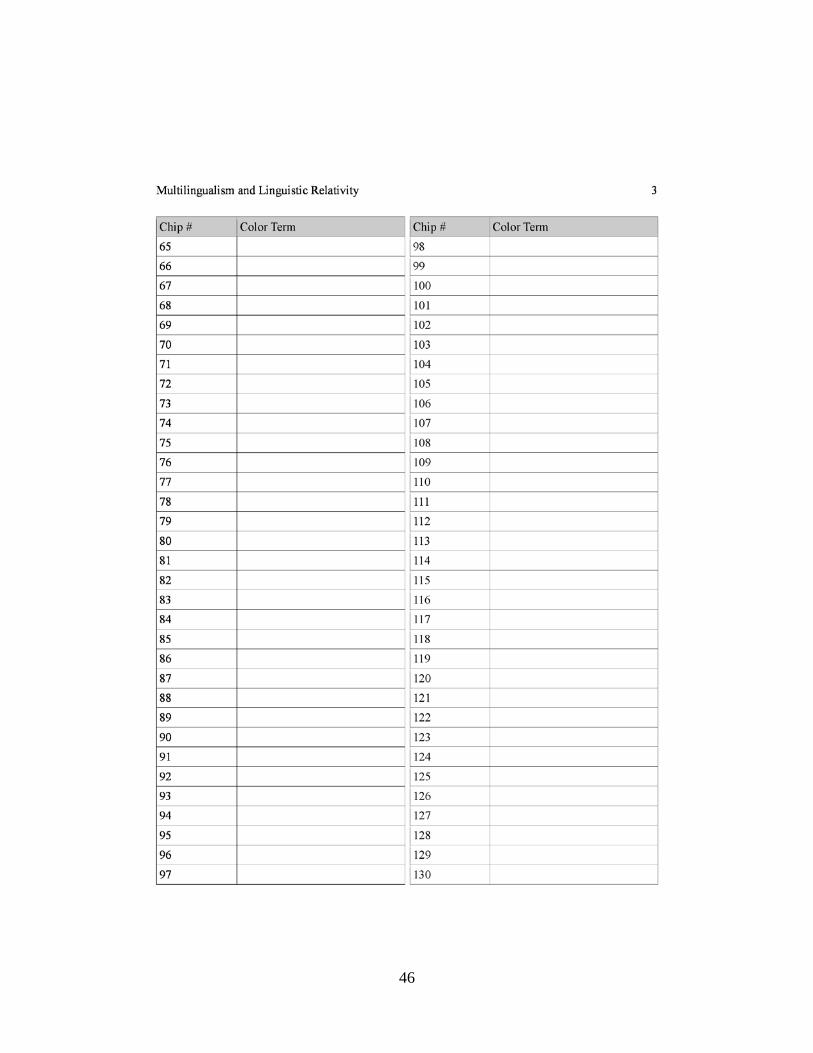
APPENDIX C: PARTICIPANT SURVEY .................................................................................. 43
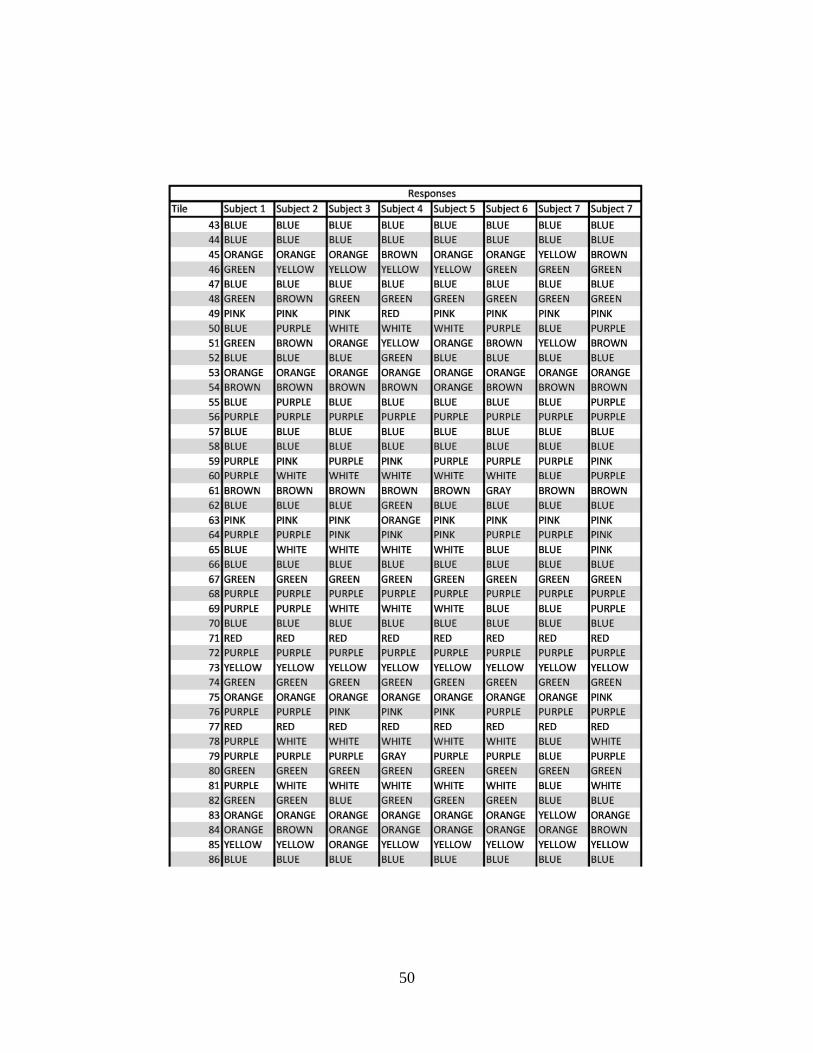
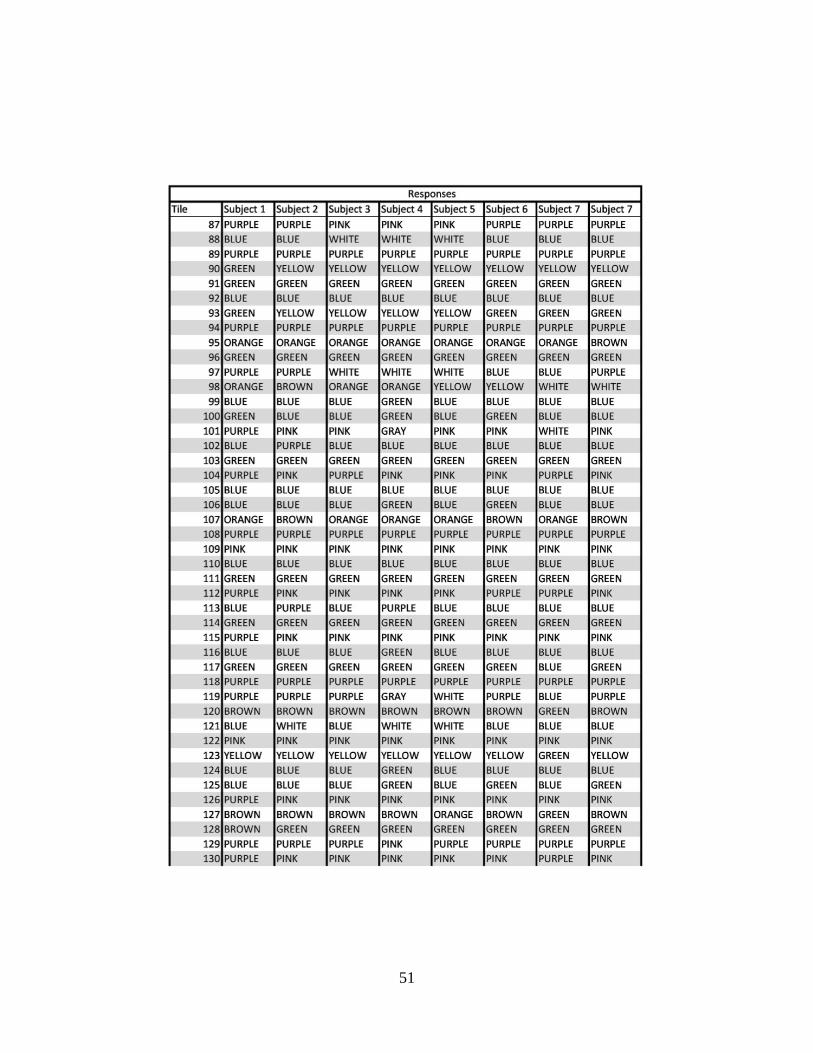
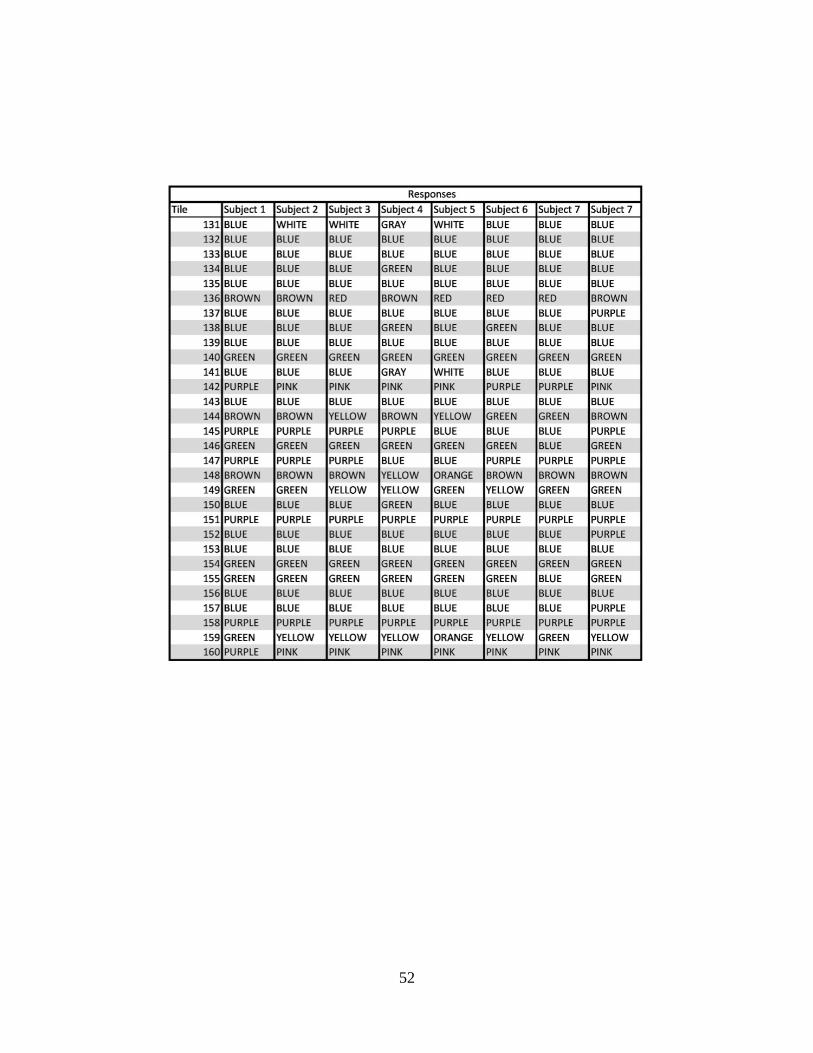
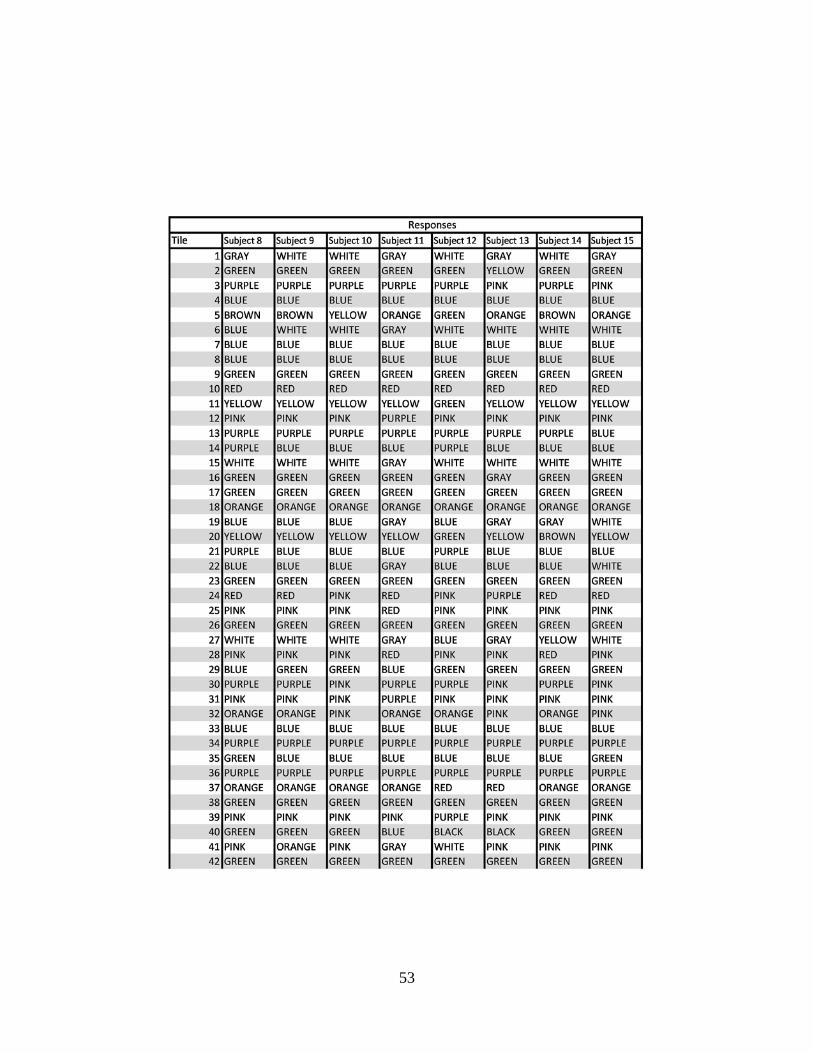
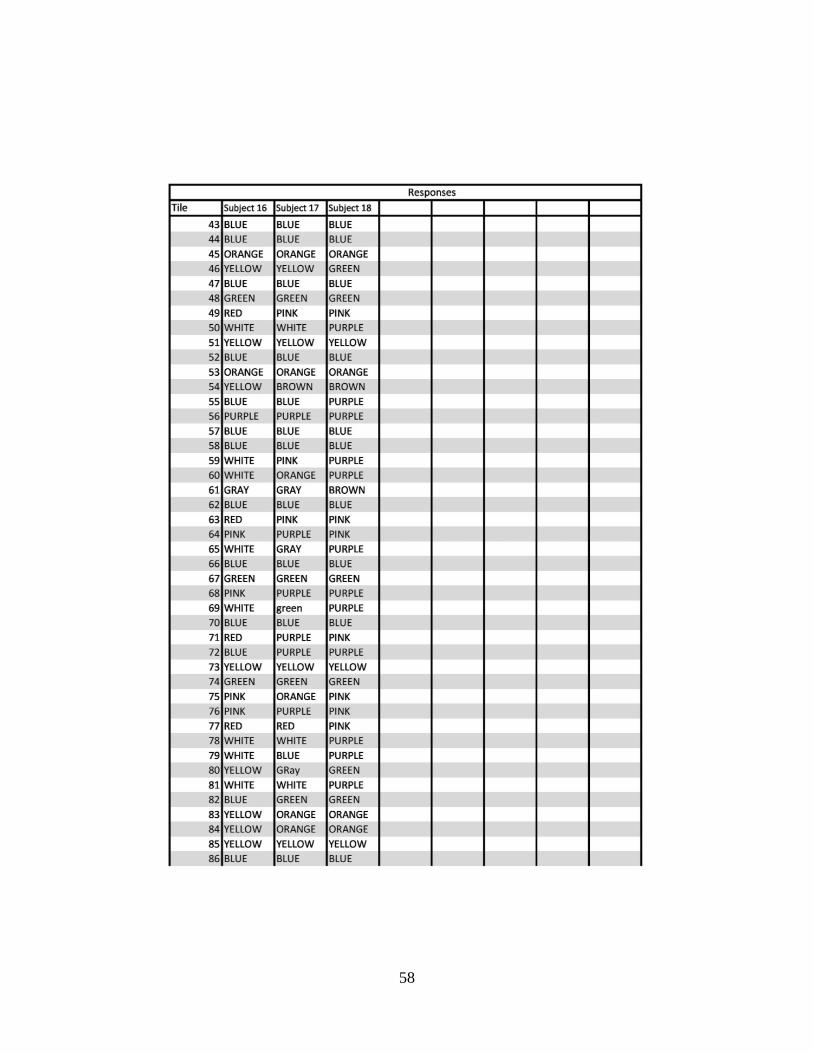
APPENDIX D: PARTICIPANT RESPONSES ........................................................................... 48
BIBLIOGRAPHY & REFERENCES .......................................................................................... 61
v

LIST OF FIGURES
Example 1, Original Munsell Color Chart .................................................................................... 13
Example 2, Modified Munsell Color Chart .................................................................................. 13
Example 3, EAM C ....................................................................................................................... 16
Key 1 ............................................................................................................................................. 17
Subject 1........................................................................................................................................ 18
Subject 2........................................................................................................................................ 18
Subject 3........................................................................................................................................ 18
Subject 4........................................................................................................................................ 19
Subject 5........................................................................................................................................ 19
Subject 6........................................................................................................................................ 19
Subject 7........................................................................................................................................ 20
Subject 8........................................................................................................................................ 20
Subject 9........................................................................................................................................ 20
Subject 10...................................................................................................................................... 21
Subject 11...................................................................................................................................... 21
Subject 12...................................................................................................................................... 21
Subject 13...................................................................................................................................... 22
Subject 14...................................................................................................................................... 22
vi
Subject 15...................................................................................................................................... 22
Subject 16...................................................................................................................................... 23
Subject 17...................................................................................................................................... 23
Subject 18...................................................................................................................................... 23
English Agreement Map A ........................................................................................................... 24
English Agreement Map B............................................................................................................ 25
English Agreement Map C............................................................................................................ 25
English Agreement Map D ........................................................................................................... 25
Figure 1 ......................................................................................................................................... 26
Figure 2 ......................................................................................................................................... 28
Figure 3 ......................................................................................................................................... 28
Figure 4 ......................................................................................................................................... 29
Figure 5 ......................................................................................................................................... 29
Figure 6 ......................................................................................................................................... 30
Figure 7 ......................................................................................................................................... 30
Figure 8 ......................................................................................................................................... 31
Figure 9 ......................................................................................................................................... 31
Comparison 1, EAC C left, Subject 11 right ................................................................................ 32
vii
Comparison 2, EAC C left, Subject 12 right ................................................................................ 32
Comparison 3, EAM C left, Subject 15 right................................................................................ 33
viii
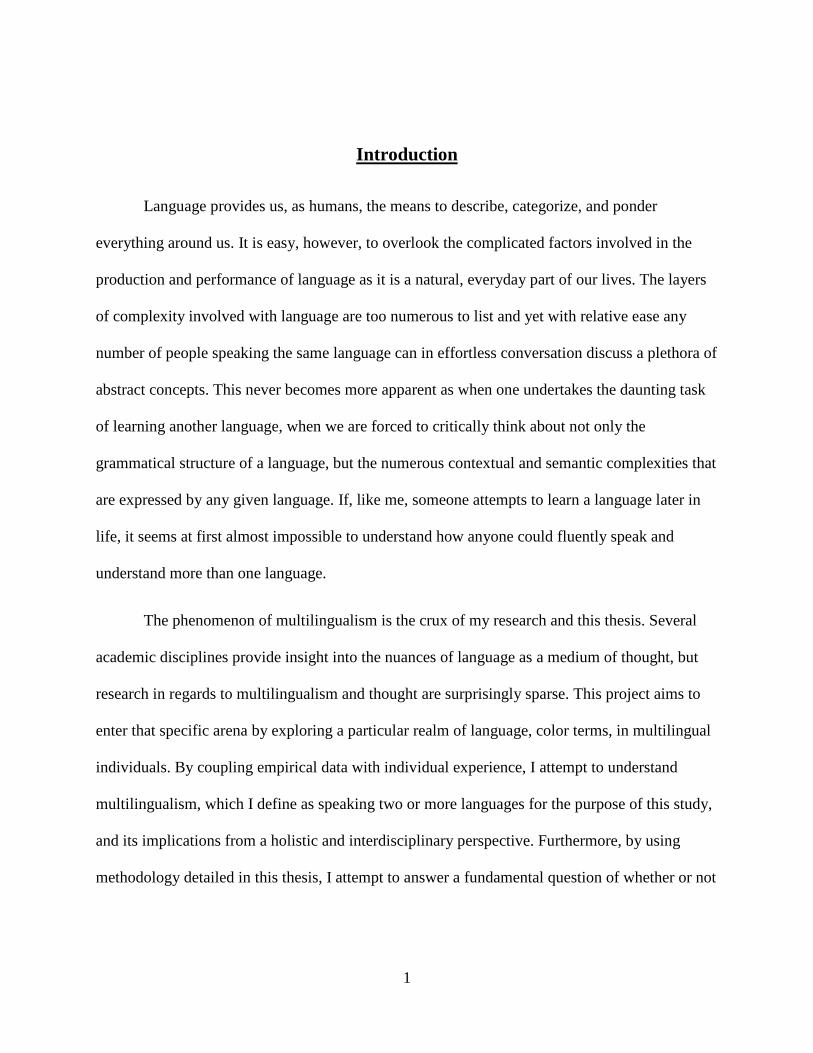
Introduction
Language provides us, as humans, the means to describe, categorize, and ponder
everything around us. It is easy, however, to overlook the complicated factors involved in the
production and performance of language as it is a natural, everyday part of our lives. The layers
of complexity involved with language are too numerous to list and yet with relative ease any
number of people speaking the same language can in effortless conversation discuss a plethora of
abstract concepts. This never becomes more apparent as when one undertakes the daunting task
of learning another language, when we are forced to critically think about not only the
grammatical structure of a language, but the numerous contextual and semantic complexities that
are expressed by any given language. If, like me, someone attempts to learn a language later in
life, it seems at first almost impossible to understand how anyone could fluently speak and
understand more than one language.
The phenomenon of multilingualism is the crux of my research and this thesis. Several
academic disciplines provide insight into the nuances of language as a medium of thought, but
research in regards to multilingualism and thought are surprisingly sparse. This project aims to
enter that specific arena by exploring a particular realm of language, color terms, in multilingual
individuals. By coupling empirical data with individual experience, I attempt to understand
multilingualism, which I define as speaking two or more languages for the purpose of this study,
and its implications from a holistic and interdisciplinary perspective. Furthermore, by using
methodology detailed in this thesis, I attempt to answer a fundamental question of whether or not
1

speaking English as a second language impacts the perception and categorization of colors as
modeled within English.
2
Literature Review
The relationship between language, thought, and culture presents a highly debated topic
across the academic landscape composed of many disciplines including psychologists, linguists,
and anthropologists. Anthropologists, or more specifically, linguistic anthropologists, posit that
an axiomatic relationship exists between language, thought, and culture; a concept given the
popular misnomer1, “Sapir-Whorf Hypothesis” (Ahearn, 2012, p. 69). Within this field of
thought, researchers primarily focus on cross-linguistic and cross-cultural differences between
languages that may or may not have non-linguistic cognitive effects. Surprisingly, there has been
a scant amount of research done with linguistic relativity in respect to multilingualism despite the
prevalence of multilingualism in the rapidly globalizing world (Groot & Kroll, 2005).
Linguistic Relativity
Linguistic relativity, or the “Sapir-Whorf Hypothesis,” is a complicated, and often
contorted, concept that has waned in and out of discourse since the nineteen-fifties. Simply
stated, linguistic relativity suggests that the wide array of languages influence the thought of
those who use them (Lucy, 1992). Often linguistic relativity is given a “hard,” deterministic
interpretation, or a “soft,” relative interpretation (Cameron, 1999). The hard interpretation
pigeon-holes Whorf's axiom into two inflexible concepts;
1 Ahearn states that outside of linguistic anthropology, the “Sapir-Whorf Hypothesis” has been used by other disciplines “as shorthand for a simplistic and easily dismissible “strong” version of Sapir and Whorf’s beliefs, which purportedly (and mistakenly) states that language determines thought.”
3
1. “Structural differences between language systems will, in general, be paralleled by
non-linguistic cognitive differences, of an unspecified sort, in the native speakers of the two
languages.
2. The structure of anyone’s native language strongly influences or fully determines the
world-view he will acquire as he learns the language” (Kay, 1984, p. 66).
These hard interpretations easily create a “straw Whorf,” that the primary language becomes the
single modality of thought; an absolute interpretation that is open and vulnerable to refute in the
academic community (Cameron, 1999). A soft interpretation more appropriately defines
linguistic relativity and is far less refutable than the Sapir-Whorf hypothesis, in part due to its
flexibility. Linguistic relativity, in this soft interpretation, insists that language influences and is
influenced by thought and culture and together affect how reality is perceived by an individual.
Boroditsky (2003) argues that research in linguistic relativity has had a resurgence across
many disciplines and that ample evidence of a soft interpretation of the Sapir-Whorf hypothesis
is shining new insight into the complex relationship between language and thought. Any given
language has unique structures, apparent to anyone who has attempted to learn another language,
which transcends beyond the simple translation of terms and grammatical units. This structural
diversity separates each language and “each language embodies a particular interpretation of
reality and these language interpretations can influence thought about that reality” (Jourdan &
Tuite, 2006, p. 54). These effects, colloquially referred to as Whorfian effects, can be found
across a plethora of cognitive functions. One such nuance is explored in an experiment by John
A. Lucy (1997) with English and Yucatec speakers highlighting a cognitive contrast with shape
4
versus material when selecting similar objects. The experiment explored a grammatical mechanic
within the Yucatec language that numerates objects with accordance to its material composition
as opposed to English which as no such mandatory grammatical mechanic. In Lucy's experiment
he presents children at various ages three combs that vary in either material or shape. In one
version of the experiment, two of the combs are similar in shape and two are similar in material
composition. What Lucy (1997) found is Yucatec speaking children after the age of nine favor
the material composition of an object as opposed to English speaking children favoring shape of
an object with regard to grouping, but children younger than nine, regardless of language,
favored shape.
Another study provides evidence of a difference in spatial orientation between languages.
A study noted in Ahearn’s (2012) “Language, Thought, and Culture” shows a stark contrast in
English’s relative spatial orientation as compared to many languages fixed spatial orientation.
The study referenced is by Levinson, where he “conducted various experiments testing the
spatial memory and reasoning abilities of speakers of Tzeltal, Guugu Yimithirr, and other
languages” (Ahearn, 2012, p. 88). To summarize, Levinson found that languages, such as those
mentioned, that do not possess the relative spatial terms similar to the English “right” and “left,”
orient themselves and objects in their environment in a much different way. In one of the
experiments, Levinson had subjects sit at a table with a row of stuffed animals. After a short
period, he removed the stuffed animals and asked the subjects to replace the stuffed animals on
the original table and then on another table facing the opposite direction. The order of the stuffed
animals on the second table was dependent upon the relative or fixed spatial terminology of their
language.
5
These are just a few studies that highlight cognitive impacts that extend beyond the vocal
expression of language. The implication of this research is that language can have a profound
cognitive impact on the way an individual perceives and classifies their environment. Though not
determinant, there is a strong argument that can be made for the axiomatic relationship between
thought, language, and culture as suggested by the theoretical frameworks of linguistic relativity.
Research on Multilingualism and Cognition
Where this corpus of research falls short is in the application of linguistic relativity in the
realm of multilingualism. If indeed the influence of a single language is so profound on the
perception of reality how then is this affected by the acquisition and fluency in two or more
languages? This query is emphasized in a number of scholarly studies within the cognitive
sciences (Boroditsky, 2011). In order to accomplish a more complete understanding of language
and linguistic relativity it is paramount to study the cognitive effects of multilingualism,
especially given the environment of the rapidly globalizing world. It is at the crossroads in
research, however, where less and less data and analysis exist.
Of the research that exists there are peculiar effects that highlight a cognitive diversity
between monolingual and multilingual speakers. One set of studies posits that multilingual
speakers change their interpretation of reality depending on the language they are speaking at
that time (Boroditsky, 2011). The acquisition of language might also have a cognitive impact on
individuals during the acquisition process. Research on second language acquisition (SLA) in the
past claimed that one's original language, or mother tongue, exerted a unidirectional influence on
the second language that is being acquired (Boroditsky, 2011). More recently however, research
6
is starting to show that SLA actually has a bidirectional relationship; that the second language
will influence an individual's original language (Brown & Gullberg, 2008). These recent studies
of multilingualism's effect on the mind imply the influence language, or languages, has on the
mind and its perception of reality. This study expounds upon existing studies in this vein by
comparing the cognitive space dedicated to color as defined by English basic color terms in
multilingual ESL speakers.
Research on Color Terms
For the purposes of this particular study, division of the color space will be the primary
focal point. The World Color Survey (WCS), conducted by Paul Kay (1999), sought to establish
a broad analysis of how different languages divide their color space by their most Basic Color
Terms (BCT) and where the BCT aligns on a universal color map. BCT is defined by Kay (1999)
as such; a word that most basically describes a color and meets four criteria;
1. It is monolexemic.2
2. Its signification is not included in that of any other color term.
3. Its application must not be restricted to a narrow class of objects
4. It must be psychologically salient for informants.3
The WCS provides a compendium of BCT's and their respective color maps for over 180
languages across the globe. In doing so, Kay has provided a method of comparison for the
2 In other words, consisted of only one lexeme or word. 3 In the context of this study, psychologically salient means that the term must be effective in presence of a stimulus.
7
division of color space of a wide variety of languages. The overwhelming consensus that the
preliminary WCS, and its predecessor (Berlin & Kay, 1967), have found is that linguistic color
categories across languages are not the same. In the WCS and Berlin & Kay studies, the research
has centered on developing an evolutionary and universal development of color terms in
languages.
These findings, however, have not been accepted in the academic community without due
skepticism from peers. Some of the strongest criticism of Kay’s findings come from noted
linguistic relativist John Lucy (2005, 1997), who argues that in many languages, words that
denote color properties also denote non-color properties. Lucy (1997) references a study by
Harold C. Conklin on the Hanunóo language color categories. Hanunóo provide evidence of a
language that identifies certain colors with not only the appearance of the color in the English
sense, but also as properties of materials. For example, Lucy (1997, p. 324) quotes Conklin
(1986, p. 190), "a shiny, wet, brown-colored section of newly-cut bamboo is malatuy not
marara÷," whereas “malatuy” describes colors that are "light green and mixtures of green,
yellow, and light brown" and “marara÷” describes colors that are "maroon, red, orange, yellow
and mixtures in which these qualities are seen to predominate." The crux of Lucy’s (1997, p.
326) argument lies in that the word “malatuy” is used not to indicate color but a “sense of
wetness or freshness.” However, in a 2006 publication, Kay counters Lucy’s critique, suggesting
that in English “green” means both the color and the quality of being “unripe or mature,” yet this
does not create a conflict with “green” being a basic color term within English.
Lucy makes a second criticism of Kay’s work, noting that in many or all languages,
words that serve to express color properties do not constitute a morpho-syntactic class. A word
8

that belongs to a morpho-syntactic class can be best be summarized as a word that displays a
related morphological form with its syntactical function. In the case of English color terms, the
property of colors as descriptive features of phenomena may place it into a morpho-syntactic
class. Kay engages Lucy’s second point by acknowledging that is a strong and legitimate
criticism of color mapping studies. Kay (2006) takes Lucy’s concerns of the morpho-syntactic
classes of terms on a methodological level as a valuable contribution to research of this type. On
a theoretical level, however, Kay (2006) accuses Lucy of adopting a view of language that is
“one-one mapping between grammatical and semantical categories” (p. 16) that is without any
accompanying support for this opinion. Regardless of these arguments and possible
shortcomings, portions of the WCS methodology provide a workable way – especially in the
case of English color terms - to analyze the distribution of BCT's throughout a color space with
respect to languages that adjectivally use color terms.
A diverse distribution of colors and the cognitive effects of memorization of colors have
been further researched without the purpose of making the broad and universal strokes of the
WCS and Berlin & Kay study. One such study focuses on semantic differences in color
identification between speakers of different languages, English and Ndonga, by Michael Pilling
and Ian R. L. Davies (2004). Results of these experiments showed while there were some general
similarities in color naming tasks for both languages, “there were significant differences between
the two groups consistent with the differences in [color] language on all tasks including the
search task and thus consistent with the predictions of [linguistic relativity]” (Pilling & Davies,
2004, pg. 452). This research supports the claim that color terms, regardless of whether there are
9
universal structures for them within language, are expressed and perceived different in respect to
the language defining it.
Multilingualism
A short survey of academic publishing will show that color term research, as with many
other sub-topics within linguistic relativity, dwindles once it enters the arena of multilingualism.
In short, according to Groot and Kroll (2005, p. 531-532), there are a few main factors that
contribute to this lack of research in multilingualism: a reluctance to acknowledge the high
percentage of multilingual peoples in the world; a lack of understanding in general about
multilingualism; and the idea that second languages do not affect one's native language if
acquired after the critical period. Figures of the world’s population that speak 2 or more language
fluctuate between 50% and 70% with the generally accepted figure sitting at approximately 65%
(Grosjean, 2014). This proportion of multilinguals would suggest that monolingualism, despite
its mentioned bias in research, is the exception rather than the rule. It is important moving
forward with research in linguistic anthropology, the cognitive sciences, and especially on
linguistic relativity, to incorporate multilingualism into the broader discourse. Color is one such
area that could greatly benefit from an exploration of multilingualism and the division of color.
From the minute and dispersed studies, “researchers [have] found that the boundaries for non-
overlapping color terms had shifted in the process of [second language] socialization and were
no longer comparable to the areas mapped by monolingual speakers of these languages” (Groot
& Kroll, 2005, pg. 439). Recently, Panos Athanasapoulos (2009 & 2011) has conducted research
on English-Greek speakers and English-Japanese speakers, specifically on the perception of the
“blue's.” Both Greek and Japanese have a BCT that would be most closely translated as “light
10

blue” in English, but in those respective languages is a unique color. Athanasapoulos’ (2009 &
2011) found that the ability to identify the Japanese and Greek hue among Japanese-English and
Greek-English bilinguals increases or decreases according to which language a participant was
habitually using rather than which language was their native tongue. According to
Athanasapoulos, “empirical evidence is accruing to suggest that bilingual speakers with
languages that differ in their lexical or grammatical concepts and categories differ from
monolingual speakers of their [first language], and shift towards monolingual speakers of their
[second language], in their cognitive representation of those categories” (Athanasapoulos, 2009,
pg. 91). Athanasapoulos further elaborates on this concept in his Japanese-English bilingual
experiment, “suggesting that knowledge of two languages with contrasting ways of parsing
reality has profound consequences for cognition” (Athanasapoulos, 2011, pg. 14).
Athanasapoulos' research represents the intersecting crossroads of cognitive sciences,
linguistic relativity, and multilingualism. More research that follows this vein of interdisciplinary
thought could elucidate multilingualism and linguistic relativity in the future. This study is one
of the only studies that surfaced through the literature review for this thesis that focused
specifically on multilingualism, color, and linguistic relativity. This sparsity of research is one of
the main motivating factors that inspired this study. There is a wealth of literature that addresses
separately linguistic relativity and multilingualism, yet very little that is attempting to synthesize
the two. This study breaks that mold and ventures into this new and largely unexplored area of
research.
11
Research Design and Methodology
This research project uses a modified form of the World Color Survey to compare the
division of color space in relation to the basic color terms in English by both monolingual and
multilingual speakers of English. In the original World Color Survey, participants are given an
array of 330 divided color chips which are presented individually in a pre-shuffled order and told
to produce the most Basic Color Term (BCT) for each color chip. These results are recorded and
then reorganized into a map that provides a map of terms and their respective locations within
the Munsell color chart. Originally this was done by seeking monolingual speakers of over 180
various languages spanning the globe, hence the title World Color Survey (WCS).
World Color Survey Modifications
This survey is a modified and shortened version of the original WCS, shown below.
Every other chip and the black/white scale has been removed from the Munsell color chart to
produce a 160 color chip array that is still representative of the continuum of visible color. This
has been done to shorten the duration of the survey in order to keep participants from becoming
exhausted, a noted issue in the original WCS. Another notable variation is the omission of the
focal colors test that prompts the participant to provide the best representative chip for a
particular BCT. This omission is necessary for same reasons as the reduced color map - duration.
12

Example 1, Original Munsell Color Chart
Example 2, Modified Munsell Color Chart
Participant Selection and Recruiting
Participants were selected based on criteria outlined within the IRB proposal been
approved for exemption status. Eligible participants were currently enrolled in an accredited
degree program at UCF. In addition, non-degree seeking students at UCF with English
proficiency test scores of at least 6.5 on the iELTS or 80 iBT on the TOEFL4, which are
4 The iELTS (International English Language Testing System) and TOEFL (Test of English as a Foreign Language) are standardized English proficiency tests employed by many Universities.
13
minimum entrance requirements for the University, were also included in the study. The status of
being enrolled in an accredited degree program, or having the requisite English test scores,
ensures that English as a Second Language (ESL) speakers have enough a high enough level of
English proficiency to be placed in English speaking classes. The scores of 6.5 on the iELTS
and an 80 iBT on the TOEFL are both the minimum proficiency level of ESL speakers for the
University of Central Florida as well as my study. Participants were recruited primarily through
cooperation with various departments and organizations, namingly the English Language
Institute and Global UCF, within the University.
Survey Design
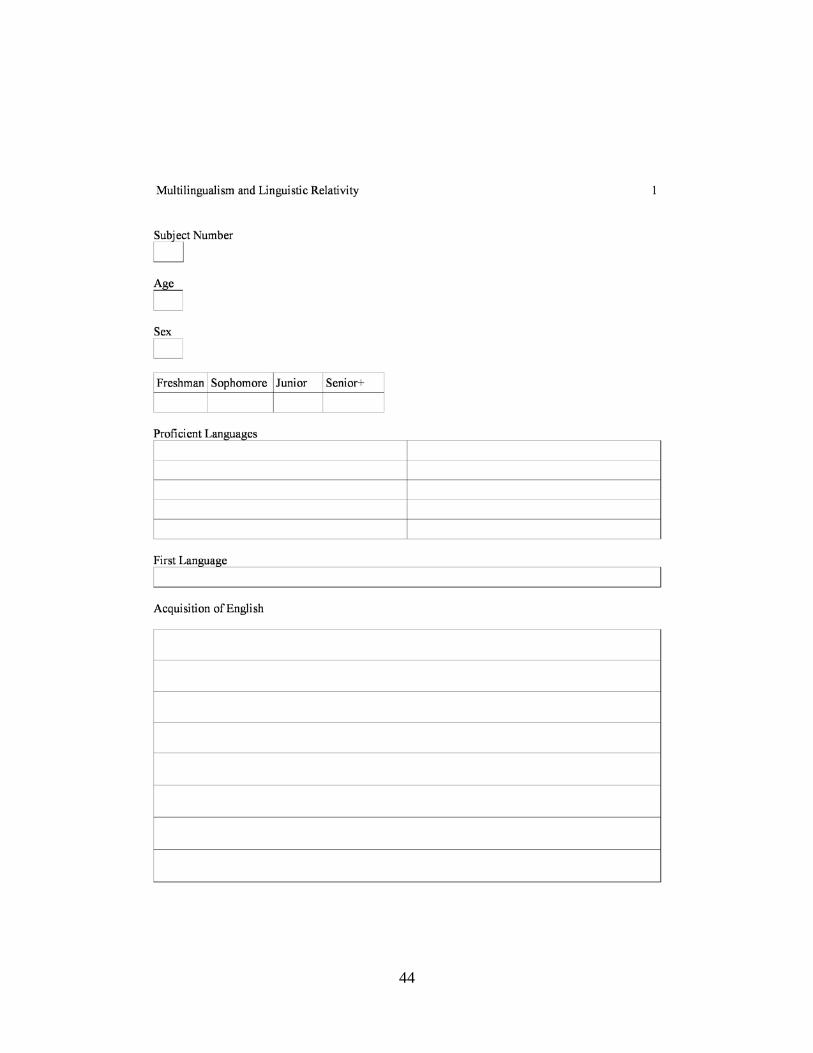
Prior to the modified BCT survey, each participant was given a verbal survey that
provided a brief history of their linguistic background. This information included the number of
spoken languages, approximate age of English acquisition, class standing at UCF, and age of the
participant. The survey, in its entirety, can be found in Appendix C. Coupled with this survey is a
HRP-508 form, found in Appendix B, that provided an informative summary of the research
project for the participant as well as their rights as a human participant. This form was kept by
the participant for their own records. This initial survey provides a linguistic background for
each participant to accompany their unique color map.
After the linguistic profile was completed the BCT survey began. Each color chip was
presented as a slideshow via a computer tablet. The participant moved at their own pace by
The TOEFL iBT is a common internet based TOEFL exam. IELTS is graded on a score of 0-9 and the TOEFL is scored on a scale of 0 – 120.
14
swiping the tablet screen to view each chip. Each participant was asked to provide a BCT for
each chip that was shown. The administrator then made a note of each response on a packet that
coincided with each participant. Each chip was presented in a randomized order known only to
the administrator. Afterwards, the data was re-configured into the correct order of the Munsell
chart resulting in the participant’s unique color map.
Two separate pools of completed BCT surveys are used for comparison. In order to
compare the data with monolingual English speakers, eight participants were monolingual
English speakers with little to no proficiency in other languages. The other ten participants were
multilingual ESL speakers. By comparing the multilingual ESL speakers to the native English
speakers, the survey was able to compare cognitive differences or similarities in the perception
of colors of both groups.
Comparative Methods
With the two pools of BCT surveys successfully converted to their color maps,
comparison of the regions of individual BCT’s for speakers within and without their original
pool is relatively simple. The converted data contains corresponding Munsell color chart values
similar to a coordinate chart with a horizontal and vertical axis. With the converted data in color
map form, analysis of BCT color regions is possible by row and column.
The English speaker’s color maps were formatted into English Agreement Maps, see
example 1 below, with varying degrees of agreement. Four maps were formed that are discussed
in detail in the data section of this thesis. These maps provide a baseline for the distribution of
15

English BCT’s as defined by monolingual speakers against the distribution of English BCT’s by
ESL speakers.
Example 3, EAM C
Another method of comparison for this study is the frequency that a BCT is used throughout the
study. This was completed by counting both the total terms used and how often those terms were
used. A maximum of eleven BCT’s, were used by participants over the course of this study,
although many did not use all eleven in their surveys. The eleven BCT’s used were; blue, brown,
gray, green, pink, purple, red, white, orange, yellow, and black.
16
Data
Original Color Map
This figure represents the modified Munsell color chart that is shuffled and used for this
study. In this figure are the original colors that are isolated and shown to participants.
Modifed Munsell Chart 1
Color Map Key
To better organize the responses of the individuals, I use both a
numerical code and a related and arbitrary color to distinguish between the
responses. These numbers and patterns are represented spanning from 0 to 10
and are shown in the figure, Key 1.
Individual Color Map Results
The following maps are the results of each individual with their accompanying age,
gender, and first language. These will be referenced and discussed further in the analysis and
discussion sections of this paper.
Key 1
17
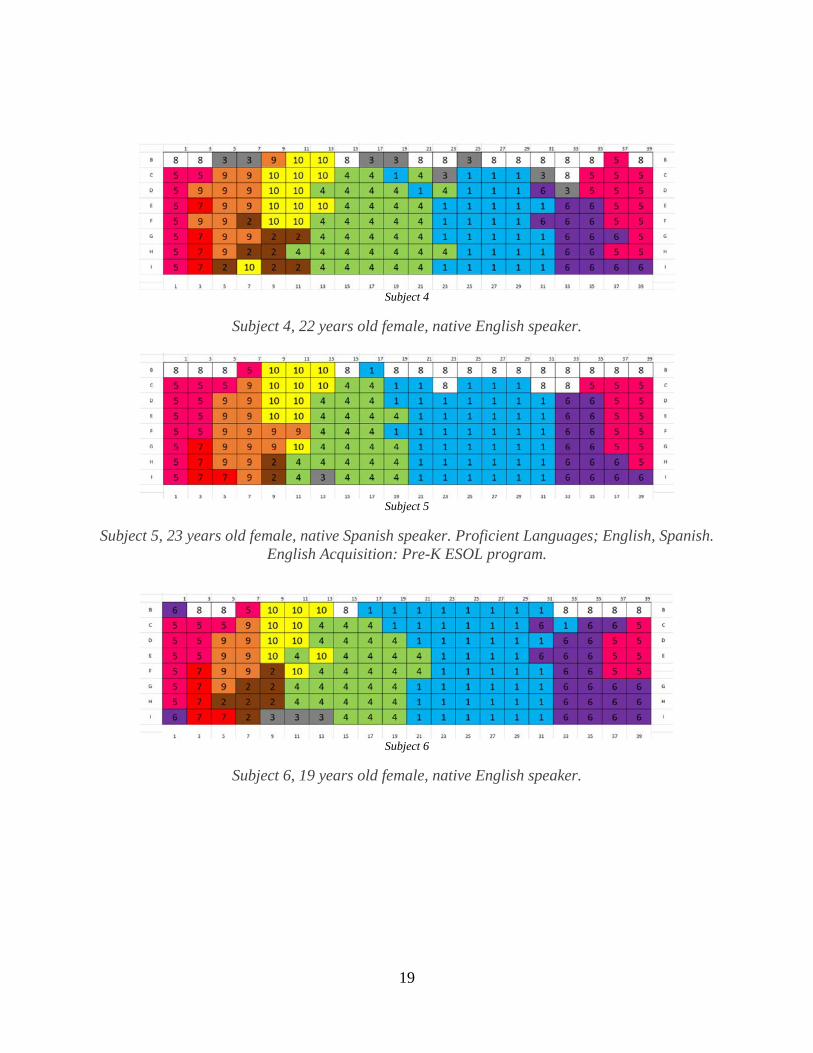
Subject 1
Subject 1, 27 years old male, native English speaker.
Subject 2
Subject 2, 27 years old male, native English Speaker.
Subject 3
Subject 3, 21 years old female, native Korean speaker. Proficient Languages; English, Korean. English Acquisition: Pre-K ESOL program.
18
Subject 4
Subject 4, 22 years old female, native English speaker.
Subject 5
Subject 5, 23 years old female, native Spanish speaker. Proficient Languages; English, Spanish. English Acquisition: Pre-K ESOL program.
Subject 6
Subject 6, 19 years old female, native English speaker.
19
Subject 7
Subject 7, 23 years old female, native Thai speaker. Proficient Languages; English, Thai, Spanish. English Acquisition: Pre-K ESOL program.
Subject 8
Subject 8, 20 years old female, native Spanish speaker. Proficient Languages; English, Spanish. English Acquisition: Two years in bilingual program followed by private lessons and tutoring.
Subject 9
Subject 9, 18 years old female, native Portuguese speaker. Proficient Languages; English, Spanish, Portuguese. English Acquisition: English Schooling Institute since 10 years old.
20
Subject 10
Subject 10, 40+ year old female, native English speaker.
Subject 11
Subject 11, 40 year old male, native Ngambay speaker. Proficient Languages; English, French, Italian, Ngambay, Masana, Fulani. English Acquisition: Elementary school equivalent English
Programs.
Subject 12
Subject 12, 19 year old male, native Twi speaker. Proficient Languages; English, Twi. English Acquisition: Official language taught in schools.
21

Subject 13
Subject 13, 22 year old male, native Portuguese speaker. Proficient Languages; English, Portuguese. English Acquisition: English language program beginning in junior high school.
Subject 14
Subject 14, 18 year old female, native Ukrainian/Russian speaker. Proficient Languages; English, Russian, Ukrainian. English Acquisition: English lessons in Elementary school followed
by personal lessons and immersion program in the United Kingdom for two years.
Subject 15
Subject 15, 18 year old male, native Telegu Speaker. Proficient Languages; English, Telegu, Hindi. English Acquisition: Tri-lingual education program.
22
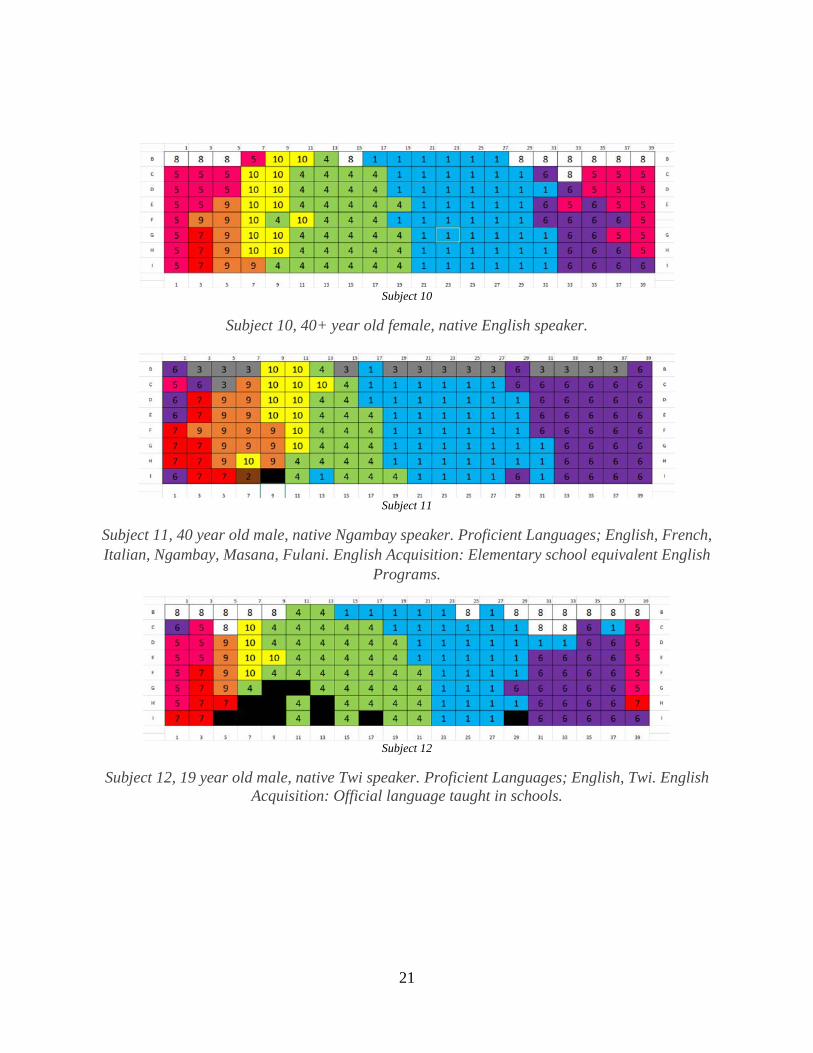
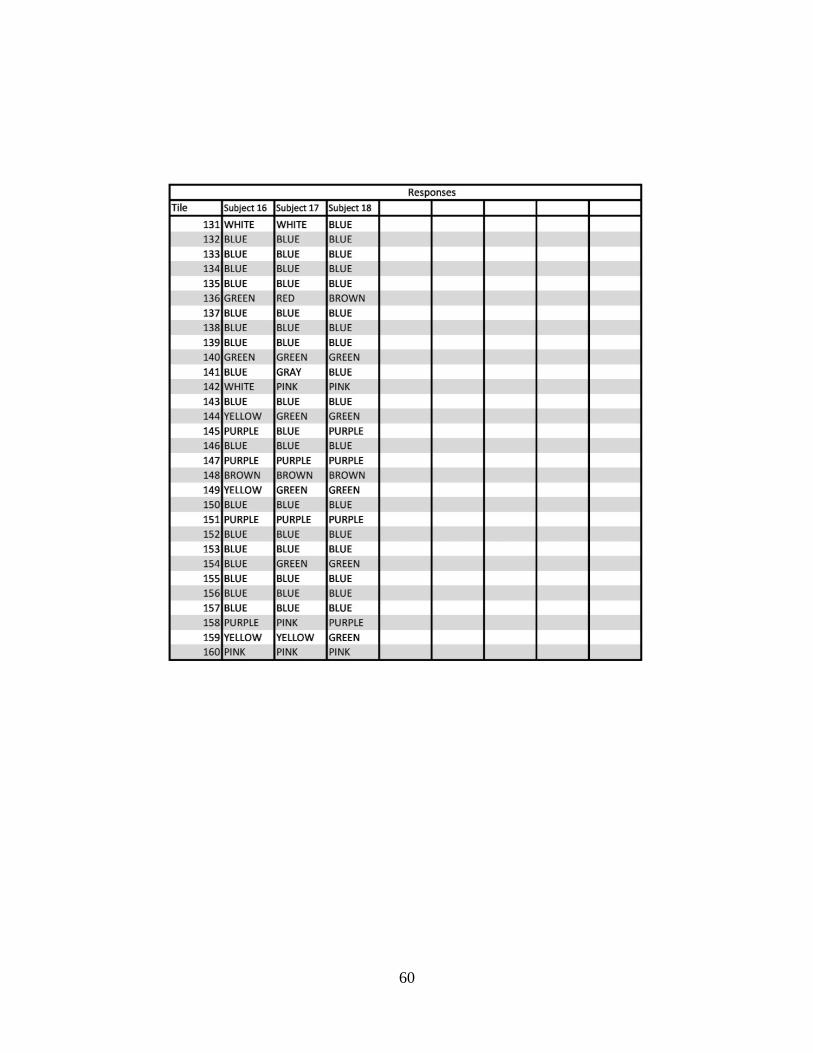
Subject 16
Subject 16, 24 year old male, native English speaker.
Subject 17
Subject 17, 25 year old female, native English Speaker.
Subject 18
Subject 18, 22 year old female, native English speaker.
23
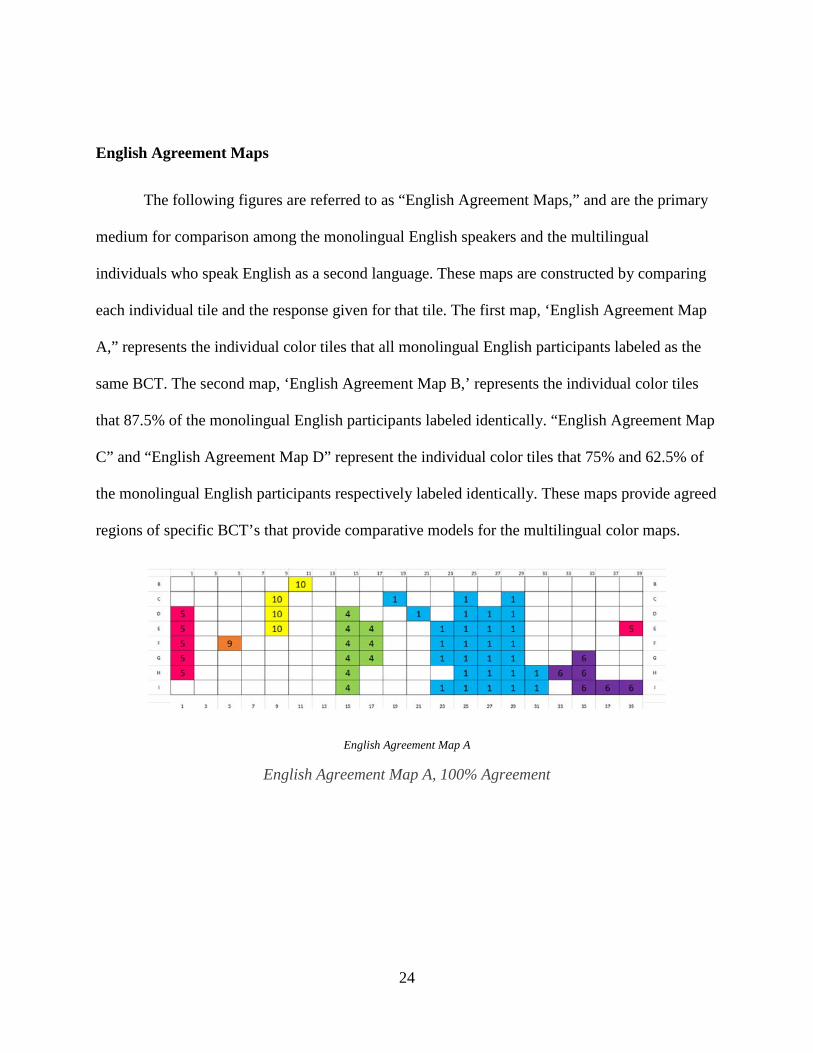
English Agreement Maps
The following figures are referred to as “English Agreement Maps,” and are the primary
medium for comparison among the monolingual English speakers and the multilingual
individuals who speak English as a second language. These maps are constructed by comparing
each individual tile and the response given for that tile. The first map, ‘English Agreement Map
A,” represents the individual color tiles that all monolingual English participants labeled as the
same BCT. The second map, ‘English Agreement Map B,’ represents the individual color tiles
that 87.5% of the monolingual English participants labeled identically. “English Agreement Map
C” and “English Agreement Map D” represent the individual color tiles that 75% and 62.5% of
the monolingual English participants respectively labeled identically. These maps provide agreed
regions of specific BCT’s that provide comparative models for the multilingual color maps.
English Agreement Map A
English Agreement Map A, 100% Agreement
24

English Agreement Map B
English Agreement Map B, 87.5% Agreement
English Agreement Map C
English Agreement Map C, 75% Agreement
English Agreement Map D
English Agreement Map D, 62.5% Agreement
25
Proficient Languages and Language Families
This study uses 18 participants to explore the cognitive space that divides color among
multilingual and monolingual English speakers. Of those 18 participants, eight are monolingual
English speakers and ten are multilingual speakers who speak English as a second language. Of
those ten multilingual speakers, five are bilingual and five speak three or more languages. The
most languages spoken by a single participant is six, which is attributed to Subject 11. The
number of languages spoken by a participant will be used as a metric for comparison within the
discussion.
Across all the participants, 15
languages are represented in either the
native or secondary capacity. Those
languages are; English, French,
Spanish, Italian, Portuguese, Russian,
Ukrainian, Hindi, Telegu, Ngambay,
Masana, Fulani, Twi, Korean, and
Thai. The native languages list is much smaller, however, and are as follows; English, Korean,
Thai, Ngambay, Telegu, Russian, Ukrainian, Spanish, Twi, and Portuguese. The full list
represents six language families which are; Nilo-Saharan, Niger-Congo, Indo-European,
Koreanic, Tai-Kadai, and Dravidian. Of those 15 languages, however, eight belong to the Indo-
European language family which is also the most widely distributed of the represented language
families. Language families are another metric that will be considered in the discussion.
8
5
41
Number of Languages Spoken
One Language Two Languages
Three Languages Six Languages
Figure 1
26
Multilingual Speakers English Acquisition
The age and mode of acquisition varies across the ten multilingual participants.
Kindergarten and Pre-Kindergarten programs dominate the landscape representing 70% of the
participant’s introduction to and acquisition of English. The remaining 30% of the participants
began their acquisition of English after the age of 10 in school programs and private tutoring
lessons.
27
Analysis
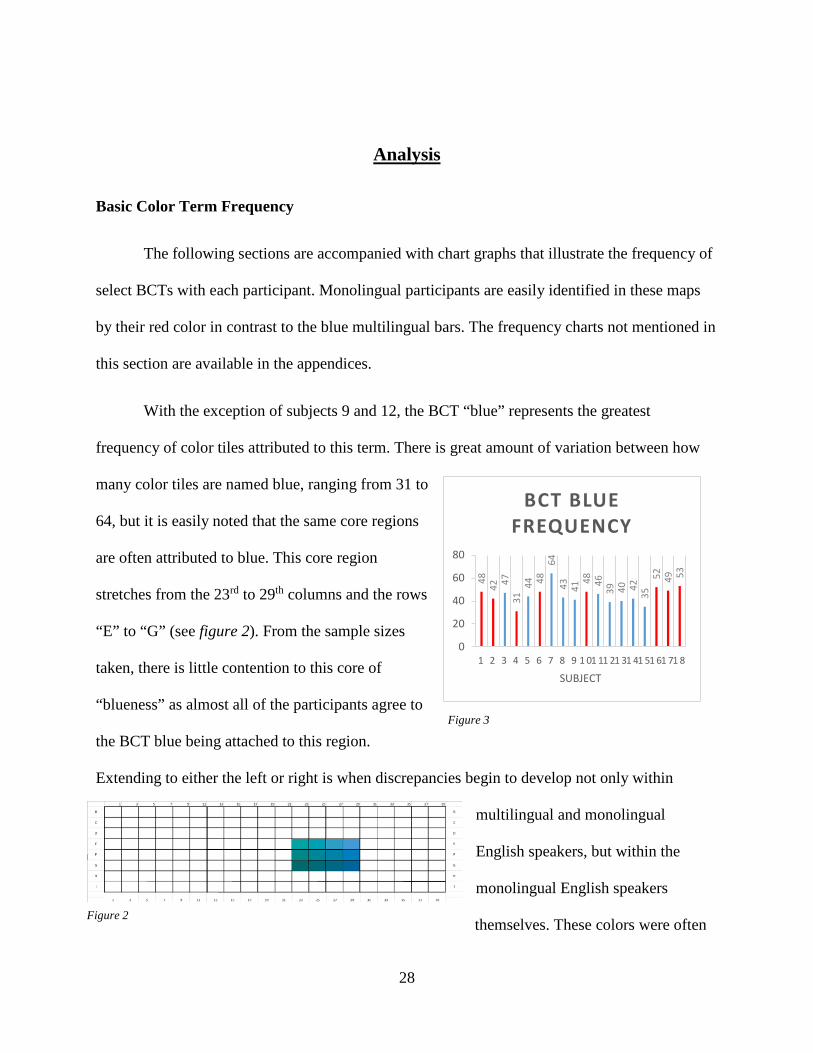
Basic Color Term Frequency
The following sections are accompanied with chart graphs that illustrate the frequency of
select BCTs with each participant. Monolingual participants are easily identified in these maps
by their red color in contrast to the blue multilingual bars. The frequency charts not mentioned in
this section are available in the appendices.
With the exception of subjects 9 and 12, the BCT “blue” represents the greatest
frequency of color tiles attributed to this term. There is great amount of variation between how
many color tiles are named blue, ranging from 31 to
64, but it is easily noted that the same core regions
are often attributed to blue. This core region
stretches from the 23rd to 29th columns and the rows
“E” to “G” (see figure 2). From the sample sizes
taken, there is little contention to this core of
“blueness” as almost all of the participants agree to
the BCT blue being attached to this region.
Extending to either the left or right is when discrepancies begin to develop not only within
multilingual and monolingual
English speakers, but within the
monolingual English speakers
themselves. These colors were often
4842 47
3144 48
6443 41
48 4639 40 42
3552 49 53
0
20
40
60
80
1 2 3 4 5 6 7 8 9 1 01 11 21 31 41 51 61 71 8
SUBJECT
BCT BLUE FREQUENCY
Figure 3
Figure 2
28

referred to as “uncomfortable” to participants because they straddle the muddy regions between
two ideologically distinct terms, especially between blue and green. Outside of the constraints of
the mono-lexemic terminology, a more common color term such as “teal” would be a more
comfortable term to use when describing these colors that lie in the tertiary zone between blue
and green according to participants.
The BCT term “gray” has an interesting
frequency distribution as illustrated by figure 2.
The use of this term to describe color tiles was, for
the most part, minimal except into two cases.
Subjects 11 and 13 attributed a majority of the
lightest colors belonging to the “B” row on the
modified Munsell color chart.
These three particular charts representing
the frequency of the BCT’s pink, red, and purple
are interesting when reviewing subject 11’s data.
Though variation is expected between the
frequencies of colors regardless of the
participant’s language, subject 11 labeled an
extremely low number of tiles “pink” in relation to
50 1
81 3 1 1 0 0
140
151 3
8 92
05
101520
1 2 3 4 5 6 7 8 91
01
11
21
31
41
51
61
71
8
SUBJECT
BCT GRAY FREQUENCY
Figure 4
1021 23 22
2518
1422
1526
113
2613
2612
2129
0
10
20
30
40
1 2 3 4 5 6 7 8 91
01
11
21
31
41
51
61
71
8
SUBJECT
BCT PINK FREQUENCY
Figure 5
29
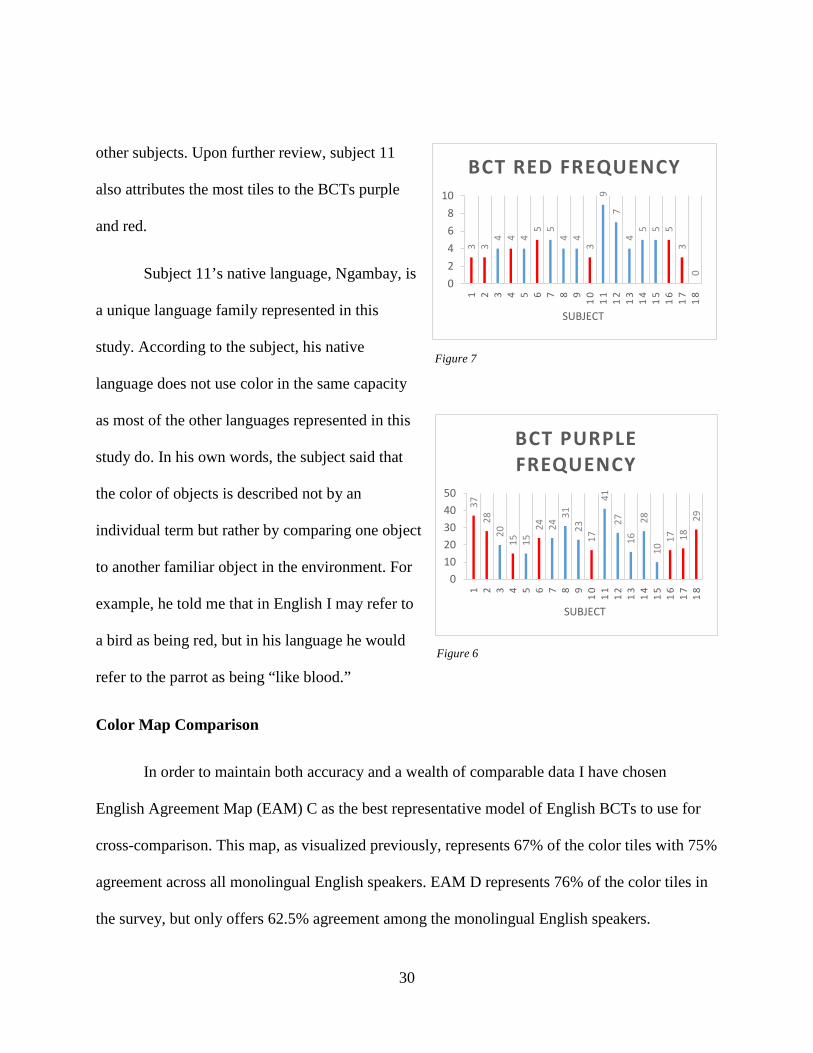
other subjects. Upon further review, subject 11
also attributes the most tiles to the BCTs purple
and red.
Subject 11’s native language, Ngambay, is
a unique language family represented in this
study. According to the subject, his native
language does not use color in the same capacity
as most of the other languages represented in this
study do. In his own words, the subject said that
the color of objects is described not by an
individual term but rather by comparing one object
to another familiar object in the environment. For
example, he told me that in English I may refer to
a bird as being red, but in his language he would
refer to the parrot as being “like blood.”
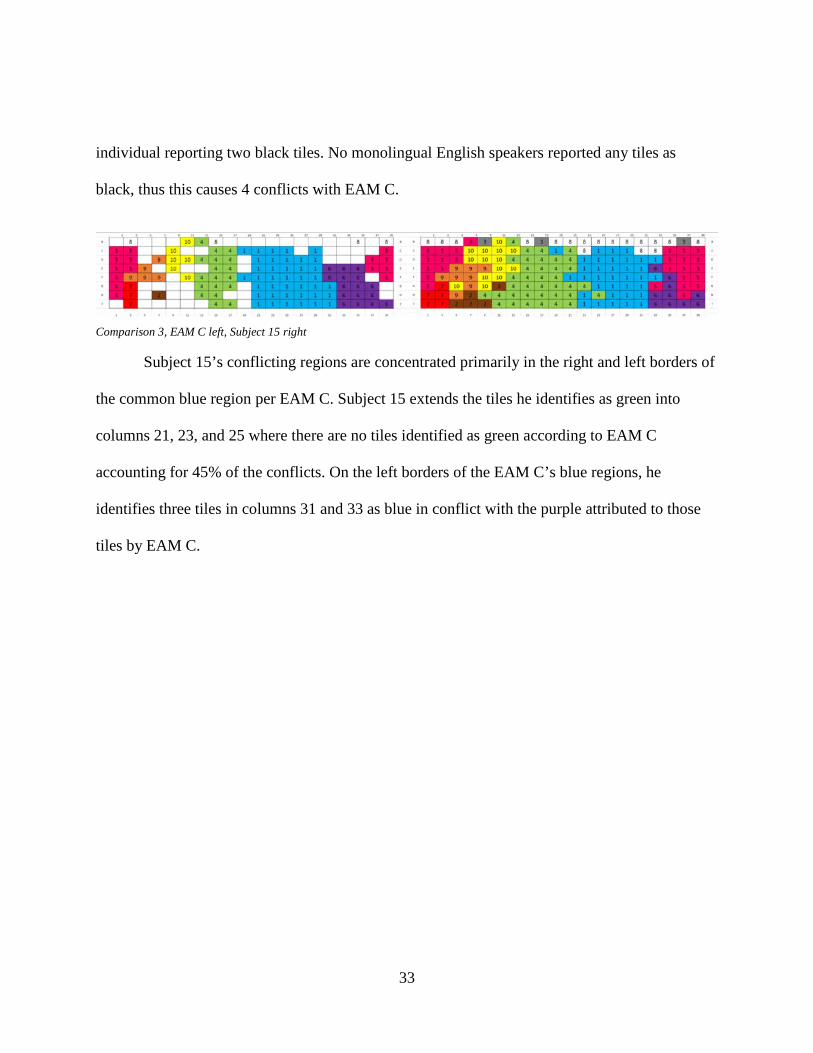
Color Map Comparison
In order to maintain both accuracy and a wealth of comparable data I have chosen
English Agreement Map (EAM) C as the best representative model of English BCTs to use for
cross-comparison. This map, as visualized previously, represents 67% of the color tiles with 75%
agreement across all monolingual English speakers. EAM D represents 76% of the color tiles in
the survey, but only offers 62.5% agreement among the monolingual English speakers.
3728
2015 15
24 2431
2317
4127
1628
1017 18
29
01020304050
1 2 3 4 5 6 7 8 91
01
11
21
31
41
51
61
71
8
SUBJECT
BCT PURPLE FREQUENCY
3 34 4 4
5 54 4
39
74
5 5 53
0
02468
10
1 2 3 4 5 6 7 8 91
01
11
21
31
41
51
61
71
8
SUBJECT
BCT RED FREQUENCY
Figure 7
Figure 6
30

Using EAM C, a comparison for control was conducted across all of the monolingual
English speakers. The average agreement with this map was 91.6%, with individual agreements
ranging from 85%-98.1%.
EAM D using the same
method resulted in an 88.3%
average agreement, but
ranged from 77.8%-95.9%.
The comparison of all
ten multilinguals provides a
percentage agreement with
EAM C which is listed in figure 10. The
range of variation within EAM C was
85% - 98.1%, as mentioned previously,
and any color maps that fall below this
agreement are further analyzed.
Subject EAM C Agreement
Percentage
Subject 3 94.3%
Subject 7 93.4%
Subject 8 87.8%
Subject 9 85.9%
Subject 11 76.6%
Subject 12 75.7%
Subject 13 88.7%
Subject 14 88.7%
Subject 15 81.3%
Figure 9
0%
20%
40%
60%
80%
100%
EAC C EAC D
EAC C & EAC D Accuracy Comparison
Tiles Represented English Agreement
Individual Agreement Average
Figure 8
31

Three outliers stand out from this comparison analysis as illustrated in figure 9 – subjects
11, 12, and 15. These three subjects fall outside of the variable range of monolingual English
speaker’s agreements and well below the averaged monolingual English agreement with EAM C.
A review of all three subjects’ areas of conflict with EAM C shows little similarity between the
conflicted regions of all three subjects.
Subject 11, as discussed earlier in the frequencies section of this analysis, has a great deal
of conflict with not only EAM C, but also with most other participants in his distribution of the
“pink” and “red” BCTs across his color map. This greatly expanded use of the pink term across
the columns 1 and 3 of the color map are where the most profound conflict exists.
Subject 12’s conflicting regions are not concentrated specifically in any area. In regions
commonly identified as the BCT “yellow” according to EAM C, Subject 12 identifies 85.7%
these tiles as green. There is the possibility that this subject was colorblind, however, the subject
claimed that he had normal color vision. Another interesting feature of Subject 12’s color map is
that he used the term “black” ten times, the most of any other participant with the next closest
Comparison 1, EAM C left, Subject 11 right
Comparison 2, EAM C left, Subject 12 right
32
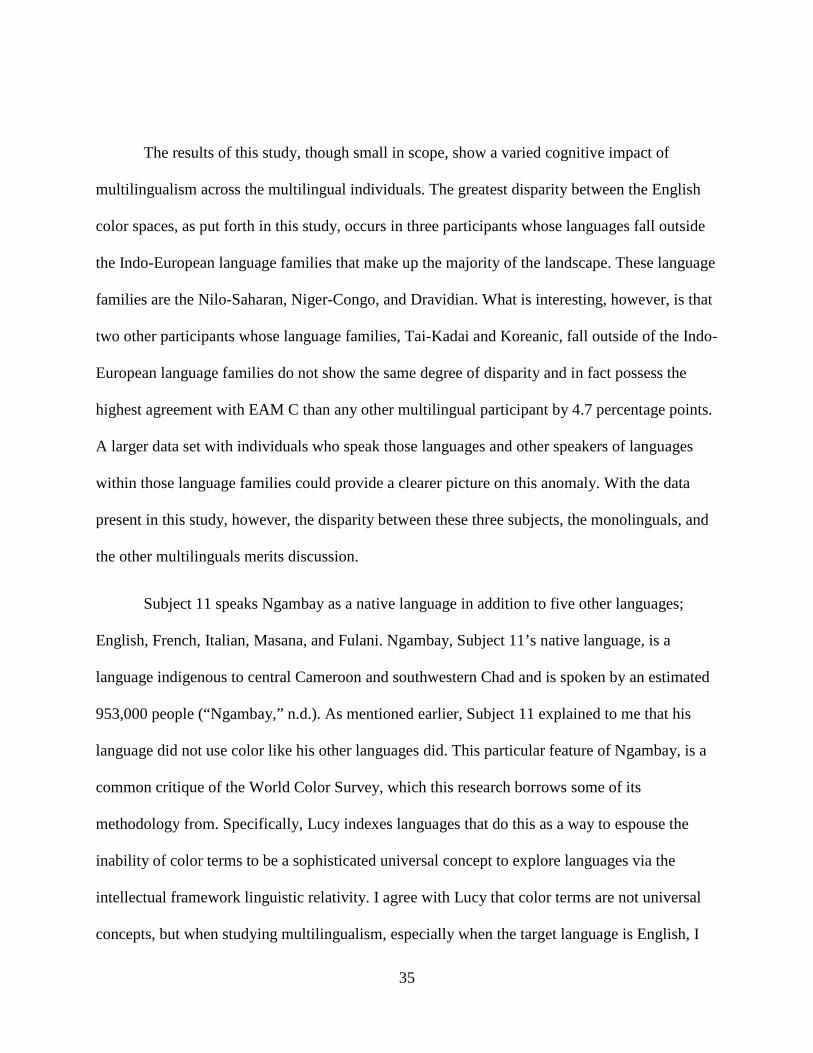
individual reporting two black tiles. No monolingual English speakers reported any tiles as
black, thus this causes 4 conflicts with EAM C.
Subject 15’s conflicting regions are concentrated primarily in the right and left borders of
the common blue region per EAM C. Subject 15 extends the tiles he identifies as green into
columns 21, 23, and 25 where there are no tiles identified as green according to EAM C
accounting for 45% of the conflicts. On the left borders of the EAM C’s blue regions, he
identifies three tiles in columns 31 and 33 as blue in conflict with the purple attributed to those
tiles by EAM C.
Comparison 3, EAM C left, Subject 15 right
33

Discussion
For the purposes of this project, the division of the color space by English BCT’s by both
monolingual English speakers and multilingual speakers whom speak English as a second
language were assessed. The premise was underlined by the studies referenced in the literature
review that elucidate the differences in the number of BCTs in different languages and the varied
hues that those terms describe. Visible light, without the categorical language that divides it, is a
continuum with no clearly defined regions. When we begin to learn a language as a child we
learn words that divide this continuum into regions that are identified by those words. Thus, our
concepts of color are shaped not just by the experienced stimuli of wavelengths of light, but also
by the terms which we identify these wavelengths by.
Certainly, variation exists within a language between what exact hues are considered to
be a specific term. Fuzzy regions between colors are often up for debate as popularized by
complex color terms such as teal, which according to the individual can be a blue-ish green or a
green-ish blue. However, there are core regions that are less disputable than these tertiary regions
which I have attempted to identify using the EAM with varied agreement levels. By identifying
core regions with comparative methods such as the EAM, we find the common hues that are
associated with English BCTs – the truest blues, greens, reds, purples, pinks, yellows, oranges,
and browns. The identification of these common regions gives us a mode to investigate how the
cognitive concepts of English are incorporated in multilingual individuals who speak English as
a second language.
34
The results of this study, though small in scope, show a varied cognitive impact of
multilingualism across the multilingual individuals. The greatest disparity between the English
color spaces, as put forth in this study, occurs in three participants whose languages fall outside
the Indo-European language families that make up the majority of the landscape. These language
families are the Nilo-Saharan, Niger-Congo, and Dravidian. What is interesting, however, is that
two other participants whose language families, Tai-Kadai and Koreanic, fall outside of the Indo-
European language families do not show the same degree of disparity and in fact possess the
highest agreement with EAM C than any other multilingual participant by 4.7 percentage points.
A larger data set with individuals who speak those languages and other speakers of languages
within those language families could provide a clearer picture on this anomaly. With the data
present in this study, however, the disparity between these three subjects, the monolinguals, and
the other multilinguals merits discussion.
Subject 11 speaks Ngambay as a native language in addition to five other languages;
English, French, Italian, Masana, and Fulani. Ngambay, Subject 11’s native language, is a
language indigenous to central Cameroon and southwestern Chad and is spoken by an estimated
953,000 people (“Ngambay,” n.d.). As mentioned earlier, Subject 11 explained to me that his
language did not use color like his other languages did. This particular feature of Ngambay, is a
common critique of the World Color Survey, which this research borrows some of its
methodology from. Specifically, Lucy indexes languages that do this as a way to espouse the
inability of color terms to be a sophisticated universal concept to explore languages via the
intellectual framework linguistic relativity. I agree with Lucy that color terms are not universal
concepts, but when studying multilingualism, especially when the target language is English, I
35
would argue that instances such as this offer sophisticated insight into language via linguistic
relativity. In this instance, it is intriguing to look at how Subject 11’s native language interacts
with English given this stark contrast in terminology and use. Subject 11 stated that he began to
learn English before the critical period of eight to nine years old, so why does this disparity
between EAC C and his color map exist? Subjects’ 12 and 15 also exhibit this disparity, yet they
also learned English prior to the critical period.
A possible answer to this question could be that these subjects native languages do not
belong to the same language family as English and thus the cognitive interactions between the
two cause a type of interference with the concepts. Subjects 3 and 7, however, also speak native
languages outside of the Indo-European family and there agreement percentages were some of
the highest among multilinguals. Further research could explore this quandary by specifically
seeking out ESL speakers of not just the specific languages of Subjects 3, 7, 11, 12, and 15, but
other ESL speakers of other languages within those language families.
36
Conclusion
This study serves as a preliminary exploration into the specific realm of color terms as
perceived by multilingual individuals. While this study shows some interesting data, the small
sample size warrants further research. Additional work should be done with select populations to
garner more definitive evidence about the impact of multilingualism on thought. Despite the
widespread prevalence of research dedicated to understanding the relationships between
language, culture, and thought there is very little research that aims to explore the implications of
multilingualism within this perspective. New approaches must be forged to better understand the
cognitive framework of language acquisition. Within our rapidly globalizing world, the
application of the theoretical framework provided through linguistic relativity could play a vital
role in understanding language acquisition and learning. I believe this project can forge the way
to future vital research in a variety of fields interested in understanding the unique expression of
human language.
This study set’s data show that some ESL speakers display a variation of the English
color space outside the normal variation of monolingual English speakers. The precise reasons
for this may be a direct impact of their native or other proficient languages. It could be argued
that further research is warranted to investigate the findings in this study to better understand the
complex interactions between languages in a single cognitive space.
Linguistic relativity has enjoyed a revival across many disciplines looking to understand
language in a more complete and holistic way. Multilingualism as an area of research can benefit
from the explorations of linguistic relativity, offering valuable and fresh insight alongside the
37
cutting edge research of individuals such as Athanasapoulos into the cognitive implications of
speaking multiple languages. This project exemplifies a preliminary study into ways that we can
begin to explore how multilingualism affects our worldview and categorization of stimuli.
Furthermore, the anthropological considerations afforded in the framework of linguistic relativity
is another avenue to explore how language, culture, and thought are adapting in an increasingly
globalized world, especially when an estimated 65% of the world population speaks two or more
languages (Grosjean, 2014).
38
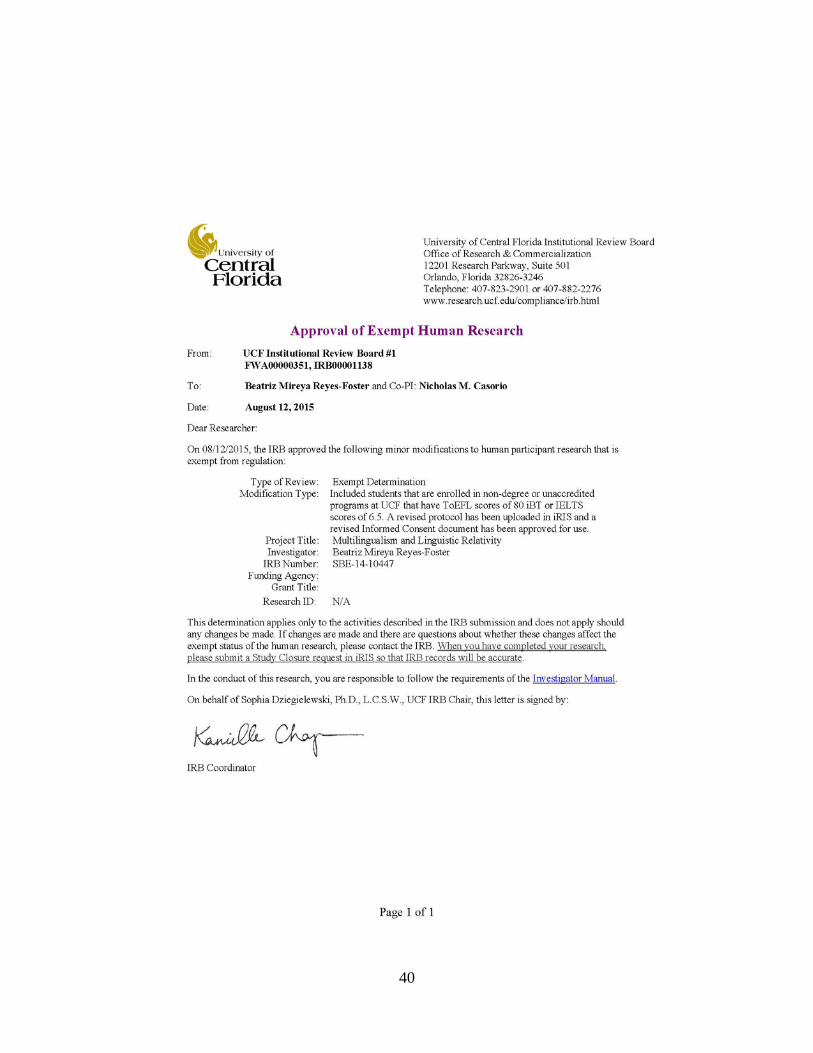
Appendix A: IRB Outcome Letter
39
40
Appendix B: HRP-508
41
42
Appendix C: Participant Survey
43
44
45
46

47
Appendix D: Participant Responses
48

49
50
51
52
53

54

55

56

57
58

59
60

Bibliography & References
Ahearn, L. M. (2012). Chapter 4: Language, Culture, and Thought. Living language : an
introduction to linguistic anthropology. Chichester, West Sussex, UK ; Malden, MA :
Wiley-Blackwell, 2012.
Amanda Brown, & Marianne Gullberg. (2008). BIDIRECTIONAL CROSSLINGUISTIC
INFLUENCE IN L1-L2 ENCODING OF MANNER IN SPEECH AND GESTURE: A
study of Japanese speakers of English. Studies in Second Language Acquisition, 30(2), 225.
Athanasopoulos, P. (2009). Cognitive representation of colour in bilinguals: The case of Greek
blues. Bilingualism: Language and Cognition, 12(1), 83-95.
Athanasopoulos, P., Damjanovic, L., Krajciova, A., & Sasaki, M. (2011). Representation of
colour concepts in bilingual cognition: The case of Japanese blues. Bilingualism: Language
& Cognition, 14(1), 9-17. doi:10.1017/S1366728909990046
Berlin, B., Kay, P., & Kay, P. (1969). Basic color terms; their universality and evolution.
Berkeley, University of California Press, 1969.
Boroditsky, L., Schmidt, L., & Phillips, W. (2003). Sex, Syntax, and Semantics. In Gentner &
Goldin-Meadow (Eds.,) Language in Mind: Advances in the study of Language and
Cognition.
Cameron, D. (1999). Linguistic relativity: Benjamin Lee Whorf and the return of the repressed.
Critical Quarterly, 41(2), 153.
Conklin, H. C. (1986). Hanunóo color categories [first published in Southwestern journal of
anthropology 1955 (ll) 339-44]. Journal Of Anthropological Research, 42441-446.
61
Francois, G. (2014, Nov. 30). Chasing Down Those 65%. Retrieved from
https://www.psychologytoday.com/blog/life-bilingual/201411/chasing-down-those-65
Ngambay. (n.d.). In Ethnologue. Retrieved from https://www.ethnologue.com/language/sba
Goldin-Meadow, S., & Gentner, D. (2003). Language in mind : Advances in the study of
language and thought. Cambridge, Mass: MIT Press.
Groot, A. M. B., & Kroll, J. F. (2005). Handbook of bilingualism: Psycholinguistic approaches.
Oxford: Oxford University Press.
Jourdan, C., & Tuite, K. (2006). Language, culture, and society [electronic resource] : Key
topics in linguistic anthropology / edited by Christine Jourdan, Kevin Tuite Cambridge :
Cambridge University Press, 2006.
Kay, P., & CSLI Publications (Firm). (2009). The World Color Survey. Stanford, Calif: CSLI
Publications.
Kay, P. (2006). Methodological issues in cross-language color naming. In C. Jourdan, & K. Tuite
(Eds.), (pp. 115-134). Cambridge, England: Cambridge UP.
Kay, P., Berlin, B., Maffi, L., & Merrifield, W. (1997). Color naming across languages. In C. L.
Hardin, & L. Maffi (Eds.), (pp. 21-56). New York, NY, US: Cambridge University Press.
Kay, P., & Kempton, W. (1984). What is the Sapir-Whorf hypothesis? American Anthropologist,
86, 65-79. doi:10.1525/aa.1984.86.1.02a00050
Lucy, J. A. (2005). Through the window of language: Assessing the influence of language
diversity on thought. Theoria: Revista De Teoria, Historia y Fundamentos De La Ciencia,
20:3(54), 299-309.
62

Lucy, John A. (1997) The linguistics of color. In Color Categories in Thought and Language.
C.L. Hardin and Luisa Maffi, eds., Cambridge, England: Cambridge University Press.
Lucy, J. A. (1992). Language diversity and thought: A reformulation of the linguistic relativity
hypothesis. Cambridge University Press.
Pilling, M., & Davies, I. R. L. (2004). Linguistic relativism and colour cognition. British Journal
of Psychology, 95(4), 429-455.
63