link budget analysis: getting started - atlanta rf - home
TRANSCRIPT
Atlanta RFServices, Software & Designs
Link Budget Analysis: Getting Startedwww.AtlantaRF.com
Picture Collage from ESA: 24-Jan-2011
Atlanta RFServices, Software & Designs
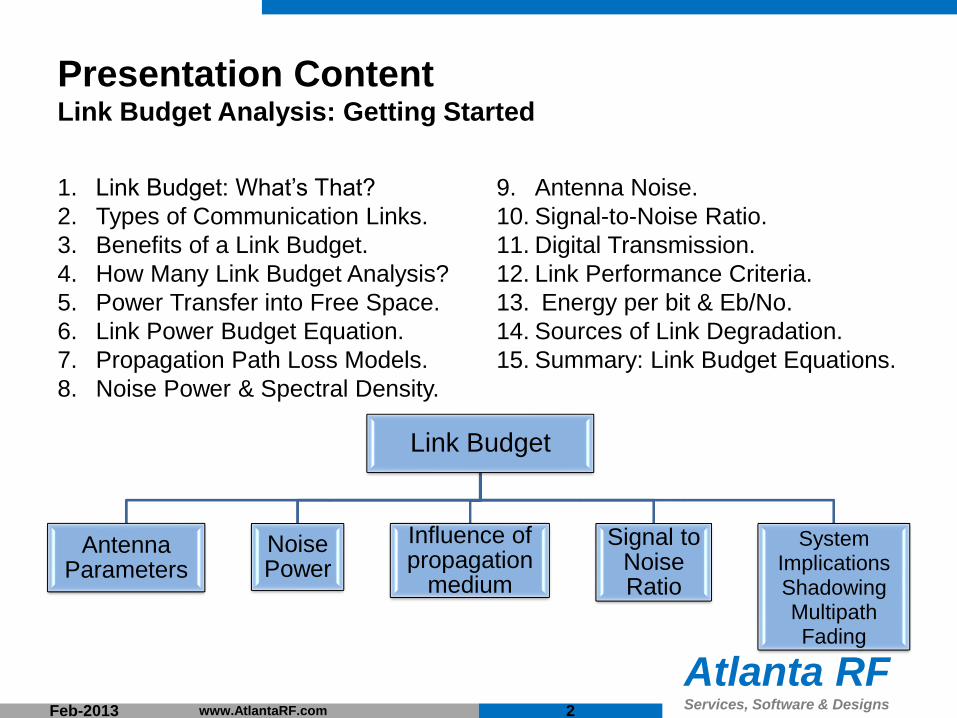
1. Link Budget: What’s That?
2. Types of Communication Links.
3. Benefits of a Link Budget.
4. How Many Link Budget Analysis?
5. Power Transfer into Free Space.
6. Link Power Budget Equation.
7. Propagation Path Loss Models.
8. Noise Power & Spectral Density.
9. Antenna Noise.
10. Signal-to-Noise Ratio.
11. Digital Transmission.
12. Link Performance Criteria.
13. Energy per bit & Eb/No.
14. Sources of Link Degradation.
15. Summary: Link Budget Equations.
Feb-2013 www.AtlantaRF.com
Link Budget
Antenna Parameters
Noise Power
Influence of propagation
medium
Signal to Noise Ratio
SystemImplicationsShadowingMultipath Fading
Presentation ContentLink Budget Analysis: Getting Started
2

Atlanta RFServices, Software & Designs
Link Budget: What’s that?Link Budget Analysis: Getting Started
1. A Link Budget analysis determines if there is
enough signal power at the receiver to recover
the information transmitted to it with acceptable
fidelity so the received signal can be used.A. The sum of gains and losses in various parts
of the system has to result in satisfactory
performance (typically, output S/N or BER).
2. The design of any communication link is
based on:A. Meeting of minimum C/N ratio for a specific percentage of time.
B. Carrying the maximum revenue earning traffic at minimum cost.
3. Link-power budget calculations take into account all the gains and losses
from the transmitter, through the propagation medium to the receiver in a
communication system. Also taken into the account are the attenuation of
the transmitted signal due to propagation, and the loss or gain due to the
antenna. Link calculations often determine the maximum distance at which
a transmitter and receiver can successfully operate.
Feb-2013 www.AtlantaRF.com
Earth Station AEarth Station B
DOWNLINK
UPLINK
3
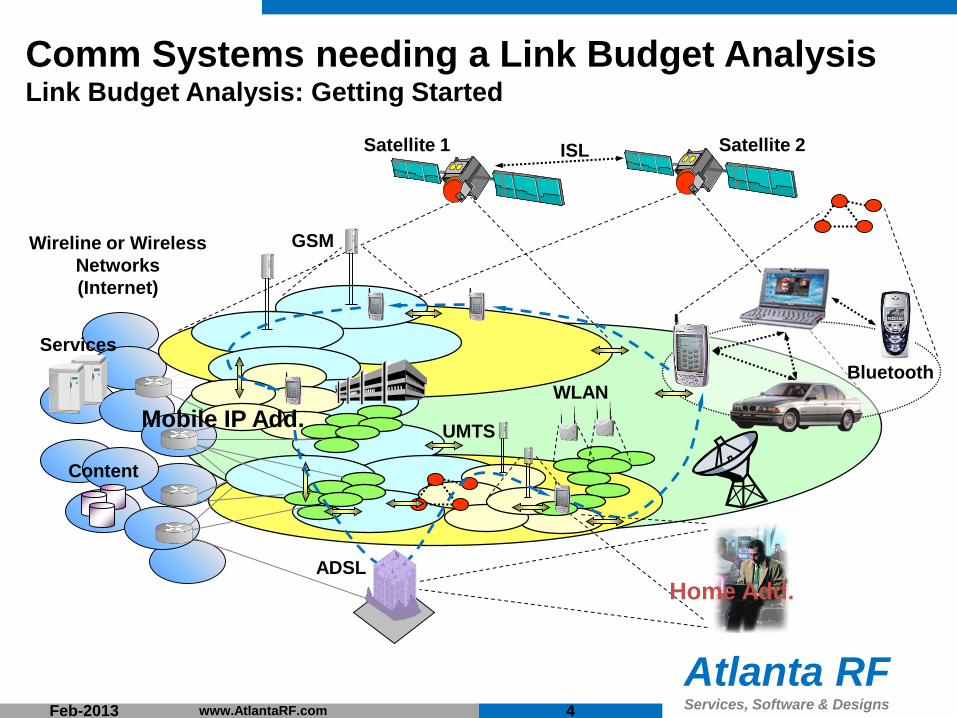
Atlanta RFServices, Software & Designs
Services
Content
GSM
UMTS
WLANBluetooth
Satellite 2
Wireline or Wireless
Networks
(Internet)
ADSL
Comm Systems needing a Link Budget AnalysisLink Budget Analysis: Getting Started
Home Add.
Mobile IP Add.
Satellite 1 ISL
Feb-2013 www.AtlantaRF.com 4

Atlanta RFServices, Software & Designs
Types of Communication LinksLink Budget Analysis: Getting Started
1. Point-to-Point Link: Radio tower relay stations.
2. Satellite Link: Communications payload and TT&C signalsA. Earth Station to Satellite.
B. Satellite-to-Satellite.
C. Satellite-to-Earth Station.
3. Terrestrial Link:A. Cable/wire to cable/wire
B. Fiber optic-to-fiber optic.
4. Maritime Link: Ship-to-Ship
Feb-2013 www.AtlantaRF.com 5

Atlanta RFServices, Software & Designs
Benefits of a Link Budget AnalysisLink Budget Analysis: Getting Started
1. The overall performance of a communication system is expressed in terms
of the ratio of carrier’s signal power to noise power: C/N and, ultimately, the
information quality in the form of:A. Message quality,
B. BER: Bit error rate,
C. Video impairment, or
D. Audio fidelity.
2. Done properly, link analysis can predict if the operation thresholds of the
communication link are met with satisfactory quality, based on the
specifications of the ground components and space components.
3. Operation thresholds in the communication link depend on:A. Modulation scheme being used.
B. Desired communication quality.
C. Coding gain.
D. Additional overheads.
E. Channel Bandwidth.
F. Thermal Noise power.
4. Any uncertainty can be covered by providing an appropriate amount of link
margin, which is over and above the C/N needed to account for propagation
effects and nonlinearity in the system.
Feb-2013 www.AtlantaRF.com 6
Atlanta RFServices, Software & Designs
Link Budget ObjectivesLink Budget Analysis: Getting Started
1. The Link Budget allows us to characterize the quality of the wireless
communications link in a quantitative fashion.
2. Link Budget is used in the design process to define & “size” parameters and
components in the wireless communication system:
A. How much RF signal power do I need to transmit/broadcast?
B. How big should my antenna be? Or, which antenna should I use?
C. How fast can I send data?
D. If I use an error detection and correction encoding technique, can I get away with
a “noisier” link and therefore save system (& cost) resources elsewhere?
3. Goals in communication systems design:
A. To maximize transmission bit rate, Rbit
B. To minimize bit error rate, BER.
C. To minimize required power, Eb/No .
D. To minimize required system bandwidth, Bw .
E. To maximize system utilization.
F. To minimize systems complexity.
Feb-2013 www.AtlantaRF.com 7

Atlanta RFServices, Software & Designs
How Many Link Budget Analysis?Link Budget Analysis: Getting Started
1. Two link budget analysis need to be planned:A. Uplink Analysis: From ground to satellite.
B. Downlink Analysis: From satellite to ground.
2. Two-way communication requires 4 link analysis:A. Example: Maritime communications.
3. One way communication require 2 link analysis:A. Example: Direct-To-Home TV broadcast.
4. Two communication links often operate at different
frequencies within the same frequency band.
5. Two links may not be in the same frequency band.A. Fixed / broadcast satellite services usually use
same frequency band, like C-band or Ku-band.
B. Mobile satellite services may use different
frequency bands, like: L-band uplink & S-band
downlink.
6. In some communication systems, satellite links
may be combined with terrestrial returns.
One way communication
Two way communication
Feb-2013 www.AtlantaRF.com 8
Atlanta RFServices, Software & Designs
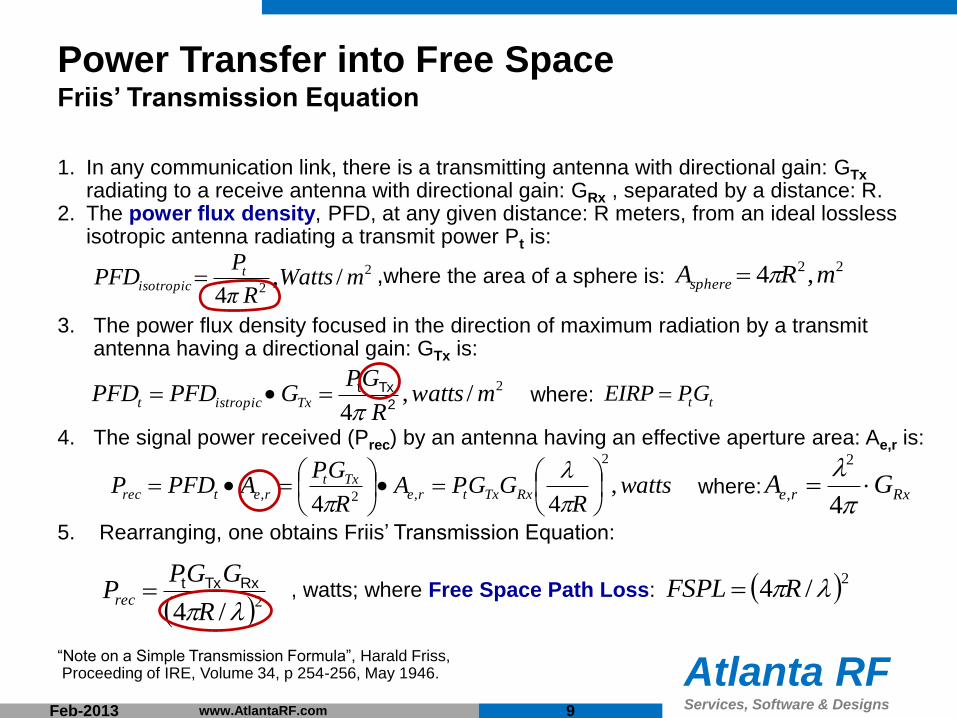
Power Transfer into Free SpaceFriis’ Transmission Equation
1. In any communication link, there is a transmitting antenna with directional gain: GTx
radiating to a receive antenna with directional gain: GRx , separated by a distance: R.2. The power flux density, PFD, at any given distance: R meters, from an ideal lossless
isotropic antenna radiating a transmit power Pt is:
,where the area of a sphere is:
3. The power flux density focused in the direction of maximum radiation by a transmit antenna having a directional gain: GTx is:
where:
4. The signal power received (Prec) by an antenna having an effective aperture area: Ae,r is:
where:
5. Rearranging, one obtains Friis’ Transmission Equation:
, watts; where Free Space Path Loss:
“Note on a Simple Transmission Formula”, Harald Friss, Proceeding of IRE, Volume 34, p 254-256, May 1946.
2
2/,
4mWatts
Rπ
PPFD t
isotropic
2/,4
mwattsR
GPGPFDPFD Txistropict 2
Txt
•
wattsR
GGPAR
GPAPFDP RxTxtre
Txtretrec ,
44
2
,2,
•
•
2/4 R
GGPPrec
RxTxt
22 ,4 mRAsphere
Rxre GA
4
2
,
2/4 RFSPL
Feb-2013 www.AtlantaRF.com
ttGPEIRP
9

Atlanta RFServices, Software & Designs
Friis’ Transmission Equation with LossLink Budget Analysis: Getting Started
Receive
Antenna
Transmit
Antenna
R
qt,ft)
qr,fr)
2*
2
22ˆˆ),(),(
4)1)(1( awrrgrttgttrcdrcdt
t
r DDRP
Pfqfq
Conductor and
Dielectric losses in
Transmit antenna
Conductor and
Dielectric losses in
Receive antenna
Reflection loss in
Transmit antenna
(impedance mismatch)
Reflection loss in
Receive antenna
(impedance mismatch)
Polarization Mismatch
Free Space Path Loss
Directivity of Transmit antenna
Directivity of Receive antenna
Feb-2013 www.AtlantaRF.com 10
Atlanta RFServices, Software & Designs
Link Budget for Receive Power: PrAdditional Losses to Friss’ Transmission Equation
Additional losses are experienced in any wireless communication link,
and those losses can be included in Friss’ transmission equation as:
where:A. EIRP = Pt + GTx , dBW (Effective Isotropic Radiated Power).
B. Pt: RF power delivered to the Transmitting antenna, dBW.1) Pt = Transmit amplifier’s RF output power (Pout)
minus feeder losses (Lt).
C. GTx: Directional Gain of the Transmitting antenna, dBi.
D. GRx: Directional Gain of the Receiving antenna, dBi.
E. Losses in the communication link:1) Lp = Free-Space Path Loss (FSPL) caused by spherical spreading of the Tx RF signal.
a) Lp = 10 log 10 [(4πR)2/λ2] ; R = Distance, meters ; λ = Wavelength of RF signal, meters.
2) La = Losses due to attenuation in Earth’s atmosphere.
3) Lta = Losses associated with transmitting antenna: Ohmic & reflection losses.
4) Lra = Losses associates with receiving antenna: Ohmic & reflecton losses.
5) Lpol = Losses due to polarization mismatch.
6) Lother = Any other known loss. Include as much detail as available.
7) Lr = Additional losses at receiver (after receiving antenna).
Feb-2013 www.AtlantaRF.com
wattsLLLLLLL
GGPP
rotherpolrataap
RxTxtr ,
Tx High
Power
Amplifier
Pout
Lt
Pt
EIRP
11

Atlanta RFServices, Software & Designs
Link Power Budget EquationLink Budget Analysis: Getting Started
1. Friss’ Transmission equation, including all additional losses, forms the
Link Power Budget equation for the communication system, where
each term can be expressed in decibel (dB) form: 10log10(x) as:
2. The receive power: Pr is commonly referred to as Carrier Power: C,
which is measured at the input to the Receiver’s Low Noise Amplifier.
3. The major source of loss in any ground-satellite link is the free-space
spreading loss (FSPL), represented by Lp in the Link Power equation.
4. Linear form for FSPL: Decibel form for FSPL:
Feb-2013 www.AtlantaRF.com
dBWLossesGEIRPP Rxr ,
2/4 RFSPL
where:
R = Distance between Tx and Rx.
λ = Wavelength of the RF signal.
dBRFSPL ,/4log102
10
GHzlog20mileslog205.96 fdFSPL
GHzkm fdFSPL log20log2044.92
Hzm fdFSPL log20log2056.147
12

Atlanta RFServices, Software & Designs
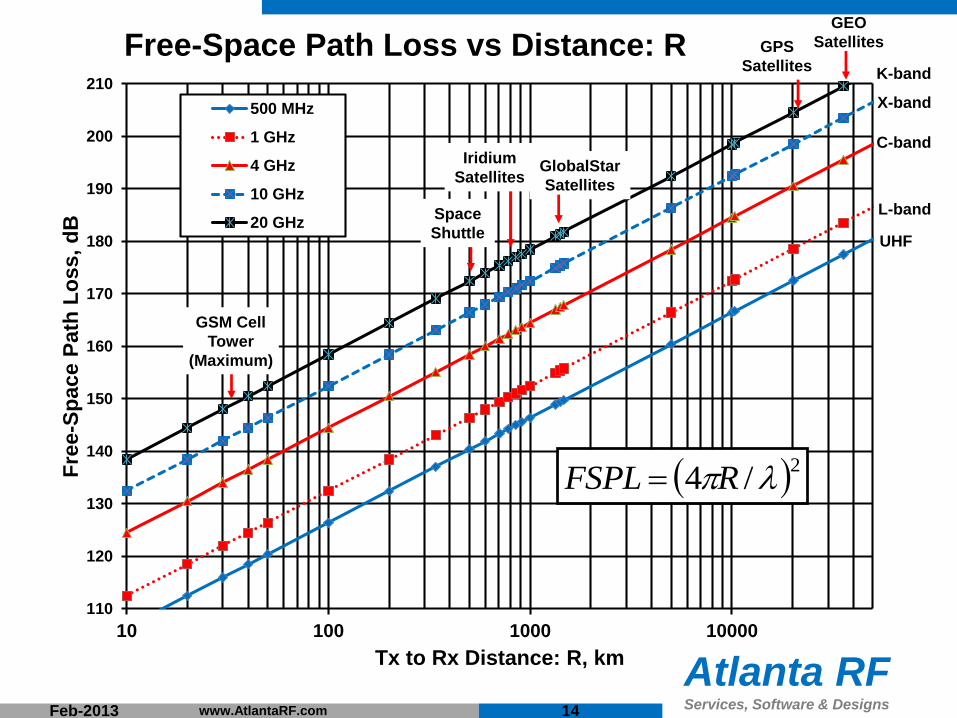
Propagation Path Loss ModelsLink Budget Analysis: Getting Started
1. Propagation path loss is a reduction in the signal’s power, which is a
direct result of the distance between the transmitter and the receiver
in the communication path. . . . Spreading loss.
2. There are many models used in the industry today to estimate the
propagation path loss, and the most common are:
A. Free Space Path Loss (FSPL).
B. Hata Path Loss.
C. Lee Path Loss.
3. Each propagation path loss model has its own requirements that
need to be met in order to be utilized correctly.
4. The Free Space Path Loss (FSPL) is used as the foundation for all
propagation path loss models. Used extensively for predicting Point-
to-Point, fixed, propagation path loss. Typically underestimates the
path loss actually experienced for mobile communications.
Feb-2013 www.AtlantaRF.com 13
Atlanta RFServices, Software & DesignsFeb-2013 www.AtlantaRF.com
110
120
130
140
150
160
170
180
190
200
210
10 100 1000 10000
Fre
e-S
pace P
ath
Lo
ss,
dB
Tx to Rx Distance: R, km
Free-Space Path Loss vs Distance: R
500 MHz
1 GHz
4 GHz
10 GHz
20 GHz
GEO
Satellites
UHF
L-band
C-band
X-band
K-band
GPS
Satellites
2/4 RFSPL
GlobalStar
Satellites
Iridium
Satellites
Space
Shuttle
GSM Cell
Tower
(Maximum)
14

Atlanta RFServices, Software & Designs
Communication System NoiseLink Budget Analysis: Getting Started
1. Noise in a communication system is caused by thermal noise
sources, or can be represented as a thermal noise source:
A. Noise sources external to the Receive system, such as:
1) Transmitted noise on the communication link.
2) Environmental noise captured by the Receive antenna:
a) Antennas pointed at outer space, which appears cold and produces little thermal
noise power (about 5K).
b) Onboard satellite antennas pointed towards the Earth capture thermal noise power
(about 290 K):
B. Noise sources internal to the Receive system, such as:
1) Feed-line losses located before the LNA.
2) Noise from the Receiver’s Low-Noise Amplifier (LNA).
2. Different noise sources have different origins but a similar power
spectral density, so they can all be treated as thermal noise.
Feb-2013 www.AtlantaRF.com 15
Atlanta RFServices, Software & Designs
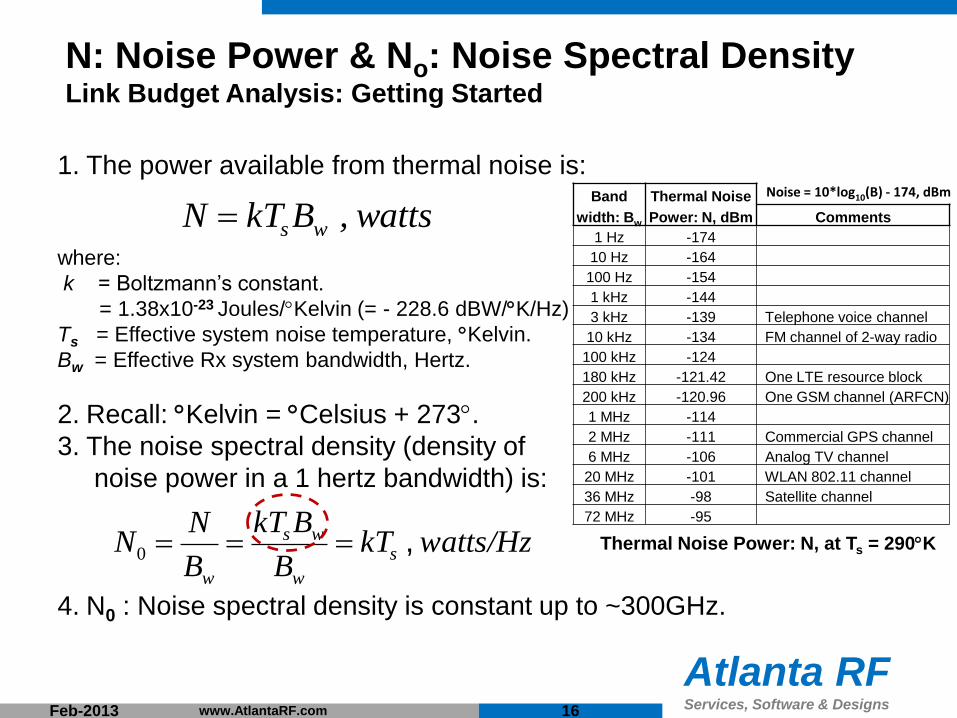
N: Noise Power & No: Noise Spectral DensityLink Budget Analysis: Getting Started
1. The power available from thermal noise is:
where:
k = Boltzmann’s constant.
= 1.38x10⁻²³ Joules/Kelvin (= - 228.6 dBW/K/Hz)
Ts = Effective system noise temperature, Kelvin.
Bw = Effective Rx system bandwidth, Hertz.
2. Recall: Kelvin = Celsius + 273.
3. The noise spectral density (density of
noise power in a 1 hertz bandwidth) is:
4. N0 : Noise spectral density is constant up to ~300GHz.
Feb-2013 www.AtlantaRF.com
, wattsBkTN ws
watts/HzkTB
BkT
B
NN s
w
ws
w
, 0
Band Thermal Noise
width: Bw Power: N, dBm Comments
1 Hz -174
10 Hz -164
100 Hz -154
1 kHz -144
3 kHz -139 Telephone voice channel
10 kHz -134 FM channel of 2-way radio
100 kHz -124
180 kHz -121.42 One LTE resource block
200 kHz -120.96 One GSM channel (ARFCN)
1 MHz -114
2 MHz -111 Commercial GPS channel
6 MHz -106 Analog TV channel
20 MHz -101 WLAN 802.11 channel
36 MHz -98 Satellite channel
72 MHz -95
Thermal Noise Power: N, at Ts = 290K
Noise = 10*log10(B) - 174, dBm
16
Atlanta RFServices, Software & Designs
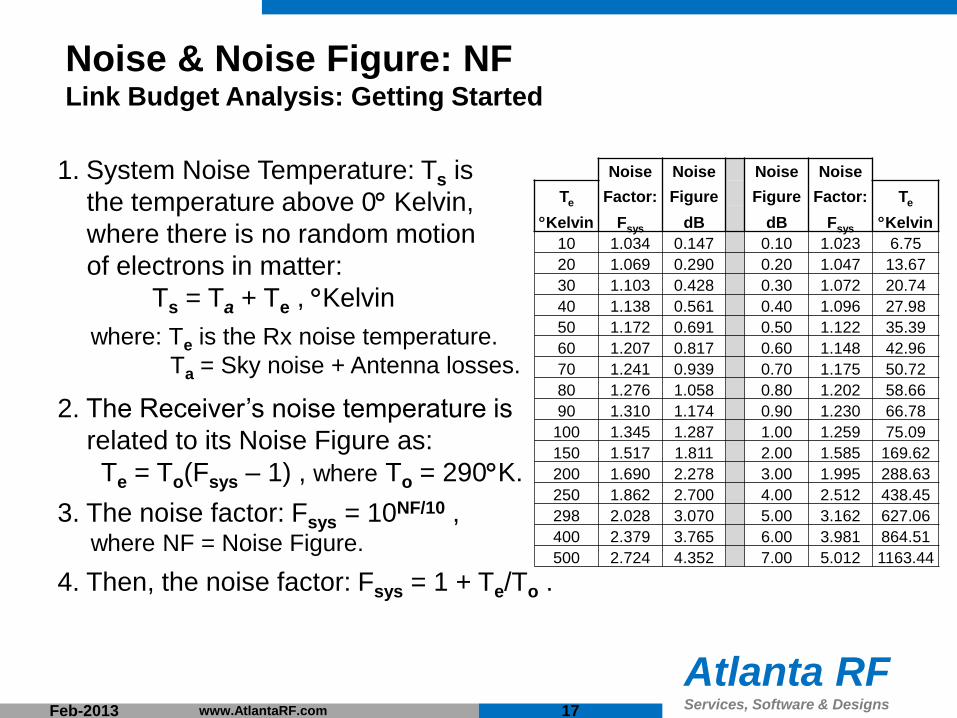
Noise & Noise Figure: NFLink Budget Analysis: Getting Started
1. System Noise Temperature: Ts is
the temperature above 0 Kelvin,
where there is no random motion
of electrons in matter:
Ts = Ta + Te , Kelvin
where: Te is the Rx noise temperature.
Ta = Sky noise + Antenna losses.
2. The Receiver’s noise temperature is
related to its Noise Figure as:
Te = To(Fsys – 1) , where To = 290K.
3. The noise factor: Fsys = 10NF/10 , where NF = Noise Figure.
4. Then, the noise factor: Fsys = 1 + Te/To .
Feb-2013 www.AtlantaRF.com
Noise Noise Noise Noise
Te Factor: Figure Figure Factor: Te
Kelvin Fsys dB dB Fsys Kelvin
10 1.034 0.147 0.10 1.023 6.75
20 1.069 0.290 0.20 1.047 13.67
30 1.103 0.428 0.30 1.072 20.74
40 1.138 0.561 0.40 1.096 27.98
50 1.172 0.691 0.50 1.122 35.39
60 1.207 0.817 0.60 1.148 42.96
70 1.241 0.939 0.70 1.175 50.72
80 1.276 1.058 0.80 1.202 58.66
90 1.310 1.174 0.90 1.230 66.78
100 1.345 1.287 1.00 1.259 75.09
150 1.517 1.811 2.00 1.585 169.62
200 1.690 2.278 3.00 1.995 288.63
250 1.862 2.700 4.00 2.512 438.45
298 2.028 3.070 5.00 3.162 627.06
400 2.379 3.765 6.00 3.981 864.51
500 2.724 4.352 7.00 5.012 1163.44
17

Atlanta RFServices, Software & Designs
Antenna NoiseLink Budget Analysis: Getting Started
1. Antenna noise temperature includes noise
components captured from the environment
surrounding the antenna and the noise gen-
erated by losses within the antenna, both
ohmic loss and reflected mismatch loss.
2. The antenna noise temperature is the result of
integrating the antenna’s three-dimensional
radiation pattern with the incremental noise temperatures over spherical
space. Typically, the environmental noise temperature varies with the
antenna’s elevation angle: – The noise temperature below the horizon may be considered as 290 K.
– The noise temperature at the local zenith may be less than 5 K.
– Low on the horizon, the noise temperature varies from 290 K at the horizon to
100 K at very low elevation angles near the horizon to 5 K near the zenith.
3. For low link margin communications systems, it is generally important to
minimize the antenna temperature. Therefore, a half-power beam width
somewhat less than 180 tends to lower the antenna noise temperature.
Feb-2013 www.AtlantaRF.com 18

Atlanta RFServices, Software & Designs
Antenna Noise Temperature: TaLink Budget Analysis: Getting Started
Useful approximation for Earth Station antenna temperature on clear sky:
Earth Station Antenna - Noise Temperature
15
20
25
30
35
40
45
50
0 10 20 30 40 50 60 70 80 90 100
Elevation Angle (degrees)
Ta (
K)
Feb-2013 www.AtlantaRF.com 19

Atlanta RFServices, Software & Designs
Atmospheric & Sky Noise TemperaturesStandard Atmosphere
Feb-2013 www.AtlantaRF.com 20
Atlanta RFServices, Software & Designs
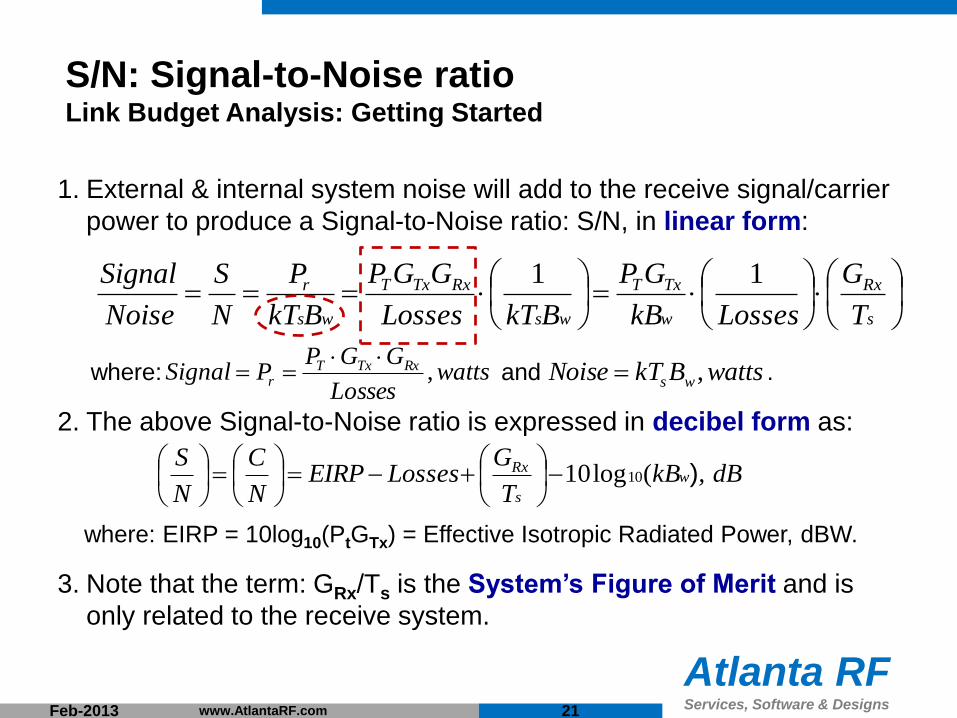
S/N: Signal-to-Noise ratioLink Budget Analysis: Getting Started
1. External & internal system noise will add to the receive signal/carrier
power to produce a Signal-to-Noise ratio: S/N, in linear form:
where: and .
2. The above Signal-to-Noise ratio is expressed in decibel form as:
where: EIRP = 10log10(PtGTx) = Effective Isotropic Radiated Power, dBW.
3. Note that the term: GRx/Ts is the System’s Figure of Merit and is
only related to the receive system.
Feb-2013 www.AtlantaRF.com
wattsLosses
GGPPSignal RxTxT
r ,
wattsBkTNoise ws ,
s
Rx
w
TxT
ws
RxTxT
ws
r
T
G
LosseskB
GP
BkTLosses
GGP
BkT
P
N
S
Noise
Signal 11
, dBkBT
GLossesEIRP
N
C
N
Sw
s
Rx )(log10 10
21

Atlanta RFServices, Software & Designs
Closing the LinkLink Budget Analysis: Getting Started
1. Calculate the Link Budget to verify if we are “closing the link”.
When the received power is greater then the minimum
acceptable carrier power, then the link is ‘closed’:
Pr >= Cmin Link closed
Pr < Cmin Link not closed
2. To ensure acceptable operation in the communication system,
assign a “Link Margin” in the Link Budget calculations, which
tells how tight we are in closing the link:
Link Margin = Pr – Cmin (usually expressed in dB)
3. Equivalently:
Link Margin > 0 Link closed.
Link Margin < 0 Link not closed.
Feb-2013 www.AtlantaRF.com 22

Atlanta RFServices, Software & Designs
Link performance and availabilityLink Budget Analysis: Getting Started
Key link budget equation:
Pr = EIRP + GRx – FSPL – La , dB
where:
Pr : Received power , dBw.
EiRP: PtGTx, dB.
FSPL: Free space path loss, dB.
La : Atmospheric losses , dB.
Note: La is a random variable that
changes due to condition of the
atmosphere between Tx and Rx.
Two thresholds are defined:1. Performance threshold: Link’s
performance above targeted value.
2. Availability threshold: Link is not
available due to bad performance.
Feb-2013 www.AtlantaRF.com 23

Atlanta RFServices, Software & Designs
Digital TransmissionLink Budget Analysis: Getting Started
1. Analog communications mostly use mean signal power over mean noise
power: S/N as a quality parameter.
2. In analog communications, a waveform can be imagined as a signal with
infinitely long duration and not divided in time, therefore with an unlimited
amount of energy. It has final mean power and infinitive energy. Therefore,
power is a useful parameter for analog communications.
3. With digital communications, symbols are transmitted in a time: TS. If only
one symbol is observed, mean power in all the time interval approaches
zero. Therefore, power is not a satisfactory parameter for digital systems.
4. In digital communications, more often is used Eb/N0, or normalized version of
signal and noise:
where: Eb is the energy per bit, watt-second.
N0 is thermal noise in 1 Hz bandwidth, watts/Hz.
R is the data speed in the system, bits per second (bps).
Bw is the frequency bandwidth, Hz.
Feb-2013 www.AtlantaRF.com
w
bit
o
b
B
R
N
E
N
S
24
Atlanta RFServices, Software & Designs
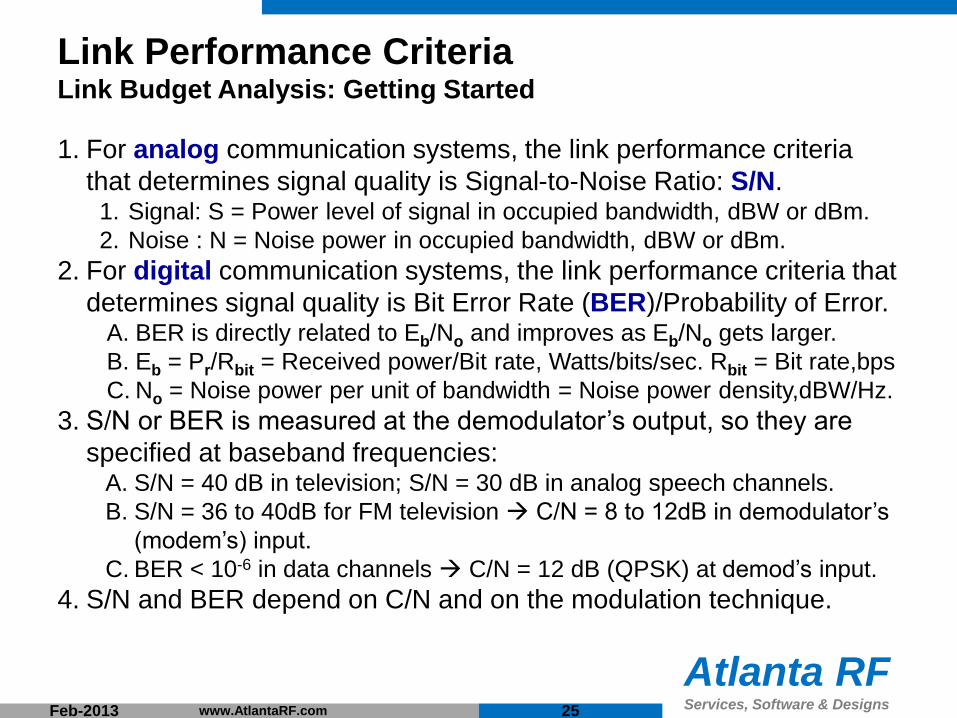
Link Performance CriteriaLink Budget Analysis: Getting Started
1. For analog communication systems, the link performance criteria
that determines signal quality is Signal-to-Noise Ratio: S/N.1. Signal: S = Power level of signal in occupied bandwidth, dBW or dBm.
2. Noise : N = Noise power in occupied bandwidth, dBW or dBm.
2. For digital communication systems, the link performance criteria that
determines signal quality is Bit Error Rate (BER)/Probability of Error.A. BER is directly related to Eb/No and improves as Eb/No gets larger.
B. Eb = Pr/Rbit = Received power/Bit rate, Watts/bits/sec. Rbit = Bit rate,bps
C. No = Noise power per unit of bandwidth = Noise power density,dBW/Hz.
3. S/N or BER is measured at the demodulator’s output, so they are
specified at baseband frequencies:A. S/N = 40 dB in television; S/N = 30 dB in analog speech channels.
B. S/N = 36 to 40dB for FM television C/N = 8 to 12dB in demodulator’s
(modem’s) input.
C. BER < 10-6 in data channels C/N = 12 dB (QPSK) at demod’s input.
4. S/N and BER depend on C/N and on the modulation technique.
Feb-2013 www.AtlantaRF.com 25
Atlanta RFServices, Software & Designs
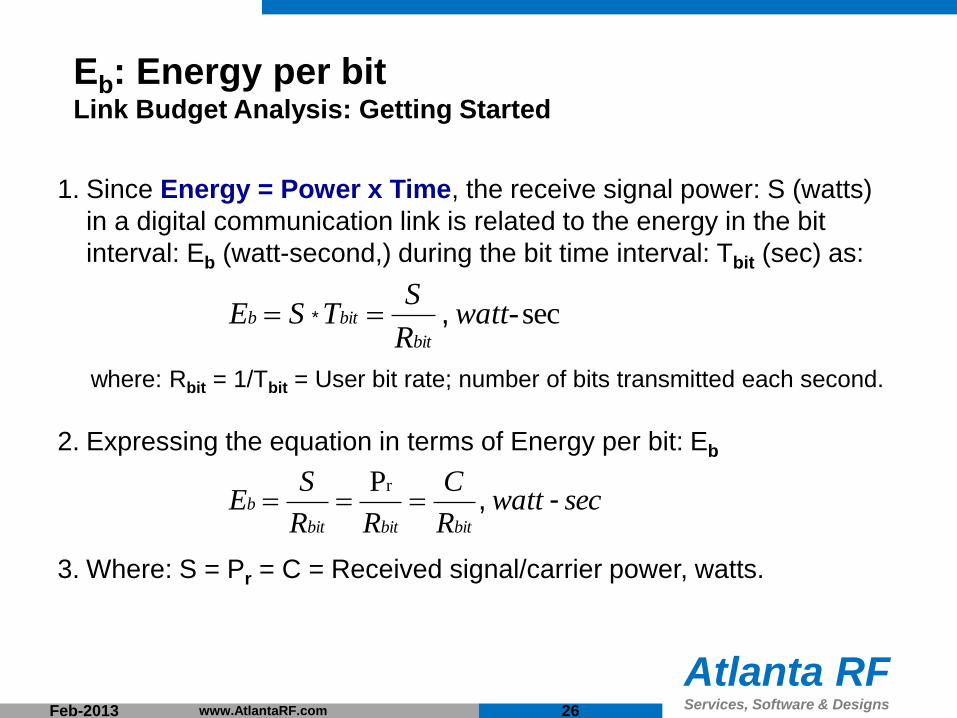
Eb: Energy per bitLink Budget Analysis: Getting Started
1. Since Energy = Power x Time, the receive signal power: S (watts)
in a digital communication link is related to the energy in the bit
interval: Eb (watt-second,) during the bit time interval: Tbit (sec) as:
where: Rbit = 1/Tbit = User bit rate; number of bits transmitted each second.
2. Expressing the equation in terms of Energy per bit: Eb
3. Where: S = Pr = C = Received signal/carrier power, watts.
Feb-2013 www.AtlantaRF.com
secwatt-R
STSE
bit
bitb , *
secwattR
C
RR
SE
bitbitbit
b - ,rP
26
Atlanta RFServices, Software & Designs
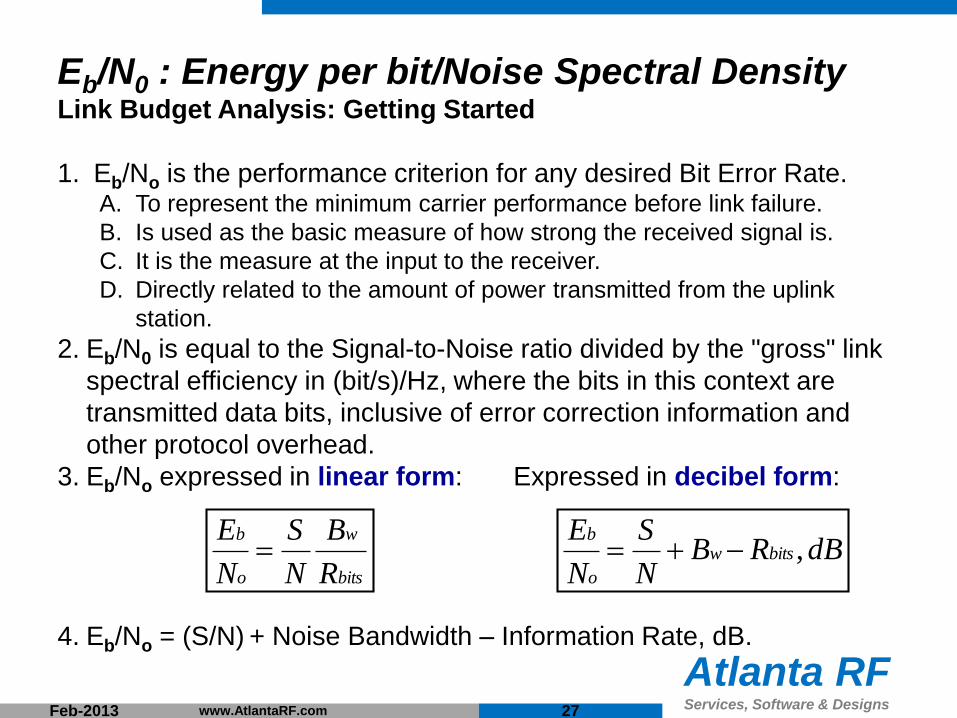
Eb/N0 : Energy per bit/Noise Spectral DensityLink Budget Analysis: Getting Started
1. Eb/No is the performance criterion for any desired Bit Error Rate.A. To represent the minimum carrier performance before link failure.
B. Is used as the basic measure of how strong the received signal is.
C. It is the measure at the input to the receiver.
D. Directly related to the amount of power transmitted from the uplink
station.
2. Eb/N0 is equal to the Signal-to-Noise ratio divided by the "gross" link
spectral efficiency in (bit/s)/Hz, where the bits in this context are
transmitted data bits, inclusive of error correction information and
other protocol overhead.
3. Eb/No expressed in linear form: Expressed in decibel form:
4. Eb/No = (S/N) + Noise Bandwidth – Information Rate, dB.
Feb-2013 www.AtlantaRF.com
bits
w
o
b
R
B
N
S
N
E dBRB
N
S
N
Ebitsw
o
b,
27

Atlanta RFServices, Software & Designs
Sources of Link DegradationLink Budget Analysis: Getting Started
1. Signal Attenuation/Fading:A. A time-varying response.
B. Amplitude/envelop/gain/power attenuation.
2. Signal Distortion:A. Distortion can be introduced within the Transmitter, Receiver or in the channel.
B. The common types of link distortion are:1) Frequency-dependent phase shift.
2) Gain variation with frequency caused by channel filtering effects.
3) Gain variation with time as seen in radio/infrared channels.
4) Frequency offsets between Tx & Rx due to Doppler shift or local oscillator errors.
C. Distortion can be corrected with equalization or gain/frequency control systems.
3. Signal Interference:A. Interference arises due to signal contamination in the channel by extraneous signals.
Most interference signals are impulsive.
4. Noise:A. Noise is characterized as random, unpredictable electrical signals from natural
sources such as: Atmospheric noise, Thermal noise, Shot noise, etc.
B. Because of the multiplicity of noise sources, it is difficult to define.
C. It is commonly assumed that noise in communication links fall into the class of Additive
White Gaussian Noise (AWGN).
Feb-2013 www.AtlantaRF.com 28
Atlanta RFServices, Software & Designs
Summary: Link Budget EquationsLink Budget Analysis: Getting Started
Feb-2013 www.AtlantaRF.com
wattsLLLLLLL
GGPSP
rotherpolrataap
RxTxtr ,
dBWLossesGEIRPSP Rxr ,
dBRFSPL ,/4log102
10
, wattsBkTN ws
, dBkBT
GLossesEIRP
N
C
N
Sw
s
Rx )(log10 10
secwatt-R
STSE
bit
bitb , *
dBRBN
S
N
Ebitsw
o
b,
2. Receive Signal Power:
3. Free Space Path Loss: FSPL
4. System Noise:
5. Signal-to-Noise Ratio:
6. Energy per bit:
7. Energy/bit per Noise density:
dBWGPEIRP Txt , * )(log10 10
1. Effective Isotropic Radiated Power:
watts/HzkTB
BkT
B
NN s
w
ws
w
, 0
8. Noise spectral density:
29

Atlanta RFServices, Software & Designs
Atlanta RFServices, Software & Designs
Atlanta RF LLC was founded to provide engineering solutions, design software solutions,
and product development solutions to the high-frequency RF/microwave industry in the
areas of: Telecommunications (ground segment), Satellite (space segment) and
military/defense (RF front-ends).
Through teamwork, Atlanta RF applies our diverse technical experience to your project's
challenges with creative and innovative solutions while holding ourselves accountable fo
the results. With professionalism and commitment to our clients, Atlanta RF will be there
for you, both today and tomorrow.
Contact Atlanta RF by e-mail at:
➢ Atlanta RF Services : [email protected]
➢ Atlanta RF Software : [email protected]
➢ Atlanta RF Designs : [email protected]
Or, contact Atlanta RF by phone at: 678-445-5544, to reach our Atlanta-area office in
Georgia, USA, and discuss our support to your current or future projects & products.
30Feb-2013 www.AtlantaRF.com

Atlanta RFServices, Software & Designs
Presentations by Atlanta RF, LLC
Download various presentations at our website: www.AtlantaRF.com :
1. Satellite: LEO, MEO & GEO.
2. Antennas: An Overview.
3. Link Budget: Getting Started.
4. Link Budget: Digital Modulation Part 1 (Overview & M-ASK).
5. Link Budget: Digital Modulation Part 2 (M-FSK).
6. Link Budget: Digital Modulation Part 3 (M-PSK & QAM).
7. Link Budget: Error Control & Detection.
8. Multiple Access Techniques: FDMA, TDMA and CDMA.
9. Insertion Loss: Double Ridge Waveguide.
10.RF Filters: An Overview.
11.Multi-Section Symmetrical Directional Couplers.
12.Parallel Coupled Bandpass Filters.
Visit our website often as presentations are added for your viewing pleasure.
Feb-2013 31www.AtlantaRF.com