link reliability in cooperative relaying using network...
TRANSCRIPT
Link Reliability inCooperative Relaying
Using Network Coding
TAFZEEL UR REHMAN AHSIN
Licentiate Thesis inCommunication SystemsStockholm, Sweden 2010


Link Reliability in Cooperative Relaying UsingNetwork Coding
TAFZEEL UR REHMAN AHSIN
Licentiate Thesis inCommunication SystemsStockholm, Sweden 2010

TRITA–ICT–COS–1007ISSN 1653–6347ISRN KTH/COS/R–10/07–SE
KTH Communication SystemsSE-100 44 Stockholm
SWEDEN
Akademisk avhandling som med tillstånd av Kungl Tekniska högskolan framlägges till of-fentlig granskning för avläggande av teknologie licentiatexamen i radiosystemteknik freda-gen den 09 December 2010 klockan 14.00 i tbd.
© Tafzeel ur Rehman Ahsin, December 2010
Tryck: Universitetsservice US AB
i
Abstract
Demand for high data rates is increasing rapidly for future wireless sys-tems. This trend is due to the increase in the number of mobilesubscribers thatneed bandwidth hungry multimedia applications anywhere, anytime. Fourthgeneration cellular systems like IMT-advanced are being developed to meetthese requirements. The unreliable nature of the wireless medium is one ofthe main hinderance in providing high data rates. Cooperative communicationin cellular networks is emerging as a new paradigm to deal with the channelimpairments. User cooperation via fixed relays in cellular systems form multi-ple access relay channels (MARCs) and provide an effective and cost efficientsolution to achieve spatial diversity gains. Network resources can be utilizedefficiently by using network coding at cooperating nodes.
A lot of research work has focused on highlighting the gains achieved byusing network coding in MARCs. However, there are certain areas that arenot fully explored yet. For instance, the kind of the detection scheme usedat the base station receiver and its impact on the link performance has notbeen addressed. In most cases, the outage probability has been used as aperformance measure of MARCs. However, it is well known thatthe outageprobability gives information about the signal availability, but it does not givethe complete picture about the reliability of the link and the achieved qualityof service.
This thesis work looks at the link performance, in terms of symbol errorprobability, of multiple access relay channels that employnetwork coding atthe relay node. Different types of detection schemes are considered and theirperformance is compared under different link conditions. Analytical expres-sions for the average symbol error probability of the cooperating users arederived. Focusing on the uplink of cellular systems, certain rules are devisedon how to group users at relay node to ensure mutual benefit forthe cooper-ating users. As a way of improving the link performance of multiple accessrelay channels and their robustness, the thesis considers constellation selectionfor the different branches. This method takes advantage of the redundancy be-tween the transmitted symbols created by network coding andthe augmentedsignal space obtained at the base station receiver. The obtained results showthat, with a proper selection of the constellation sets, thelink performance ofMARCs can be improved. The thesis further looks at the interaction betweenthe channel coding schemes of the cooperating users and network coding. It isshown that joint channel-network coding in MARCs can be seenas a productcode. This new representation provides considerable flexibility in selectingefficient decoding algorithms at the base station receiver and gives the possi-bility to use more powerful network coding schemes for MARCs.


Acknowledgements
The work presented in this thesis has been carried out duringmy licentiate study at De-partment of Communication Systems (COS), ICT at Royal Institute of Technology (KTH),Sweden during the years 2008-2010. I would like to take advantage of this opportunity toacknowledge all the people who have supported me during thiswork.
First and foremost I would express my sincere gratitude to myPhD supervisor Prof.Slimane Ben Slimane, for providing me a chance to study as graduate student and leadingme into this interesting and challenging research topic. I greatly appreciate his generosityin sharing his expertise and time in our frequent discussions which always help to clarifymy thoughts and inspire me with new ideas.
I would also like to thank Prof. Jens Zander, head of department of communicationsystems, for his inspiring discussions through courses andseminars during the study pe-riod. I owe many thanks to Prof. Ove Edfors, Lund University,for acting as my opponent.I also greatly appreciate Docent Svante Signell for his keenefforts in quality checking ofmy thesis. Many thanks to all the colleagues at wireless@KTHfor their continuous sup-port during difficult times and special thanks to Ulla-Lena Eriksson and Irina Radulescufor their kindness and guidance in administrative matters.Last but not the least, my parentsand my wife who have given me endless love and support, deserve warmest thanks.
iii

Contents
List of Tables vi
List of Figures vii
1 Introduction 11.1 Related Work . . . . . . . . . . . . . . . . . . . . . . . . . . . . . . . . 21.2 Problem Formulation . . . . . . . . . . . . . . . . . . . . . . . . . . . . 5
2 Cooperative Communication in Wireless Networks 92.1 Multi-path Fading Channels . . . . . . . . . . . . . . . . . . . . . . . . 92.2 Cellular/Relay Systems . . . . . . . . . . . . . . . . . . . . . . . . . . .142.3 Cellular/Relay Systems with Network Coding . . . . . . . . . .. . . . . 172.4 Summary . . . . . . . . . . . . . . . . . . . . . . . . . . . . . . . . . . 20
3 Link Performance of MARC 213.1 System Model . . . . . . . . . . . . . . . . . . . . . . . . . . . . . . . . 213.2 Performance of Different Detection Schemes . . . . . . . . . .. . . . . 233.3 Performance Comparison . . . . . . . . . . . . . . . . . . . . . . . . . . 353.4 Detection Complexity . . . . . . . . . . . . . . . . . . . . . . . . . . . . 373.5 User Grouping . . . . . . . . . . . . . . . . . . . . . . . . . . . . . . . 373.6 Summary . . . . . . . . . . . . . . . . . . . . . . . . . . . . . . . . . . 40
4 Constellation Selection 414.1 System Model . . . . . . . . . . . . . . . . . . . . . . . . . . . . . . . . 414.2 Joint Detection . . . . . . . . . . . . . . . . . . . . . . . . . . . . . . . 434.3 Selection and Soft Combining . . . . . . . . . . . . . . . . . . . . . . .544.4 Summary . . . . . . . . . . . . . . . . . . . . . . . . . . . . . . . . . . 59
5 Joint Channel-Network Coding for MARC 615.1 System Model . . . . . . . . . . . . . . . . . . . . . . . . . . . . . . . . 615.2 Channel and XOR-based Network Coding . . . . . . . . . . . . . . . .. 625.3 Channel-Network Coding based on Product Codes . . . . . . . .. . . . 655.4 Analytical Performance . . . . . . . . . . . . . . . . . . . . . . . . . . .68
iv

CONTENTS v
5.5 Numerical Results . . . . . . . . . . . . . . . . . . . . . . . . . . . . . . 725.6 Summary . . . . . . . . . . . . . . . . . . . . . . . . . . . . . . . . . . 76
6 Conclusions 796.1 Concluding Remarks . . . . . . . . . . . . . . . . . . . . . . . . . . . . 796.2 Future Directions . . . . . . . . . . . . . . . . . . . . . . . . . . . . . . 81
Bibliography 83

List of Tables
3.1 Truth table at receiver for BPSK . . . . . . . . . . . . . . . . . . . . .. . . 253.2 Complexity comparison for the detection schemes . . . . . .. . . . . . . . . 37
4.1 Reduction in number of pairs containing MSED for different modulation schemesusing joint detection . . . . . . . . . . . . . . . . . . . . . . . . . . . . . . . 47
4.2 Improvement in MSED by selecting proper constellation at the relay for dif-ferent modulation schemes using SSC . . . . . . . . . . . . . . . . . . . .. 55
5.1 XOR-based network coding and its possible codewords in MARC. . . . . . . 63
vi

List of Figures
1.1 Forecast for number of mobile subscribers [1]. . . . . . . . .. . . . . . . . . 21.2 Rapid increase in data rates for future Wireless Systems[2]. . . . . . . . . . 3
2.1 Cooperative Communications . . . . . . . . . . . . . . . . . . . . . . .. . . 142.2 Cellular/Relay System . . . . . . . . . . . . . . . . . . . . . . . . . . . .. 162.3 Network Coding in Butterfly Network . . . . . . . . . . . . . . . . . .. . . 182.4 Cellular/Relay System with Network Coding . . . . . . . . . . .. . . . . . 19
3.1 Transmission Scheme for Network Coded Cooperative Relaying . . . . . . . 223.2 Receiver structure for Joint Detection Scheme . . . . . . . .. . . . . . . . . 233.3 Tightness of bounds in case of joint detection. Average bit error probability of
the users as a function ofγ1 in Rayleigh fading channels. Case 1:γ1 = γ2 =γ3, Case 2:γ3 = 20 dB,γ2 = γ1. . . . . . . . . . . . . . . . . . . . . . . . . 26
3.4 Receiver structure for SSC Scheme, assumingU1 is the strongest user . . . . 273.5 Tightness of bounds in case of selection and soft combining. Average bit error
probability of the users as a function ofγ1 in Rayleigh fading channels. Case1: γ1 = γ2 = γ3, Case 2:γ3 = 20 dB, γ2 = γ1. . . . . . . . . . . . . . . . . 30
3.6 Receiver structure for SHC, assumingU1 is the strongest user . . . . . . . . . 313.7 Tightness of bounds in case of selection and hard combining. Average bit error
probability of the users as a function ofγ1 in Rayleigh fading channels. Case1: γ1 = γ2 = γ3, Case 2:γ3 = 20 dB, γ2 = γ1. . . . . . . . . . . . . . . . . 34
3.8 Average bit error probability for JD, SSC and SHC as a function of γ1 whereγ1 = γ2, usingγ3 = 10 dB andγ3 = 20 dB in case of BPSK . . . . . . . . . 35
3.9 Average symbol error probability for JD, SSC and SHC as a function ofγ1
whereγ1 = γ2, usingγ3 = 20 dB in case of 8PSK . . . . . . . . . . . . . . 363.10 Selecting a suitable user pair at the relay on the basis of average bit error
probability (BEP) of the users . . . . . . . . . . . . . . . . . . . . . . . . .383.11 Average BEP of individual users atγsum = 10 dB andγ3 = 20 dB . . . . . . 393.12 Average BEP of individual users atγsum = 20 dB andγ3 = 10 dB . . . . . . 39
4.1 Comparing MSED for two branch transmit diversity using 4-PAM, (a) Sameconstellations on both branches (b) Selected constellation on branch 2 . . . . 42
vii

viii List of Figures
4.2 Comparison of SED Distribution in Augmented Signal Space, between SameConstellation (SC) and C1 using 8PSK . . . . . . . . . . . . . . . . . . . .. 46
4.3 Comparison of SED Distribution for individual users in Augmented SignalSpace between Same Constellation case and using C1 by employing 8-PSK . 48
4.4 Comparison of Average Symbol Error Rate (SER) for SC and C1 using 8-PSKover AWGN channel. . . . . . . . . . . . . . . . . . . . . . . . . . . . . . . 49
4.5 Comparison of Average SER for SC and C1 using 8-PSK over Rayleigh fadingchannels. . . . . . . . . . . . . . . . . . . . . . . . . . . . . . . . . . . . . 50
4.6 Comparison of Average SER for SC and C1 using 16-PSK over Rayleigh fad-ing channels. . . . . . . . . . . . . . . . . . . . . . . . . . . . . . . . . . . 51
4.7 Constellations used at nodes for 16-QAM (a) SC at all nodes (b) C1 at User 1node (c) C1 at User 2 node (d) C1 at Relay node . . . . . . . . . . . . . . .. 52
4.8 Comparison of Average SER for SC and C1 using 16-QAM over Rayleighfading channels. . . . . . . . . . . . . . . . . . . . . . . . . . . . . . . . . . 53
4.9 Performance of C1 using SSC as compared to Joint detection for 8-PSK overRayleigh fading channels. . . . . . . . . . . . . . . . . . . . . . . . . . . . .56
4.10 C1 for 16-QAM (a). Mapping for User 1 and User 2 (b) Mapping for Relay node 574.11 Performance of C1 using SSC as compared to Joint detection for 16-QAM
over Rayleigh fading channels. . . . . . . . . . . . . . . . . . . . . . . . .. 58
5.1 Uplink of a cellular/relay system with network coding for N users. . . . . . . 625.2 Representation of conventional (XOR-type) network coding at the relay station. 645.3 Network decoding followed by channel decoding for conventional network
coding in cooperative cellular/relay systems. . . . . . . . . . .. . . . . . . . 655.4 Network coding scheme based on the principle of product codes in cellu-
lar/relay systems. . . . . . . . . . . . . . . . . . . . . . . . . . . . . . . . . 665.5 Joint channel-network decoding for product code representation. . . . . . . . 675.6 Comparison of joint channel-network decoding with separate channel-network
decoding, using XOR as network code and(7, 4, 3) as channel code. All thelinks have the same received SNRγ0. . . . . . . . . . . . . . . . . . . . . . 72
5.7 Average bit error probability of the proposed network coding scheme with(15, 11, 3)× (7, 4, 3) in cellular/relay systems over Rayleigh fading channelswhen joint detection is employed for the column code and harddecision forthe row code. All the links have the same received SNRγ0. . . . . . . . . . . 73
5.8 Average bit error probability of the proposed network coding scheme with(15, 11, 3)× (7, 4, 3) in cellular/relay systems over Rayleigh fading channelswhen the relay link is 10 dB better that user direct link. Joint detection isemployed for the column code and hard decision for the row code. . . . . . . 74
5.9 Average bit error probability of the proposed network coding scheme with(15, 11, 3)× (7, 4, 3) in cellular/relay systems over Rayleigh fading channelswhen iterative hard decision decoding is employed for both the row and col-umn codes. All the links have the same received SNRγ0. . . . . . . . . . . . 75

List of Figures ix
5.10 Average bit error probability of the proposed network coding scheme with(15, 11, 3)×(31, 21, 5) in cellular/relay systems over Rayleigh fading channelsfor different number of decoding iterations at the receiver. All the links havethe same received SNRγ0. . . . . . . . . . . . . . . . . . . . . . . . . . . . 76
5.11 Average bit error probability of the proposed network coding scheme with(n, k, d)× (7, 4, 3) in cellular/relay systems over Rayleigh fading channels fordifferent row block codes. Joint detection is employed for the column codeand hard decision for the row code. All the links have the samereceived SNRγ0. . . . . . . . . . . . . . . . . . . . . . . . . . . . . . . . . . . . . . . . . 77


Chapter 1
Introduction
Cellular networks are convenient means of communication having key importance in busi-ness operations and acting as stimulus for economic development. The role of mobilecommunication in our daily lives has been expanded tremendously in the recent years dueto the introduction of variety of advanced multimedia services, location based applica-tions, video transmission and high speed internet access. Today more than four billionpeople are using the mobile phones [3]. It has been forecasted that the number of mobilesubscribers will reach a top mark of five billion [1] by the endof 2011 as illustrated inFigure 2.1. Therefore, the amount of data traffic in wirelessnetworks is anticipated torise exponentially in order to provide wireless broadband services to these large numberof subscribers. Hence, in order to transport this huge amount of data in acceptable time,the target data rates for wireless systems are increasing atthe same speed. For instancethe fourth-generation (4G) cellular systems, like IMT-advanced [4] are being developed toachieve peak data rates of 100 Mega bits per second (Mbps) during mobility while 1 Gigabits per second (Gbps) in indoor environments. It is interesting to observe that the demandfor data rates in wireless networks is growing by a factor of 10 every 5 years, as illustratedin Figure 2.2.
This increasing trend is the main motivating factor for development of novel wirelesstechnologies for reliable and cost efficient transmissions. The introduction of multi-input-multi-output (MIMO) systems [5–8] is a remarkable advancement in the field of communi-cation theory during the last decade. Numerous practical schemes like spatial multiplexingand space-time coding are designed using multiple antennason transmitter and/or receiverside. These schemes provide considerable improvement in spectral efficiency and signalreliability on the links. MIMO techniques and their variations are very popular in cellu-lar applications. For instance, various standards, such asIEEE 802.11, IEEE 802.16, andIEEE 802.20 use these techniques. However, multi-antenna systems have their inherentlimitations. For instance, deployment of complex antenna systems at user device becomesinappropriate due to size, cost and power limitations.
Cooperative communication is an innovative technique thattakes the advantage ofbroadcast nature of wireless channels and can achieve spatial diversity gain without de-
1

2 CHAPTER 1. INTRODUCTION
Figure 1.1: Forecast for number of mobile subscribers [1].
ploying multiple antennas at the nodes. This new transmission paradigm forms an efficientvirtual multi-antenna system in a cellular network. Consequently, significant performancegains can be achieved in terms of link reliability, system capacity and coverage.
Cooperative communication has the ability to provide an effective and cost efficientsolution for future wireless generations. For instance, high frequency bands proposed for4G spectrum motivates to minimize the distance between transmitters and receivers, inorder to reduce the high transmission losses. A brute force solution is to deploy more basestations for reducing the cell size. However, this results into an economically infeasiblesolution [9]. Instead, relays can be used to realize cooperative multi-hop transmission,taking the advantage of the nonlinear relationship betweenthe distance and propagationloss [10], that helps in reducing the overall signal attenuation as compared to single hoptransmission. Consequently, highlighting the effectiveness of cooperation for providinghigh data rates at the cell edges.
Moreover the relays, that can be fixed stations or mobile devices, do not require back-bone networks, making the cooperation between nodes cost efficient. In addition, relaysare less expensive and requires less power than base stations. It has been shown in [11]that cost per transmitted bit can be reduced by a factor of twoto three using cooperativerelaying. Another economical evaluation in [12] shows thatfor an unplanned deployment,justifiable gains in terms of cost can be achieved if the relayis about 10% of the base stationcost. In short, due to its enormous advantages, cooperativecommunication has emerged asa popular research area in cellular communication these days.
1.1 Related Work
The basic idea of relaying, i.e. the foundation of cooperative communications, has beenintroduced in [13]. Later on information theoretic properties of relay channels have beenstudied in [14]. In these pioneering contributions, maximum achievable communicationrate has been derived for a basic three terminal model, containing a source, a relay and adestination. The idea of user cooperation has been introduced by [15,16] for uplink trans-mission that improves the capacity and lowers the outage probability for a given data rate.

1.1. RELATED WORK 3
Figure 1.2: Rapid increase in data rates for future WirelessSystems [2].
A cooperative protocol is designed where two cooperating partners listen to the broadcastedpacket and retransmit the data for each other. This technique also helps in improving thediversity gain, as both transmitting nodes have uncorrelated channels with the destination.Later, [17] extended the concept of cooperation, by designing energy efficient multiple ac-cess protocols based on decode-and-forward (DF) and amplify-and-forward (AF) relayingmodes. Significant gains in terms of outage probability as compared to direct link trans-mission has been illustrated in his work. In addition to fixedrelaying modes, an outageprobability analysis in [18] has been carried out for adaptive and incremental redundancymodes. Distributed channel codes are used at relaying nodesfor improving the bit or blockerror rate in [19–21]. A number of interesting relaying strategies including repetition cod-ing [22–24], space time cooperation [25], and space time coded cooperation [26] have beenproposed and significant gain in terms of error performance,outage probability and powerefficiency has been illustrated.
Many authors have considered the use of network coding [27],a routing techniqueinitially proposed for wired networks, in order to combine the received packets at the relayand improve the link efficiency. For instance [28, 29] proposed a new framework, termedas adaptive network coded cooperation (ANCC) for reducing the outage in a multi terminalnetwork by using low density parity check codes (LDPC) at intermediate nodes. Similarly[30] has investigated the diversity gain using exclusive-OR (XOR) based network codingfor multiple access relay channel (MARC) and showed that network coding improves thebandwidth of MARC from 1/2 to 2/3, without affecting its diversity gain. However, thisinvestigation considers only the outage probability as a performance measure. Here systemis considered in outage, when signal to noise ratio (SNR) fortwo out of three direct linksis below some threshold. Another investigation in [31], considers adaptive transmissionof network coded packet based on its correct reception at relay and analyze the outageprobability for individual user. The outage probability analysis performed in these workshighlights the importance of network coding in MARC in termsof link efficiency, and

4 CHAPTER 1. INTRODUCTION
clearly shows how often a transmission is possible. Howeversystem/individual outagedoes not reflect the gain or loss in terms of SNR for a given bit or block error rate.
In the literature, different methods are considered to combine the directly received sig-nals and relayed signals at the receiver in case of MARC. For instance, based on outagedefinition in [30], it implies that a user is either detected directly or using other two cor-rectly detected links. However the detection scheme used in[30] is not clearly mentioned.Similarly some authors like [32], perform the detection by considering all the receivedsignals jointly, that increases the detection complexity at the receiver. Moreover, [33] hasconsidered a detection scheme based on successive cancelation of users while analyzingthe capacity of network coded MARC. In short, different detection methods are used im-plicitly in previous work and no effort has been made to compare the performance of thesemethods. [33] has also looked into the issue of user groupingat the relay, as network cod-ing at the relay, couples the performance of the combined users with each other. However,analysis is not done in detail and impact of user grouping on link reliability of users isnot considered. Some other works [34–37] determine throughput improvement for variousrelaying structures using network coding. Recently network coding has been considereduseful for saving network resources in a report on green wireless communications [38].
In addition to achieving diversity and throughput gain, network coded packet can alsobe used to correct transmission errors. XOR based combininghas been used at the relay bymany authors, as it is simplest form of network coding. However, XOR based network cod-ing does not exhibit an error correction capability. Moreover, it is not feasible to combinemultiple users at a relay using this technique. Therefore, the concept of distributed channelcodes has been generalized to design joint network-channelcodes in many research works.For instance, [39] has used nested codes for realizing jointnetwork-channel coding in anetwork containing multiple source nodes and a single relay. It has been shown that for agiven throughput the reliability of transmitted signal is better in this case, than consideringnetwork and channel coding separately. Similarly, [40] hasproposed a scheme known asgeneralized-adaptive network coded cooperation (GANCC) for wireless Ad-hoc networks,in order to prove that network coding is a generalization of channel coding. Moreover, [41]has considered the use of distributed turbo codes for the MARC and proved that the jointnetwork-channel coding is better than separate network-channel coding. Similarly it hasbeen illustrated in [42] how low-density parity-check (LDPC) code can be used to designjoint network-channel coding scheme for MARC. Above methods are quite useful in im-proving the bit or block error rate of the users, however requires complex encoding anddecoding methods while combining multiple users. The concept of joint network-channelcoding is also used for two way relay channels as described in[43]. Very recently [44] hasproposed a practical method to combine non-binary channel coding with network codingfor two source two relay topology in wireless network.

1.2. PROBLEM FORMULATION 5
1.2 Problem Formulation
In heavily loaded cellular networks it is not difficult to finddevices that can relay data forother users. However, device-to-device cooperation raises certain concerns. These con-cerns include, battery drainage at fast rate due to helping other users, need of additionalhardware and software than conventional devices, frequentrelay hand-offs due to mobilityof the relaying device and billing issues. These limitations are not present in the case offixed relays. Fixed relays are normally placed at the locations that are good for transmit-ting/recieving signals to/from base stations. In addition, relays have comparatively stablechannel conditions as compared to cooperating terminals, hence the delivered performanceis comparatively more predictable in the former case.
Based on the key findings described in previous section, thisthesis work looks at thelink performance of cellular relaying systems. We focus ourstudy on the uplink and weassume that users have the possibility to cooperate via fixedrelays with the help of networkcoding. This user cooperation provides the base station receiver with some redundancy viadifferent links. How to use these links will impact the performance of the cooperatingusers. For that, the thesis looks at the error probability ofdifferent detection strategies fordifferent positions of the cooperating users within the cell. As the relay has the possibilityto choose the cooperating users, it is important to investigate which users should cooperateand on what basis should they be paired such that the error probability is improved for bothcooperating users.
Cooperation via a fixed relay provides, not only, a diversitybut also increases the signalspace dimension seen at the base station receiver. This augmented signal space [45, 46]can be used to design better multi-level modulation schemesthat can take advantage of thediversity gain as well as the augmented signal space. The question addressed here is, howto find the appropriate signal constellations for the cooperating users and the relay nodein the presence of network coding. Network coding combines the user signals at the relaynode and creates some redundancy that can be used in designing the signal constellationset of each of the three links. When the cooperating users areemploying channel coding,network coding employed at the relay node can be seen as an extra redundancy addedto the user signals. It will be shown, in this thesis, that channel coding in the uplinkof a cellular/relay system with network coding can be seen asa product code with rowsformed by the individual codewords of the users and columns formed by the used networkcoding scheme. This new structure can be used to design good network coding schemesfor cellular/relay systems and open the possibility to use well known decoding algorithmsat the base station receiver. These decoding algorithms arequite efficient as they see thechannel coding of the cooperating users and the network coding scheme as one single code.
1.2.1 Thesis Contributions and Outline
This thesis looks at the performance of cooperative communication in cellular systems.Cooperation is achieved via fixed relays and with network coding combining. The thesisis a mixture of analytical and simulation results. Most of the results obtained in the thesishave been reported (submitted and accepted) in different international conferences and

6 CHAPTER 1. INTRODUCTION
journals. The thesis is presented in six chapters as follows:
Chapter 2
This chapter gives a brief description of cooperative communication in wireless communi-cation with a special emphasis on cooperative relaying in cellular systems. The principleof network coding and its advantages for wireless applications and cooperative communi-cation is described.
Chapter 3
This chapter looks at the link performance, in terms of bit error probability, of the MARCwith network coding. Different detection schemes are considered and their performanceis compared under different link conditions. Analytical expressions for the average biterror probability of the cooperating users are derived. Focusing on the uplink of cellularsystems, we look at the performance of MARC and how to group users in the cooperationprocess. The main results of this chapter have been reportedin
[T.1] Tafzeel ur Rehman Ahsin and Slimane Ben Slimane, “Detection strategies in cooper-ative relaying with network coding,”IEEE PIMRC 2010, Istanbul, Turkey September2010.
[T.2] Jie Xu, Tafzeel ur Rehman Ahsin, Ling Qiu, and Slimane Ben Slimane, “Scheduling,pairing and ordering in the network coded uplink multiuser mimo relay channels,”in proceeding of VTC 2010-Spring Taipei, Taiwan May 2010.
[T.3] Jawad Manssour, Tafzeel ur Rehman Ahsin, Slimane Ben Slimane and Afif Osseiran,“Detection strategies for cooperative network coding: Analysis and performance,”submitted toIEEE Transactions on wireless communications, 2010.
Chapter 4
This chapter considers constellation selection as a way of improving the link performanceof MARC in cellular systems. The idea is, with high-level multi-level modulation, touse a different constellation set for each link of the MARC. This method takes advantageof the redundancy between the transmitted symbols created by network coding and theaugmented signal space obtained at the base station receiver. The obtained results showthat, with a proper selection of the constellation sets, thelink performance of MARC inboth additive white Gaussian noise (AWGN) channels and fading multi-path channels canbe improved. The main results of this chapter have been reported in
[T.4] Tafzeel ur Rehman Ahsin and Slimane Ben Slimane, “Constellation selection in net-work coded distributive antenna systems,”IEEE GLOBCOM 2009, Hawaii, USADec 2009.

1.2. PROBLEM FORMULATION 7
Chapter 5
This chapter considers a new alternative to improve the linkperformance of MARC incellular systems when the cooperative users employ channelcoding. The study is lim-ited to linear block codes where it is shown that the combination of channel coding andnetwork coding in MARC can be seen as a product code. This finding provides us a pos-sibility to use a decoding algorithm at the base station receiver that sees the combinationof user channel coding and network coding as a single code. Asseveral decoding algo-rithms for product codes exist in the literature, joint channel-network decoding can now beachieved for MARC and recovers the performance loss due to separate channel-networkdecoding. The proposed representation also allows the use of more powerful network cod-ing schemes. It also gives the possibility to involve more than two users in the cooperationprocess via each relay simultaneously. Results from this chapter have been reported in
[T.5] Tafzeel ur Rehman Ahsin and Slimane Ben Slimane, “Product coding based networkcoding in cooperative relaying,”IEEE WCNC 2010, Sydney, Australia, April 2010.
[T.6] Tafzeel ur Rehman Ahsin and Slimane Ben Slimane, “Product Coding: A jointchannel-network coding scheme for the multiple access relay channel,” submittedto IEEE Transactions on wireless communications, 2010.
Chapter 6
This chapter gives concluding remarks about the results of the thesis and provides somedirections for future research activities in the area.


Chapter 2
Cooperative Communication in WirelessNetworks
An important challenge in cellular communication nowadaysis to design an energy andcost efficient network that provides high data rate and coverage. One of the main hinder-ance to these objectives is the unreliable nature of wireless channels, caused by inherentchannel fading. Cooperation [16] between the nodes in a cellular network helps in com-bating channel impairments. Relays can take advantage of broadcast nature of wirelesschannels and allow the users to cooperate, by retransmitting their data packets towardsthe base station. Therefore relays break the single hop transmission into multi-hops andhelp in reducing the propagation loss between transmitter and the receiver [10]. More-over, multiple copies of the same information is reached at destination due to relaying.Diversity gain can be achieved by combining these multiple copies at the destination andconsequently, signal reliability on the links can be improved. Using network coding [27]at relays, provide an intelligent way to utilize network resources efficiently. For instance,relay can combine multiple received packets using network coding and send them towardsdestination as a single packet. Therefore cellular relay with network coding has the abilityto improve the system throughput.
This chapter provides necessary background on cellular relaying and its integrationwith network coding. Section 2.1 discusses cooperative cellular relaying while section 2.2describe the advantages of integrating, network coding in cellular relaying.
2.1 Multi-path Fading Channels
The physical medium through which the information signal travels, from transmitter to thereceiver is called communication channel. For instance, telephone line in wired systemand environment between the transmitter and the receiver inwireless system is termed ascommunication channel. Wireless channels are highly unpredictable in nature, both in timeand frequency domain. The distortion experienced by the received signal after propagatingthrough wireless channel is termed as fading. In multi-pathpropagation, the transmitted
9

10 CHAPTER 2. COOPERATIVE COMMUNICATION IN WIRELESS NETWORKS
signal can take several paths to reach the receiver. The signals reaching through differentpaths experience different delays. The superposition of these signals at the receiver canbe constructive or destructive depending upon the delays introduced by each path. Thiscauses variation in received signal strength, frequency and phase at the receiver and thusgive rise to multi-path fading. The multi-path fading can befurther divided into two types,i.e. large scale fading and small scale fading.
Large scale fading represents the variation in the mean of received signal power overthe large distance as compare to the wavelength of the signal. It occurs when receiver isshadowed by large terrain obstacles such as hills or buildings. Large scale fading is oftenexpressed in terms of mean path loss and log-normal distributed variation about the meanfor a given distance between transmitter and the receiver [47]. Log-normal distributionmeans that the logarithm of signal power follows normal distribution.
Small scale fading involves the variation in received signal power over small distances,comparable or less than wavelength of the signal. This occurs due to scatters present inthe channel. These scatters are created due to reflection, diffraction and scattering of radiowaves from various objects and surfaces situated between the transmitter and the receiver.The received signal is the summation of all these scattered signals. This causes fluctuationsin the received signal strength. Let us assume that the bandpass signals(t) is transmittedduring an interval0 ≤ t ≤ T . It can be expressed in terms of its baseband waveformsl(t)as follows
s(t) = ℜ{sl(t)ej2πfct} (2.1)
whereℜ{.} denotes the real part of{.} andfc is the carrier frequency. While travelingthrough multi-path fading environments(t) will be modified by a complex dimensionlessfactorα(t) that takes care of both large and small scale fading. If the antennas remainwithin a limited trajectory, the effect of large scale fading can be considered constant (forinstance, equal to unity) [47]. Assuming that there arei multiple scattering paths, eachhaving time variant propagation delayτi(t) and a time variant multiplicative factorαi(t),the received bandpass signal can be written as follows
y(t) =∑
i
αi(t)s[t − τi(t)] + z(t)
= ℜ([
∑
i
αi(t)e−j2πfcτi(t)sl(t− τi(t))
]
ej2πfct
)
+ z(t) (2.2)
wherez(t) at any instantt denotes additive white Gaussian noise (AWGN) at the receiverwith zero mean and known variance. Main sources of AWGN includes thermal motionof electrons in antenna, shot noise, black body radiation etc. As z(t) is the sum of largenumber of statistically independent random variables hence according to the central limittheorem [47], it is modeled as Gaussian random variable. Moreover, since the two sidedpower spectral density of the noise is considered constant for all the frequencies of interesthence it is termed as white noise. An equivalent received baseband signal can be obtained
2.1. MULTI-PATH FADING CHANNELS 11
by neglecting carrier frequency multiplication factor in (2.2) as follows
yl(t) =∑
i
αi(t)e−j2πfcτi(t)sl(t− τi(t)) + z(t) (2.3)
Sinceyl(t) is the response of an equivalent baseband channel to an equivalent basebandsignalsl(t), the expression for time variant baseband channel impulse responseh(τ ; t) canbe obtained as follows
h(τ ; t) =∑
i
αi(t)e−j2πfcτi(t)δ(τ − τi(t))
=∑
i
hi(t)δ(τ − τi(t)) (2.4)
wherehi(t) is the complex attenuation factor of pathi. It is obvious that if the numberof scattering paths is large and none are dominant, then according to central limit theoremh(τ ; t) can be modeled as zero mean complex valued Gaussian random process and the
received envelope∣
∣
∣h(τ ; t)∣
∣
∣ at any instantt has Rayleigh probability density function (pdf).
Therefore the channel is modeled as Rayleigh fading channelin this case. In the presenceof fixed scatters, in addition to moving scatters theh(τ ; t) cannot be modeled as havingzero mean and hence fading can be modeled as Rician distributed random variable [48].The two important manifestations of small scale fading are the time spreading of the re-ceived signal and the time variation of the channel. Let us look at both one by one asfollows.
a) Time Spreading
Rather simplified approach to model small scale fading is to use the notion of wide-sensestationary uncorrelated scattering (WSSUS), where all thesignals arriving at the receiverwith different delays are considered as uncorrelated [47].For a single transmitted im-pulse the timeTm between the first and last (considering that signal power falls belowsome threshold) received component represents the maximumdelay spread. The coher-ence bandwidthBm is a statistical measure of the range of frequencies over which channeltreats all the spectral components similarly. Therefore the signal components falling out-side the coherence bandwidth will be treated differently bythe channel. In other words,coherence bandwidth is an analogous characterization of signal dispersion in frequencydomain. Time spreading of a signal at the receiver provides us the information aboutfrequency selectivity of the fading channel. For instance,a fading channel is said to befrequency non selective or flat fading if signal bandwidthW is less than coherence band-width of the channel. However, if signal bandwidth is greater than coherence bandwidth,different spectral components will be affected by the channel differently and the channel isknown as frequency selective channel. Small scale fading limits the maximum achievabledata rate since we are limited to chooseW < Bm in order avoid frequency selectivity.Moreover the time dispersion of one transmission due to multi-path components effectsone or more successive output symbols and cause inter symbolinterference (ISI).

12 CHAPTER 2. COOPERATIVE COMMUNICATION IN WIRELESS NETWORKS
Instead of using complex channel equalizers at the receiver, ISI can be mitigated us-ing orthogonal frequency division multiplexing (OFDM). This scheme transforms highdata rate stream into set of parallel low data rate streams, thus providing help against timespreading phenomena in multi-path channels. In OFDM, the input data stream is first mod-ulated in baseband using any modulation scheme. The modulated data stream, with symboldurationTs is then converted toN different data streams. Each stream is modulated bya specific subcarrier waveform and the addition of all the streams results into bandpassOFDM transmitted symbol/block. By proper selection of number of carriersN , the dura-tion of OFDM blockT = NTs can be made larger thanTm in order to reduce the effectof symbol interference. However, OFDM can remove the interference (both inter symboland inter carrier) completely by extending the OFDM block length at the transmitter side,by using a time guard intervalTg > Tm [10]. AssumingL as the number of multi-paths,the received baseband OFDM signal can be written as
yl(t) =L−1∑
i=0
hi(t)sl(t− τi(t)) + z(t) (2.5)
wherehi is as defined in (2.4),sl(t) is the equivalent baseband OFDM transmitted signalin nth block interval and can be written as
sl(t) =
N−1∑
m=0
sm(n)gm(t), nT − Tg ≤ t < (n+ 1)T
=1
√
T + Tg
N−1∑
m=0
sm(n)e2πmT t (2.6)
Heresm(n) is baseband modulated symbol andgm(t) represents the orthogonal subcarrierwaveform. The subcarrier waveforms retain the orthogonality property over the durationof the useful part of the signal, i.e. overT only. The orthogonality property is preservedonly if (Tg ≥ Tm) and the OFDM receiver synchronizes to the first arriving path. Theaddition of the time guard interval in the OFDM system provides a time delay margin forthe subcarrier waveforms for which the orthogonality property is always preserved [10].Hence, by using a time guard interval, inter symbol and intercarrier interference will beabsorbed and the receiver can safely ignore this added guardinterval at the receiver side.The useful part of the received signal during thenth block interval in a slowly varyingfading multi-path channel (fading coefficient can be considered constant during one OFDMblock) can be written as
yl(t) =N−1∑
m=0
H(m/T ; t)sm(n)gm(t), nT ≤ t < (n+ 1)T (2.7)
and
H(m/T ; t) =
L−1∑
i=0
hi(t)e−j2πmT τi(t) (2.8)

2.1. MULTI-PATH FADING CHANNELS 13
represents the transfer function of the fading multi-path channel. After passing through thecorrelation receiver, the output sample of subcarrierk becomes
yk(n) =
∫ (n+1)T
nT
yl(t)g∗kdt
= h(t)sk(n) + zk(n) (2.9)
whereh(t) represents the channel coefficient and can be written as
h(t) =
√
T
T + TgH(k/T ; t).
It can be observed from (2.9) that the output sample is completely free from inter-symbolinterference and inter-carrier interference. However, inthe presence of strong multi-pathcomponents, some carriers could be in deep fades due to destructive combination of thepaths. In crux, with the introduction of the time guard interval in OFDM, it is possibleto transform a frequency selective fading channel intoN parallel frequency nonselective(flat) fading channels.
b) Time Variation of the Channel
Multi-path channel becomes time variant due to the relativemotion between the transmitterand the receiver (or vice versa). This relative motion causes the frequency of the receivedsignal to be shifted relative to that of the transmitted signal. This Doppler shiftfd, is pro-portional to the velocity of the receiver and the frequency of the transmitted signal [48].Since the received signal travels over several reflected paths and each path have differ-ent doppler shift hence multi-path propagation creates spectral or Doppler spreading. Ananalogous characterization of time variant channel in timedomain is coherence timeT0.It is the measure of the expected time duration over which thechannel response remainsessentially invariant [47]. Time variation of the channel results into slow or fast fading onthe channel. For instance if the coherence time of the channel is less than the signal trans-mission timeTs the channel is known as fast fading channel. However, if coherence timeis larger thanTs, the fading is termed as slow fading. Fast fading causes synchronizationrelated issues at the receiver hence more robust modulationscheme that doesn’t requirephase tracking is needed for its mitigation. Another methodto cope with fast fading is touse error correction codes for increasing the symbol rate. In practical wireless commu-nication systems, the channel is usually constant over several symbols and therefore thechannel coefficienth(t) in (2.9) fornth block interval can be written as
h(t) ≃ h(nNTs), nNTs ≤ t < (n+ 1)NTs (2.10)

14 CHAPTER 2. COOPERATIVE COMMUNICATION IN WIRELESS NETWORKS
Figure 2.1: Cooperative Communications
2.2 Cellular/Relay Systems
Once the channels can be modeled as flat fading channels, diversity techniques [10] can beemployed to reduce the effects of fading on the link performance, by transmitting the sameinformation on more than one channel. The gain achieved in terms of SNR is known asdiversity gain. Maximum diversity gain can be obtained whenall the channels are uncor-related and the number of these channels defines the diversity order. Diversity techniquescan be employed along different dimensions, i.e. time, frequency and space. By employingtime and frequency diversity techniques, bandwidth efficiency of the system is reduced asmultiple resources are used for the same information data.
Spacial diversity can be achieved by using multiple antennas [5–8] at transmitter and/orreceiver and allowing the signal to propagate along independent paths. In this case band-width efficiency is not affected, however power is shared between all the transmit anten-nas. Capacity of the system can also be enhanced using spatial multiplexing in this case.So depending upon the application there is tradeoff betweenthe achieved diversity and themultiplexing. However, to achieve spacial diversity, adequate spacing between the anten-nas is needed to ensure independence between different channels. More spacing betweenantennas is required in case of using low frequencies and poor scattering environment.However due to limitation on size, cost and hardware complexity for most of the cellularhandsets and other wireless devices, it is difficult to placemultiple antennas on them. Anefficient and inexpensive method to deal with these limitations is to employ the concept ofcooperative communications introduced in [16].
Cooperative communication takes the advantage of the broadcast nature of wirelesschannel and allows different nodes in the cellular network to share their antennas to builda virtual MIMO system without limitations on size and cost. Figure 2.1 illustrates howcooperative communication between nodes can generate diversity in an interesting way.The figure shows two nodes communicating with the same destination. Each node hassingle antenna and hence cannot generate spatial diversityindividually. However, due tobroadcast nature of the wireless channel it may be possible for one node to hear the otherand forward some version of heard information along with/without its own data. Due to

2.2. CELLULAR/RELAY SYSTEMS 15
the statistically independence of both fading paths, spatial diversity can be generated.These cooperating nodes can be user devices or fixed relays deployed in cellular net-
work. In the former case, user devices cooperate by transmitting each others data inaddition to their own data, known as user cooperation [18, 22]. In the later case, relaycooperate with user and forward its data towards the destination, termed as cooperative re-laying [30, 31, 41]. Both modes of cooperation have the potential to provide gain in termsof coverage and cooperative diversity. However cooperative relaying has more practicalsignificance because dedicated relays are static and have relatively stable channel condi-tions with the destination. Moreover relays can handle complex operations easily withoutconstraints like limited battery life as in case of user equipment. On the other hand, somecomplicating issues like reduction in rate of cooperating user and fairness between thecooperating users need to be addressed while employing usercooperation mode. There-fore, it is encouraged to use relays as cooperating nodes as compared to user terminals asindicated in [49].
After initial investigations on relay channels in [13, 14],this concept has regained in-terest due to the introduction of cooperative communications in [16–18]. The concept ofrelaying is proposed for cellular networks in [50], to balance traffic load among highlyloaded cells and lightly loaded cells. In literature different wireless standards have usedthe concept of in-band and out-of-band relaying for improving the performance and ca-pacity of links [51]. Relays can extend the coverage and eliminate the black spots in thenetwork.
2.2.1 Relaying Protocols
Different relaying protocols are discussed in the literature [18, 22, 49] and can be summa-rized as follows
a) Amplify and Forward (AF)
In this scheme relay acts as repeaters. For instance, duringfirst time slot source transmitsdata towards destination. Relay also listens to the transmission due to broadcast nature ofwireless medium. It amplifies and retransmits the received signal towards the destination.Finally both the direct and relayed signal is combined at thereceiver and diversity gain canbe achieved. The main limitation of this method is that the noise present in the receivedsignal at the relay also gets amplified.
b) Decode and Forward (DF)
In this scheme, relay act as intelligent repeater and decodes the received signal sent by thesource in first time slot. It retransmits the signal towards the destination after re-encodingthe signal in second time slot. DF relaying solves the problem of noise amplificationpresent in AF relaying, however at the expense of more complexity. Moreover, duringdecoding and re-encoding relay introduces errors into re-transmitted signal. The achieveddiversity gain is limited by this error propagation phenomena.

16 CHAPTER 2. COOPERATIVE COMMUNICATION IN WIRELESS NETWORKS
Figure 2.2: Cellular/Relay System
c) Selection Relaying
Selection relaying helps in improving the performance of AFor DF relaying by adaptivelychoosing between the direct transmission path and the relaypath. It implies that if directpath is better, user will retransmit its data during the second time slot. However if relaypath is better then relay forwards the data in second time slot. However, relay need toacknowledge the user about its retransmission if relay pathis better. [24] proposes a schemebased on coded cooperation that can be considered as variation of selection decode-and-forward.
d) Incremental Relaying
This scheme is suitable for high data rate transmission as ittries to avoid the variations ofrepetition coding, performed in above mentioned schemes. Here destination decodes thedirect transmitted signal during first time slot and acknowledges relay if there is any errorin the received message, for instance using cyclic redundancy check. If there is no error,the destination sends a one bit message to source and relay, telling the source to transmitsecond message. Otherwise relay forwards the received datatowards destination in secondtime slot. Then destination combines direct and relayed signal for decoding.
2.3. CELLULAR/RELAY SYSTEMS WITH NETWORK CODING 17
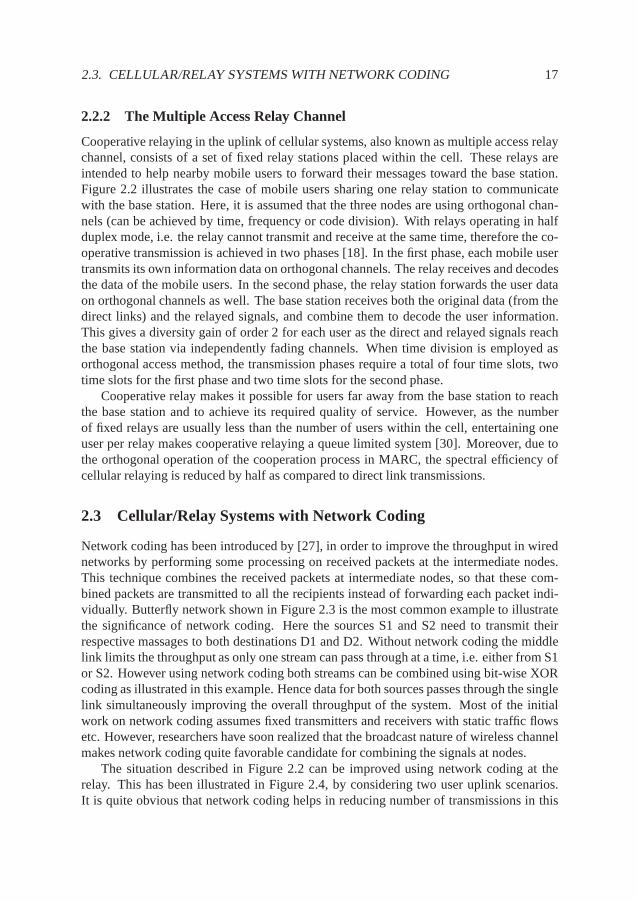
2.2.2 The Multiple Access Relay Channel
Cooperative relaying in the uplink of cellular systems, also known as multiple access relaychannel, consists of a set of fixed relay stations placed within the cell. These relays areintended to help nearby mobile users to forward their messages toward the base station.Figure 2.2 illustrates the case of mobile users sharing one relay station to communicatewith the base station. Here, it is assumed that the three nodes are using orthogonal chan-nels (can be achieved by time, frequency or code division). With relays operating in halfduplex mode, i.e. the relay cannot transmit and receive at the same time, therefore the co-operative transmission is achieved in two phases [18]. In the first phase, each mobile usertransmits its own information data on orthogonal channels.The relay receives and decodesthe data of the mobile users. In the second phase, the relay station forwards the user dataon orthogonal channels as well. The base station receives both the original data (from thedirect links) and the relayed signals, and combine them to decode the user information.This gives a diversity gain of order 2 for each user as the direct and relayed signals reachthe base station via independently fading channels. When time division is employed asorthogonal access method, the transmission phases requirea total of four time slots, twotime slots for the first phase and two time slots for the secondphase.
Cooperative relay makes it possible for users far away from the base station to reachthe base station and to achieve its required quality of service. However, as the numberof fixed relays are usually less than the number of users within the cell, entertaining oneuser per relay makes cooperative relaying a queue limited system [30]. Moreover, due tothe orthogonal operation of the cooperation process in MARC, the spectral efficiency ofcellular relaying is reduced by half as compared to direct link transmissions.
2.3 Cellular/Relay Systems with Network Coding
Network coding has been introduced by [27], in order to improve the throughput in wirednetworks by performing some processing on received packetsat the intermediate nodes.This technique combines the received packets at intermediate nodes, so that these com-bined packets are transmitted to all the recipients insteadof forwarding each packet indi-vidually. Butterfly network shown in Figure 2.3 is the most common example to illustratethe significance of network coding. Here the sources S1 and S2need to transmit theirrespective massages to both destinations D1 and D2. Withoutnetwork coding the middlelink limits the throughput as only one stream can pass through at a time, i.e. either from S1or S2. However using network coding both streams can be combined using bit-wise XORcoding as illustrated in this example. Hence data for both sources passes through the singlelink simultaneously improving the overall throughput of the system. Most of the initialwork on network coding assumes fixed transmitters and receivers with static traffic flowsetc. However, researchers have soon realized that the broadcast nature of wireless channelmakes network coding quite favorable candidate for combining the signals at nodes.
The situation described in Figure 2.2 can be improved using network coding at therelay. This has been illustrated in Figure 2.4, by considering two user uplink scenarios.It is quite obvious that network coding helps in reducing number of transmissions in this

18 CHAPTER 2. COOPERATIVE COMMUNICATION IN WIRELESS NETWORKS
Figure 2.3: Network Coding in Butterfly Network
scenario. For instance, in the first transmission user 1 sends its data towards the basestation. During the second transmission user 2 sends its data towards the base station.These two transmissions are listened by the relay and relay combines the two transmissionsdepending upon the network coding protocol used at the relay. The combined data is thensent towards the base station in the third transmission. Thebase station combines the threereceived signals, i.e. two direct signals and one network coded signal, in order to detectthe two user signals. Since the network coded signal contains information for both users,hence signal for each user reaches the base station via two independent paths.
Consequently, using three transmissions diversity order up to two can be achieved as il-lustrated in [30]. Therefore network coding operation reduces the number of transmissionsby one transmission as compared to the conventional cellular relaying scenario depictedin Figure 2.2. Therefore, throughput in cellular relaying or MARC can be improved byusing network coding. On the other hand, if we fix the allowed number of transmissionsfrom relays to one in case of conventional cellular relaying, it is not possible to achieve fulldiversity gain as both relays have to share the available transmission [41].
Figure 2.4 illustrates the case of two mobile users and one fixed relay. In a more generalcellular network, with a large number of users and multiple relays per cell, the multipleaccess relay channel can be made more reliable. Here, the access scheme is the same. Inthis case, each user still transmits its own information data in the first phase on orthogonalchannels achieved by time-division. However, in the secondphase, a singlebest relay isselected from the multiple relay candidates within the cellto forward the network codeddata of the cooperating users to the base station. The best relay is the one that maximizesthe worst instantaneous channel conditions of the links from users to the relay and fromthe relay to the base station. This opportunistic relay selection improves the link reliabilityof the cooperating users within MARC and reduces error propagation at the relay node.
Different network coding protocols have been described andstudied in the literature.

2.3. CELLULAR/RELAY SYSTEMS WITH NETWORK CODING 19
Figure 2.4: Cellular/Relay System with Network Coding
These network coding protocols can be classified as digital network coding and analognetwork coding (or physical network coding).
2.3.1 Digital Network Coding
Digital network coding at the relay is performed at the packet level. Packets received fromthe cooperating users are first decoded and combined using bitwise XOR operation or us-ing any other combining method. This implies that the used relays need to have decodingcapability, so that they can decode the signal sent by users and combine these signals usingnetwork coding operation. Therefore, decode-and-forwardrelays are required to performdigital network coding at the relay node. The main advantageof this method is the useof orthogonal access methods. This does not allow user transmissions to interfere witheach other. It also gives the possibility of interaction, between channel coding used bythe cooperating users and network coding. This interactionopens the door for designingefficient network coding schemes and efficient decoding algorithms at the base station re-ceiver. However, as mentioned earlier, digital network coding requires three transmissionsas compared to two transmissions for the non-cooperating case.
2.3.2 Analog Network Coding
Analog network coding or physical-layer network coding at relay is done on signal level.This scheme allows mobile users to transmit at the same time in the first phase, and somesmart physical layer techniques transform the superposition of the electromagnetic wavesinto an equivalent network coding operation that mixes the user signals in the air. It implies

20 CHAPTER 2. COOPERATIVE COMMUNICATION IN WIRELESS NETWORKS
that instead of performing bitwise XOR operation as in case of digital network coding, thisprotocol allows to interfere two analog transmissions sentby users simultaneously. Here,network coding is created on the electromagnetic waves in the air rather than in baseband(at the bit level). Depending upon the relaying protocol (AFor DF) used at the relaystation, the combined signal is sent to base station in second transmission slot. Therefore,with the dime-division multiple access, this network coding protocol requires only twotransmission slots as compared to three time slots in the case of digital network coding.
When a DF relay is used, the simultaneously received signalsare mapped into a newsignal recognizable by base station, through a mapping thatcombines the two mapping ofthe different symbols of the users as described in [52, 53]. This mapping represents thejoint symbols of the two combined signals and does not mean that each user is decodedseparately. This method has the advantage of preventing noise amplification at the relaynode but it has the obvious drawback of error propagation andthe ambiguity between sym-bols especially for high-level modulation. It also requires perfect synchronization betweenthe user signal which is quite difficult to achieve especially in fading multi-path channels.
When an AF relay is used, then it simply amplifies the simultaneously received signalsand forwards the data towards base station. This method is attractive due to its simplic-ity and does not require synchronization between the cooperating user signals. However,the inherent drawback of this scheme appears in possible noise amplification due to theamplification of the received at the AF relays.
In general, there is a tradeoff between required number of transmissions and generatedinterference while using different network coding protocols at relay.
2.4 Summary
In this chapter we have discussed how cooperative communication can be realized usingrelays. The importance of network coding in multiple accessrelay channels is highlighted.It is obvious that network coding is helpful in saving network resources in cellular relayingsystems. Therefore, we choose network coded MARC as our system model in the rest ofthis monograph and investigate the link performance in suchscenarios. Special emphasisis given on analyzing different factors that can make links more reliable. In this regard, therole of network coding scheme at the relay, choice of detection scheme at the receiver andaugmented signal formed at the receiver have great importance.

Chapter 3
Link Performance of MARC
This chapter is mainly targeted to evaluate the error performance of users in network codedcooperative relaying scenarios. Different factors influencing the evaluation are discussedin detail. Both analytical and simulation approach is used for this purpose.
Outline of the chapter is as follows: Section 3.1 describes the system model usedthroughout the chapter. Section 3.2 illustrates differentdetection schemes used at the re-ceiver. The performance and complexity of these schemes arediscussed in section 3.3 andsection 3.4 respectively. Section 3.5 describes how user grouping at the relay, affects theerror performance of users. Finally section 3.6 provides the summary of results.
3.1 System Model
Figure 3.1 illustrates the system model used in our analysis. The figure describes the gen-eral structure for transmitters at each node and the common receiver in an uplink scenario.Dashed lines refer to wireless transmission of data. The effects of channel fading (smallscale) and noise are excluded from the figure for clarity, however they are part of the analy-sis. Since orthogonal frequency division multiplexing divides a broadband signal into lowrate narrow band signals and uses time guard band to enable each subcarrier to experienceflat fading instead of frequency selective fading, therefore we can safely model our chan-nel as flat Rayleigh fading channel in the absence of strong line of sight (LOS) component.Moreover, fading coefficient is assumed to be constant during each symbol transmission.As the receiver structure depends upon detection scheme, hence it is shown separatelyfor each detection method while discussing the detection schemes. In Figure 3.1, the re-ceiver is shown as a black box. Different operations such as modulation, demodulationand network coding have been illustrated by MOD, DEMOD and NCblocks respectivelyin Figure 3.1. In some cases network decoding and demodulation in done in separate stepsat the receiver, hence network decoding (ND) block at the receiver, is used to represent thecorersponding operation.
Transmission is performed in three time slots. In the first two time slots, each usertransmits its own symbol/bit towards the base station. Relay also listen to these transmis-
21

22 CHAPTER 3. LINK PERFORMANCE OF MARC
Figure 3.1: Transmission Scheme for Network Coded Cooperative Relaying
sions. It decodes the received signals from users and combines these signals using bitwiseXOR operation. In the third time slot, relay transmits the network coded symbol/bit to-wards the base station. In Figure 3.1(m1,m2) denotes the set of transmitted symbols/bitsby users, while(m1, m2) is the set of detected symbols/bits at the destination.m3 repre-sents the network coded symbol/bit transmitted by the relay.
In order to simplify the model further, it is assumed that users are close to relay station.Hence the link between each user and relay station is assumedto be error free. This israther an optimistic assumption, however it can be considered that the relay can decide byitself about the correctness of decoded data and refrain from transmitting the data to thebase station in case of errors. Similar assumption is considered in [41,42] as well.
Now using Raleigh fading channel for each link, the receivedsignal sample for linkiat the base station can be written as follows
yi = hisi + zi, i = 1, 2, 3 (3.1)
wheresi is the transmitted symbol on linki with E{|si|2} = Ei andyi is the receivedsignal sample.E{.} denotes the expected or average value of{.} andEi is the averageenergy per transmitted symbol at linki. The coefficienthi denotes the complex multiplica-tive channel gain as defined in (2.9). The channel gainhi is assumed to be constant duringeach symbol interval. The samplezi is the complex Gaussian noise experienced by linki during the symbol interval, at the base station with double sided power spectral densityN0/2.
As network coding combines multiple packets and receiver makes the decision on thebasis of all the received packets, hence signal reliabilityon the links is coupled togetherwith each other. Thus an analytical frame work is quite helpful in predicting the errorperformance of cooperating nodes, for different SNR combinations on links. Since morethan one link is involved in the detection, it provides us an opportunity to combine links indifferent ways.

3.2. PERFORMANCE OF DIFFERENT DETECTION SCHEMES 23
Figure 3.2: Receiver structure for Joint Detection Scheme
3.2 Performance of Different Detection Schemes
This section looks at the performance of different detection methods for two user up-link scenario. These methods include joint detection, selection-and-soft combining andselection-and-hard combining. Closed form expressions for the bit error probability arederived for each detection scheme as well.
3.2.1 Joint Detection
Joint detection based on the maximum likelihood (ML) criterion, is an optimal methodused for detection. It takes into account all the three received signals simultaneously inorder to make decision about the messages sent by both users as shown in Figure 3.2. Forinstance, assuming ideal channel state information (CSI) at the base station receiver, thereceiver computes the metric using the received samples in (3.1), as follows
C(m1, m2) = |y1 − h1s1|2 + |y2 − h2s2|2 + |y3 − h3s3|2 . (3.2)
wheresi is the estimate of the symbolsi. The receiver chooses the set of symbols that haveminimum metric and declares them as transmitted symbols of user 1 & 2. Assuming uncor-related links and for a given fading channel observationh = {h1, h2, h3}, the conditionalpairwise error probability can be written as
P2(s→ s |h) = Q
√
∑3i=1 Γiδi
2
. (3.3)
Here we define
δi =|si − si|2
Ei, and Γi =
|hi|2 EiN0
.
For a normalized Rayleigh fading channel the probability density function (pdf) and cumu-lative density function (cdf) of the instantaneous received SNRΓi on link i can be written

24 CHAPTER 3. LINK PERFORMANCE OF MARC
as
fi(γ) =1
γie− γγi , γ ≥ 0,
Fi(γ) = 1− e−γγi . (3.4)
respectively, where
γi = E{Γi} =2σ2EiN0
is the average received SNR on linki andσ2 is the variance of real and imaginary partof the complex channel coefficienthi. The pairwise error probability can be obtained byaveraging (3.3) over the fading pdfs in (3.4). It can happen that wrong detection at thereceiver results into errors in all the three symbols, then the pairwise error probability canbe written as follows
P2(s→ s) =1−
√
γ1
γ1+4/δ1
2(
γ2δ2γ1δ1− 1)(
γ3δ3γ1δ1− 1)
+1−
√
γ2
γ2+4/δ2
2(
γ1δ1γ2δ2− 1)(
γ3δ3γ2δ2− 1) +
1−√
γ3
γ3+4/δ3
2(
γ1δ1γ3δ3− 1)(
γ2δ2γ3δ3− 1) . (3.5)
It is also possible that only two of the three symbols are wrongly detected. For instance,considering that the relay symbol is correctly detected then the pairwise error probabilityin (3.5) reduces to
P2(s→ s) =γ1δ1
(
1−√
γ1
γ1+4/δ1
)
− γ2δ2
(
1−√
γ2
γ2+4/δ2
)
2 (γ1δ1 − γ2δ2)(3.6)
Similarly, if there is an error in symbols for the relay and user k, the expression for thepairwise error probability can be written as follows
P2(s→ s) =γkδk
(
1−√
γkγk+4/δk
)
− γ3δ3
(
1−√
γ3
γ3+4/δ3
)
2 (γkδk − γ3δ3)(3.7)
The pairwise error probability expressions from (3.5) to (3.7), represent general cases whenthere is error in two or more symbols.
Considering the user symbols,sj andsk as two random variables, the pairwise errorprobability for symbol/userk can be calculated by averagingP2(s → s) over all possiblevalues of other symbol/userj as follows
P(k)2 (s→ s) =
1
M
∑
sj ,sj
P2(s→ s), for sk 6= sk (3.8)
3.2. PERFORMANCE OF DIFFERENT DETECTION SCHEMES 25
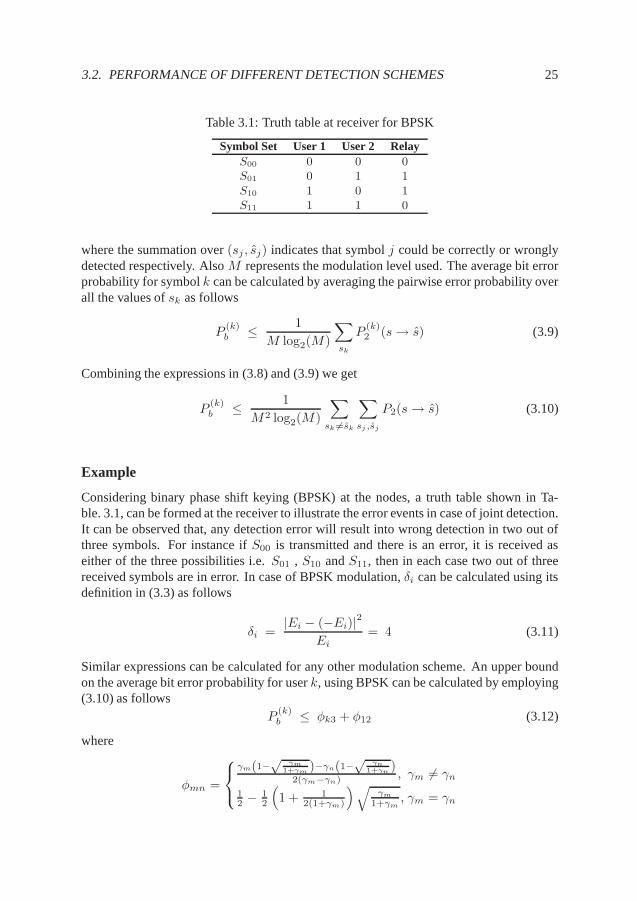
Table 3.1: Truth table at receiver for BPSK
Symbol Set User 1 User 2 RelayS00 0 0 0
S01 0 1 1
S10 1 0 1
S11 1 1 0
where the summation over(sj , sj) indicates that symbolj could be correctly or wronglydetected respectively. AlsoM represents the modulation level used. The average bit errorprobability for symbolk can be calculated by averaging the pairwise error probability overall the values ofsk as follows
P(k)b ≤ 1
M log2(M)
∑
sk
P(k)2 (s→ s) (3.9)
Combining the expressions in (3.8) and (3.9) we get
P(k)b ≤ 1
M2 log2(M)
∑
sk 6=sk
∑
sj ,sj
P2(s→ s) (3.10)
Example
Considering binary phase shift keying (BPSK) at the nodes, atruth table shown in Ta-ble. 3.1, can be formed at the receiver to illustrate the error events in case of joint detection.It can be observed that, any detection error will result intowrong detection in two out ofthree symbols. For instance ifS00 is transmitted and there is an error, it is received aseither of the three possibilities i.e.S01 , S10 andS11, then in each case two out of threereceived symbols are in error. In case of BPSK modulation,δi can be calculated using itsdefinition in (3.3) as follows
δi =|Ei − (−Ei)|2
Ei= 4 (3.11)
Similar expressions can be calculated for any other modulation scheme. An upper boundon the average bit error probability for userk, using BPSK can be calculated by employing(3.10) as follows
P(k)b ≤ φk3 + φ12 (3.12)
where
φmn =
γm(1−√
γm1+γm
)−γn(1−√
γn1+γn
)2(γm−γn) , γm 6= γn
12 − 1
2
(
1 + 12(1+γm)
)√
γm1+γm
, γm = γn

26 CHAPTER 3. LINK PERFORMANCE OF MARC
0 5 10 15 20 25 30 3510
−5
10−4
10−3
10−2
10−1
100
γ1 , γ2 (in dB)
Ave
rage
Bit
Err
or P
roba
bilit
y
Case 1 (user 1, 2)Case 2 (user 1, 2)Simulation Results
Direct Path
Figure 3.3: Tightness of bounds in case of joint detection. Average bit error probability ofthe users as a function ofγ1 in Rayleigh fading channels. Case 1:γ1 = γ2 = γ3, Case 2:γ3
= 20 dB,γ2 = γ1.
It is observed from (3.12) that the performance of each user is affected by all the three linksin the network coded cooperative relaying scenario. Using Chernoff bound to approximateQ function in (3.3), the upper bound on average bit error probability at high SNR can becalculated as
P(k)b ≤ 1
2 (1 + γk) (1 + γ3)+
1
2 (1 + γ1) (1 + γ2)(3.13)
showing that a diversity gain of order 2 can be achieved whichis consistent with the resultsin [30]. It is also observed that if one of the links fail (i.e.γi 7→ 0) the order of this diversitygain reduces to one.
Now let us analyze the tightness of our analytical expressions by comparing it withthe simulation results. Figure 3.3 illustrates the averagebit error probability of the usersover Rayleigh fading channels. Two different combinationsof SNRs at the nodes, areconsidered as an example. For simplicity, the same average received SNR is assumed forboth users in each case. This corresponds to the same averagebit error probability for theusers. It is also obvious from Figure 3.3 that the analyticalupper bound calculated by using(3.12), fits with the simulation results quite well and a diversity gain of order two can beachieved. Therefore these expressions can be safely used toassess the performance of thejoint detection scheme, eliminating the need for performing computer simulations.
3.2.2 Selection and Soft Combining
The receiver structure for selection and soft combining (SSC) is illustrated in Figure 3.4.Here we have to classify users based on their instantaneous channel conditions. For in-

3.2. PERFORMANCE OF DIFFERENT DETECTION SCHEMES 27
Figure 3.4: Receiver structure for SSC Scheme, assumingU1 is the strongest user
stance, user having better SNR is termed as strong user, while the other is considered asweak user. In the first step, the strong user is detected usingthe direct link. In the secondstep, the weak user is detected using its direct link and the relay signal, based on the knowl-edge of the detected strong symbol. For instance, the receiver detects the strong symbolssusing the following metric
C1(ms) = |ys − hsss|2 (3.14)
where
ys =
{
y1, if Γ1 > Γ2
y2, if Γ2 ≥ Γ1.
Here ss represents all the different possibilities for detected strong symbol. Therefore,based on the decision made by the receiver, the detected strong symbol is represented byss. With the knowledge ofss, detected in (3.14), the weak symbolsw is detected based onminimizing the following metric
C2(mw) = |yw − hw sw|2 + |y3 − h3s3|2
= |yw − hw sw|2 + |y3 − h3 (ss ⊕ sw)|2 (3.15)
where
yw =
{
y1, if Γ1 ≤ Γ2
y2, if Γ2 < Γ1.
We notice from the expressions of the two metrics,C1(ms) andC2(mw), that the stronguser takes advantage of the good link quality while the weak user takes advantage of di-versity obtained from relay and direct link. Since userk can be strong or weak user, hencedenoting the error probability of the strong user byPstrongand representing the error prob-ability of the weak user byPweak, the pairwise error probability of userk can be written as
28 CHAPTER 3. LINK PERFORMANCE OF MARC
follows:
P(k)2 (s→ s) = αkPstrong+ (1 − αk)Pweak, k = 1, 2 (3.16)
where
α1 = Pr (Γ1 > Γ2) (3.17)
α2 = 1− α1 = Pr (Γ2 ≥ Γ1) (3.18)
The conditional error event probability for the strong usercan be written as follows:
Pstrong{E |Γmax } = Q
(√
Γmaxδs2
)
(3.19)
where
Γmax = max {Γ1,Γ2} , and δs =|ss − ss|2
Es.
In case of Rayleigh fading channels with uncorrelated channel coefficients, the pdf forΓmax, can be written as follows [54]
fmax(γ) = f1(γ)F2(γ) + f2(γ)F1(γ), (3.20)
wheref1(γ), f2(γ), F1(γ) andF2(γ) are as defined in (3.4). The error event probabilityof the strong user can therefore be obtained by averaging theexpression in (3.19) over thepdf in (3.20) and is written as
P strong =1
2
(
1−√
γ1
4/δs + γ1−√
γ2
4/δs + γ2+
√
γ1γ2δ2s
4γ1δs + 4γ2δs + γ1γ2δ2s
)
.
(3.21)
Using ss, the estimated symbol of the strong user, the conditional error event probabilityfor the weak user can be written as
P weak{E |Γmin,Γ3 } = Q
Γminδw + Γ3
E3
(
|s3 − ss ⊕ sw|2 − |s3 − ss ⊕ sw|2)
√
2(
Γminδw + Γ3
E3|ss ⊕ sw − ss ⊕ sw|2
)
(3.22)
where
Γmin = min {Γ1,Γ2} , and δw =|sw − sw|2
Ew.

3.2. PERFORMANCE OF DIFFERENT DETECTION SCHEMES 29
In above expressions3 = ss ⊕ sw, andsw is the estimate of the symbolsw. Assuminguncorrelated Rayleigh fading channels the pdf [54] forΓmin can be written as follows
fmin(γ) = f1(γ)(1 − F2(γ)) + f2(γ)(1− F1(γ)), (3.23)
wheref1(γ), f2(γ),F1(γ) andF2(γ) are as defined in (3.4). We notice from the expressionin (3.22) that the error in the first stage(i.e. error inss) will deteriorate the error probabilityof the weak user. In fact we notice that the error propagationcan make the argumentof theQ-function negative, resulting in an error probability larger than 0.5 for the weakuser. Averaging (3.22) over the corresponding probabilitydensity functions, the error eventprobability for the weak user can be written as follows
P weak =
≤ 1, EP
γeδw(
1−√
γe4/δw+γe
)
−γ3δ3
(
1−√
γ3
4/δ3+γ3
)
2(γeδw−γ3δ3), No EP
(3.24)
where
δ3 =|s3 − ss ⊕ sw|2
E3, and γe =
γ1γ2
γ1 + γ2.
and EP stands for error propagation. SincePweak depends upon the error propagationfrom strong symbol, hence the pairwise error probability ofuserk given in (3.16) can bemodified using (3.24) as follows:
P(k)2 (s→ s) ≤ αkP strong+ (1− αk) [(1− P strong)
×
γeδw
(
1−√
γe4/δw+γe
)
− γ3δ3
(
1−√
γ3
4/δ3+γ3
)
2(
γeδw − γ3δ3
)
+ P strong
. (3.25)
It means thatPweak in (3.16) is replaced by two terms, i.e. first indicating no error prop-agation and second taking care of error propagation from strong symbol. When userk isweak and there exist an error propagation from strong user,P weak is expected to be quitehigh and therefore it can be approximated asP weak ≈ 1 in error propagation term. Thisapproximation makes (3.25) quite accurate especially at low average SNR values. How-ever, at high SNR valuesP strongwill have very small value and thus it cancels out the effectof P weak≈ 1 in the error propagation term . This makes the expression of pairwise errorprobability in (3.25) accurate at high average SNR values. Since each user is detected sep-arately (as opposed to joint detection) hence the average bit error probability of userk canbe obtained from its pairwise error probability as
P(k)b ≤
1
M log2(M)
∑
sk
∑
sk 6=sk
P(k)2 (s→ s) (3.26)

30 CHAPTER 3. LINK PERFORMANCE OF MARC
0 5 10 15 20 25 30 3510
−5
10−4
10−3
10−2
10−1
100
γ1 , γ2 (in dB)
Ave
rage
Bit
Err
or P
roba
bilit
y
Case 1 (user 1, 2)Case 2 (user 1, 2)Simulation Results
Direct Path
Figure 3.5: Tightness of bounds in case of selection and softcombining. Average biterror probability of the users as a function ofγ1 in Rayleigh fading channels. Case 1:γ1 = γ2 = γ3, Case 2:γ3 = 20 dB, γ2 = γ1.
Example
An upper bound on average bit error probability for userk derived in (3.26), can be ob-tained by averaging the pairwise error probability in (3.25) for all sk using BPSK and isgiven as
P(k)b ≤ γk
γ1 + γ2ψ +
(
1− γkγ1 + γ2
)
[(1− ψ)
×
γe
(
1−√
γe1+γe
)
− γ3
(
1−√
γ3
1+γ3
)
2 (γe − γ3)
+ ψ
(3.27)
where
ψ =1
2
(
1−√
γ1
1 + γ1−√
γ2
1 + γ2+
√
γ1γ2
γ1 + γ2 + γ1γ2
)
(3.28)
Figure 3.5 shows the tightness of analytical upper bound calculated in (3.27), by comparingit with the simulation results for bit error probability of the users using selection and softcombining. A similar behavior to that of joint detection is observed, i.e. the analyticalupper bound fits with the simulation results very well for this detection scheme.

3.2. PERFORMANCE OF DIFFERENT DETECTION SCHEMES 31
Figure 3.6: Receiver structure for SHC, assumingU1 is the strongest user
3.2.3 Selection and Hard Combining
Receiver structure for selection and hard combining (SHC) is illustrated in Figure 3.6. Inthe first step, two links having the strongest SNR are detected directly. Then these hardvalues are used to detect the symbols of both users. For instance, the symbol for the firststrongest linkss is detected based on the minimization of the following metric,
Cs(ms) = |ys − hsss|2 (3.29)
where
ys =
y1, if Γ1 ≥ Γ2 ≥ Γ3 or Γ1 ≥ Γ3 ≥ Γ2
y2, if Γ2 ≥ Γ1 ≥ Γ3 or Γ2 ≥ Γ3 ≥ Γ1
y3, if Γ3 ≥ Γ1 ≥ Γ2 or Γ3 ≥ Γ2 ≥ Γ1
It is clear that the obtained symbolss is an estimate of any of the symbolss1, s2, ors3 ≡ s1⊕s2 depending on the status of the links. Now the symbol for the second strongestlink sm is detected at the receiver using the following metric:
Cm(mm) = |ym − hmsm|2 (3.30)
where
ym =
y1, if Γ2 ≤ Γ1 ≤ Γ3 or Γ3 ≤ Γ1 ≤ Γ2
y2, if Γ1 ≤ Γ2 ≤ Γ3 or Γ3 ≤ Γ2 ≤ Γ1
y3, if Γ1 ≤ Γ3 ≤ Γ2 or Γ2 ≤ Γ3 ≤ Γ1
and again the detected symbolsm is an estimate of any of the symbolss1, s2 or s3. Us-ing the two obtained symbols{ss, sm}, the user symbols{s1, s2}, can be obtained eitherdirectly if relay link is the weakest link or via network decoding (ND) if the relay link isthe strongest or the second strongest. This implies that if both users have stronger links

32 CHAPTER 3. LINK PERFORMANCE OF MARC
than the relay link, the detected symbols for the users are considered correct in this case.Otherwise the weakest user symbol is decoded based on symbols detected for the strongeruser and the relayed signal. Hence XOR based network decoding is performed using thesignals of the strong user and the relay for obtaining the symbols of the weakest user. Thisdetection scheme has lower complexity than the other two detection schemes as it alwaysignores the weakest link during the detection.
Based on the above methodology, each link posses one of the three possible SNR states.The three states can be defined as strongest, middle and weakest, based on their instanta-neous SNRs. Let us proceed now with the derivation of the error probability for the usersin this case. Here we assumePstrong, as the error probability when userk has strongestlink, Pmid as the error probability when userk has second strongest or middle link andPweak as the error probability when userk has weakest link. The pairwise error probabilityof userk can be written as follows:
P(k)2 (s→ s) = αkPstrong + βkPmid + (1− αk − βk)Pweak, (3.31)
whereαk is the probability that userk is the strongest andβk is the probability that userkis the second strongest. For user1 we have
α1 = Pr {Γ1 > Γ2 > Γ3}+ Pr {Γ1 > Γ3 > Γ2}
=γ2
1γ2 (γ1 + γ3) + γ21γ3 (γ1 + γ2)
(γ1γ2 + γ2γ3 + γ3γ1) (γ1 + γ2) (γ1 + γ3)
(3.32)
and
β1 = Pr {Γ2 > Γ1 > Γ3}+ Pr {Γ3 > Γ1 > Γ2}
=γ2
2γ1 (γ1 + γ3) + γ23γ1 (γ1 + γ2)
(γ1γ2 + γ2γ3 + γ3γ1) (γ1 + γ2) (γ1 + γ3).
(3.33)
A simple replacement of subscripts from 1 to 2 and vice versa in (3.32) and (3.33) will giveα2 andβ2 for user 2. Moreover,Pstrong can be obtained as follows
Pstrong =
∫ +∞
0
Q
(√
Γsδs2
)
fstrong(γ)dγ, (3.34)
where
Γs =|hs|2 EsN0
, and δs =|ss − ss|2
Es.
Considering uncorrelated Rayleigh fading channels, the pdf for Γs [54] can be written asfollows
fstrong(γ) = f1(γ)F2(γ)F3(γ) + f2(γ)F1(γ)F3(γ)
+ f3(γ)F1(γ)F2(γ), γ ≥ 0 (3.35)

3.2. PERFORMANCE OF DIFFERENT DETECTION SCHEMES 33
wheref1(γ), f2(γ), f3(γ), F1(γ), F2(γ) andF3(γ) are as defined in (3.4). SimilarlyPmid
can be obtained as follows
Pmid =
∫ +∞
0
Q
(√
Γmδm2
)
fmid(γ)dγ, (3.36)
where
Γm =|hm|2 Em
N0, and δm =
|sm − sm|2Em
.
Considering uncorrelated Rayleigh fading channels, the pdf for Γm [54] can be written asfollows
fmid(γ) = f1(γ)[F2(γ) (1− F3(γ)) + F3(γ) (1− F2(γ))]
+ f2(γ)[F1(γ) (1− F3(γ)) + F3(γ) (1− F1(γ))]
+ f3(γ)[F1(γ) (1− F2(γ)) + F2(γ) (1− F1(γ))], γ ≥ 0. (3.37)
Using the expressions in (3.35) and (3.37) in (3.34) and (3.36) respectively, and simplifyingwe get
Pstrong =1
2
(
1−3∑
k=1
√
γkγk + 4/δ2
s
+
√
γ12
γ12 + 4/δ2s
+
√
γ13
γ13 + 4/δ2s
+
√
γ23
γ23 + 4/δ2s
−√
γ123
γ123 + 4/δ2s
)
, (3.38)
Pmid =1
2
(
1−√
γ12
γ12 + 4/δ2m
−√
γ13
γ13 + 4/δ2m
−√
γ23
γ23 + 4/δ2m
+ 2
√
γ123
γ123 + 4/δ2m
)
, (3.39)
where
γik =γiγkγi + γk
, γijk =γiγjγk
γiγj + γiγk + γjγk.
When the link is the weakest, an error will occur if and only ifan error has occurred in thestrongest or second strongest symbol. Hence, the error probability of the weakest link canbe written as follows:
Pweak = 1− (1− Pstrong) (1− Pmid)− 1
(M − 1)Pstrong × Pmid
= Pstrong + Pmid −(
1 +1
(M − 1)
)
Pstrong × Pmid (3.40)

34 CHAPTER 3. LINK PERFORMANCE OF MARC
0 5 10 15 20 25 30 3510
−5
10−4
10−3
10−2
10−1
100
γ1 , γ2 (in dB)
Ave
rage
Bit
Err
or P
roba
bilit
y
Case 1 (user 1, 2)Case 2 (user 1, 2)Simulation Results
Direct Path
Figure 3.7: Tightness of bounds in case of selection and hardcombining. Average biterror probability of the users as a function ofγ1 in Rayleigh fading channels. Case 1:γ1 = γ2 = γ3, Case 2:γ3 = 20 dB, γ2 = γ1.
where the third term in the first line represents the case whenboth the strongest and thesecond strongest links are wrong but results into a correct decision after network decoding.With the expression ofPweak, the pairwise error probability can be rewritten as
P(k)2 (s→ s) = αkPstrong + βkPmid + (1− αk − βk) (Pstrong + Pmid
−(
1 +1
(M − 1)
)
Pstrong × Pmid
)
= (1− βk)Pstrong + (1− αk)Pmid
− (1− αk − βk)(
1 +1
(M − 1)
)
Pstrong × Pmid (3.41)
Example
Considering BPSK, an upper bound on average bit error probability for user k can beobtained by averaging the pairwise error probability in (3.41) for all sk using (3.26) asfollows as follows:
P(k)b ≤ (1− βk)ψ1 + (1− αk)ψ2 − 2 (1− αk − βk)ψ1ψ2 (3.42)

3.3. PERFORMANCE COMPARISON 35
0 5 10 15 20 25 3010
−6
10−5
10−4
10−3
10−2
10−1
100
γ1 = γ2, (in dB)
Ave
rage
Bit
Err
or P
roba
bilit
y
JDSSCSHC
γ3=20
γ3=10
Figure 3.8: Average bit error probability for JD, SSC and SHCas a function ofγ1 whereγ1 = γ2, usingγ3 = 10 dB andγ3 = 20 dB in case of BPSK
where
ψ1 =1
2
(
1−3∑
k=1
√
γkγk + 1
+
√
γ12
γ12 + 1+
√
γ13
γ13 + 1+
√
γ23
γ23 + 1
−√
γ123
γ123 + 1
)
(3.43)
and
ψ2 =1
2
(
1−√
γ12
γ12 + 1−√
γ13
γ13 + 1−√
γ23
γ23 + 1+ 2
√
γ123
γ123 + 1
)
. (3.44)
Figure 3.7 illustrates the performance of this detection scheme for the two cases as consid-ered earlier using analytical expression in (3.42) and the simulation approach. A behaviorsimilar to other detection schemes is observed here as well i.e. the analytical upper boundsfits with the simulation results quite well and a diversity gain of order 2 is obtained.
3.3 Performance Comparison
The analytical expressions derived in (3.12), (3.27) and (3.42) for each detection schemerespectively, are used to compare the performance of different detection schemes underdifferent SNR conditions on the links as shown in Figure 3.8.Here BPSK is assumed atthe nodes and the average bit error probability (BEP) of the users is plotted. The trend ofthe curves is similar for all detection schemes at differentvalues ofγ3, with joint detection

36 CHAPTER 3. LINK PERFORMANCE OF MARC
0 5 10 15 20 25 3010
−5
10−4
10−3
10−2
10−1
100
γ1 = γ2, at (γ3 = 20 dB)
Ave
rage
Sym
bol E
rror
Pro
babi
lity
JDSSCSHC
Figure 3.9: Average symbol error probability for JD, SSC andSHC as a function ofγ1
whereγ1 = γ2, usingγ3 = 20 dB in case of 8PSK
(JD) slightly outperforming (maximum 2 dB), the two low complexity schemes. This is dueto the fact that joint detection exploits the redundancy provided by the relay in a better wayand uses it for both users. However the other two schemes i.e.SSC and SHC utilizes theredundancy only for the weak user. Moreover, there is the phenomena of error propagationfrom strong to weak user in latter case, as wrong detection ofstrong user can influence thedetection of the weak user. It can be observed that at high SNRvalues, especially thosegreater than relay SNR, the curves for the JD and SSC starts tocome closer to each otherand eventually coincides with each other. The reason is quite obvious, when the users havebetter SNR than relay link, the significance of relay signal for joint detection graduallyreduces. Similarly for SSC, the error propagation phenomena from strong to weak useralso starts to vanish at these SNR values. This makes the curve coincide with each othereventually. On the other hand, SHC does not use the information provided by the weakestlink, hence slight degradation in its performance can be observed as compared to the othertwo schemes when the SNR of the both users is better than the relay SNR.
Let us compare the performance of these detection methods using higher level mod-ulation schemes. For instance, assuming that 8 PSK is used atthe nodes, the curves foraverage symbol error probability using simulation approach are illustrated in Figure 3.9,under the same SNR conditions, as that of BPSK. It is interesting to note that by using8 PSK the performance difference between the low complexityschemes and the joint de-tection is almost same as in case of BPSK. Given that the performance reduction for lowcomplexity detection schemes remains in acceptable limits, these schemes become moreuseful for higher modulation levels, since the reduction indetection complexity becomesmore prominent in case of higher level modulation schemes asillustrated in next section.

3.4. DETECTION COMPLEXITY 37
Table 3.2: Complexity comparison for the detection schemes
Detection Schemes Required Operations 8 PSK 16 QAM 64 QAM
JD 3× 22k
192 768 12288
SSC 3× 2k
24 48 192
SHC 2× 2k
16 32 128
3.4 Detection Complexity
Although joint detection is an optimal method for detection, the number of comparisonsrequired at the receiver, when multilevel modulation schemes are employed grows expo-nentially, with the number of combined users/symbols in this case. This increases thedetection complexity and consequently results in more power consumption at the receiver.Therefore, the detection schemes providing reduced complexity have great significance forthe mobile devices as they have limited battery life.
The complexity of different detection schemes can be compared in different ways. Themost obvious method is to calculate the number of comparisons required at the receiver ineach case. For instance, it can be easily verified that the number of comparisons requiredfor joint detection increases byM2 as compared to2M in the case of SSC and SHC,whereM = 2k is the modulation level andk is the number of bits per symbol. Therefore,it can be concluded that, for higher level modulation schemes, the detection complexity isreduced from exponential to linear by using low complexity detection schemes.
Similarly, we can choose the "required number of operations" as our comparison cri-teria. Here, one operation represents calculation of one Euclidean distance. The numberof operations required at the receiver for different detection schemes in a two user uplinkscenario, employing higher level modulation schemes is illustrated in Table. 3.2. It can beobserved that joint detection requires3× 22k operations while in case of SSC the numberreduces to3 × 2k. The number of operations can be further reduced to2 × 2k by usingSHC. Hence, given the small difference in performance between the different detectionschemes, we can use any of the selection schemes instead of employing joint detection.
3.5 User Grouping
The analytical expressions also help in providing some guidelines for grouping differentusers at the relay. In order to have fair comparison between different grouping optionsthe total SNR i.e.γ1 + γ2 for the users has been kept constant. Then, the individual andaverage performance of the users for different pairing possibilities is analyzed.
As an example lets us take the case, whenγ1 + γ2 = 20 dB, and the relay SNRγ3
is varied from0 dB to 40 dB in order to observe the average error performance(P(1)b +

38 CHAPTER 3. LINK PERFORMANCE OF MARC
010
20010203040
10−3
10−2
10−1
γ3 , (in dB)γ1, at (γ1 + γ2 = 20 dB)
Ave
rage
Bit
Err
or P
roba
bilit
y, (
P (1
)b
+ P
(2)
b )
/ 2
Figure 3.10: Selecting a suitable user pair at the relay on the basis of average bit errorprobability (BEP) of the users
P(2)b )/2 of both users. For illustration, joint detection is considered at the receiver in
order to study different pairing options, as other detection schemes have similar trend withslightly differing absolute values. The expression in (3.12) is used to plot the curves inFigure 3.10, and it is obvious that if the relay link is weak, i.e.γ3 < γsum then its better togroup users having nearly similar SNRs on their links, as theaverage error performance isbest when users have same SNR. Similarly, for the large values of the relay SNR especiallywhenγ3 ≥ γsum, it is preferable to group users having complementary SNR conditionson their links as illustrated in Figure 3.10.
In order to have more insight into this behavior, let us look at the individual perfor-mance of the users in both regions i.e.γsum < γ3 andγsum ≥ γ3 separately as shownin Figure 3.11 and Figure 3.12, respectively. These figures are plotted using analyticalexpressions in (3.12), (3.27) and (3.42). The legends used i.e. JD(Ui), SSC(Ui) andSHC(Ui) represents the error performance of useri for different detection schemes. Aswe keptγsum constant at each point hence the performance curves are symmetrical aroundthe pointγ1 = γ2 in both figures. Moreover, it can be observed from Figure 3.11and Fig-ure 3.12 that the user having better direct link SNR will havebetter error performance. Itis worthwhile to mention here, that the error performance ofany user is influenced by twofactors, i.e. its own direct SNR with the base station and itsestimate calculated by its part-ner by network decoding operation with the relay. The factor, which dominates will decideabout the performance of the user. For instance, if the direct link SNR is increasing and itseffect is prominent then average bit error probability for the user will reduce. However, ifits partner’s SNR is decreasing and the effect of network decoding operation is dominant,the error probability of the user will increase even if its own direct SNR is increasing.

3.5. USER GROUPING 39
0 1 2 3 4 5 6 7 8 9 10
10−1.9
10−1.8
10−1.7
Ave
rage
Bit
Err
or P
roba
bilit
y
γ1 at (γ1 + γ2 = 10) dB
JD ( U1)
JD ( U2 )
SSC ( U1 )
SSC ( U2 )
SHC ( U1 )
SHC ( U2 )
Figure 3.11: Average BEP of individual users atγsum = 10 dB andγ3 = 20 dB
0 2 4 6 8 10 12 14 16 18 2010
−3
10−2
Ave
rage
Bit
Err
or P
roba
bilit
y
γ1 at γ1 + γ2 = 20 dB
JD ( U1 )
JD ( U2 )
SSC ( U1 )
SSC ( U2 )
SHC ( U1 )
SHC ( U2 )
Figure 3.12: Average BEP of individual users atγsum = 20 dB andγ3 = 10 dB
For instance, let us look at the performance of user1 and user2 in Figure 3.11, fora specific example considering,γsum = 10 dB andγ3 = 20 dB for different detectionschemes. It is interesting to observe that there is a degradation in the error performance ofuser1 with the increase inγ1, until it attains its maximum value atγ1 = γ2. Hereγ3 ishigh, howeverγsum is low, hence the network decoding operation does not alwaysresultin a good estimate. In particular when both users have the same SNR i.e. atγ1 = γ2 = 5dB, this would result in the worst network decoding operation as neither of the users have
40 CHAPTER 3. LINK PERFORMANCE OF MARC
a rather high SNR. Furthermore, the direct transmission of none of the users have goodenough quality. On the other hand, when users are paired withcomplementary SNRs i.e.γ1 = 0 dB andγ2 = 10 dB or vice versa, the signal with the higher SNR will lead to abetter quality of the network decoding operation. Therefore asγ1 increases the direct linktransmission for user1 starts to get better however the corresponding decrease inγ2 effectsthe network decoding and results into an overall degradation in performance of the weakuser. The above is true regardless of the type of detection scheme used.
Then we consider the case whereγsum ≥ γ3 and specifically whenγsum = 20 dBandγ3 = 10 dB. The average bit error performance for the individual users is shownin Figure 3.12. For this case, the BER curves behave similar to the conventional way,i.e. as the SNR of a certain user increases, its BER decreasesand vice versa. By virtueof having a highγsum, sharingγ3 among the two users will still result in an acceptablenetwork decoding operation and in a good direct transmission performance. As a result,the losses from a worse network decoding operation are accounted for by a better directtransmission in this case. It is worthwhile to observe that the performance of SSC and SHCfor a particular user is the same at high SNR in both Figure 3.11 and Figure 3.12, due tothe fact that the strong user is detected using direct link only, in both cases.
3.6 Summary
The effect of different detection schemes and user pairing on the error performance ofcooperating users, in network coded cooperative relaying scenarios have been analyzed inthis chapter. Using analytical expressions for the error probability of the users, it has beenshown that, by taking advantage of the channel conditions onthe links it is possible toachieve good link performance with simple detection schemes. Moreover, the selection ofusers to be paired together, is independent of the detectionscheme used. However, the userpairing strategy is significantly influenced by the SNR on thedifferent links. It has beenshown that for users in good conditions, pairing users with as similar channels as possibleresults in best average performance while simultaneously providing good performance forboth users. On the other hand, if users with poor channel conditions towards the destinationexist (which is a typical case when using the relays), then these users have to be pairedwith users having complementary (i.e. good) channel conditions towards the destination,in order to ensure a good quality of the network decoding operation, hence increasing thelikelihood of correct reception for both users. Here we havelooked at the individual aswell as the average error performance of the users, for exploring different options for usergrouping. Any change in the selection criteria will alter the user grouping options.
We have studied the impact of different detection schemes and user grouping on linkreliability of the users, however it can be observed that therelayed signal provides anextra dimension in the signal space at the receiver. Therefore, it is interesting to explorethe multidimensional signal space formed at the receiver inorder to improve the errorperformance of the users. The interaction between this augmented signal space and thedetection scheme is also interesting to investigate.

Chapter 4
Constellation Selection
This chapter is concerned with the link performance improvement of the multiple accessrelay channel in cellular system when network coding is employed at the relay node. Thechapter looks at the possibility of selecting the appropriate constellation for each link ofthe MARC when linear multi-level modulation is employed by the cooperating users. Aproper selection of the link constellations set, together with the redundancy introduced bynetwork coding at the relay link, can provide considerable performance gain at the basestation receiver. This performance gain is possible thanksto the augmented signal spaceformed by the links of the cooperative relaying scheme. Thisaugmented signal spaceallows a better spread of the signal points of the high-levelmodulation scheme which canimprove the link performance of the cooperating users in both additive white Gaussiannoise (AWGN) channels and fading multi-path channels. Two different detection schemesare considered in this context: Joint detection where all the three links are consideredsimultaneously, and selection and soft combining.
4.1 System Model
Let us reconsider the uplink scenario of a cellular/relay system as shown in Figure 2.4where two mobile users are communicating with a base stationand cooperating via a fixedrelay. As illustrated in the previous chapters, orthogonaltime division is assumed wherethe mobile users transmit their packets in the first two time slots. The relay node decodesthe received user packets, combines them using network coding (XOR-based) and forwardsthe combined packets to the base station in the third time slot.
The base station receiver now has three received packets. These received packets areused to decode the transmitted packets of the two mobile users. It is clear that there is acertain redundancy between the three received packets. This redundancy is due to the useof network coding at the relay node.
Redundancy between separate branches can be very useful in improving the link perfor-mance especially when linear multi-level modulation is employed by the different branches.In fact, it has been shown in [45] that it is possible to take advantage of this redundancy
41

42 CHAPTER 4. CONSTELLATION SELECTION
Figure 4.1: Comparing MSED for two branch transmit diversity using 4-PAM, (a) Sameconstellations on both branches (b) Selected constellation on branch 2
and increase the minimum squared Euclidean distance (MSED)between the signal pointsof the used multi-level modulation scheme. This increase inthe MSED is possible witha proper selection of the signal constellation sets used on each branch and viewing thereceived signals of the different branches as an augmented signal space. This augmentedsignal space increases the signal space dimension of the used modulation scheme and pro-vides more room for the modulation signal points to spread.
As an illustrative example we consider the case of four-level pulse amplitude mod-ulation (4PAM) and a two-branch communication link with a correlation equals to onebetween the branches (i.e. the same symbol is transmitted over the two branches) as shownin Figure 4.1. Here, the augmented signal space is formed by the two branches and themodulation signal dimensions. Hence, the augmented signalspace has dimension two inthis case. It is observed from Figure 4.1.a, that the signal constellations of the modulation

4.2. JOINT DETECTION 43
schemes are unchanged in the augmented signal space when thesignal constellations arethe same in both branches. However, with a proper selection of the used signal constel-lations on each branch as shown in Figure 4.1.b, it is possible to increase the minimumsquared Euclidean of the modulation scheme by 4 dB as compared to the case of samesignal constellations. This performance improvement is obtained without increasing thecomplexity of the receiver [45].
Our objective in this chapter is to apply the idea of constellation selection to the mul-tiple access relay channel with network coding. Since the base station receives signalsfrom three different branches and that there is some correlation between the branches, webelieve that constellation selection can improve the link performance of both cooperatingusers. However, since the correlation between the three branches is a bit weak one mightguess that the performance improvement will not be as good asthat illustrated in Fig-ure 4.1. To this end, the two detection schemes described in Chapter 3, joint detection andsuccessive cancelation with soft combining, are considered.
4.2 Joint Detection
Let us reconsider the uplink of a cellular/relay system as illustrated by the MARC schemeshown in Figure 2.4 where linear multi-level modulation, such as multi-level phase shiftkeying (MPSK) or multi-level quadrature amplitude modulation (MQAM), is employed atthe different transmitters. We assume that the base stationreceiver employs joint detectionand we consider both AWGN channels and Rayleigh fading channels.
4.2.1 AWGN Channels
For an ideal channel with AWGN interference only, the pairwise error probability can beobtained from (3.2) and is written as follows:
P2(s→ s) = Q
√
∑2k=1 |sk − sk|
2+ |s3 − s3|2
2N0
(4.1)
wheres1 is the transmitted symbol of user 1,s2 is the transmitted symbol of user 2, ands3 =M(m1 ⊕m2) is the network coded symbol transmitted by the relay node.M(.) isthe modulation mapping operation.
The pairwise error probability calculated in (4.1), can be used in (3.10) to obtain anupper bound on the average symbol error probability of userk as follows:
P (k)s ≤
1
M2
∑
sk 6=sk
∑
sj ,sj
P2(s→ s), k = 1, 2 and k 6= j (4.2)
whereM is the modulation level. It can be observed that the factorlog2(M) in (3.10) isnot used since we are calculating average symbol error probability. Considering both users

44 CHAPTER 4. CONSTELLATION SELECTION
together, the average symbol error probability of the MARC link can be written as
Ps ≤1
2
(
P (1)s + P (2)
s
)
(4.3)
It is observed that the average symbol error probability is adecreasing function of thesquared Euclidean distance
D2(s, s) =
3∑
i=1
|si − si|2 . (4.4)
Hence, our objective is to select the appropriate signal constellations set to be used at eachtransmitter of the MARC scheme such that the pairwise error probability is minimized.
In selecting the signal constellation set for each branch weemploy computer searchwith the objective of maximizing the minimum squared Euclidean distance between thesignal points in the augmented signal space. Here, the MARC has three different brancheswhich gives a good spreading for the signal points of the two cooperating users withinthis augmented signal space. However, since the transmitted symbols of the cooperatingusers in the direct links are uncorrelated, the redundancy is only provided by the relay linkwhich is pretty weak and the overall augmented signal space does not allow an increasein the MSED when joint detection is employed. Hence, computer search is performed infinding the signal constellations sets that minimize the number of signal points having theMSED between them. The computer search proceeds as follows:
1. Assume the same signal constellations in the three nodes.
2. Find the number of signal points, within the constellation set having the MSEDbetween.
3. Change the signal constellations set randomly for the three nodes and identify thenumber of signal points within the set having the MSED between them. Select thesignal constellations set that provide the minimum number of signal points havingthe MSED between them.
4. Repeat step 3 for the number of iterations. The signal constellations set obtainedafter the number of iterations is taken as the output of the search algorithm. Sincesearch is performed off-line hence maximum number of iterations, does not act as alimiting factor for the search algorithm. However, all possible combinations of con-stellations at the different nodes is considered, for finding an optimum combinationof constellations.
5. The signal constellations sets obtained in step 4 finalizes the selection procedure.Once found, these sets are fixed and can be used by the MARC scheme withoutmodifications.

4.2. JOINT DETECTION 45
4.2.2 Rayleigh Fading Channels
When the channel is a frequency non-selective Rayleigh fading channel and the threebranches are uncorrelated, the conditional pairwise errorprobability of joint detection is asgiven in (3.3) and can be written as
P2(s→ s |Γi ) = Q
√
∑3i=1 Γi |si − si|2
2Ei
(4.5)
The pairwise error probability is then obtained by averaging (4.5) over the pdfs of thefading amplitudes given in (3.4). The resulting expressions can be simplified to get anupper bound [55], as follows
P2(s→ s) ≤ 1
4
[
1
1 + xmin+
1
(1 + xmin)2
]
× 1
(1 + ψ1) (1 + ψ2) (1 + ψ3)(4.6)
where
xmin = min∀s6=s
√
ψi1 + ψi
, ψi = γi|si − si|2
4Ei=|si − si|2
4N0
Also γi is defined in (3.4) earlier.Ei is the average energy per transmitted symbol on linki and is related to the average energy per bit asEb = Ei/ log2(M). It can be observedfrom expression in (4.6), that the pairwise error probability is inversely related to the prod-uct distance, which is further a function of three correlated branch distances where eachsymbols appears in two branch distances. Since the minimum distance is not affected bythe selection of the signal constellation sets in AWGN, the product distance will not beaffected by this selection as well. Therefore, in this case,it is important to reduce the num-ber of signal points having MSED between them. The constellation sets obtained for theAWGN channel are also optimum for Rayleigh fading channels.
4.2.3 Numerical Results
Computer simulations are performed using various MPSK and MQAM modulation schemesat the nodes. Let us take 8 PSK as an example. Equal average received SNR is assumed onall the links for better understanding. Conventionally, the same constellation (SC) is usedat the nodes and illustrated as follows
s1, s2, s3 : {100, 000, 001, 011, 010, 110, 111, 101}
with theith element (symbol) mapped to the phaseiπ/4, i = 0, 1, ..., 7. It is worthwhile tomention here, that the Gray code mapping shown above is optimum, when same constella-tion is used at the nodes and when no interaction is considered between the constellations

46 CHAPTER 4. CONSTELLATION SELECTION
0 2 4 6 8 10 120
200
400
600
800
1000
1200
Squared Euclidean Distance (SED)
Dis
tanc
e D
istr
ibut
ion
Same Constellation
Constellation Selection
MSED
Figure 4.2: Comparison of SED Distribution in Augmented Signal Space, between SameConstellation (SC) and C1 using 8PSK
at different nodes. However, while performing constellation search, we look in multidi-mensional space formed by all the involved constellations and hence it is not necessarythat the outcome of the search algorithm results into a constellation set that follow Graycode mapping.
For instance, constellation search algorithm outputs a constellation set named as C1in this case, that provides least number of pairs containingMSED between them. Thesearched constellation set C1 can be described as follows
s1 :{010, 110, 101, 111, 100, 000, 011, 001}s2 :{110, 011, 001, 000, 101, 100, 010, 111}s3 :{001, 110, 101, 010, 111, 000, 011, 100}
It is obvious that C1 does not follow Gray code mapping. The significance of C1 is illus-trated in Figure 4.2, where the SED distribution of searchedand conventional constellationsets is compared. It can be observed that signal points containing MSED are reduced bynearly90% using C1. The comparison of SED distribution for individualusers is alsoshown in Figure 4.3. Here we calculate the SED for only those pairs that represents errorin that particular user. Therefore we can see the differencein the number of pairs as com-pared to Figure 4.2 for a particular SED. Since both users areusing different constellationsat their nodes, hence small difference in the pair reductionamong both users is expected.However, this difference does not create significant difference in the error performance ofindividual users. The distance distribution of the pairs that do not contain MSED betweenthem, is also changed by using C1. However these pairs have distance larger than theMSED and consequently have less impact on the error performance. Hence, an over allimprovement in performance can be envisaged by using C1.

4.2. JOINT DETECTION 47
Table 4.1: Reduction in number of pairs containing MSED for different modulationschemes using joint detection
Modulation Scheme Constellation Sets Number of Pairs containing MSEDBoth Users User 1 User 2
SC 288 192 192
8 PSK C1 32 16 24
16 PSK SC 1056 704 704
C1 92 52 52
16 QAM SC 1920 1280 1280
C1 280 180 192
The reduction in number of MSED pairs is numerically represented in Table. 4.1 fordifferent modulation schemes. The table shows the reduction for individual users as well.Using the SED distribution in Table. 4.1 and Figure 4.3, one can write upper bounds givenin (4.3) on the average symbol error rate (SER) of the users for SC in AWGN channel asfollows.
PSCs ≤192
64Q(
√
1.76γ0
)
+384
64Q(
√
4.75γ0
)
+384
64Q(
√
6γ0
)
≤3Q(
√
1.76γ0
)
+ 6Q(
√
4.75γ0
)
+ 6Q(
√
6γ0
)
(4.7)
And similarly for C1 we have
PC1s ≤
20
64Q(
√
1.76γ0
)
+56
64Q(
√
2.62γ0
)
+224
64Q(
√
3.9γ0
)
+256
64Q(
√
4.75γ0
)
+200
64Q(
√
6γ0
)
≤ 0.31Q(
√
1.76γ0
)
+ 0.88Q(
√
2.62γ0
)
+ 3.5Q(
√
3.9γ0
)
+ 4Q(
√
4.75γ0
)
+ 3.1Q(
√
6γ0
)
(4.8)
whereγ0 = Eb/N0. The terms insideQ function corresponds to particular SED while thecoefficients represent the average number of pairs for the corresponding SED. Since weare calculating the average SER for both users, hence the number of pairs is the average ofboth users as well.
The first term in each expression above corresponds to MSED. It can be observed thatthe coefficient of the first term in (4.7) has been reduced from3 to 0.31 in (4.8). Hence,with a proper constellation selection for the different links, the number of branches havingthe MSED between them can be reduced considerably. Consequently, error performanceof the users is expected to improve using C1. Figure 4.4 compares the average SER of bothusers using SC and C1. The analytical expressions in (4.7) and (4.8) are plotted besidesthe simulation results in Figure 4.4. It is obvious that significant gain can be achieved by

48 CHAPTER 4. CONSTELLATION SELECTION
0 2 4 6 8 10 120
200
400
600
800
1000
1200
Squared Euclidean Distance (SED)
Dis
tanc
e D
istr
ibut
ion
Same Constellation
Constellation Selection
(a) Comparison for User 1
0 2 4 6 8 10 120
200
400
600
800
1000
1200
Squared Euclidean Distance (SED)
Dis
tanc
e D
istr
ibut
ion
Same Constellation
Constellation Selection
(b) Comparison for User 2
Figure 4.3: Comparison of SED Distribution for individual users in Augmented SignalSpace between Same Constellation case and using C1 by employing 8-PSK
using C1, especially at low and intermediate SNRs. For instance, a gain of about 2 dBis obtained for a SER equal to10−2. Similarly at SER equal to10−5, a gain of 1 dB is

4.2. JOINT DETECTION 49
0 2 4 6 8 10 12 1410
−5
10−4
10−3
10−2
10−1
100
γ0 , (in dB)
Ave
rage
Sym
bol E
rror
Rat
e
Upper BoundsDirect LinkSame ConstellationConstellation Selection
Figure 4.4: Comparison of Average Symbol Error Rate (SER) for SC and C1 using 8-PSKover AWGN channel.
still achievable. Gain is reduced at high SNR, because the role of MSED pairs tends todominate at good channel conditions.
Similarly the upper bounds in (4.3) on average SER, in case ofRayleigh fading chan-nels can be calculated using pairwise error probability in (4.6) and the SED distribution inFigure 4.3. Hence in case of SC we can write
PSCs ≤Λ
64× 4×[
192
(1 + 0.44γ0)2 +
384
(1 + 1.5γ0) (1 + 0.44γ0)2
+384
(1 + 1.5γ0)2
]
≤ Λ ×[
0.75
(1 + 0.44γ0)2 +
1.5
(1 + 1.5γ0) (1 + 0.44γ0)
+1.5
(1 + 1.5γ0)2
]
(4.9)
where
Λ =
[
1
1 + xmin+
1
(1 + xmin)2
]
and xmin =
√
0.44γ0
1 + 0.44γ0.
Similarly in case of C1 the upper bounds on the average SER canbe calculated using SED

50 CHAPTER 4. CONSTELLATION SELECTION
0 5 10 15 20 25 3010
−5
10−4
10−3
10−2
10−1
100
γ0 , (in dB)
Ave
rage
Sym
bol E
rror
Rat
e
Upper BoundsDirect LinkSame ConstellationConstellation Selection
Figure 4.5: Comparison of Average SER for SC and C1 using 8-PSK over Rayleigh fadingchannels.
distribution as follows
PC1s ≤
Λ
64× 4×[
20
(1 + 0.44γ0)2 +
200
(1 + 1.5γ0)2 +
224
(1 + 0.44γ0) (1 + 1.5γ0)
+256
(1 + 1.5γ0) (1 + 0.44γ0)2 +
56
(1 + 0.44γ0)3
]
≤ Λ ×[
0.08
(1 + 0.44γ0)2 +
0.8
(1 + 1.5γ0)2 +
0.9
(1 + 0.44γ0) (1 + 1.5γ0)
+1
(1 + 1.5γ0) (1 + 0.44γ0)2 +
0.22
(1 + 0.44γ0)3
]
(4.10)
whereΛ is as defined in (4.9). It becomes obvious by comparing (4.9) and (4.10), thatthe coefficient of product distance terms containing MSED has been reduced from0.75to 0.08 by using C1. Figure 4.5 compares the average SER of both usersin Rayleighfading channels using SC and C1. The analytical expressionsin (4.9) and (4.10) are plottedbesides the simulation results in Figure 4.5. It can be observed, that a gain of nearly2 dBcan be obtained by using C1 as compared to SC at the nodes.
Now let us look at the performance gains while considering higher modulation levels.For instance, using 16 PSK the conventional bit to symbol mapping using SC can be written

4.2. JOINT DETECTION 51
0 5 10 15 20 25 30 3510
−5
10−4
10−3
10−2
10−1
100
γ0 , (in dB)
Ave
rage
Sym
bol E
rror
Rat
e
Direct LinkSame ConstellationConstellation Selection
Figure 4.6: Comparison of Average SER for SC and C1 using 16-PSK over Rayleighfading channels.
as follows
s1, s2, s3 :
{
1000, 0000, 0001, 0011, 0010, 0110, 0111, 0101, 0100, 1100,1101, 1111, 1110, 1010, 1011, 1001
}
with the ith element (symbol) mapped to the phaseiπ/8, i = 0, 1, ..., 15. Search is per-formed for obtaining C1 and the resulting constellation setis as follows:
s1 :
{
0001, 1111, 1001, 0100, 0111, 1110, 1010, 1100, 1101, 0011,0101, 1011, 0000, 0010, 0110, 1000
}
s2 :
{
1101, 0111, 1011, 0000, 0110, 1100, 1000, 1001, 0001, 0011,1110, 1111, 0010, 1010, 0101, 0100
}
s3 :
{
0001, 1011, 1100, 1010, 1110, 0111, 0011, 1000, 0010, 0110,0000, 0101, 1101, 0100, 1111, 1001
}
.
It can be observed from Table. 4.1 that the number of pairs containing MSED between themhave been reduced quite considerably from1056 to 92 using C1. Figure 4.6 compares theaverage SER using SC and C1 in Rayleigh fading channels usingsimulation approach. Itcan be observed that significant gain can be obtained using C1at the nodes, in case ofhigher level modulation schemes.
The proposed method of choosing constellations at the nodeshas been proved to beuseful for MPSK schemes. Let us analyze the usefulness of this method for the case of

52 CHAPTER 4. CONSTELLATION SELECTION
Figure 4.7: Constellations used at nodes for 16-QAM (a) SC atall nodes (b) C1 at User 1node (c) C1 at User 2 node (d) C1 at Relay node
MQAM modulation schemes. For instance, 16 QAM can be considered as an example.The constellation set used for SC is illustrated in Figure 4.7.a. Searched constellationset C1 for 16 QAM, is illustrated in Figure 4.7.b-d for the three nodes respectively. Againsignificant reduction in the number of pairs containing MSEDby using C1 can be observedby looking at Table. 4.1. Similar to 8 PSK, the upper bounds onthe average SER can beobtained by using SED distribution in this case. Therefore the expressions for average SERin case of SC for Rayleigh fading channels can be obtained as follows:
PSCs ≤Λ
256× 4×[
1280
(1 + 0.4γ0)2 +
3200
(1 + 0.8γ0) (1 + 0.4γ0)2
]
≤ Λ×[
1.3
(1 + 0.4γ0)2 +
3.1
(1 + 0.8γ0) (1 + 0.4γ0)2
]
(4.11)
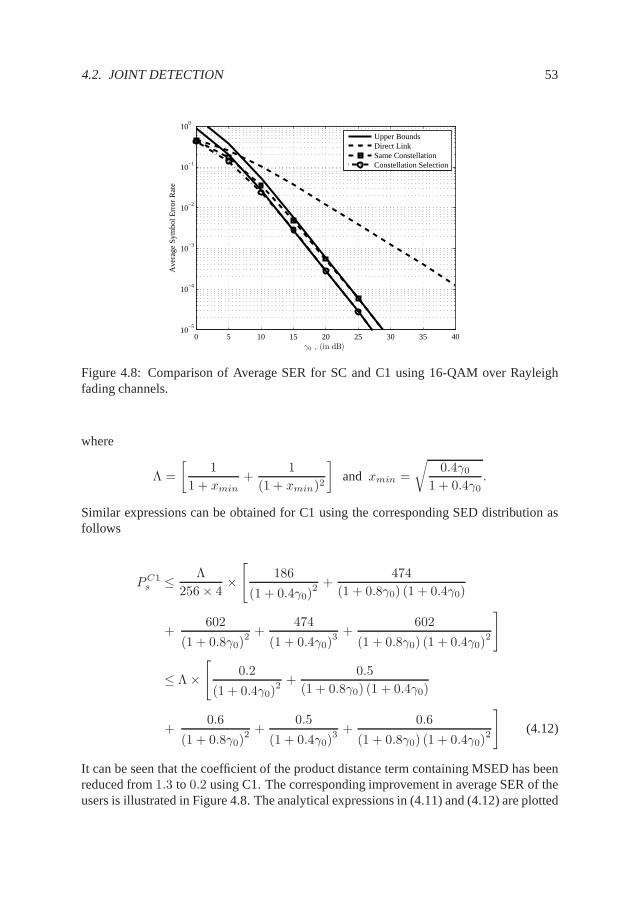
4.2. JOINT DETECTION 53
0 5 10 15 20 25 30 35 4010
−5
10−4
10−3
10−2
10−1
100
γ0 , (in dB)
Ave
rage
Sym
bol E
rror
Rat
e
Upper BoundsDirect LinkSame ConstellationConstellation Selection
Figure 4.8: Comparison of Average SER for SC and C1 using 16-QAM over Rayleighfading channels.
where
Λ =
[
1
1 + xmin+
1
(1 + xmin)2
]
and xmin =
√
0.4γ0
1 + 0.4γ0.
Similar expressions can be obtained for C1 using the corresponding SED distribution asfollows
PC1s ≤
Λ
256× 4×[
186
(1 + 0.4γ0)2 +
474
(1 + 0.8γ0) (1 + 0.4γ0)
+602
(1 + 0.8γ0)2 +474
(1 + 0.4γ0)3 +602
(1 + 0.8γ0) (1 + 0.4γ0)2
]
≤ Λ×[
0.2
(1 + 0.4γ0)2 +0.5
(1 + 0.8γ0) (1 + 0.4γ0)
+0.6
(1 + 0.8γ0)2 +0.5
(1 + 0.4γ0)3 +0.6
(1 + 0.8γ0) (1 + 0.4γ0)2
]
(4.12)
It can be seen that the coefficient of the product distance term containing MSED has beenreduced from1.3 to 0.2 using C1. The corresponding improvement in average SER of theusers is illustrated in Figure 4.8. The analytical expressions in (4.11) and (4.12) are plotted

54 CHAPTER 4. CONSTELLATION SELECTION
besides the simulation results in Figure 4.8. A performancegain of around2 dB can beachieved by employing C1 as compared to SC.
4.3 Selection and Soft Combining
Since the relay signal is used to help the weak user only, while using this detection scheme,the multi-dimensional signal space is formed at the receiver using the relay and the weaksignal only. Here constellation is searched for the relay node in order to maximize theMSED in augmented signal space formed by weak user and the relay. The computer searchalgorithm works in this case as follows:
1. Assume the same signal constellations in the three nodes.Strong user is detecteddirectly so its constellation is not involved in search procedure.
2. Find the MSED in the signal space formed by the relay signaland the weak signalfor any particular value of the strong symbol.
3. Change the signal constellation at the relay and identifythe MSED for new theconstellation set. Select the signal constellations sets that provide the maximumMSED.
4. Repeat step 3 for the number of iterations. The signal constellations set obtainedafter the number of iterations is taken as the output of the search algorithm.
5. The signal constellations sets obtained in step 4 finalizes the selection procedure.Once found, these sets are fixed and can be used by the MARC scheme withoutmodifications. Once constellation sets are decided, bit to symbol mapping at relayvaries depending upon the symbol, transmitted by strong user. This is done in orderto keep the relationship between constellation of the weak user and the relay fixed,i.e. according to the selected constellation set.
It is interesting to compare the performance of SSC with joint detection using the se-lected constellation set, since constellation search is rather simple in former case due to theinvolvement of two nodes only.
4.3.1 Rayleigh Fading Channels
Considering the Rayleigh fading channels and assuming the same average SNR on thelinks, the conditional pairwise error probability for userk as given in (3.16) can be rewrit-ten as follows:
P(k)2 (s→ s |Γi ) =
1
2(Pstrong{E |Γmax }+ Pweak {E |Γmin,Γ3 } ) (4.13)
where
Pstrong{E |Γmax } = Q
√
Γmax |ss − ss|22Es

4.3. SELECTION AND SOFT COMBINING 55
Table 4.2: Improvement in MSED by selecting proper constellation at the relay for differ-ent modulation schemes using SSC
Modulation Scheme Constellation Sets MSED8 PSK SC 1.17
C1 4
16 QAM SC 0.8
C1 2
and
Pweak {E |Γmin,Γ3 } = Q
√
Γmin |sw − sw|22Ew
+Γ3 |s3 − s3|2
2E3
.
Since userk could be strong user or a weak user hence we use the subscript ’s’ and ’w’to denote the both status on linkk respectively. Moreover,Γmax = max{Γ1,Γ2} andΓmin = min{Γ1,Γ2}. The upper bound [55] on the pairwise error probability is thenobtained by averaging (4.13) over the pdfs ofΓ3, Γmax andΓmin as given in (3.4), (3.20)and (3.23) respectively as follows:
P(k)2 (s→ s) ≤ 1
4− 1
2
(√
ψs1 + ψs
)
+1
4
(√
ψs2 + ψs
)
+1
4
[
1
1 + xmin+
1
(1 + xmin)2
]
× 1
(2 + ψw) (1 + ψ3)(4.14)
where
xmin = min
{√
ψw2 + ψw
,
√
ψ3
1 + ψ3
}
andψs, ψw andψ3 are as defined in (4.6). It is obvious from (4.14), that the pairwise errorprobability has inverse relationship with the product distance. Having the pairwise errorprobability for all the possible candidate pairs, an averaging can be performed over all thesymbols to get the average symbol error probability. The expression for average symbolerror probability of userk, can be derived by modifying the (3.26) as follows
P (k)s ≤
1
M
∑
sk
∑
sk 6=sk
P(k)2 (s→ s) (4.15)

56 CHAPTER 4. CONSTELLATION SELECTION
0 5 10 15 20 25 30 3510
−5
10−4
10−3
10−2
10−1
100
γ0 , (in dB)
Ave
rage
Sym
bol E
rror
Rat
e
Upper BoundsJoint DetectionSoft Combining
Figure 4.9: Performance of C1 using SSC as compared to Joint detection for 8-PSK overRayleigh fading channels.
4.3.2 Numerical Results
Taking 8 PSK as an example, the outcome C1 of the search process in this case is thefollowing constellation set,
s1, s2 :{100, 000, 001, 011, 010, 110, 111, 101}s3 : {101, 010, 000, 111, 011, 100, 110, 001}.
The MSED in the combined signal space has been increased from1.17 to 4 using theselected constellation set as illustrated in Table. 4.2. The change is MSED effects theproduct distance terms in average SER expression as obviousfrom the definition ofψi in(4.6). For instance, using the constellation set C1 and the corresponding SED distribution,an upper bound on the average SER of both users can be obtainedusing (4.15) as follows:
Ps ≤ 0.5−√
0.44γ0
1 + 0.44γ0+ 0.5
√
0.44γ0
2 + 0.44γ0
+ Λ×[
0.75
(2 + 0.44γ0) (1 + 2.55γ0)+
0.75
(1 + 0.44γ0) (2 + 2.55γ0)
]
(4.16)
where
Λ =
[
1
1 + xmin+
1
(1 + xmin)2
]
and xmin =
√
0.44γ0
2 + 0.44γ0.
However if we look at the expression for the average SER in case of using same constella-tion at all the nodes it comes out to be as follows

4.3. SELECTION AND SOFT COMBINING 57
Figure 4.10: C1 for 16-QAM (a). Mapping for User 1 and User 2 (b) Mapping for Relaynode
Ps ≤ 0.5−√
0.44γ0
1 + 0.44γ0+ 0.5
√
0.44γ0
2 + 0.44γ0
+ Λ×[
0.5
(2 + 0.44γ0) (1 + 0.44γ0)
]
(4.17)
whereΛ andxmin are defined as in (4.16).It can be observed by comparing (4.16) and (4.17), that the coefficient in the denomi-
nator of product distance terms has been increased from0.44 to 2.55 by using constellationselection. These coefficients can be calculated using (4.6)as follows
1.17
2× 3Eb
4N0= 0.44γ0
is for same constellation and(
4− 1.17
2
)
× 3Eb4N0
= 2.55γ0
is in case of constellation selection. Due to this change, product distance will be betterin case of constellation selection and gain in performance can be predicted. Computersimulations are performed using the selected bit to symbol mapping, in order to compareits performance with joint detection using constellation selection, as described previously.The curves are plotted in Figure 4.9 using analytical expressions in (4.10) and (4.16),besides the simulation results. It can be observed, that theperformance of SSC is quiteclose to joint detection at low SNR. At high SNR the difference is nearly1 dB. Moreover,SSC also provides a diversity gain of order2 similar to the joint detection scheme.

58 CHAPTER 4. CONSTELLATION SELECTION
0 5 10 15 20 25 30 3510
−5
10−4
10−3
10−2
10−1
100
γ0 , (in dB)
Ave
rage
Sym
bol E
rror
Rat
e
Upper BoundsJoint DetectionSoft Combining
Figure 4.11: Performance of C1 using SSC as compared to Jointdetection for 16-QAMover Rayleigh fading channels.
The searched constellation set for 16 QAM is also shown in Figure 4.10. It is clearfrom Table. 4.2, that the MSED has been improved from0.8 to 2 for the selected mapping.The corresponding change in coefficients of product distance term would be from
0.8
2× 4Eb
4N0= 0.4γ0
to(
2− 0.8
2
)
× 4Eb4N0
= 1.6γ0
according to (4.6). Therefore the expression for upper bound on the average SER of bothusers, in Rayleigh fading channels can be obtained as follows:
Ps ≤ 0.75− 1.5
√
0.4γ0
1 + 0.4γ0+ 0.75
√
0.4γ0
2 + 0.4γ0
+ Λ×[
1
(2 + 0.4γ0) (1 + 1.6γ0)+
1
(1 + 0.4γ0) (2 + 1.6γ0)
]
(4.18)
where
Λ =
[
1
1 + xmin+
1
(1 + xmin)2
]
and xmin =
√
0.4γ0
2 + 0.4γ0.

4.4. SUMMARY 59
Computer simulations are performed using C1 at the nodes. Results are compared withjoint detection as shown in Figure 4.11. The analytical expressions in (4.12) and (4.18) areused to plot the curves besides the simulation results. A trend similar to that of 8 PSK canbe observed in this case as well.
4.4 Summary
Analytical and simulation approaches have been used to study the impact of selecting sig-nal constellations set on signal reliability of the links innetwork coded cooperative relayingscenario. Selection criteria for two different detection schemes have been established. Theselected signal constellations set have the capability to benefit the users in terms of averagebit/symbol error probability, by exploiting the spread of the signal points of linear multi-level modulation in the augmented signal space formed by thebranches of MARC and thedimension of the used modulation scheme. Moreover, both joint detection and SSC canbe employed along with this signal constellation selectionsuccessfully at the nodes andprovide comparable performance gain. The proposed method is valid for different linearmodulation schemes and levels (large than two) under variety of fading channel conditionson the links. In short, signal constellation selection at the nodes of MARC is quite usefulin improving the signal reliability for each user.
Up till now we have studied the link performance of the cooperating users in MARCfor different detection schemes and with XOR-based networkcoding at the relay node.The redundancy introduced by network coding has been considered in improving the linkperformance of the cooperating users through a proper selection of the signal constellationsets used at the different nodes of MARC. However, all these investigations have been donefor un-coded systems and did not include the effects of channel coding used by the coop-erating users. Channel coding is an integral part of all wireless communication systems oftoday. The following chapter looks at the link performance of MARC in the presence ofchannel coding. Interaction between channel coding and network coding is also addressed.

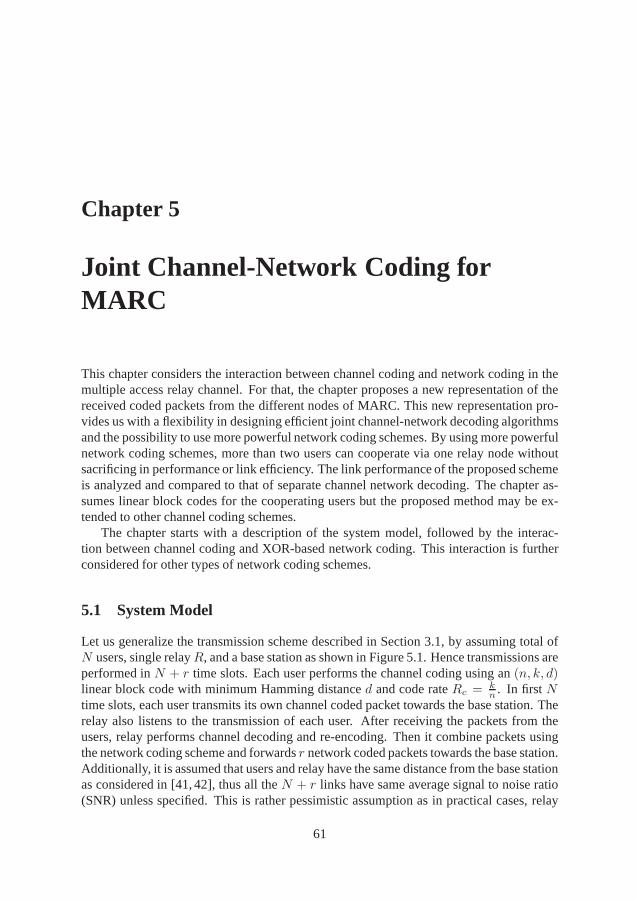
Chapter 5
Joint Channel-Network Coding forMARC
This chapter considers the interaction between channel coding and network coding in themultiple access relay channel. For that, the chapter proposes a new representation of thereceived coded packets from the different nodes of MARC. This new representation pro-vides us with a flexibility in designing efficient joint channel-network decoding algorithmsand the possibility to use more powerful network coding schemes. By using more powerfulnetwork coding schemes, more than two users can cooperate via one relay node withoutsacrificing in performance or link efficiency. The link performance of the proposed schemeis analyzed and compared to that of separate channel networkdecoding. The chapter as-sumes linear block codes for the cooperating users but the proposed method may be ex-tended to other channel coding schemes.
The chapter starts with a description of the system model, followed by the interac-tion between channel coding and XOR-based network coding. This interaction is furtherconsidered for other types of network coding schemes.
5.1 System Model
Let us generalize the transmission scheme described in Section 3.1, by assuming total ofN users, single relayR, and a base station as shown in Figure 5.1. Hence transmissions areperformed inN + r time slots. Each user performs the channel coding using an(n, k, d)linear block code with minimum Hamming distanced and code rateRc = k
n . In firstNtime slots, each user transmits its own channel coded packettowards the base station. Therelay also listens to the transmission of each user. After receiving the packets from theusers, relay performs channel decoding and re-encoding. Then it combine packets usingthe network coding scheme and forwardsr network coded packets towards the base station.Additionally, it is assumed that users and relay have the same distance from the base stationas considered in [41, 42], thus all theN + r links have same average signal to noise ratio(SNR) unless specified. This is rather pessimistic assumption as in practical cases, relay
61

62 CHAPTER 5. JOINT CHANNEL-NETWORK CODING FOR MARC
Figure 5.1: Uplink of a cellular/relay system with network coding forN users.
is normally closer to base station as compared to users and thus can provide better gain.Assuming flat fading Raleigh channel on each link, theith signal sample of the receivedpacket from linkl at base station can be written as
yil = hilsil + zil, l = 1, 2, · · · , N,N + 1, N + 2, · · · , N + r;
i = 0, 1, · · · , n− 1 (5.1)
wheren is the packet length,sil is the transmitted symboli, on link l with E{|sil|2} =ElRc andyil is the corresponding received symbol.El is the average energy per trans-mitted symbol at linkl. The coefficienthil denotes the complex multiplicative channelcoefficient gain and remains constant during each symbol interval. The samplezil is thecomplex Gaussian noise experienced by linkl during ith symbol interval at base stationwith double sided power spectral densityN0/2. The received packets from different usersand relay station are then used by the base station to make a decision on transmitted in-formation of different users. Link performance depends upon the network coding schemeused for combining these users.
5.2 Channel and XOR-based Network Coding
Conventional network coding is based on bitwise XOR where, for the multiple access relaychannel, the received packets from the two cooperating users are first decoded, re-encodedand then added bit-by-bit. The network coded packet is then of the same length as the
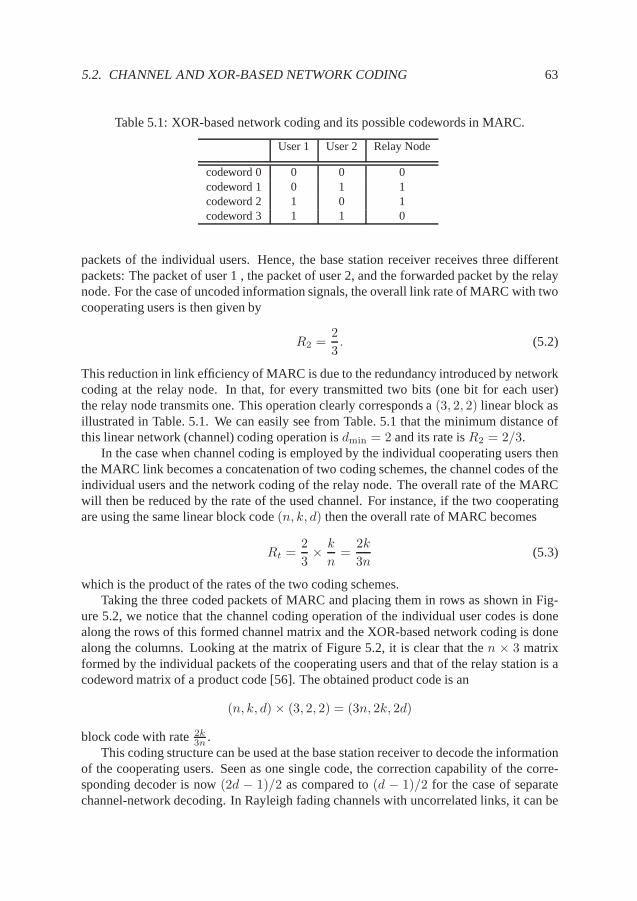
5.2. CHANNEL AND XOR-BASED NETWORK CODING 63
Table 5.1: XOR-based network coding and its possible codewords in MARC.
User 1 User 2 Relay Node
codeword 0 0 0 0codeword 1 0 1 1codeword 2 1 0 1codeword 3 1 1 0
packets of the individual users. Hence, the base station receiver receives three differentpackets: The packet of user 1 , the packet of user 2, and the forwarded packet by the relaynode. For the case of uncoded information signals, the overall link rate of MARC with twocooperating users is then given by
R2 =2
3. (5.2)
This reduction in link efficiency of MARC is due to the redundancy introduced by networkcoding at the relay node. In that, for every transmitted two bits (one bit for each user)the relay node transmits one. This operation clearly corresponds a(3, 2, 2) linear block asillustrated in Table. 5.1. We can easily see from Table. 5.1 that the minimum distance ofthis linear network (channel) coding operation isdmin = 2 and its rate isR2 = 2/3.
In the case when channel coding is employed by the individualcooperating users thenthe MARC link becomes a concatenation of two coding schemes,the channel codes of theindividual users and the network coding of the relay node. The overall rate of the MARCwill then be reduced by the rate of the used channel. For instance, if the two cooperatingare using the same linear block code(n, k, d) then the overall rate of MARC becomes
Rt =2
3× k
n=
2k
3n(5.3)
which is the product of the rates of the two coding schemes.Taking the three coded packets of MARC and placing them in rows as shown in Fig-
ure 5.2, we notice that the channel coding operation of the individual user codes is donealong the rows of this formed channel matrix and the XOR-based network coding is donealong the columns. Looking at the matrix of Figure 5.2, it is clear that then × 3 matrixformed by the individual packets of the cooperating users and that of the relay station is acodeword matrix of a product code [56]. The obtained productcode is an
(n, k, d)× (3, 2, 2) = (3n, 2k, 2d)
block code with rate2k3n .
This coding structure can be used at the base station receiver to decode the informationof the cooperating users. Seen as one single code, the correction capability of the corre-sponding decoder is now(2d − 1)/2 as compared to(d − 1)/2 for the case of separatechannel-network decoding. In Rayleigh fading channels with uncorrelated links, it can be

64 CHAPTER 5. JOINT CHANNEL-NETWORK CODING FOR MARC
replacements
n
k
23
m1 (packet of user 1)
m2 (packet of user 2)
m1 ⊕m2 (packet of relay)
Figure 5.2: Representation of conventional (XOR-type) network coding at the relay station.
shown that the diversity gain of order2d/2 can be achieved if we look network and channelcodes separately. It means that detection for both codes is done separately as illustrated inFigure 5.3, where after performing network decoding, channel code is decoded using harddecision decoding. However, by considering network and channel codes as a single prod-uct code(3n, 2k, 2d), we have the possibility to perform detection of both codes jointly,so that the redundancy present in the product code can be exploited efficiently. By usingan optimum joint detection method at the receiver, a diversity order of2d can be achieved.Here the receiver looks channel and network code as a single code and try to find the3×nmatrix closest to the transmitted one. Therefore joint network and channel coding based onproduct code representation improves the error correctingcapability and diversity gain ascompared to separate network and channel decoding. Other decoding methods for decod-ing product codes as described in [57–62], can also be used for joint network and channeldecoding.
Clearly, the correction capability offered by channel and XOR-based network coding islimited by the performance of network coding scheme used. Moreover, it is cumbersometo combine more than two users at relay using conventional XOR based method, since withN cooperating users, N - 1 links need to be reliable so that help can can be provided to theweaker link.
For the case ofN cooperating users via one relay, the relay node transmits one packet(XOR-based network coding packet) for each set ofN received packets. The networkcoding scheme can now be seen as a linear(N,N − 1, 2) block code. Hence, with the newrepresentation, the overall coding scheme of MARC can be seen as an
(n, k, d)× (N,N − 1, 2) = (n×N, k × (N − 1), 2d)
product code with rate
Rt =k(N − 1)
nN.
It is observed that the correction capability of the corresponding decoder is still(2d−1)/2which is independent of the number of cooperating users within MARC.
To solve this limitation in the correction capability of theoverall code we can increasethe number of network coded packets at the relay station which is basically equivalent toincreasing the redundancy of the network coded scheme. The problem now reduces to

5.3. CHANNEL-NETWORK CODING BASED ON PRODUCT CODES 65
y1
yNyN+1
yN+r
Channel
Channel
decoder
decoder
user 1
user 2
Net
wo
rkD
eco
din
g
Figure 5.3: Network decoding followed by channel decoding for conventional networkcoding in cooperative cellular/relay systems.
finding a good way of generating the network coded packets at the relay node. The linearcombinations of the packets at the relay node should maximize the minimum Hammingdistance of the network coded scheme.
5.3 Channel-Network Coding based on Product Codes
We look, in this section, at the interaction between the userinformation signals (directlinks) and forwarded signal(s) by the relay station to allowthe base station to use a flexibleand more powerful decoding algorithms when estimating the transmitted signals of thecooperating users with MARC. The interaction considered here is between the channelcoding scheme of the cooperating users and the network coding used at the cooperatingrelay node. We have seen in Section 5.2 that joint channel-network coding in MARC canbe seen as a product code. The codeword matrix of this productcode, constitutes of rowsformed by the individual channel codes of the cooperating users and columns formed bythe network coding scheme used at the relay node. It has also been that the correctioncapability of the corresponding decoder when an XOR-based network coding is employedcan be written as
t = ⌊2d− 1
2⌋ (5.4)
whered is the minimum Hamming distance of the block code used by the cooperatingusers for performing channel coding.
One way to improve the correction capability of the formed channel-network codingscheme is to use a better network coding scheme. This option is now possible with the newrepresentation introduced in the previous section. In fact, with this new representation,it is now possible to use any linear block code as a network coding scheme at the relaynode. With this flexibility, it becomes now possible to tradeoff link performance for linkefficiency and vise versa.

66 CHAPTER 5. JOINT CHANNEL-NETWORK CODING FOR MARC
Figure 5.4: Network coding scheme based on the principle of product codes in cellu-lar/relay systems.
Let us reconsider the uplink of a cellular/relay network representing MARC and shownin Figure 5.1. Assume that we have a total ofN users cooperating via one relay and thateach cooperating user is using an(n, k, d) linear block code. Hence, with time-divisionmultiple access between the users, the relay node receives atotal ofkr = N coded pack-ets. The relay node then decodes the received packets, re-encode them using the same(n, k, d) user block code. With the re-encoded packets, the relay nodeforms a coding ma-trix structure of sizen × kr, by placing thekr packets one on each other (one receivedpacket per row). The relay node then applies a linear block code, denote it by(nr, kr, dr),along the columns of the formed coding matrix. The obtained coding matrix will have asize ofn× nr. Since the firstkr rows (packets) of this formed matrix received by the basestation receiver via the direct links of the cooperating users, the relay node does not needto forward them but instead it only needs to forward the remainingnr − kr rows (packets)of this formed matrix. These forwarded packets by the relay node are in-fact the redun-dancy produced by the network coding scheme. The base station receiver takes the packetsreceived directly from the cooperating users and the packets received from the relay nodeto form a received version of the complete product code matrix. This received codewordcan now be decoded using known decoding algorithm of productcodes [57–62].
The formed product coding matrix at the relay station is illustrated in Figure 5.4. Theobtained product code for the proposed scheme is an
(n, k, d)× (nr, kr, dr) = (nrn, krk, drd).

5.3. CHANNEL-NETWORK CODING BASED ON PRODUCT CODES 67
y1
yN
yN + 1
yN + r
Product
Decoder
user1
userN
Figure 5.5: Joint channel-network decoding for product code representation.
having a coding rate
Rs =k
n× krnr.
It is observed that this formed coding scheme has a correction capability⌊(drd−1)/2⌋which is aboutdr times larger than the correction capability of the individual user codes.Hence, with a proper selection of the block code used at the relay station, one can improvethe link performance of the cooperating users within MARC significantly in comparisonwith the case when conventional XOR-based network coding isemployed without affectingthe overall efficiency of the MARC scheme. This selection reduces to choosing a linearblock code at the relay node having as parameters:
dr > 2
krnr
=2
3.
This obtained coding structure presents channel and network coding in one single code.Hence, a single decoder as shown in Figure 5.5, for joint channel-network decoding can beused at the base station receiver. A single decoder can take advantage of the channel vari-ations in the different branches of MARC and, as a result, better diversity gain can be ob-tained due to the involvement of the different radio links atthe receiver. Besides optimumjoint detection method, there are many other methods described in literature for decodingproduct codes. These methods are based on generalized minimum distance decoding, turbodecoding of concatenated codes and iterative decoding, as discussed in [57–62]. Thesedetection methods have performance close to joint detection and offers less complexity.Therefore any of these methods can be used to detect product code formed by network andchannel codes.

68 CHAPTER 5. JOINT CHANNEL-NETWORK CODING FOR MARC
It should be mentioned that the coding structure of Figure 5.4 allows the combinationof kr different packets at the relay node. This structure is quitegeneral and the onlylimitation here is that the number of packets to be combined at the relay station needs tobekr packets. Thesekr packets can belong to one user, two users, orkr different users.It is also possible to combine packets with different code rates or different versions of thesame packet. The result of this is a very flexible structure that can be adapted to help theuser(s), within the cooperating set of users, that need(s) help.
5.4 Analytical Performance
The product coding based structure for channel-network coding shown in Figure 5.4, pro-vides enough motivation to use better network coding schemeat the relay. The main ob-jective of the analysis in this section is to show the significance of using better networkcoding schemes to combine the users at the relay as compared to conventional XOR basedmethod. For fair comparison, let us consider simple detection scheme as illustrated inFigure 5.3 at the receiver in both cases. For performing network/column decoding softdecision decoding can be used for instance, followed by the hard decision decoding forchannel/row codes.
With soft decision decoding based on joint detection, the receiver computes the follow-ing metric using symboli from each received packetl as
C(m) =
nr∑
l=1
|yil − hilsil|2 , i = 0, 1, · · · , n− 1 (5.5)
for all possible codewords(set of symbols) in a network/column code. Since we are com-puting the matricC(m) for the column code, hence symboli from each linkl is used inthe calculation. Moreoversil denotes the estimated symbol for the transmitted symbolsil.For detection, the receiver chooses the set of symbols that have the minimum metric anddeclare them as the network decoded symbols of link1, 2, · · · , N .
Assuming uncorrelated links and Rayleigh fading channels,with channel state infor-mationhi = {hi1, · · · , hiN , hi(N+1), · · · , hi(N+r)}, the conditional pairwise error prob-ability for column code words can be written as
P2(si → si |hi ) = Q
(√
∑nrl=1 ΓilδilRc
2
)
(5.6)
wheresi = {si1, si2, · · · , siN} denotes the transmitted column codeword andsi =
{si1, si2, · · · , siN} denotes the estimated column codeword. MoreoverΓil = |hil|2ElN0
denotes instantaneous received SNR on linkl andδil = |sil−sil|2
ElRc. For the Rayleigh fading
channel the probability density function ofΓil can be written as
fi(γ) =1
γile− γγil , γ ≥ 0. (5.7)

5.4. ANALYTICAL PERFORMANCE 69
where
γil = E{Γil} =2σ2ElN0
is the average received SNR per symbol on linkl andσ2 is the variance of real and imagi-nary part of the complex channel coefficienthil.
The exact value of pairwise error probability for column codewords can be calculatedby averaging the expression in (5.6) over the pdfs ofΓil in (5.7). The resulting expressionwill be the generalization of the expression in (3.5) fornr links in error as compared to onlythree links. This expression can be used in (3.10) for findingupper bound on the averagebit error probability for column code. However, the generalized expression for pairwiseerror probability is tedious to calculate for higher valuesof nr or using long block codes.Hence, a rather simple method to compute upper bound on pairwise error probability is touse Chernoff bound in (5.6) and the resulting expression canbe written as follows:
P2(si → si) ≤1
2
nr∏
l=1
(
1
1 + γilδilRc4
)
(5.8)
The above expression assumes that when receiver detects thecode wordsi wrongly, all thenr symbols are in error. However, it is not necessary that wrongdetection of transmittedcodeword always results into an error in all the symbols. Taking BPSK as an example, thenumber of symbol/bit errors corresponds to hamming distance between both(transmittedand detected) codewords and it varies fromdr to the maximum valuenr. Denoting thehamming distance between the transmitted codewordsi and the estimated onesi byw, wecan write pairwise error probability as
P2(si → si) ≤1
2
w∏
l=1
(
1
1 + γilRc
)
, dr ≤ w ≤ nr (5.9)
Hereδil is replaced by4 as calculated in (3.11). An upper bound on code word error prob-ability given in [10] can be calculated using the expressions for pairwise error probabilityabove as
pcw ≤2kr−1∑
q=1
P2(si → si)
≤ 1
2
2kr−1∑
q=1
wq∏
l=1
(
1
1 + γilRc
)
(5.10)
where2kr represents the total number of possible codewords using column block codeand againwq is the corresponding hamming weight while selecting codeword q instead of
70 CHAPTER 5. JOINT CHANNEL-NETWORK CODING FOR MARC
transmitted one. Using the upper bound on codeword error probability above and assumingthatγil = γ0, an expression for raw bit error probability [10] can be written as
pb ≤aqkrpcw
≤ 1
2kr
2kr−1∑
q=1
aq
(
1
1 + γ0Rc
)wq
(5.11)
Hereaq is the number of information bit errors associated with choosing the codewordqinstead of the correct transmitted code word. Consider thatthere arendr number of termshaving hamming distancedr, then these terms can be separated from the rest of the termsas follows
pb ≤1
2kr
ndr∑
q=1
aq
(
1
1 + γ0Rc
)dr
+
2kr−1∑
q=ndr+1
aq
(
1
1 + γ0Rc
)wq
(5.12)
For high SNRs, the upper bound in (5.12) can be approximated by the first summation,since at high SNR the terms havingdr limits the error performance. Therefore the expres-sion forpb can be written as
pb ≈adr2kr
(
1
1 + γ0Rc
)dr
. (5.13)
In the above expressionadr corresponds to the total number of information bit errors inthe terms having hamming distancedr. It is obvious that performance is limited by theminimum hamming distancedr. It can also be observed that the diversity gain ofdr canbe obtained at the high SNR.
After performing column decoding, the detected symbols/bits are passed through harddecision channel/row decoder. The expression for bit errorprobability of column codecalculated in (5.11) can be used to model the memoryless binary symmetric channel at theinput of the row code decoder with transition probabilitypb. With this model, a good upperbound on average bit error probabilityPb for any user/packet can be written as follows
Pb ≤n∑
j=t+1
j + t
n
(
n
j
)
(pb)j
(1− pb)n−j , (5.14)
where
t = ⌊d− 1
2⌋ (5.15)
represents the correction capability of channel/row blockcode(n, k, d). The expression in(5.14) is a bit loose at low SNR values but quite good at high SNR values.

5.4. ANALYTICAL PERFORMANCE 71
Since we have derived the expression for bit error probability pb for network/columncode in (5.11), it can also be used to calculate block/codeword error probabilityPM forany user/packet. Assuming that all zero codeword was transmitted, the probabilityP2 thata codeword with hamming weightwm is selected at the receiver can be computed by usingChernoff bound [48] as follows
P2 ≤ [4pb (1− pb)]wm/2 (5.16)
The detection error occurs at the receiver ifwm/2 or more bits will be in error. For thechannel code(n, k, d) total number of possible wrong codewords will be2k − 1. [48] hascalculated a tighter upper bound by considering the union ofall these decisions as follows
PM ≤2k−1∑
m=1
[4pb (1− pb)]wm/2 ≈(
2k − 1)
[4pb (1− pb)]d/2
≤(
2k − 1) [
4pb − 4p2b
]d/2(5.17)
Sincepb is low at high SNR, the terms containing higher powers in (5.17) can be ignoredsafely and the expression forpb derived in (5.13) can be used to obtain upper bound onPM as follows
PM ≤(
2k − 1)
(
2adrkr
)d/21
(1 + γ0Rc)drd/2
. (5.18)
Hence, when all the links have the same SNR, a diversity gain of orderdrd/2 is obtainedwith this scheme. This diversity gain order is the product ofthe diversity gain order ob-tained from network coding and that obtained from channel coding. Therefore by usinga better network coding scheme havingdr greater than two, the error performance of theusers can be improved as compared to conventional combiningmethod based on XOR.
Simple detection scheme have been used to highlight the performance gain achiev-able by proposed method(using powerful network coding) as compared to conventionalmethod. However, by looking at channel-network codes together as a single product codean efficient iterative decoding method proposed by [62], canalso be used at the receiver.The importance of this iterative method increases while using powerful block codes, whereconstituent network and channel codes are long and it becomes too complex to use soft de-cision decoding to decode these constituent codes. In this iterative decoding method, mul-tiple iterations are required to achieve maximum performance improvement. During eachiteration hard decision decoding is applied along the columns, followed by hard decisiondecoding along the rows of the product coding matrix. The output of the first iteration isconsidered as input for the next iteration. In addition to simple detection scheme discussedearlier, the iterative decoding method is also considered in next section for performingchannel and network decoding jointly in case of proposed method.

72 CHAPTER 5. JOINT CHANNEL-NETWORK CODING FOR MARC
0 2 4 6 8 10 12 1410
−4
10−3
10−2
10−1
100
γ0 , (in dB)
Ave
rage
Bit
Err
or P
roba
bilit
y
Separate Channel−Network CodingJoint Channel−Network Coding
Figure 5.6: Comparison of joint channel-network decoding with separate channel-networkdecoding, using XOR as network code and(7, 4, 3) as channel code. All the links have thesame received SNRγ0.
5.5 Numerical Results
In this section we will focus on two things. First we will showthat joint network andchannel coding based on product code representation improves the error performance ofusers as compared to separate network and channel decoding.Then we will illustrate thatby using a better network coding scheme at the relay, links can be made more reliable ascompared to conventional XOR based method.
Let us consider a simple example, where channel coding is performed at the nodesusing(7, 4, 3) hamming code. The packets are combined at the relay using conventionalXOR based method. If the receiver considers channel and network decoding separately asillustrated in 5.3, then the redundancy contained in network coded packets cannot be ex-ploited efficiently at the receiver in order to correct the errors. However by looking channeland network codes jointly as a (21,8,6) product code, the correction capability at the re-ceiver improves due to higher minimum hamming distance between the codewords of theproduct coding matrix. Joint channel-network detection can be performed for the obtainedproduct coding matrix at the receiver. Figure 5.6 illustrates the performance improvementin average bit error probability of the users by using joint decoding as compared to separatedecoding in Rayleigh fading channels. It can be observed that by using product code basedrepresentation, performance gain of nearly4 dB can be obtained at a bit error rate equal to10−4.
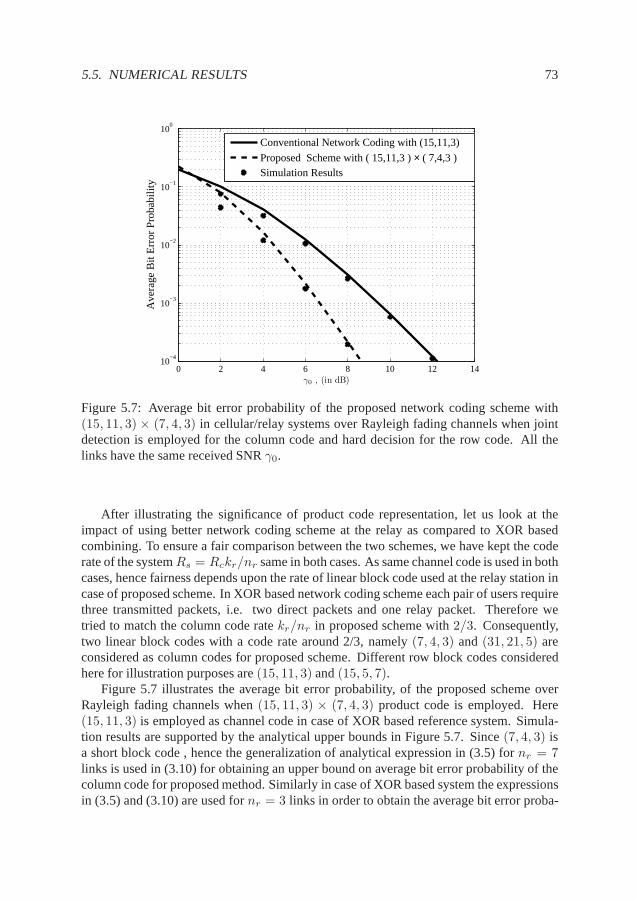
5.5. NUMERICAL RESULTS 73
0 2 4 6 8 10 12 1410
−4
10−3
10−2
10−1
100
γ0 , (in dB)
Ave
rage
Bit
Err
or P
roba
bilit
y
Conventional Network Coding with (15,11,3)
Proposed Scheme with ( 15,11,3 ) × ( 7,4,3 )Simulation Results
Figure 5.7: Average bit error probability of the proposed network coding scheme with(15, 11, 3)× (7, 4, 3) in cellular/relay systems over Rayleigh fading channels when jointdetection is employed for the column code and hard decision for the row code. All thelinks have the same received SNRγ0.
After illustrating the significance of product code representation, let us look at theimpact of using better network coding scheme at the relay as compared to XOR basedcombining. To ensure a fair comparison between the two schemes, we have kept the coderate of the systemRs = Rckr/nr same in both cases. As same channel code is used in bothcases, hence fairness depends upon the rate of linear block code used at the relay station incase of proposed scheme. In XOR based network coding scheme each pair of users requirethree transmitted packets, i.e. two direct packets and one relay packet. Therefore wetried to match the column code ratekr/nr in proposed scheme with2/3. Consequently,two linear block codes with a code rate around 2/3, namely(7, 4, 3) and(31, 21, 5) areconsidered as column codes for proposed scheme. Different row block codes consideredhere for illustration purposes are(15, 11, 3) and(15, 5, 7).
Figure 5.7 illustrates the average bit error probability, of the proposed scheme overRayleigh fading channels when(15, 11, 3) × (7, 4, 3) product code is employed. Here(15, 11, 3) is employed as channel code in case of XOR based reference system. Simula-tion results are supported by the analytical upper bounds inFigure 5.7. Since(7, 4, 3) isa short block code , hence the generalization of analytical expression in (3.5) fornr = 7links is used in (3.10) for obtaining an upper bound on average bit error probability of thecolumn code for proposed method. Similarly in case of XOR based system the expressionsin (3.5) and (3.10) are used fornr = 3 links in order to obtain the average bit error proba-

74 CHAPTER 5. JOINT CHANNEL-NETWORK CODING FOR MARC
0 2 4 6 8 10 12 1410
−4
10−3
10−2
10−1
100
γ0 , (in dB)
Ave
rage
Bit
Err
or P
roba
bilit
y
Conventional Network Coding with (15,11,3)Proposed Scheme with ( 15,11,3 ) × ( 7,4,3 )
Figure 5.8: Average bit error probability of the proposed network coding scheme with(15, 11, 3) × (7, 4, 3) in cellular/relay systems over Rayleigh fading channels when therelay link is 10 dB better that user direct link. Joint detection is employed for the columncode and hard decision for the row code.
bility for the network coding scheme. These expressions foraverage bit error probabilitiesof column/network coding schemes are then used in (5.14) to obtain the analytical upperbounds on average bit error probability of each user as plotted in Figure 5.7. It is observedfrom the said figure, that the proposed network coding schemeprovides good performancegain as compared to the conventional XOR based network coding. Gain around 3 dB ata bit error rate of10−4 can be obtained with this simple(7, 4, 3) linear block code. Notethat with the proposed network coding scheme it is possible to combine up to four userswithout affecting the efficiency of the overall system.
Figure 5.8 illustrates the average bit error probability using simulation approach, whenthe relay to base station link is 10 dB better than direct links of the users. It can be observedthat the relative gain of the proposed network coding schemein comparison with that ofthe XOR-based scheme has increased and the performance improvement is now around4.5 dB for a bit error rate of10−4. This improvement is due to the fact that, with the newnetwork coding scheme, the cooperative communication scheme takes better advantage ofthe relay channel and can provide better help in decoding thecooperating users.
As we have seen from Figure 5.7, significant gain in bit error probability can beachieved, even by using short block codes for combining the users in case of proposedscheme. Hence, it will be interesting to see the impact of using more powerful and longblock codes along the columns. However, more powerful codesalong the columns cor-

5.5. NUMERICAL RESULTS 75
0 2 4 6 8 10 12 1410
−4
10−3
10−2
10−1
100
γ0 , (in dB)
Ave
rage
Bit
Err
or P
roba
bilit
y
Conventional Network Coding with (15,11,3)Proposed Scheme with (15,11,3) × (7,4,3)
One iteration
Two iterations
Figure 5.9: Average bit error probability of the proposed network coding scheme with(15, 11, 3)×(7, 4, 3) in cellular/relay systems over Rayleigh fading channels when iterativehard decision decoding is employed for both the row and column codes. All the links havethe same received SNRγ0.
respond to more number of combined packets. We know that the complexity of joint de-tection increases exponentially with the number of combined packets and hence becomesunacceptable in case of long powerful block codes.
Better bit error probability along with a low detection complexity can be obtained byemploying iterative decoding described in [62], where candidate lists for constituent rowand column codes are obtained using hard decision decoding.Therefore with low com-plexity iterative decoding more powerful product codes canbe used. Let us apply iterativehard decision decoding to short code(15, 11, 3)× (7, 4, 3) first as illustrated by Figure 5.9.The curves are plotted using simulation approach. It can be observed that by increasingthe number of iterations the error performance can be improved up to nearly 2.5 db at a biterror rate of10−4. However, using more than two iterations does not improve the averagebit error probability further in this case.
Figure 5.10 illustrates an example using simulation approach, where a powerful blockcode is used to combine the users and the formed product code is (15, 11, 3)× (31, 21, 5).Due to better hamming distance significant improvement in signal reliability on the linksis expected. It is observed that a performance gain of nearly5 dB at a bit error rate of10−4
can be obtained as compared to the XOR-based network coding scheme. This is 2.5 dBmore as compared to the performance gain obtained with the short code of Figure 5.9.Hence, more powerful codes can provide better system performance without affecting the

76 CHAPTER 5. JOINT CHANNEL-NETWORK CODING FOR MARC
0 2 4 6 8 10 12 1410
−4
10−3
10−2
10−1
100
γ0 , (in dB)
Ave
rage
Bit
Err
or P
roba
bilit
y
Conventional Network Coding with (15,11,3)Proposed Scheme with (15,11,3) × (31,21,5)
One iteration
Four iterations
Two iterations
Figure 5.10: Average bit error probability of the proposed network coding scheme with(15, 11, 3)× (31, 21, 5) in cellular/relay systems over Rayleigh fading channels for differ-ent number of decoding iterations at the receiver. All the links have the same received SNRγ0.
system code rateRs.Let us now fix the block code used along the columns and investigate the impact of
changing the block code used along the rows. Figure 5.11 illustrates the average bit errorprobability of the proposed method based on product codes using simulation approachover Rayleigh fading channels and for different row block codes. By employing a morepowerful code along the rows, the relative performance gainbetween the two schemesis slightly reduced. This is due to the fact that with strong block codes the direct linksbecome more reliable and there is less need for help from the relay link. For instance, thegain obtained with(15, 5, 7)×(7, 4, 3) as compared to corresponding XOR curve is slightlyless than 3 dB at a bit error rate of10−4, whereas gain obtained with(15, 11, 3)× (7, 4, 3)is more than 3 dB as compared to its XOR curve.
5.6 Summary
Here we have represented the channel and the network codes inthe form of product codes.This new structure allows us to perform the network and the channel decoding jointly byusing a single decoder for the product codes. This decoder takes the advantage of channelvariations on the combined links and therefore diversity gain of each link can be improved.Moreover, using powerful block codes along with the iterative decoding method, enhance

5.6. SUMMARY 77
0 2 4 6 8 10 12 1410
−4
10−3
10−2
10−1
100
γ0 , (in dB)
Ave
rage
Bit
Err
or P
roba
bilit
y
Conventional Network Coding with (15,11,3)Proposed Scheme with (15,11,3) × (7,4,3)Conventional Network Coding with (15,5,7)Proposed Scheme with (15,5,7) × (7,4,3)
Figure 5.11: Average bit error probability of the proposed network coding scheme with(n, k, d) × (7, 4, 3) in cellular/relay systems over Rayleigh fading channels for differentrow block codes. Joint detection is employed for the column code and hard decision forthe row code. All the links have the same received SNRγ0.
the error correction capability of the channel-network coding scheme, along with accept-able detection complexity at the receiver. From the results, it can be observed even with thesimple linear block codes, the proposed method outperformsthe conventional XOR basednetwork coding scheme, while keeping the system efficiency same in both cases. The pro-posed method also helps in combining the multiple users/packets at the single relay andimproves the link performance of each combined user.


Chapter 6
Conclusions
The concluding chapter highlights the important contributions discussed in the thesis andthe possible directions of future work.
6.1 Concluding Remarks
Recently cooperative communications has been considered as an effective solution for fu-ture wireless systems. The thesis mainly addresses the issue of signal reliability on thelinks for network coded cooperative relaying scenario. Different factors affecting the errorperformance of users are studied. Two techniques have been proposed to improve the linkreliability for the cooperating users.
The role of the detection schemes in determining the bit/symbol error rates of users,have been illustrated using the analytical approach. It hasbeen concluded that by takingthe advantage of channel conditions, it is possible to achieve good error performance withlow detection complexity. For instance, it has been observed that the performance of lowdetection schemes is nearly1 to 2 dB away from conventional joint detection scheme.These low complexity detection schemes become more attractive for higher modulationlevels since, performance gap remains almost same as that incase of BPSK, howevercomplexity reduction becomes more prominent. The detection complexity is reduced fromM2 to 2M whereM is the modulation level. Therefore joint detection can be replaced bylow complexity detection schemes for high level modulationschemes, as the latter offersignificant complexity reduction as compared to the corresponding performance loss.
Since the number of users are always more than the number of relays in a cellular net-work, hence each relay has the possibility to choose the cooperating partners in MARC.How these partners are selected has an impact on the link performance of the users. Usergrouping at the relay has been studied before, only in the context of improving the systemcapacity. However, here we looked at this problem in the context of improving the linkreliability of the cooperating partners. It has been found that the pairing strategy is inde-pendent of detection scheme used, however, it depends upon the SNR on the individuallinks. It has been concluded that for the users having poor channel conditions towards the
79

80 CHAPTER 6. CONCLUSIONS
destination (i.e. relay has better SNR than the sum SNR of thepair), it is preferable togroup users having complementary channel conditions. On the other hand if users havegood channel conditions towards destination, it is shown that users having similar channelconditions should be grouped together.
Besides looking at various detection methods and user grouping strategies, we havelooked at different techniques to improve the error performance of the users in MARC.First method is based on the concept of constellation selection at the nodes. Extra dimen-sion provided by the relay in network coded cooperative scenario is exploited, to search anoptimal bit to symbol mapping for the nodes. The selected constellation set improves theerror performance of users as compared to the case when same constellation is used at thenodes. The improvement is verified for different detection schemes. The proposed methodprovides gain for different modulation schemes without spending any extra resources. Forinstance, taking 8 PSK as an example, a gain of nearly2 dB is achievable in Rayleighfading channels, by using the searched constellation set ascompared to the conventionalcase, where same constellation is used at all the nodes.
Another novel approach is introduced to improve, the link performance of MARC incellular systems, by looking at the interaction of network and channel coding schemes atthe relay. It has been shown that the channel and network codes can be considered asa single product code and this representation allows us to perform joint channel-networkdecoding at the receiver, that recovers the performance loss due to separate network andchannel coding. It has been concluded that by using this representation, significant gainin link performance can be achieved by using joint decoding as compared to the sepa-rate network and channel coding. For instance, in Rayleigh fading channels using XORbased network coding and channel code having minimum hamming distancedmin, thediversity order of2dmin can be achieved by using joint channel-network coding as com-pared todmin in case of conventional separate network and channel coding. The gain iscomparable to other related works such as [41], that considers distributed turbo codes toimplement joint network and channel coding. Since linear block codes are used as channeland network codes, hence the decoding complexity at the receiver is less(for short blockcodes) as compared to the method based on turbo codes in [41].Another advantage ofusing product code representation is that, it provides us anopportunity to choose powerfulnetwork coding schemes based on linear block codes instead of using conventional XORbased combining. It has been observed that by keeping the system throughput same in bothcases, significant gain(at least around 3 dB) can be achievedin link performance, even byusing short linear block codes to combine the users. Besidesimprovement in error per-formance of users, the proposed method allows us to combine more than two users at therelay.
6.2. FUTURE DIRECTIONS 81
6.2 Future Directions
There could be several possible directions for the future work. These can be summarizedas follows.
Motivated by other related works on MARC, we have consideredrelay-user link asan ideal link by assuming that, relay is located near to the user and it can refrain fromtransmitting the network coded packet if there are errors onrelay-user link. However, it isinteresting to look, how errors on the relay-user link impacts the gains achieved by variousmethods discussed in this monograph. Different factors such as detection method usedat the receiver and user grouping strategy have been studiedfor un-coded packets. Useof channel coding on the links may alter the performance of detection schemes or it mayimpact the user grouping strategy.
While introducing product code based representation of channel-network codes, it hasbeen assumed that all the users have the same channel code andhave same average receivedSNR on their links. In practice, users can have different received SNRs and may requiredifferent channel codes. It will be interesting to investigate code selection for cooperatingusers and the interaction between them. Moreover, in order to keep throughput efficiencysame as that of XOR based combining, for fair comparison in case of product coding basedmethod, we are limited to choose network/block codes havingcode rate2/3. Thereforesmall number of options are available to fulfill this criteria. Higher level modulation canbe used to transmit the redundant packets at relay in case of low rate codes. The loss inerror performance by using higher level modulation scheme can be compensated by bettererror correction capability of the low rate code. This method provides us the opportunityto choose different combinations of low rate codes and modulation schemes, along withkeeping throughput efficiency equal to2/3.
Product codes can also be formed by the combination of convolutional codes(alongrows) and linear block codes(along columns). Therefore theinteraction between channelcoding scheme based on convolutional codes and network coding scheme based on linearblock codes can be investigated for further gain in link performance. The study can also beextended towards non linear block codes.
Improvement in link level performance has been considered for various proposed meth-ods. It is important to look how much performance gain can be achieved by these methodsat the network/system level under multi-user multi-relay scenarios. For instance, sincemultiple users can be combined at the relay by product codingbased scheme, hence itwould be useful to look how this approach impacts the qualityof service of the users inthe whole network as compared to the conventional XOR based approach that allows tocombine only two users at the relay.
Another area that is receiving much attention these days, isthe concept of energy effi-cient cellular system. The role of network coding in cooperative relaying scenarios can beexplored to save power consumption at the transmitter side.Noise limited and interferencelimited scenarios can be investigated. More specifically, area energy consumption of thecellular network can be analyzed for a target user spectral efficiency, considering differenttransmission scenarios in downlink.


Bibliography
[1] Infonetics Research Inc., “Is 100 Gigabit Ready To Roll,” Avaiable at http://www.netevents.org/events/binaries/Portugal2008/Infonetics-NetEvents-Portugal-100-Gigabit-Presentation-Sept-25-2008-FINAL.pdf, 2008.
[2] G. Fettweis, “ICT Energy Consumption - Trends and Challenges,” inProceedings ofWireless Personal Multimedia Communications, WPMC 2008.
[3] Vodafone Chair Inc., “CoolCellular - Energy Efficient Network Architecturesand Transmission Methods,” Avaiable at http://www.vodafonechair.com/research/projects cool cellular.html, 2007-09.
[4] A. Hashimoto, H. Yoshino, and H. Atarashi, “Roadmap of IMT-Advanced Develop-ment,”IEEE microwave magazine, August 2008.
[5] G. J. Foschini and M. J. Grans, “On Limits of Wireless Communications in FadingEnvironment when using Multiple Antennas,”Wireless Personal Communications,vol. 6, no. 3, pp. 311–335, Mar 1998.
[6] I. E. Teletar, “Capacity of Multi-Antenna Gaussian Channels,”European Transctionson Telecommunications, vol. 10, no. 6, pp. 585–595, Nov 1999.
[7] D. Gesbert, M. Shafi, D. Shiu, P. Smith, and A. Naguib, “From Theory to Practice:An Overview of MIMO Space Time Coded Wireless Systems,”IEEE Journal onSelected Areas in Communications, vol. 21, no. 3, pp. 281–302, Apr 2003.
[8] M. Shafi, D. Gesbert, D. shan Shiu, P. Smith, and W. Tranter, “Guest editorial:MIMO systems and applications,”IEEE Journal on Selected Areas in Communica-tions, vol. 21, pp. 277–280, Apr 2003.
[9] H. Yanikomeroglu, “Cellular Multihop Communications:Infrastructure Based RelayNetwork Architecture for 4G Wireless Systems,” inProceedings of the 22nd Queen’sBiennial Symposium on Communications (QBSC’04), 1-3 June 2004, Queen’s Uni-versity, Kingston, Ontario, Canada.
[10] L. Ahlin, J. Zander, and S. B. Slimane,Principles of Wireless Communications.Narayana Press Denmark, 2006.
83
84 BIBLIOGRAPHY
[11] R. Pabst, B. H. Walke, D. C. Schultz, P. Herhold, H. Yanikomeroglu, S. Mukherjee,H. Viswanathan, M. Lott, W. Zirwas, M. Dohler, H. Aghvami, D.D. Falconer, andG. P. Fettweis, “Relay Based Deployment Concepts for Wireless and Mobile Broad-band Radio,”IEEE Communications Magazine, vol. 42, no. 9, pp. 80–89, Sept 2004.
[12] B. Timus, “Cost Analysis Issues in a Wireless Multihop Architecture with Fixed Re-lays,” in Proceedings of the IEEE VTC 2005, vol. 5, May 2005, pp. 3178–3182.
[13] E. C. V. der Meulen, “Three Terminal Communication Channels,”Advanced AppliedProbability, vol. 3, pp. 120–154, 1971.
[14] T. M. Cover and A. E. Gamal, “Capacity Theorems for the Relay Channel,”IEEETransctions on Information Theory, vol. 25, no. 5, pp. 572–584, Sept 1979.
[15] A. Sendonaris, E. Erkip, and B. Aazhang, “Increasing Uplink Capacity via User Co-operation Diversity,” inProceedings of IEEE International Symposium on Informa-tion Theory (ISIT 1998), Cambridge, MA , USA, August 1998, p. 156.
[16] ——, “User Cooperation Diversity Part I and Part II,”IEEE Transactions on Com-munications, vol. 51, no. 11, pp. 1927–48, Nov 2003.
[17] J. N. Laneman and G. W. Wornell, “Energy Efficient Antenna Sharing and Relay-ing for Wireless Networks,” inProceedings of IEEE Wireless Communications andNetworking Conference, WCNC. 2000, pp. 7–12.
[18] J. N. Laneman, D. Tse, and G. W. Wornell, “Cooperative Diversity in Wireless Net-works: Efficient Protocols and Outage Behavior,”IEEE Transactions on InformationTheory, vol. 50, no. 12, pp. 3062–3080, 2004.
[19] B. Zhao and M. Valenti, “Distributed Turbo Coded Diversity for the Relay Channel,”Electronic Letters, 2003, vol. 39, pp. 786–787, 2003.
[20] Y. Cao and B. Vojcic, “Cooperative Coding using Serial Concatenated ConvolutionalCodes,” inProceedings of IEEE Wireless Communications and Networking Confer-ence (WCNC), March 2005.
[21] A. Chakrabarti, A. de Baynast, A. Sabharwal, and B. Aazhang, “LDPC Code Designfor Half-Duplex Decode and Forward Relaying,” inProceedings of 43rd AllertonConf. on Communication, Control, and Computing, Sept. 2005.
[22] A. Nosratinia, T. E. Hunter, and A. Hedayat, “Cooperative Communication in Wire-less Networks,”IEEE Communications Magazine, vol. 42, no. 10, pp. 74–80, Oct2004.
[23] T. E. Hunter and A. Nosratinia, “Cooperative Diversitythrough Coding,” inProceed-ings of IEEE ISIT 2000, Laussane, Switzerland, July 2002, p. 220.
[24] ——, “Diversity through Coded Cooperation,”IEEE Transactions on Wireless Com-munications, vol. 5, no. 2, pp. 283–289, Feb 2006.

BIBLIOGRAPHY 85
[25] J. N. Laneman and G. W. Wornell, “Distributed Space-Time-Coded protocols forexploiting cooperative diversity in wireless networks,”IEEE Transactions on Infor-mation Theory, vol. 49, no. 10, pp. 2415–2425, 2003.
[26] M. Janani, A. Hedayat, T. E. Hunter, and A. Nosratinia, “Coded Cooperation inWireless Communications: Space Time Transmission and Iterative Decoding,”IEEETransaction on Signal Processing, 2004, vol. 52, no. 2, pp. 362–371, Feb 2004.
[27] R. Ahlswede, N. Cai, S. Li, and R. W. Yeung, “Network Information Flow,” IEEETransactions on Information Theory, vol. 46, no. 4, pp. 1204–1216, July 2000.
[28] X. Bao and J. Li, “Matching Code-on-Graph with Network-on-Graph: Adaptive Net-work Coding for Wireless Relay Networks,” inProceedings of 43rd Allerton Confer-ence on Communication, Control, and Computing, September 2005.
[29] ——, “On the Outage Properties of Adaptive Network CodedCooperation in LargeWireless Networks,” inProceedings of International Conference on Accoustic,Speech and Signal Processing (ICASSP), March 2006.
[30] Y. Chen, S. Kishore, and J. Li, “Wireless Diversity through Network Coding,” inProceedings of IEEE Wireless Communications and Networking Conference, 2006.,pp. 1681–1686.
[31] H. K. Dereje H. Woldegebreal, “Multiple Access Relay Channel with Network Cod-ing and Non-Ideal Source-Relay Channels,” inProceedings of 4th International Sym-posium on Wireless Communication Systems, October 2007.
[32] S. Yang and R. Koetter, “Network Coding over a Noisy Relay : A Belief PropagationApproach ,” inProceedings of IEEE International Symposium on Information Theory,Nice,France, June 24-29 2007.
[33] J. Manssour, A. Osseiran, and S. B. Slimane, “Network Coding in OFDM Net-works: Strategies and Performance,” inProceedings of IEEE WiMob 2008, Aavignon,France, Oct. 2008.
[34] Y. Wu, P. A. Chou, and S. Y. Kung, “Information Exchange in Wireless Networkswith Network Coding and Physical Layer Broadcast,” inProceedings of 5th Scandi-navian Workshop on Adhoc Networks (ADHOC’05), Stockholm Sweden, May 2005.
[35] S. Katti, D. Katabi, W. Hu, H. S. Rahul, and M. Médard, “The Importance of beingOpportunistic: Practical Network Coding for Wireless Environments,” inProceed-ings of 43rd Annual Allerton Conference on Communication, Control, and Comput-ing, Monticello, IL, Sept. 2005.
[36] P. Larsson, N. Johansson, and K. Sunell, “Coded Bi-Directional Relaying,” inPro-ceedings of IEEE 63rd Vehicular Technology Conference (VTC ’06) Melbourne, Aus-tralia, May 2006, pp. 851–855.
86 BIBLIOGRAPHY
[37] P. Popovski and H. Yomo, “Bi-Directional Amplificationof Throughput in a WirelessMultiHop Network ,” inProceedings of IEEE 63rd Vehicular Technology Conference,2006. VTC 2006-Spring, May 2006, pp. 588–593.
[38] eMobility Report, “White Papers produced during SRA Revision Period 1,” 2008.
[39] J. Kliewer, T. Dikaliotis, and T. Ho, “On the Performance of Joint and Separate Chan-nel and Network Coding in Wireless Fading Networks,” inProceedings of IEEE In-formation Theory Workshop on Information Theory for Wireless Networks, Solstrand,July 2007.
[40] X. Bao and J. Li, “A Unified Channel-Network Coding Treatment for User Coopera-tion in Wireless AdHoc Networks,” inProceedings of IEEE International Symposiumon Information Theory (ISIT), Seattle, WA, USA, July 2006.
[41] C. Hausl and P. Dupraz, “Joint Network-Channel Coding for the Multiple-Access Re-lay Channel,” inProceedings of 3rd Annual IEEE Communication society on Sensorand Ad Hoc Communication Networks (SECON 2006).
[42] C. Hausl, F. Schreckenbach, I. Oikonomidis, and G. Bauch, “Iterative Network andChannel Decoding on a Tanner Graph,” inProceedings of 43rd Allerton Conf. onCommunication, Control, and Computing, Sept. 2005.
[43] C. Hausl and J. Hagenauer, “Iterative Network and Channel Decoding for the Two-Way Relay Channel,” inProceedings of IEEE International Conference on Commu-nications (ICC), June 2006.
[44] Z. Guo, J. Huang, B. Wang, J.-H. Cui, S. Zhou, and P. Willett, “A Practical JointNetwork-Channel Coding Scheme for Reliable Communicationin Wireless Net-works,” in Proceedings of the Tenth ACM international symposium on Mobile AdhocNetworking and Computing, New Orleans, LA, USA 2009., pp. 279–288.
[45] S. B. Slimane, “Combined Transmitter Diversity and Multi-Level Modulation Tech-niques,”Wireless Personal Communications, vol. 39, no. 2, pp. 215–227, Oct 2006.
[46] Z. H. Awan and S. B. Slimane, “Improved Beamforming for Radio Links with Multi-Level Linearly Modulated Signals,” inProceedings of IEEE Wireless Communicationand Networking Conference (WCNC 2009), Hungary, April 2009.
[47] B. Sklar,Digital Communications Fundamentals and Applications. Prentice HallPTR Second Edition, 2002.
[48] J. G. Proakis,Digital Communications. McGraw-Hill International Edition, 2001.
[49] J. Zhao and A. Wittneben, “Cellular Relaying Networks:State of the Art and OpenIssues,” inProceedings of 2nd COST 289 Workshop, Kemer, Antalya, Turkey, July2005.

BIBLIOGRAPHY 87
[50] H. Wu, C. Qiao, S. De, and O. Tonguz, “Integrated Cellular and AdHoc Relaying Sys-tems: iCAR ,”IEEE Journal on Selected Areas in Communications, vol. 19, no. 10,pp. 2105–15, Oct 2001.
[51] L. Le and E. Hossain, “Multihop Cellular Networks: Potential Gains, Research Chal-lenges, and a Resource Allocation Framework,”IEEE Communications Magazine,vol. 5, no. 9, pp. 66–73, Sep 2007.
[52] P. Popovski and H. Yomo, “The Anti-Packets Can Increasethe Achievable Through-put of a Wireless Multi-Hop Network ,” inProceedings of IEEE International Con-ference on Communications, ICC June 2006, pp. 588–593.
[53] S. Zhang, S. C. Liew, and P. P. Lam., “Hot Topic: PhysicalLayer Network Coding ,”in Proceedings of ACM Mobicom, 2006.
[54] A. Papoulis,Probability, Random Variables and Stochastic Process. 2nd Edition,McGraw-hill, 1984.
[55] S. B. Slimane and T. Le-Ngoc, “Tight Bounds on the Error Probability of CodedModulation Schemes in Rayleigh Fading Channels,”IEEE Transactions on VehicularTechnology, vol. 44, no. 1, pp. 121–130, Feb 1995.
[56] P. Elias, “Error Free Coding,”IEEE Transactions on Information Theory, vol. 4, pp.29–37, 1954.
[57] G. D. Forney, “Generalized Minimum Distance Decoding,” IEEE Transactions onInformation Theory, IT-12, 1966.
[58] J. Hagenauer, E. Offer, and L. Papke, “Iterative Decoding of Binary Block and Con-volutional Codes,”IEEE Transactions on Information Theory, vol. 42, no. 2, Mar1996.
[59] R. M. Pyndiah, “Near Optimum Decoding of Product Codes:Block Turbo codes,”IEEE Transactions on Communications, vol. 46, no. 8, pp. 1003–1010, Aug 1998.
[60] A. R. Calderbank, “ Multilevel Codes and Multistage Decoding,” IEEE Transactionson Information Theory, vol. 37, no. 3, pp. 222–229, Mar 1989.
[61] L. R. Bahl, J. Cocke, F. Jelinek, and J. Raviv, “Optimal Decoding of Linear Codes forMinimizing Symbol Error Rate,”IEEE Transactions on Information Theory, IT-20,March 1996.
[62] O. Al-Askary, Coding and Iterative Decoding of Concatenated Multi-Level Codesfor the Rayleigh Fading Channel. PhD Thesis Royal Institute of Technology (KTH)Stockholm Sweden, 2006.


