linking ampli cation ddos attacks to booter...
TRANSCRIPT
Linking Amplification DDoS Attacksto Booter Services
Johannes Krupp1(B), Mohammad Karami2, Christian Rossow1, DamonMcCoy3, and Michael Backes1,4
1 CISPA, Saarland University, Saarbrucken, [email protected]
2 Google, Inc., Mountain View, CA [email protected]
3 New York University, New York, USA4 MPI-SWS, Saarbrucken, Germany
Abstract. We present techniques for attributing amplification DDoSattacks to the booter services that launched the attack. Our k-NearestNeighbor (k -NN) classification algorithm is based on features that arecharacteristic for a DDoS service, such as the set of reflectors used by thatservice. This allows us to attribute DDoS attacks based on observationsfrom honeypot amplifiers, augmented with training data from groundtruth attack-to-services mappings we generated by subscribing to DDoSservices and attacking ourselves in a controlled environment. Our eval-uation shows that we can attribute DNS and NTP attacks observed bythe honeypots with a precision of over 99% while still achieving recallof over 69% in the most challenging real-time attribution scenario. Fur-thermore, we develop a similarly precise technique that allows a victimto attribute an attack based on a slightly different set of features thatcan be extracted from a victim’s network traces. Executing our k -NNclassifier over all attacks observed by the honeypots shows that 25.53%(49,297) of the DNS attacks can be attributed to 7 booter services and13.34% (38,520) of the NTP attacks can be attributed to 15 booter ser-vices. This demonstrates the potential benefits of DDoS attribution toidentify harmful DDoS services and victims of these services.
1 Introduction
Distributed Denial-of-Service (DDoS) attacks have become commoditized byDDoS-for-hire services, commonly called booters or stressers [7,19]. A large num-ber of booter services advertise their services openly as an economical platformfor customers to launch DDoS attacks. At the same time DDoS attacks are in-creasing in number and in magnitude. This proliferation of DDoS attacks hascaused many network and website operators to rank this type of attack as one ofthe largest threats facing them [13]. This barrage of DDoS attacks has increasedthe demand for Content Delivery Networks (CDNs) and Software Defined Net-working defenses that can absorb and filter these attacks [5]. In turn, this has
prompted attackers to react by devising increasingly efficient methods of bypass-ing or overwhelming defenses. The result is an escalating technological arms-racebetween DDoS attackers and defenders that at times has congested segments ofthe core Internet infrastructure as collateral damage [17].
Despite the proliferation of DDoS services and attacks, little progress hasbeen made on attributing the services that are launching these attacks on behalfof their customers. Most ideas for attribution focus on IP traceback mecha-nisms [16, 21–23, 30] to trace the source of spoofed IP packets, which requireISPs to assist and so far have not been widely deployed. This has resulted inmost of these attacks being unattributed unless the attackers unveil themselves.While it is important to create strong technological DDoS defenses, we arguethat there is also benefit in investigating other methods that enable attribu-tion of DDoS attacks to the services responsible for launching these attacks.For instance, some of these booter services—seven out of 23 services that westudied—claim they are benign services by advertising as “stress-testing” ser-vices intended to be used only by authorized administrators. For example, oneof these services included this statement on their website, “We provide a pro-fessional and legal ip stresser service which is based on a massive 20 dedicatedserver backend, ensuring that your server is tested to its limits.” Attribution canremove this veil of legitimacy and assist efforts to undermine these services byallowing victims and law enforcement to attribute which booter services wereresponsible for an attack. Attribution also enables measuring the scale of theseservices and prioritizing undermining the larger services that are causing moreharm. In order to assist ongoing investigations, we are continually sharing infor-mation from our study on DDoS attacks and booter services with the EuropeanPolice Office (Europol), the United States Federal Bureau of Investigation (FBI)and large ISPs or backbone providers.
In this work, we show that it is possible to build supervised learning tech-niques that allow honeypot amplifier operators and victims to accurately at-tribute attacks to the services that launched them. To begin, we identify threekey features that honeypot operators can record to construct a supervised k -NN classifier that can attribute attacks. In order to validate our method, wesubscribed to 23 booter services and generated a ground truth data set of at-tacks to booter service mappings5. Validation of our classifier using the groundtruth self-attack data set shows that it is highly precise at attributing DNS andNTP attacks with a precision of over 99% at 69.35% recall in the worst case ofreal-time attribution. When retrospectively attributing attacks, the recall evenincreases to 86.25%. Executing our classifier over the set of all attacks observedby the honeypots shows that 25.53% (49,297) of the DNS attacks can be at-tributed to 7 booter services and 13.34% (38,520) of the NTP attacks can beattributed to 15 booter services.
Finally, we show that a k -NN classifier can also be used by victims to attributeDDoS attacks to the service that launched the attack. Our findings demonstrate
5 Our ethical framework for these measurements is based on previous studies thathave used this methodology [7, 20].
that many of the attacks we observed can be attributed to a small set of booterservices that are operating relatively openly. Our ability to attribute large num-bers of attacks to a small set of booter services and sharing of this informationwith Europol and the FBI to assist in active investigations demonstrates theusefulness of our attribution methods.
In summary, we frame our contributions as follows:
– We present a k -NN-based classifier that attributes amplification DDoS at-tacks observed by honeypots with a precision of over 99% while still achievingrecall of over 69% in the most challenging real-time attribution scenario.
– We present a similarly precise technique that allows a DDoS victim to at-tribute attacks based on features extracted from a victim’s network traces.
– We attribute 25.53% (49,297) of the DNS attacks to 7 booter services and13.34% (38,520) of the NTP attacks to 15 booter services.
2 Background
2.1 Threat Model
Amplification DDoS constitutes a powerful attack in which an adversary aimsto exhaust the bandwidth of a victim’s host or network by inducing a largevolume of traffic. Towards this, the attacker abuses multiple servers as so calledamplifiers. These servers offer UDP-based protocols prone to amplification, i.e.,the server’s response is significantly larger than the corresponding request sentto the server. At least 14 protocols suffer from this flaw [18], such as NTPand DNS, leading to a multitude of servers that can be exploited as amplifiers.Given the connection-less nature of UDP, an attacker can redirect the servers’responses to the victim by simply spoofing the source IP address in requests.Due to amplification ratios of a factor of 5 to 4500 [18], an attacker that sendsrequests at a rate of some Mbit/s can still cause attack traffic at Gbit/s-scale.
Furthermore, we are concerned with a special type of attacker: booter services.These offer platforms for DDoS-as-a-service, often under the disguise of “stress-testing”, where customers can request various types of attacks for a small fee. Thebooter will then launch these attacks using its infrastructure. Our threat modelthus contemplates four parties: Customers, who commission attacks; booters,who conduct the actual attacks; amplifiers, who are exploited to amplify traffic;and victims, who are the targets of such attacks.
The aim of this paper is to attribute attacks to booters, when observed fromeither the victim’s or an amplifier’s perspective. This is non-trivial, as from thevictim’s perspective the attack seems to stem from the amplifiers. Similarly,from an amplifier’s perspective, the requests seem to be legitimate requests bythe victim (due to the use of spoofed source IP addresses by the booter). Whileultimately one would like to identify the customer, only the booter, amplifiers,and the victim are directly participating in an attack. Nonetheless, since thebooter has a business relation to the customer, pinpointing the booter behindan attack constitutes an important step towards this goal.
2.2 Ethical Considerations
As part of our study we subscribed to 23 booters and conducted a controlled setof self DDoS attacks. Furthermore, we also leveraged honeypots for amplificationattacks. We settled on this methodology for collecting a ground truth data set ofmappings between observed attacks and the services that launched these attacksafter finding that no data set available to us could be used to validate our DDoSattribution techniques. Before we began performing these self DDoS attacks wecarefully attempted to minimize the harms and maximize the benefits associatedwith our methodology based on observations from previous studies that launchself-attacks in order to measure booter’s attacks [7, 20].
We received an exemption from our Institutional Review Board (IRB), sinceour study did not include any personally identifiable information. In addition,we consulted with our institution’s general counsel, who advised us not to en-gage with any DDoS service that advertised using botnets and to cease activeengagement with any booter service that we realized was using botnets.
An analysis of TTL values observed by the honeypots indicated that it isunlikely any of the booter services we subscribed to used botnets. Based on theguidance of our institution’s general counsel, our victim server was connectedby a dedicated 1 Gbit/s network connection that was not shared with any otherservers. We also obtained consent from our ISP and their upstream peering pointsbefore conducting any DDoS attack experiments. We also minimized the attackdurations, notified our ISP before launching any attack and had a protocol inplace to end an attack early if it caused a disruption at our ISP.
We purchased subscriptions from 23 booter services. When doing so, we se-lected the cheapest option, which ranged from $6-$20 and averaged $12 permonth, to minimize the amount of money given to these services. In total, wespent less than $400 and no individual booter service received more than $40 inpayments as part of the measurements in this paper6. All payments were madeusing PayPal and we assumed that proper controls were put in place at PayPalto mitigate the risk of money flowing to extremist groups. As part of our designmethodology, we minimized the amount of money paid and targeted a small setof booters to obtain a valuable ground truth data set.
Our method created some harm to amplifiers and their upstream peeringpoints by consuming bandwidth resources. The largest amount of bandwidthconsumed was 984.5 kbit/s for NTP amplifiers and the least was 16.7 kbit/s forDNS amplifiers, similar to those reported in a previous study [7].
Over the course of our experiments we did not receive any complaints fromthe operators of these amplifiers. We limited our attacks to 30 seconds. Based onanalysis from a previous study that used a similar methodology [7], these shortduration attacks enable us to observe about 80% of the amplifiers used by agiven booter service and reduce the harm we cause to misconfigured amplifiers.
6 To put this into perspective: Previous studies of these booters have shown thatthey have thousands of paid subscribers and generate revenues of over $10,000 permonth [7, 19].
Similarly, the use of DDoS honeypots might also incur harm on the Inter-net. We used AmpPot, a honeypot proposed by Kraemer et al. [8]. To avoidcontributing to DDoS attacks, AmpPot limits the rate of requests and deploysautomatic IP blacklisting: The honeypots will stop responding for one hour toany IP address sending more than 10 requests per minute. This limits the max-imum amount of data sent to a DDoS victim to a few kilobytes. For a moredetailed ethical discussion on AmpPot we refer the reader to [8].
3 Amplification Attack Data Set
To investigate if and how amplification attacks can be attributed to their origi-nating booter service, we established two data sets that help us to gain insightsinto the overall amplification attacks, but also to find concrete attack instancescaused by individual booters. In Section 3.1, we describe how we leverage amplifi-cation honeypots to gain insights into global amplification attacks. In Section 3.2,we discuss how we use booters and launch controlled attacks against ourselvesto learn about attack techniques of certain attackers.
3.1 Honeypot Attacks
Although the general threat of amplification attacks has been known for years,actual attack insights are only documented in anecdotal evidence, such as at-tacks against Spamhaus or OVH at hundreds of Gbit/s attack volume. To col-lect insights into the set of global amplification attacks, we leverage data col-lected by AmpPot [8], a honeypot proposed by Kramer et al. AmpPot emulatesseven UDP-based protocols that have known amplification vectors and will thuseventually be abused as part of real-world DDoS amplification attacks (QOTD,CharGen, DNS, NTP, RIPv1, MSSQL, and SSDP). Kramer et al. observed thatattackers will eventually find such honeypots via Internet scans, and start abus-ing them as potential reflectors shortly thereafter. AmpPot thus serves as aneye on global amplification attacks, and due to the nature of the attack traffic,can also observe who is being attacked and when.
In December 2014, eleven globally-distributed honeypots with single staticIP addresses were deployed, and have been operated continuously since then.In November 2015, a twelfth honeypot was added, listening on 48 static IPaddresses. This honeypot employs a special feature named Selective Response,where each source scanning for amplifiers will find a unique set of 24 IP ad-dresses7 [10].
We set our analysis period to two months from December 9, 2015 to February10, 2016. In this period, the honeypots observed 570,738 amplification attacks(8,918 attacks per day on average). However, given that RIPv1, MSSQL, andQOTD combined account for less than 5% of these, we decided to exclude thoseprotocols from our analyses.
7 The idea behind this is to imprint a unique fingerprint on each scanner. Letting eachscanner find 24 IP addresses maximizes the total number of fingerprints.

Table 1: Covered booter services
AUR
BAN
BO1
BO2
BO3
CRI
DOW
EXI
EXO
KST
INB
NET
RAW
SER
STA
ST1
ST2
ST3
ST4
SYN
THU
VDO
WEB
CharGen 3 3 3 3 3 3 3 3 3 3 3 3 3 3 3
DNS 3 3 3 3 3 3 3 3 3 3 3 3 3 3 3 3 3
NTP 3 3 3 3 3 3 3 3 3 3 3 3 3 3 3 3 3 3 3 3 3 3
SSDP 3 3 3 3 3 3 3 3 3 3 3 3 3 3 3 3
3.2 Self-Attacks
The honeypots give us valuable insights into global attacks, but do not give usindications where the attacks were coming from. Previous studies have identifiedso-called booter services (“booters”) as being responsible for a large numberof amplification attacks [6, 7, 20]. In an attempt to learn attack characteristicsof these booters, we signed up at these services and then launched short-livedamplification attacks against a target in our control.
To start launching self-attacks and correlating them with the traffic seen atthe honeypots, our first task was to identify booter services to cover in the study.Absent a centralized location for finding booters, we located services via searchengines and advertisements on underground forums. We selected a total of 23services offering amplification attacks based on NTP, DNS, CharGen and SSDP.When selecting these booters, we tried to include services that we speculatedto be more stable and have more subscribers based on reviewing user feedbackon underground forums. To minimize the amount of money we paid to theseabusive services, we kept the number of covered booters relatively small.
Table 1 provides an overview of the booter services8 that we cover and theamplification attack types they offer. NTP was the most popular attack pro-tocol, followed by DNS. 16 of the 23 services clearly advertise malicious DDoSattacks. In contrast, seven services hide their malicious intention behind “stress-ing” services, a seemingly benign way to verify the resilience of a network againstDDoS attacks. However, not a single service performs any kind of attack targetvalidation. That is, service subscribers can specify any IP address (or domain)that should be attacked, regardless of whether the target is under the control ofthe client. This shows the clear malicious intention behind all 23 booter services.
Booter services maintain front-end sites that allow their customers to pur-chase subscriptions and launch attacks using simple web forms. We created cus-tom crawlers to automate the task of visiting the websites of covered bootersand launching attacks directed at our own target. Using this automation, dailyattacks were launched for each covered booter and attack type. A total of 13booter services were covered within the first week of starting the self-attacks onDecember 9, 2015 and by January 14, 2016 all 23 booters were covered.
8 To avoid unintentionally advertising booter services covered in this study, we replacethe name of booter services by the first three letters of their domain name. The lastletter is replaced by a number in the case of name collisions.
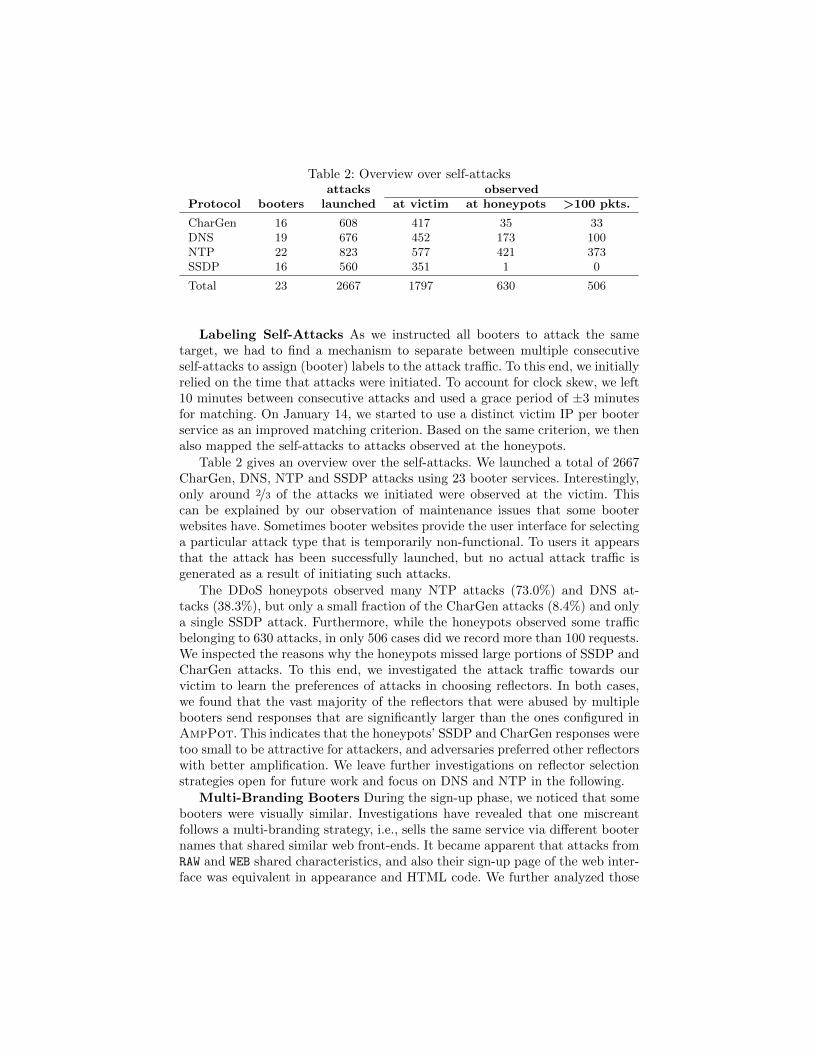
Table 2: Overview over self-attacksattacks observed
Protocol booters launched at victim at honeypots >100 pkts.
CharGen 16 608 417 35 33DNS 19 676 452 173 100NTP 22 823 577 421 373SSDP 16 560 351 1 0
Total 23 2667 1797 630 506
Labeling Self-Attacks As we instructed all booters to attack the sametarget, we had to find a mechanism to separate between multiple consecutiveself-attacks to assign (booter) labels to the attack traffic. To this end, we initiallyrelied on the time that attacks were initiated. To account for clock skew, we left10 minutes between consecutive attacks and used a grace period of ±3 minutesfor matching. On January 14, we started to use a distinct victim IP per booterservice as an improved matching criterion. Based on the same criterion, we thenalso mapped the self-attacks to attacks observed at the honeypots.
Table 2 gives an overview over the self-attacks. We launched a total of 2667CharGen, DNS, NTP and SSDP attacks using 23 booter services. Interestingly,only around 2/3 of the attacks we initiated were observed at the victim. Thiscan be explained by our observation of maintenance issues that some booterwebsites have. Sometimes booter websites provide the user interface for selectinga particular attack type that is temporarily non-functional. To users it appearsthat the attack has been successfully launched, but no actual attack traffic isgenerated as a result of initiating such attacks.
The DDoS honeypots observed many NTP attacks (73.0%) and DNS at-tacks (38.3%), but only a small fraction of the CharGen attacks (8.4%) and onlya single SSDP attack. Furthermore, while the honeypots observed some trafficbelonging to 630 attacks, in only 506 cases did we record more than 100 requests.We inspected the reasons why the honeypots missed large portions of SSDP andCharGen attacks. To this end, we investigated the attack traffic towards ourvictim to learn the preferences of attacks in choosing reflectors. In both cases,we found that the vast majority of the reflectors that were abused by multiplebooters send responses that are significantly larger than the ones configured inAmpPot. This indicates that the honeypots’ SSDP and CharGen responses weretoo small to be attractive for attackers, and adversaries preferred other reflectorswith better amplification. We leave further investigations on reflector selectionstrategies open for future work and focus on DNS and NTP in the following.
Multi-Branding Booters During the sign-up phase, we noticed that somebooters were visually similar. Investigations have revealed that one miscreantfollows a multi-branding strategy, i.e., sells the same service via different booternames that shared similar web front-ends. It became apparent that attacks fromRAW and WEB shared characteristics, and also their sign-up page of the web inter-face was equivalent in appearance and HTML code. We further analyzed those
two booters by launching application layer (layer 7) attacks against our victimserver. Layer 7 attacks usually abuse public HTTP proxy servers to hide theidentity of back-end servers involved. However, some proxies reveal the identityof the requesting clients in the X-Forwarded-For field of the HTTP header.Based on this observation, we were able to verify that these two booters usedshared back-end infrastructure. We thus conclude that RAW and WEB are likely tobe operated by the same individuals and will regard them as equivalent.
4 Characteristic Attack Features
We will now introduce characteristic attack patterns that we can use to train ourclassifier for attribution purposes. We first describe various characteristics thatwe have observed to repeat across subsets of attacks at the honeypots. We thendescribe how we leverage these observations as features to summarize attacks.
4.1 Attack Observations
While analyzing the attacks captured by the honeypots, we observed the follow-ing three properties that repeated across subsets of the attacks.
Honeypot Sets: Although eleven honeypots were active since the end of2014, few attacks (1.63%) abused all of them simultaneously. In fact, more than60% of all DNS- and NTP-based attacks abused five honeypots or less. Thisindicates that attackers either perform only partial scans of the Internet, orchoose a subset of the discovered amplifiers in subsequent attacks.
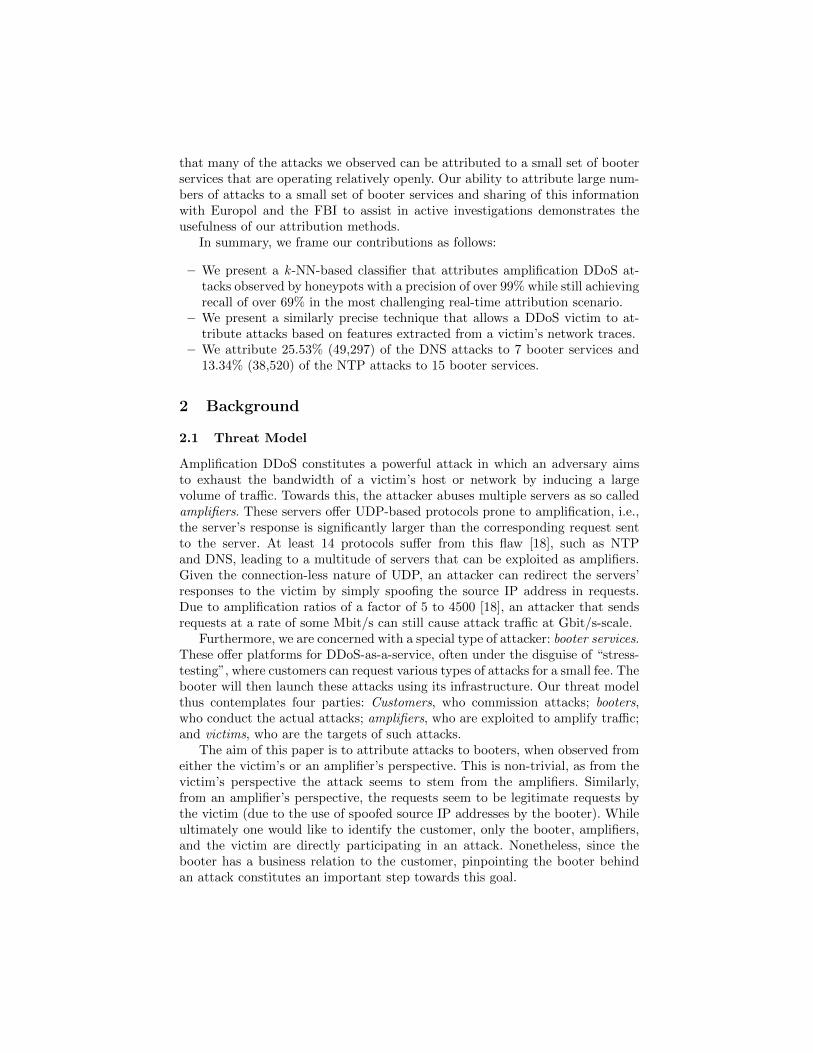
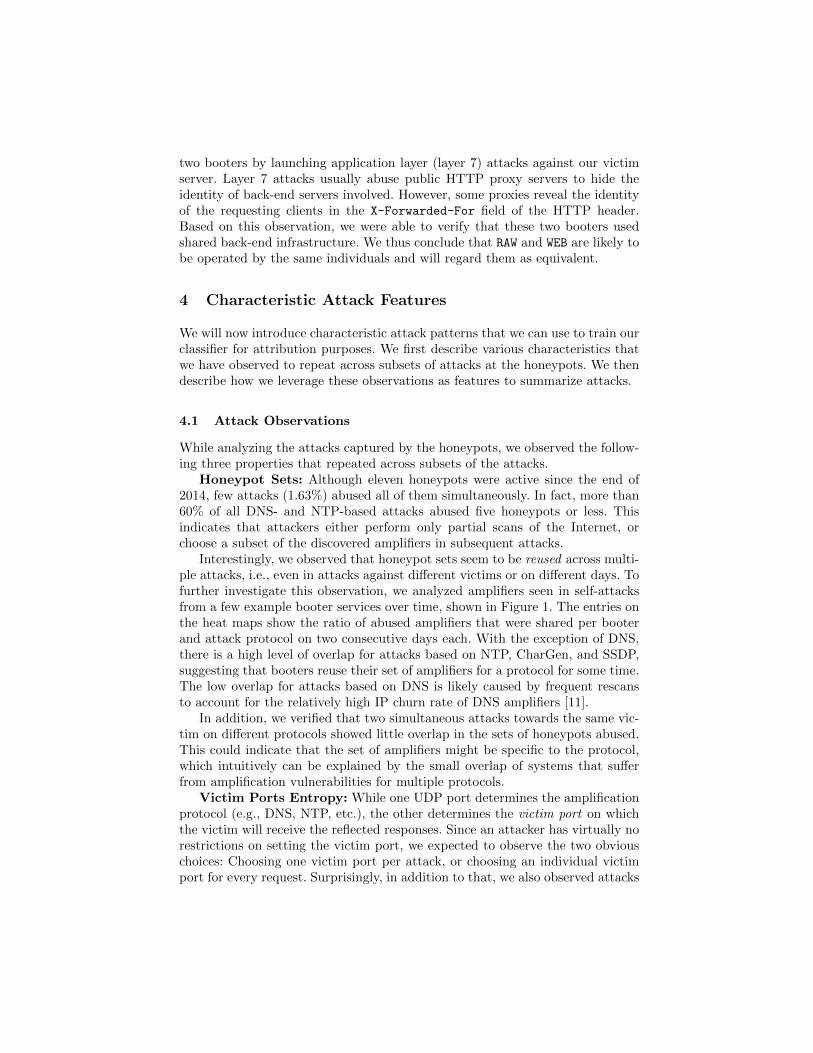
Interestingly, we observed that honeypot sets seem to be reused across multi-ple attacks, i.e., even in attacks against different victims or on different days. Tofurther investigate this observation, we analyzed amplifiers seen in self-attacksfrom a few example booter services over time, shown in Figure 1. The entries onthe heat maps show the ratio of abused amplifiers that were shared per booterand attack protocol on two consecutive days each. With the exception of DNS,there is a high level of overlap for attacks based on NTP, CharGen, and SSDP,suggesting that booters reuse their set of amplifiers for a protocol for some time.The low overlap for attacks based on DNS is likely caused by frequent rescansto account for the relatively high IP churn rate of DNS amplifiers [11].
In addition, we verified that two simultaneous attacks towards the same vic-tim on different protocols showed little overlap in the sets of honeypots abused.This could indicate that the set of amplifiers might be specific to the protocol,which intuitively can be explained by the small overlap of systems that sufferfrom amplification vulnerabilities for multiple protocols.
Victim Ports Entropy: While one UDP port determines the amplificationprotocol (e.g., DNS, NTP, etc.), the other determines the victim port on whichthe victim will receive the reflected responses. Since an attacker has virtually norestrictions on setting the victim port, we expected to observe the two obviouschoices: Choosing one victim port per attack, or choosing an individual victimport for every request. Surprisingly, in addition to that, we also observed attacks
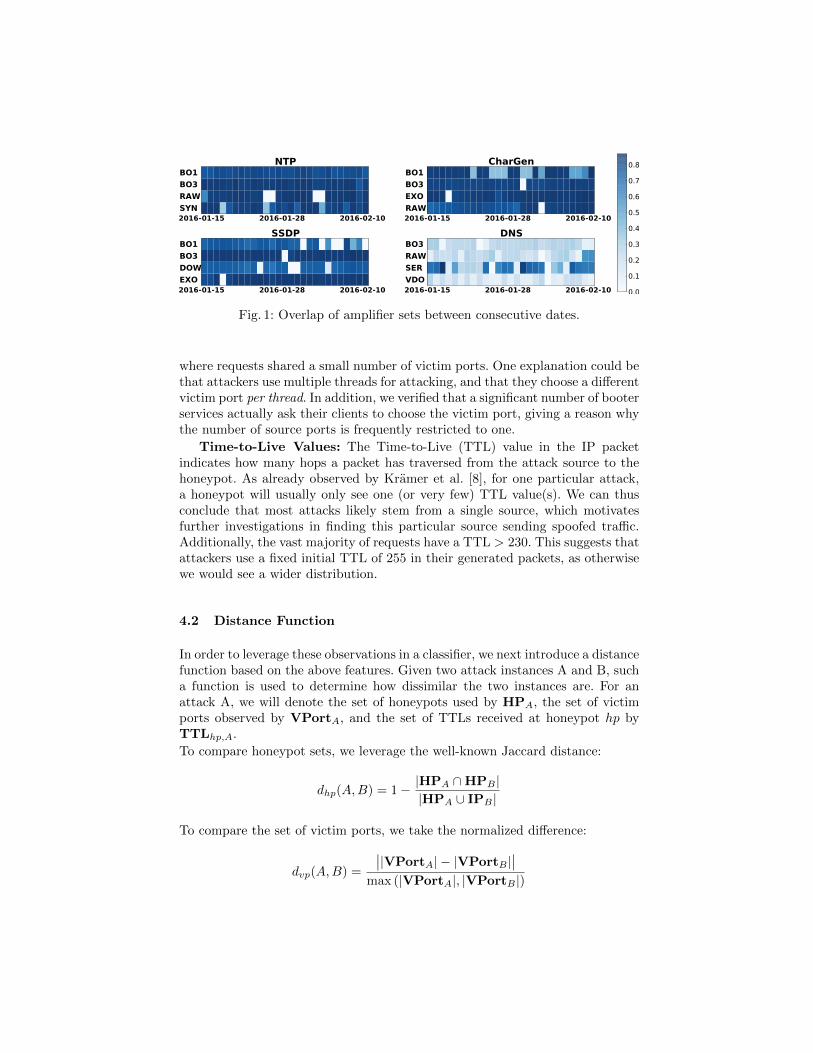
Fig. 1: Overlap of amplifier sets between consecutive dates.
where requests shared a small number of victim ports. One explanation could bethat attackers use multiple threads for attacking, and that they choose a differentvictim port per thread. In addition, we verified that a significant number of booterservices actually ask their clients to choose the victim port, giving a reason whythe number of source ports is frequently restricted to one.
Time-to-Live Values: The Time-to-Live (TTL) value in the IP packetindicates how many hops a packet has traversed from the attack source to thehoneypot. As already observed by Kramer et al. [8], for one particular attack,a honeypot will usually only see one (or very few) TTL value(s). We can thusconclude that most attacks likely stem from a single source, which motivatesfurther investigations in finding this particular source sending spoofed traffic.Additionally, the vast majority of requests have a TTL > 230. This suggests thatattackers use a fixed initial TTL of 255 in their generated packets, as otherwisewe would see a wider distribution.
4.2 Distance Function
In order to leverage these observations in a classifier, we next introduce a distancefunction based on the above features. Given two attack instances A and B, sucha function is used to determine how dissimilar the two instances are. For anattack A, we will denote the set of honeypots used by HPA, the set of victimports observed by VPortA, and the set of TTLs received at honeypot hp byTTLhp,A.
To compare honeypot sets, we leverage the well-known Jaccard distance:
dhp(A,B) = 1− |HPA ∩HPB ||HPA ∪ IPB |
To compare the set of victim ports, we take the normalized difference:
dvp(A,B) =
∣∣|VPortA| − |VPortB |∣∣
max (|VPortA|, |VPortB |)
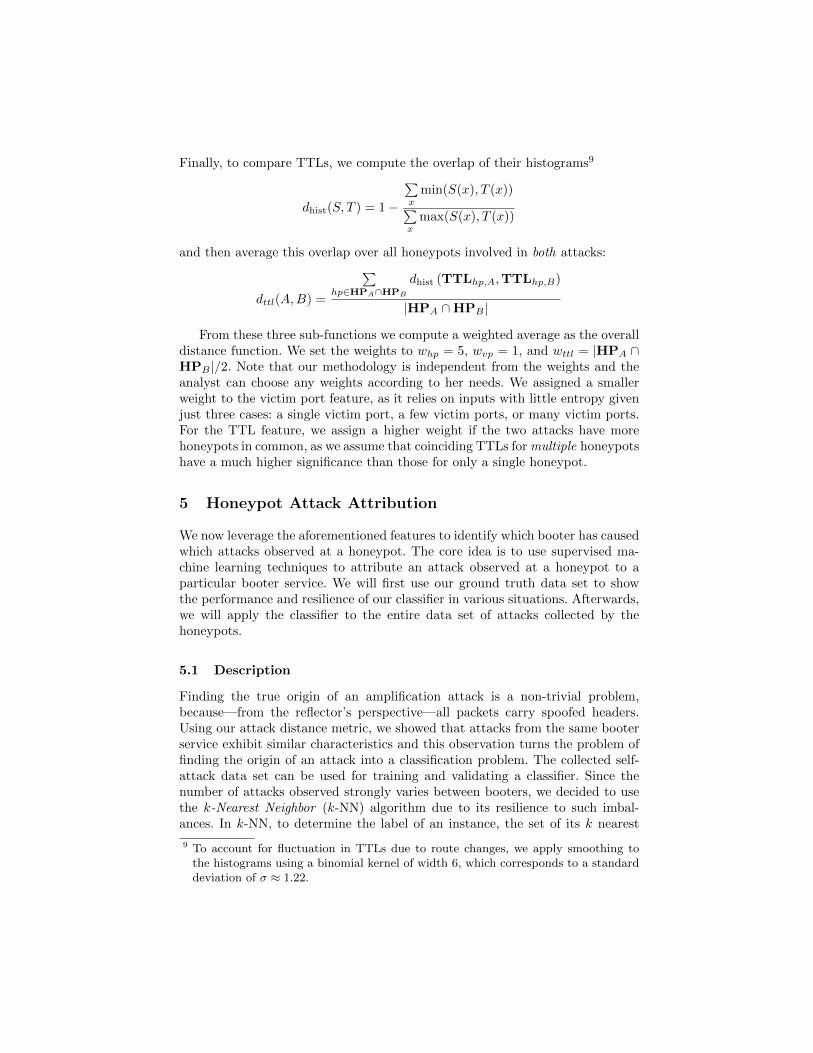
Finally, to compare TTLs, we compute the overlap of their histograms9
dhist(S, T ) = 1−
∑x
min(S(x), T (x))∑x
max(S(x), T (x))
and then average this overlap over all honeypots involved in both attacks:
dttl(A,B) =
∑hp∈HPA∩HPB
dhist (TTLhp,A,TTLhp,B)
|HPA ∩HPB |
From these three sub-functions we compute a weighted average as the overalldistance function. We set the weights to whp = 5, wvp = 1, and wttl = |HPA ∩HPB |/2. Note that our methodology is independent from the weights and theanalyst can choose any weights according to her needs. We assigned a smallerweight to the victim port feature, as it relies on inputs with little entropy givenjust three cases: a single victim port, a few victim ports, or many victim ports.For the TTL feature, we assign a higher weight if the two attacks have morehoneypots in common, as we assume that coinciding TTLs for multiple honeypotshave a much higher significance than those for only a single honeypot.
5 Honeypot Attack Attribution
We now leverage the aforementioned features to identify which booter has causedwhich attacks observed at a honeypot. The core idea is to use supervised ma-chine learning techniques to attribute an attack observed at a honeypot to aparticular booter service. We will first use our ground truth data set to showthe performance and resilience of our classifier in various situations. Afterwards,we will apply the classifier to the entire data set of attacks collected by thehoneypots.
5.1 Description
Finding the true origin of an amplification attack is a non-trivial problem,because—from the reflector’s perspective—all packets carry spoofed headers.Using our attack distance metric, we showed that attacks from the same booterservice exhibit similar characteristics and this observation turns the problem offinding the origin of an attack into a classification problem. The collected self-attack data set can be used for training and validating a classifier. Since thenumber of attacks observed strongly varies between booters, we decided to usethe k-Nearest Neighbor (k-NN) algorithm due to its resilience to such imbal-ances. In k-NN, to determine the label of an instance, the set of its k nearest
9 To account for fluctuation in TTLs due to route changes, we apply smoothing tothe histograms using a binomial kernel of width 6, which corresponds to a standarddeviation of σ ≈ 1.22.
neighbors is computed. Next, every neighbor casts a vote for its own label, andfinally the instance is given the label of the majority of its neighbors.
Additional care has to be taken, as our training data set is not exhaustiveand may miss data for some booters. That is, not all attacks can be attributedto a booter that we know. Therefore, we use a cutoff threshold t to introducea label for an unknown classification result. When classifying an item i, we onlyconsider the k nearest neighbors that can be found in the neighborhood of radiust centred around item i. If no item from the training data set lies within thisneighborhood, the item i is assigned the label unknown. To find a well-suited andconservative threshold, we analyzed our ground truth data set using our distancefunction and hierarchical clustering. From those clusters, we then computed theaverage distance between attacks within a cluster and took the 95th percentileover all. This results in t = 0.338 for DNS and t = 0.236 for NTP.
Furthermore, as shown in Section 4.1, booters rescan to find new lists ofamplifiers on a regular basis. To reflect this during classification, we only con-sider elements from the training data set no more than 7 days apart, whichapproximately corresponds to the maximum rescan frequency we observed forbooters.
When using k-NN, the choice of k is highly critical for the performance ofthe classifier. One common approach is to learn the value of k from the trainingdata set using n-fold cross-validation (CV). In n-fold CV, the training data setis partitioned into n equally sized sets. Then, the classifier is trained on n − 1of these sets, and the final set is used for validation. This process is repeated ntimes, until every set has been used as the validation set once. For finding k wethus perform 10-fold CV for all k ∈ {1, 3, 5} as part of the training phase of theclassifier. We restrict k to odd values to avoid ties in the voting phase. We onlyconsider k ≤ 5, because about 2/3 of the clusters contain less than five attacks.
To assess the performance of our classifier, we first define the false positiverate (FPR), precision and recall metrics, as well as macro-averaging. Intuitively,the FPR for a label li (in our case, a particular booter) is the fraction of elementsthat were incorrectly assigned the label li while their true label was not li. Ina similar vein, precision is the ratio with which the classifier was correct whenassigning label li, while recall is the ratio with which the classifier is able tore-identify elements with true label li. Let tpi be the number of items correctlyclassified to have label li (true positives), let tni be the number of items correctlyclassified to not have label li (true negatives), let fpi be the number of itemsincorrectly classified to have label li (false positives), and let fni be the numberof items incorrectly classified to not have label li (false negatives). Then the FPRis defined as fpri = fpi/(fpi + tni), precision as pi = tpi/(tpi + fpi), and recall asri = tpi/(tpi + fni). To compute overall performance measures from these per-class metrics, we employ macro-averaging, i.e., first computing fpr, p, and r perclass and averaging the respective results afterwards, as this will avoid bias dueto imbalance in our ground truth data. Thus booters for which we were able tocollect more datapoints do not influence the results more strongly. However, since
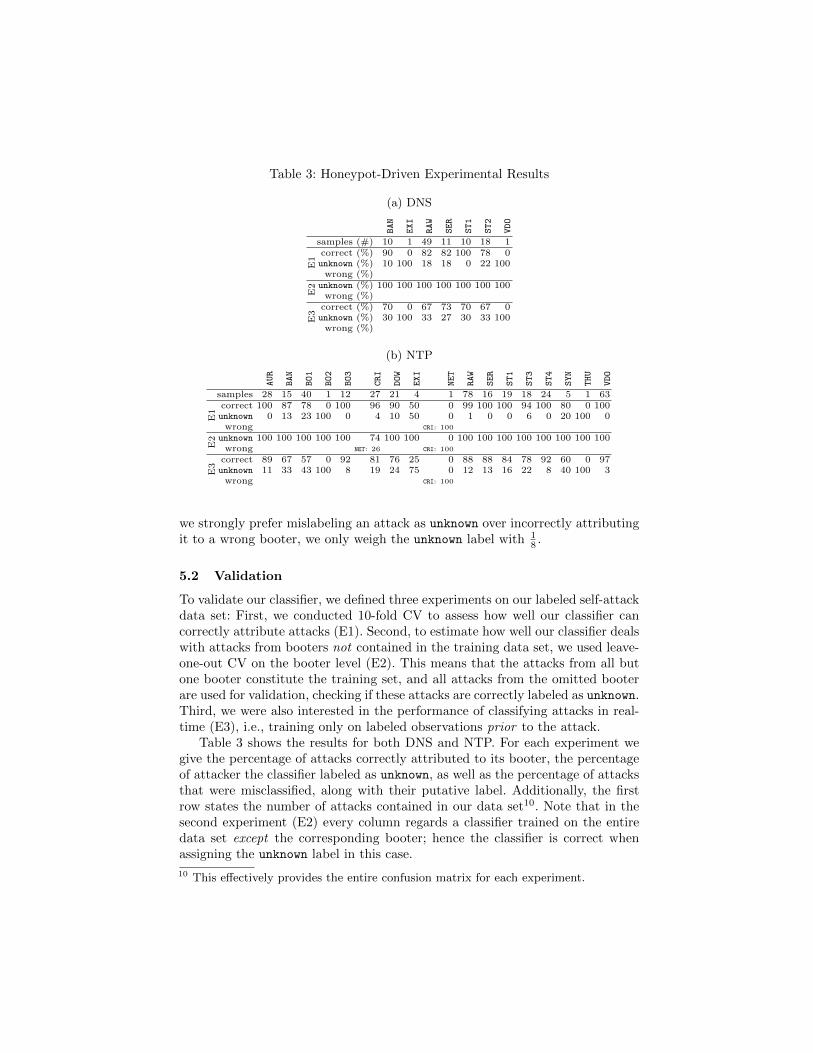
Table 3: Honeypot-Driven Experimental Results
(a) DNS
BAN
EXI
RAW
SER
ST1
ST2
VDO
samples (#) 10 1 49 11 10 18 1
E1
correct (%) 90 0 82 82 100 78 0unknown (%) 10 100 18 18 0 22 100wrong (%)
E2 unknown (%) 100 100 100 100 100 100 100
wrong (%)
E3
correct (%) 70 0 67 73 70 67 0unknown (%) 30 100 33 27 30 33 100wrong (%)
(b) NTP
AUR
BAN
BO1
BO2
BO3
CRI
DOW
EXI
NET
RAW
SER
ST1
ST3
ST4
SYN
THU
VDO
samples 28 15 40 1 12 27 21 4 1 78 16 19 18 24 5 1 63
E1
correct 100 87 78 0 100 96 90 50 0 99 100 100 94 100 80 0 100unknown 0 13 23 100 0 4 10 50 0 1 0 0 6 0 20 100 0wrong CRI: 100
E2 unknown 100 100 100 100 100 74 100 100 0 100 100 100 100 100 100 100 100
wrong NET: 26 CRI: 100
E3
correct 89 67 57 0 92 81 76 25 0 88 88 84 78 92 60 0 97unknown 11 33 43 100 8 19 24 75 0 12 13 16 22 8 40 100 3wrong CRI: 100
we strongly prefer mislabeling an attack as unknown over incorrectly attributingit to a wrong booter, we only weigh the unknown label with 1
8 .
5.2 Validation
To validate our classifier, we defined three experiments on our labeled self-attackdata set: First, we conducted 10-fold CV to assess how well our classifier cancorrectly attribute attacks (E1). Second, to estimate how well our classifier dealswith attacks from booters not contained in the training data set, we used leave-one-out CV on the booter level (E2). This means that the attacks from all butone booter constitute the training set, and all attacks from the omitted booterare used for validation, checking if these attacks are correctly labeled as unknown.Third, we were also interested in the performance of classifying attacks in real-time (E3), i.e., training only on labeled observations prior to the attack.
Table 3 shows the results for both DNS and NTP. For each experiment wegive the percentage of attacks correctly attributed to its booter, the percentageof attacker the classifier labeled as unknown, as well as the percentage of attacksthat were misclassified, along with their putative label. Additionally, the firstrow states the number of attacks contained in our data set10. Note that in thesecond experiment (E2) every column regards a classifier trained on the entiredata set except the corresponding booter; hence the classifier is correct whenassigning the unknown label in this case.
10 This effectively provides the entire confusion matrix for each experiment.
In the 10-fold CV (E1) our DNS classifier correctly attributed 78% or more ofthe attacks for each booter. Exceptions are the cases of EXI and VDO, for whichour data set only contains a single attack, which naturally cannot be attributedcorrectly due to lack of training data. All the remaining attacks were labeledas unknown. In fact, the DNS classifier never attributed an attack to a wrongbooter in all three experiments. This is especially remarkable in the leave-one-out scenario (E2), when the classifier was not trained on data for one of thebooters. That is, even in this case our classifier did not lead to false accusations,showing the resilience of the classifier against attacks stemming from bootersnot contained in the training set. Of course, this resilience comes at the cost ofhigher false negative rates in the other experiments (E1 & E3), as we prefer theclassifier to label an attack as unknown over attributing it to the wrong booter.This could possibly be alleviated by obtaining more training data per booter.The last experiment (E3) simulates the performance of the classifier in a real-time scenario, i.e., when classifying an attack only based on training data thatwas obtained prior to the attack. In contrast to this, the first experiment (E1)measured the performance when classifying attacks after the fact. Since bootersregularly rescan for amplifiers and update their set of amplifiers accordingly, ourclassifier will achieve a performance worse than in the first experiment (E1).However, even in the real-time attribution setting, we could still attribute atleast 67% of all attacks without any incorrect attributions. The loss comparedto E1 can be explained by the fact that the first attack of a booter can never becorrectly classified due to lack of prior training data.
In the case of NTP, we achieved an overall attribution rate of 78% or more inthe 10-fold CV (E1) for most booters, with the exception of those which occuronly once in the data set. Remarkably, the cases of EXI and SYN show that theclassifier also performs reasonably well even for small amounts of training data.The NTP classifier generates misclassifications. However, this only stems froma few attacks by NET and CRI, which exhibit precisely the same characteristics.While we suspect that NET and CRI share the same infrastructure, we were notable to verify this assumption by leveraging layer 7 attacks (as done previouslyfor RAW and WEB). The same two attacks are also the cause for the only mis-classifications in the leave-one-out scenario (E2), as about a quarter of attacksfrom CRI were attributed to NET, when the classifier was not trained on datafrom CRI. In the real-time scenario (E3), the NTP classifier attributed over 76%of the attacks in most cases, even outperforming the DNS classifier. Since NTPexperiences less amplifier churn, booters can use the same amplifier set for alonger period of time, i.e., an attack is more likely to use a set of amplifiers forwhich the classifier already observed a training sample. A notable exception hereis BO1, for which only 57% of the attacks could be attributed, despite the largenumber of attacks contained in the data set. This indicates that BO1 performsrescans more frequently than other booters.
Averaging over booters for which the data set contains more than one attack,our classifier achieves a macro-averaged precision of 100.00% and recall of 86.25%in E1 for DNS, and 99.74% and respectively 91.01% for NTP. In the case of
real-time attribution (E3), the precision stays similarly high (100.00% for DNS,99.69% for NTP), while the recall drops to 69.35% and respectively 76.73%.
5.3 Attribution
After validating the classification mechanism, we now turn to applying it to ourentire data set of attacks observed at the honeypots (excluding the self-attacks).Due to their low entropy, we excluded attacks that were only observed by asingle honeypot. This left 266,324 NTP-based and 161,925 DNS-based attacks.For both we trained our classifier on all self-attacks collected from December 9to February 10.
Our NTP classifier attributed 38,520 attacks (14.46%) to one of the bootersit was previously trained on and our DNS classifier attributed almost a third ofall attacks (49,297, 30.44%) to a booter. Note that not all attacks observed atthe honeypots have to be caused by booters; they can also be caused by malev-olent parties that do not offer their attack capabilities on an online platform.Furthermore, since we only trained our classifier on a limited set of booters, ourclassifier cannot possibly achieve a classification rate of 100%. Still, attributinga considerable amount of attacks to the booters of our training set indicates thatthe booters we considered are used very actively.
6 Victim-Driven Attack Attribution
Based on the success of the classifier that allows honeypot operators to attributeDDoS attacks, we now aim to build a similar classification method that willenable victims to attribute attacks based on features that can be extracted fromvictims’ network traces. The core idea is to isolate a set of features that aredirectly observable by the victim and that can precisely attribute attacks to aparticular booter service using a similar k -NN-classifier algorithm.
6.1 Description
Motivated by the fact that each booter abuses characteristic sets of amplifiers,we use the set of amplifiers as seen in the victim’s attack traces as a feature fortraining our victim-driven classifier. However, the TTL value of the attack sourceused in the honeypot operator attribution technique is not directly observable bya victim, so we cannot use this feature in our victim based attribution method.The loss of the TTL value feature is mostly compensated for by the victim beingable to see a larger set of amplifiers used by the booter service.
As we will show, this single feature is sufficient to build a classifier thatcan accurately attribute NTP, SSDP, and CharGen attacks from the victim’sperspective. The one exception is that the set of open DNS resolvers used byindividual booter services are less stable over time, likely due to churn. As aresult, relying on the set of amplifiers as the sole feature for classifying DNSattacks will not provide the same classification performance as for the other

three attack types. Therefore, we must identify additional entropy to improvethe accuracy of our victim-based DNS attack classification technique. Based onour analysis of DNS attack traces captured at our victim server, we noticed thateach booter service tends to send spoofed ANY requests for a very small numberof mostly non-overlapping domain names. We thus complement the feature ofamplifier sets with an additional feature over the set of domain names resolvedin DNS attacks. That is, for DNS, the Jaccard index is computed both for the setof amplifiers and for the set of resolved domains, and the similarity score is themean of the two computed Jaccard indices. For all other protocols (NTP, SSDP,and CharGen), we use the Jaccard index computed over the set of amplifiers.
In the victim-driven data set, all attacks are labeled with the booter serviceand we do not have any unknown attacks. However, we will evaluate the situationof unattributed attacks by performing the same E2 leave-one-out CV experimentas in Section 5.2. Given this, we select a cutoff threshold t to introduce a label foran unknown classification result that is used in the same way as in Section 5.2.We choose a conservative threshold of t = 0.55 for CharGen, t = 0.60 for DNS,t = 0.55 for NTP, and t = 0.45 for SSDP. In order to select the threshold value,the score of correct classifications and incorrect classifications were manuallychecked and a reasonably conservative value was selected for each attack type.Only attack instances in the training set for which the similarity score is no lessthan t were considered as potential neighbors. If no neighbor could be found fora test instance, it was classified as unknown.
6.2 Validation
To validate the results of our victim-driven classifier, we perform the same exper-iments as in Section 5.2. Table 4 shows the result of our victim-driven classifierexperiments for DNS and NTP11.
In E1, our DNS classifier achieved high attribution rates of 80% or more,except for BO2, EXI, EXO, and VDO, where a large fraction was also marked asunknown. However, in five cases the classifier also mistook attacks from onebooter as coming from another. The higher number of false positives for DNS isattributable to the less stable set of DNS amplifiers abused by booters. These re-sults are worse than those for the honeypot-driven classifier, possibly due to thefact that unlike organic sets of amplifiers, the honeypots do not churn over time.Misclassifications are even more prevalent in our E2 experiment, where in somecases the classifier confused over half of the attacks. While the number of mis-classifications could be reduced by lowering the cutoff threshold, this would alsocause a higher rate of unknown results in the other two experiments. Finally, inE3 the classifier shows similar performance compared to E1, with a slight degra-dation. However, this is expected, since if a booter service has just rescanned wewill have no training samples that match the current set of amplifiers.
For NTP the victim-driven classifier generally performs better than for DNS.In the 10-fold CV (E1), the classifier correctly attributed 71% or more of the
11 Results for CharGen and SSDP can be found in Section A.1.
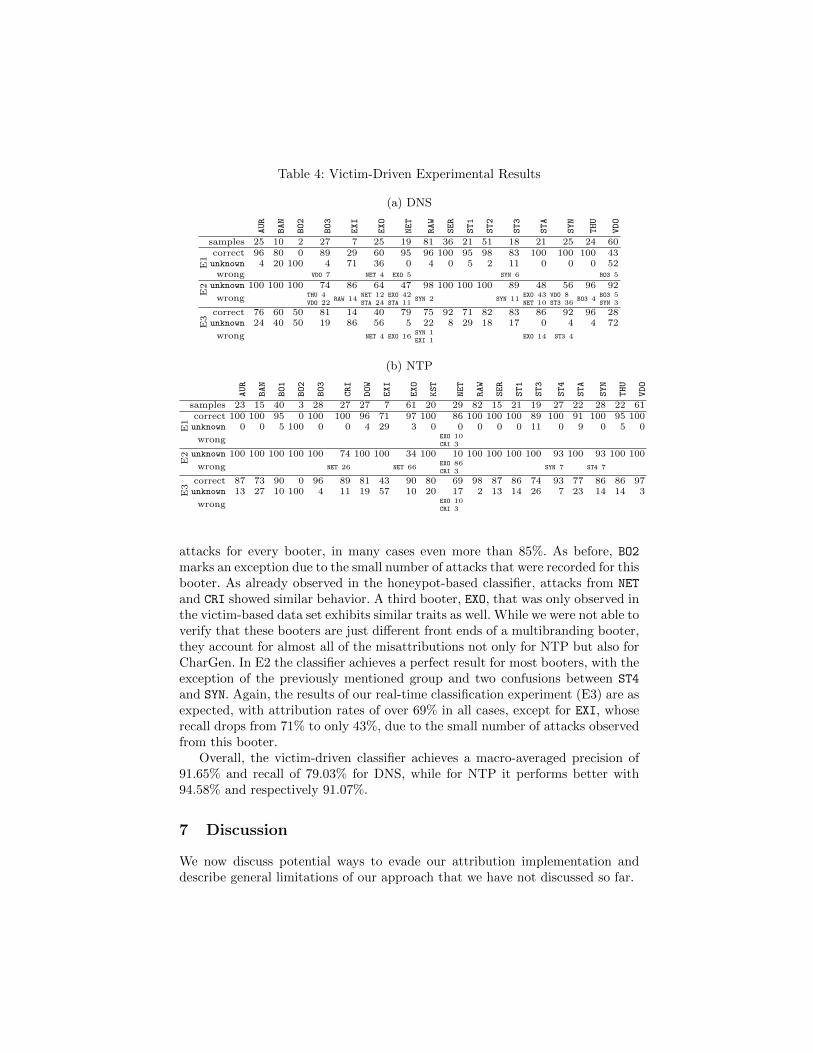
Table 4: Victim-Driven Experimental Results
(a) DNS
AUR
BAN
BO2
BO3
EXI
EXO
NET
RAW
SER
ST1
ST2
ST3
STA
SYN
THU
VDO
samples 25 10 2 27 7 25 19 81 36 21 51 18 21 25 24 60
E1
correct 96 80 0 89 29 60 95 96 100 95 98 83 100 100 100 43unknown 4 20 100 4 71 36 0 4 0 5 2 11 0 0 0 52wrong VDO 7 NET 4 EXO 5 SYN 6 BO3 5
E2 unknown 100 100 100 74 86 64 47 98 100 100 100 89 48 56 96 92
wrong THU 4VDO 22
RAW 14NET 12STA 24
EXO 42STA 11
SYN 2 SYN 11EXO 43NET 10
VDO 8ST3 36
BO3 4BO3 5SYN 3
E3
correct 76 60 50 81 14 40 79 75 92 71 82 83 86 92 96 28unknown 24 40 50 19 86 56 5 22 8 29 18 17 0 4 4 72
wrong NET 4 EXO 16SYN 1EXI 1
EXO 14 ST3 4
(b) NTP
AUR
BAN
BO1
BO2
BO3
CRI
DOW
EXI
EXO
KST
NET
RAW
SER
ST1
ST3
ST4
STA
SYN
THU
VDO
samples 23 15 40 3 28 27 27 7 61 20 29 82 15 21 19 27 22 28 22 61
E1
correct 100 100 95 0 100 100 96 71 97 100 86 100 100 100 89 100 91 100 95 100unknown 0 0 5 100 0 0 4 29 3 0 0 0 0 0 11 0 9 0 5 0
wrong EXO 10CRI 3
E2 unknown 100 100 100 100 100 74 100 100 34 100 10 100 100 100 100 93 100 93 100 100
wrong NET 26 NET 66EXO 86CRI 3
SYN 7 ST4 7
E3
correct 87 73 90 0 96 89 81 43 90 80 69 98 87 86 74 93 77 86 86 97unknown 13 27 10 100 4 11 19 57 10 20 17 2 13 14 26 7 23 14 14 3
wrong EXO 10CRI 3
attacks for every booter, in many cases even more than 85%. As before, BO2marks an exception due to the small number of attacks that were recorded for thisbooter. As already observed in the honeypot-based classifier, attacks from NET
and CRI showed similar behavior. A third booter, EXO, that was only observed inthe victim-based data set exhibits similar traits as well. While we were not able toverify that these booters are just different front ends of a multibranding booter,they account for almost all of the misattributions not only for NTP but also forCharGen. In E2 the classifier achieves a perfect result for most booters, with theexception of the previously mentioned group and two confusions between ST4
and SYN. Again, the results of our real-time classification experiment (E3) are asexpected, with attribution rates of over 69% in all cases, except for EXI, whoserecall drops from 71% to only 43%, due to the small number of attacks observedfrom this booter.
Overall, the victim-driven classifier achieves a macro-averaged precision of91.65% and recall of 79.03% for DNS, while for NTP it performs better with94.58% and respectively 91.07%.
7 Discussion
We now discuss potential ways to evade our attribution implementation anddescribe general limitations of our approach that we have not discussed so far.
7.1 Evasion
While our attribution methods have proven to work well as of now, they maybe susceptible to evasion attempts by miscreants. A mimicry attacker could tryto be attributed as someone else by following our methodology, i.e., learning theattack profile of another booter and copying its behavior. For example, she coulduse the same set of reflectors as the other booter for her own attacks. However,this involves a significant increase in terms of effort in comparison to Internet-wide scans. In addition, our TTL-based features are much harder to copy, asthey encode the location of the booter service and are subject to changes forother booter locations. While such mimicry attacks are possible [2], given thecomplexity and overhead, we do not believe that attackers trying to trigger afalse attribution constitute an actual risk in practice. For similar arguments,attackers that share lists of reflectors with each other would partially poison ouranalysis, but again TTL-based attribution may be safe against this. Our use ofthe set of domain names resolved as a feature for our victim-driven DNS classifiercan be evaded by booter services selecting a larger pool of domain names thatresult in large replies and cycling through this pool.
An evasive attacker could try to evade our classification mechanisms. Attack-ers have full control over the traffic they generate, and thus could add noise. Forexample, one could randomize the set of reflectors used in the attacks, or spoofthe initial TTL value within a range of possible values. It is unclear if a classifiercould still keep up with such evasion attempts, but it may be possible to addadditional features to enrich the classification, such as other characteristics (e.g.,IP packet IDs, DNS transaction IDs), as those have shown characteristic pat-terns even if they were randomized [8]. In addition, honeypots that selectivelyrespond to scan requests may survive such randomization [10]. Even if attackersrandomize the set of reflectors, any subset will still be a subset of a unique map-ping to a scanner. Lastly, randomizing the traffic does also incur a performanceoverhead to attackers, as they cannot reuse pre-generated packets.
Finally, attackers could try to map out the honey amplifiers using probingmessages [3] if the honeypot amplifier data was made public for the DDoS serviceto use as an oracle. To avoid this evasion technique, access to the honeypotamplifier data is restricted to vetted entities, such as researchers and LEAs.
7.2 Limitations
Our in-the-wild experiments faced some limitations, as discussed in the following:Honeypot Coverage: Regardless of our attempts to maximize the coverage
of the honeypots, they missed significant fractions of the self-attacks, especiallyfor SSDP and CharGen. This can be addressed by framing larger emulated re-sponses to make the honeypots more attractive to attackers. The coverage fortwo of the main protocols, DNS and NTP, was significant, though, coveringabout 57% of the self-attacks. We therefore argue that our results are represen-tative at least for these two protocols. In addition, there is no limitation of ourmethodology that would restrict its applicability to the two well-tested protocols.

Multi-Source Attribution: We assumed that attacks are caused by singlesources (booters). If botnets launched amplification attacks, our features (e.g.,TTL) would be unstable. To give an upper bound of attacks launched by botnets,we searched for attacks with several TTL values, as this—among other reasons—might be caused by distributed traffic sources. Less than 9.5% of attacks at thehoneypots show more than 2 TTL values at a honeypot.
Other Attacks: Other types of DDoS attacks, such as SYN flooding orHTTP-based attacks, do not use reflectors and are thus not traceable with ourproposed methods. Note that amplification attacks constitute the most commonbandwidth exhaustion attack. This is also demonstrated by the fact that allbooters advertise amplification attacks, while support for other attack types(e.g., HTTP-based attacks) is far less popular. To put things into perspective:we observed more than 8,900 amplification attacks per day.
8 Related Work
The general risk of amplification attacks was first illustrated in Paxon’s seminalpaper on reflection attacks [15] and then by Rossow’s recent overview of am-plification vulnerabilities in 14 UDP-based network protocols [18]. A wealth offurther work analyzed amplification attacks, such as attempts to monitor and re-duce the number of reflectors [1,4,11], analyses on detailed amplification vectorsin specific protocols [4,12,24–26], studies on the impact of DDoS attacks [29], andproposals to detect and defend against amplification DDoS attacks [5, 9, 18,28].
Orthogonal to these studies, we investigated ways to perform attributionfor amplification DDoS attacks. While concepts for closing the root cause ofamplification attacks (IP spoofing) are well-known [14], little success has beenmade in identifying the spoofing sources. Our work thus constitutes an importantelement for law enforcement to identify and act upon information of booterservices that are responsible for the majority of attacks. We follow a similar goalto IP traceback mechanisms [16,21–23,30], i.e., to find the source of “bad” (suchas spoofed) traffic. While we also aim to reveal the source of the bad traffic, wefocus on attack services rather than locating the networks that cause the traffic.In addition, the working principles behind the methods are inherently different.Most IP traceback methods are deterministic and can be guaranteed to find thecorrect source of traffic. However, at the same time, they impose requirementsthat are often not met in practice, such as that providers have to mark IPpackets or collaborate to find traffic paths. In contrast, our proposed mechanismadvances the field in that we do not require such a collaborative effort. In fact,despite being known for decades, automated traceback mechanisms have notbeen deployed by many providers. To tackle this problem, our approach merelyrequires a set of honeypots that anybody can set up, enabling a single partyto perform attribution. On the other hand, our approach is limited to mappingamplification attacks to booter services, whereas traceback mechanisms couldtrace back any type of DoS traffic—down to the network that caused it.
Closely related to our work is AmpPot, as proposed by Kramer et al. [8]. Thishoneypot technology has enabled us to monitor thousands of DDoS attacks perday. We combine such data with observations of attack traffic emitted by booters,introducing the new concept of attributing amplification attacks to booters.
Our work was motivated by various research papers that shed light ontobooter services using forensic analyses. Karami and McCoy were the first to mon-itor such booter services, studying the adversarial DDoS-As-a-Service concept [6]and observing that booters are a source for amplification attacks. Similarly, San-tanna et al. analyze leaked databases and payment methods of 15 booters [19].Related to our idea to fingerprint booters, Santanna et al. performed self-attacksof 14 booter services and also observed that the set of reflectors chosen by boot-ers may have overlap across attacks [20]. We build upon this observation, findfurther correlations for attacks of booter services, and propose to use theses forattack attribution. Karami et al. [7] provide a detailed view on the subscribersand victims of three booters. They provide early attempts to map the infras-tructures of booters, but do not perform any kind of attribution between attacksand booters or infrastructures.
Wang et al. [27] have studied the dynamics of attack sources of DDoS botnets,showing distinct patterns per botnet. While the authors provide first results thatmight enable them to predict future attack sources, they do not further investi-gate this matter. Our work is different in motivation and techniques in multiplerespects. First, booters follow a completely different methodology than DDoSbotnets, which rarely use IP spoofing. Second, we can leverage the observationthat attackers scan for “attack sources” (amplifiers). Third, we perform attackattribution rather than prediction.
Recently, Krupp et al. [10] showed how to uncover the scan infrastructuresbehind amplification DDoS attacks, which in some cases could also be identifiedto be the attacking infrastructure. Although their work might seem similar toours at first, there are key differences both in the goal and the methodology:While they use probabilistic reasoning to identify the scanners that provide thenecessary reconnaissance for attacks, we use machine learning techniques to linkattacks to the originating booters. Moreover, both approaches serve differentdemands: while their work aids in adding pressure on providers to cease illegalactivities, our paper helps to generate forensic evidence that a particular booterhas caused a specific attack, which can prove useful in prosecution.
9 Conclusion
Our work presented the first deep exploration of techniques for attributing am-plification DDoS attacks to booter services. We present two precise attributiontechniques based on carefully chosen features as part of a k -NN classifier. Inorder to evaluate the effectiveness of our techniques, we subscribed to a smallset of booter services and launched self-attacks to collect a ground truth setof attack-to-booter-service mappings. We discuss the ethical framework used tocollect this data set, which is similar to that of a previous study [7].
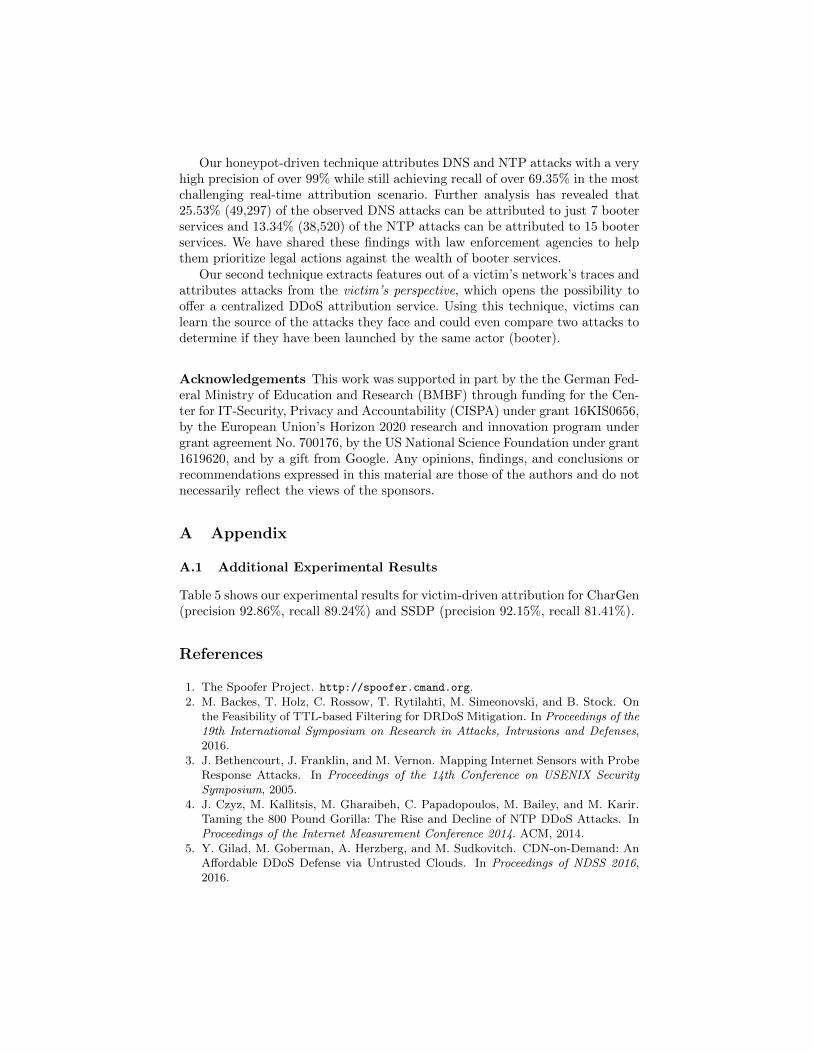
Our honeypot-driven technique attributes DNS and NTP attacks with a veryhigh precision of over 99% while still achieving recall of over 69.35% in the mostchallenging real-time attribution scenario. Further analysis has revealed that25.53% (49,297) of the observed DNS attacks can be attributed to just 7 booterservices and 13.34% (38,520) of the NTP attacks can be attributed to 15 booterservices. We have shared these findings with law enforcement agencies to helpthem prioritize legal actions against the wealth of booter services.
Our second technique extracts features out of a victim’s network’s traces andattributes attacks from the victim’s perspective, which opens the possibility tooffer a centralized DDoS attribution service. Using this technique, victims canlearn the source of the attacks they face and could even compare two attacks todetermine if they have been launched by the same actor (booter).
Acknowledgements This work was supported in part by the the German Fed-eral Ministry of Education and Research (BMBF) through funding for the Cen-ter for IT-Security, Privacy and Accountability (CISPA) under grant 16KIS0656,by the European Union’s Horizon 2020 research and innovation program undergrant agreement No. 700176, by the US National Science Foundation under grant1619620, and by a gift from Google. Any opinions, findings, and conclusions orrecommendations expressed in this material are those of the authors and do notnecessarily reflect the views of the sponsors.
A Appendix
A.1 Additional Experimental Results
Table 5 shows our experimental results for victim-driven attribution for CharGen(precision 92.86%, recall 89.24%) and SSDP (precision 92.15%, recall 81.41%).
References
1. The Spoofer Project. http://spoofer.cmand.org.2. M. Backes, T. Holz, C. Rossow, T. Rytilahti, M. Simeonovski, and B. Stock. On
the Feasibility of TTL-based Filtering for DRDoS Mitigation. In Proceedings of the19th International Symposium on Research in Attacks, Intrusions and Defenses,2016.
3. J. Bethencourt, J. Franklin, and M. Vernon. Mapping Internet Sensors with ProbeResponse Attacks. In Proceedings of the 14th Conference on USENIX SecuritySymposium, 2005.
4. J. Czyz, M. Kallitsis, M. Gharaibeh, C. Papadopoulos, M. Bailey, and M. Karir.Taming the 800 Pound Gorilla: The Rise and Decline of NTP DDoS Attacks. InProceedings of the Internet Measurement Conference 2014. ACM, 2014.
5. Y. Gilad, M. Goberman, A. Herzberg, and M. Sudkovitch. CDN-on-Demand: AnAffordable DDoS Defense via Untrusted Clouds. In Proceedings of NDSS 2016,2016.
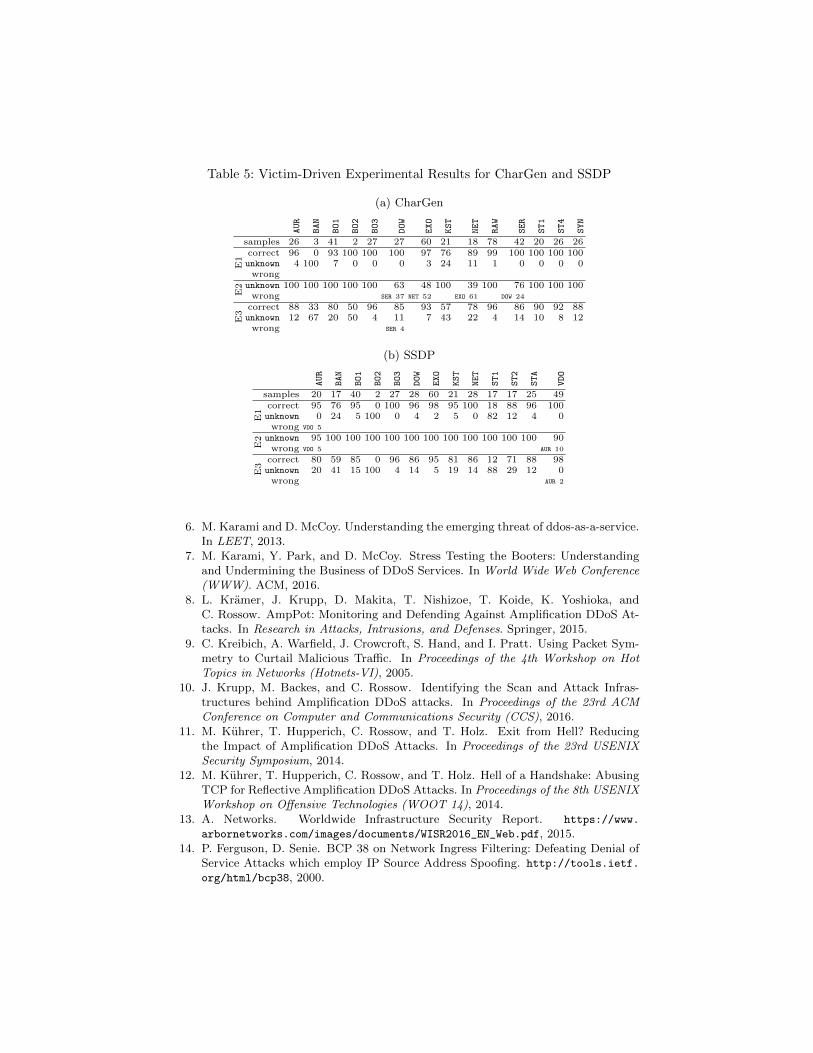
Table 5: Victim-Driven Experimental Results for CharGen and SSDP
(a) CharGen
AUR
BAN
BO1
BO2
BO3
DOW
EXO
KST
NET
RAW
SER
ST1
ST4
SYN
samples 26 3 41 2 27 27 60 21 18 78 42 20 26 26E1
correct 96 0 93 100 100 100 97 76 89 99 100 100 100 100unknown 4 100 7 0 0 0 3 24 11 1 0 0 0 0wrong
E2 unknown 100 100 100 100 100 63 48 100 39 100 76 100 100 100
wrong SER 37 NET 52 EXO 61 DOW 24
E3
correct 88 33 80 50 96 85 93 57 78 96 86 90 92 88unknown 12 67 20 50 4 11 7 43 22 4 14 10 8 12wrong SER 4
(b) SSDP
AUR
BAN
BO1
BO2
BO3
DOW
EXO
KST
NET
ST1
ST2
STA
VDO
samples 20 17 40 2 27 28 60 21 28 17 17 25 49
E1
correct 95 76 95 0 100 96 98 95 100 18 88 96 100unknown 0 24 5 100 0 4 2 5 0 82 12 4 0wrong VDO 5
E2 unknown 95 100 100 100 100 100 100 100 100 100 100 100 90
wrong VDO 5 AUR 10
E3
correct 80 59 85 0 96 86 95 81 86 12 71 88 98unknown 20 41 15 100 4 14 5 19 14 88 29 12 0wrong AUR 2
6. M. Karami and D. McCoy. Understanding the emerging threat of ddos-as-a-service.In LEET, 2013.
7. M. Karami, Y. Park, and D. McCoy. Stress Testing the Booters: Understandingand Undermining the Business of DDoS Services. In World Wide Web Conference(WWW). ACM, 2016.
8. L. Kramer, J. Krupp, D. Makita, T. Nishizoe, T. Koide, K. Yoshioka, andC. Rossow. AmpPot: Monitoring and Defending Against Amplification DDoS At-tacks. In Research in Attacks, Intrusions, and Defenses. Springer, 2015.
9. C. Kreibich, A. Warfield, J. Crowcroft, S. Hand, and I. Pratt. Using Packet Sym-metry to Curtail Malicious Traffic. In Proceedings of the 4th Workshop on HotTopics in Networks (Hotnets-VI), 2005.
10. J. Krupp, M. Backes, and C. Rossow. Identifying the Scan and Attack Infras-tructures behind Amplification DDoS attacks. In Proceedings of the 23rd ACMConference on Computer and Communications Security (CCS), 2016.
11. M. Kuhrer, T. Hupperich, C. Rossow, and T. Holz. Exit from Hell? Reducingthe Impact of Amplification DDoS Attacks. In Proceedings of the 23rd USENIXSecurity Symposium, 2014.
12. M. Kuhrer, T. Hupperich, C. Rossow, and T. Holz. Hell of a Handshake: AbusingTCP for Reflective Amplification DDoS Attacks. In Proceedings of the 8th USENIXWorkshop on Offensive Technologies (WOOT 14), 2014.
13. A. Networks. Worldwide Infrastructure Security Report. https://www.
arbornetworks.com/images/documents/WISR2016_EN_Web.pdf, 2015.14. P. Ferguson, D. Senie. BCP 38 on Network Ingress Filtering: Defeating Denial of
Service Attacks which employ IP Source Address Spoofing. http://tools.ietf.
org/html/bcp38, 2000.

15. V. Paxson. An Analysis of Using Reflectors for Distributed Denial-of-Service At-tacks. In Computer Communication Review, 2001.
16. A. Perrig, D. Song, and A. Yaar. StackPi: A New Defense Mechanism against IPSpoofing and DDoS Attacks. Technical report, 2003.
17. M. Prince. The DDoS That Almost Broke the Internet. https://blog.
cloudflare.com/the-ddos-that-almost-broke-the-internet/, 2013.18. C. Rossow. Amplification Hell: Revisiting Network Protocols for DDoS Abuse. In
Proceedings of NDSS 2014, 2014.19. J. Santanna, R. Durban, A. Sperotto, and A. Pras. Inside Booters: An Analysis on
Operational Databases. In 14th IFIP/IEEE International Symposium on IntegratedNetwork Management (IM), 2015.
20. J. J. Santanna, R. van Rijswijk-Deij, R. Hofstede, A. Sperotto, M. Wierbosch,L. Z. Granville, and A. Pras. Booters - An Analysis of DDoS-As-a-Service Attacks.In 14th IFIP/IEEE International Symposium on Integrated Network Management(IM), 2015.
21. S. Savage, D. Wetherall, A. Karlin, and T. Anderson. Practical Network Sup-port for IP Traceback. In ACM SIGCOMM Computer Communication Review,volume 30. ACM, 2000.
22. A. C. Snoeren, C. Partridge, L. A. Sanchez, C. E. Jones, F. Tchakountio, S. T.Kent, and W. T. Strayer. Hash-Based IP Traceback. In ACM SIGCOMM Com-puter Communication Review, volume 31. ACM, 2001.
23. D. X. Song and A. Perrig. Advanced and Authenticated Marking Schemes forIP Traceback. In Proceedings of the 20th Annual Joint Conference of the IEEEComputer and Communications Societies. IEEE, 2001.
24. X. Sun, R. Torres, and S. Rao. DDoS Attacks by Subverting Membership Man-agement in P2P systems. In Proceedings of the 3rd IEEE Workshop on SecureNetwork Protocols (NPSec), 2007.
25. X. Sun, R. Torres, and S. Rao. On the Feasibility of Exploiting P2P Systems toLaunch DDoS Attacks. In Journal of Peer-to-Peer Networking and Applications,volume 3, 2010.
26. R. van Rijswijk-Deij, A. Sperotto, and A. Pras. DNSSEC and its potential forDDoS attacks - a comprehensive measurement study. In Proceedings of the InternetMeasurement Conference 2014. ACM, 2014.
27. A. Wang, A. Mohaisen, W. Chang, and S. Chen. Capturing DDoS Attack DynamicsBehind the Scenes. In Detection of Intrusions and Malware, and VulnerabilityAssessment. Springer, 2015.
28. X. Wang and M. K. Reiter. Mitigating Bandwidth-Exhaustion Attacks UsingCongestion Puzzles. In Proceedings of the 11th ACM Conference on Computer andCommunications Security (CCS), 2004.
29. A. Welzel, C. Rossow, and H. Bos. On Measuring the Impact of DDoS Botnets. InProceedings of the 7th European Workshop on Systems Security (EuroSec), 2014.
30. A. Yaar, A. Perrig, and D. Song. Pi: A Path Identification Mechanism to Defendagainst DDoS Attacks. In Proceedings of the IEEE Symposium on Security andPrivacy (S&P), 2003.