linking band-limited cortical activity to fmri and...
TRANSCRIPT

This chapter addresses the relationship of band-
limited electrophysiological mass activity to behav-
ior on the one hand, and to the BOLD fMRI signal
on the other. Electrophysiological mass activity
generally re!ects several different components of
neuronal activity, which are generated by distinct
neural mechanisms and expressed in different fre-
quency ranges. The relative strengths of these
components thus determine a so-called speci"c
spectral "ngerprint of a perceptual or cognitive
process. A striking discrepancy between the spec-
tral "ngerprint of stimulus-driven responses in sen-
sory cortices and the "ngerprints of intrinsic proc-
esses (such as top-down attention or switches be-
tween perceptual states) within the same cortical
areas is highlighted. It is proposed that this disso-
ciation re!ects recurrent interactions between dis-
tant cortical areas and/or neuromodulation of corti-
cal activity patterns by ascending systems, which
are both thought to play an important role in such
processes.
Introduction
Since the discovery of the electroencephalographam (EEG), it has been possible to measure neural mass activity with millisecond temporal resolution (Nunez and Srinivasan, 2006). Nowadays, neural population signals can be re-corded at various spatial scales, using microelectrodes (measuring the local !eld potential, LFP), subdural surface electrodes (electrocorticography, ECoG), extracranial scalp electrodes (EEG), or magnetic !eld sensors (magnetoen-cephalography, MEG). Spectral analysis uncovers compo-nents of such population signals, which are “induced” by, but not necessarily “phase-locked” to, external events, such as stimulus onsets or motor responses (Pfurtscheller and Lopes da Silva, 1999; Tallon-Baudry and Bertrand, 1999).
Spectral analysis has primarily been used to character-ize oscillatory patterns in the ongoing EEG (Dietsch, 1932;
Grass and Gibbs, 1938). By contrast, studies of stimulus- and task-related EEG responses have long been dominated by the event-related potential (ERP) technique (Luck, 2005). is technique is based on averaging signal wave-forms in the time domain across repeats of an external event, thereby isolating neural response components phase-locked to the event of interest. ese response components are typically transient, lasting a few hundred milliseconds from the event. e rationale is to isolate the “signal” of interest from the “noise.” However, neural responses to external stimulus and task events also re#ect more sus-tained components.
We argue that, because the spectral analysis approach also captures sustained, non-phase-locked signal compo-nents, it is ideally suited for relating stimulus- and task-related neural mass activity to perception and cognition. First, many perceptual and cognitive processes (e.g., atten-tion, short-term memory, and decision-making) unfold over time scales longer than the event-related potential. Second, these processes are not directly driven by external events, but emerge from recurrent network interactions within the brain. Such processes are thus likely to manifest themselves in the non-phase-locked neural response com-ponents. ird, investigating neural activity in the fre-quency domain may provide critical insights into the mechanisms underlying cognitive processes: Different mechanisms are oen accompanied by different patterns of oscillatory neural activity (Buzsaki and Draguhn, 2004; Sejnowski and Paulsen, 2006; Steriade, 2000; Wang, 2003). For these reasons, we have recently witnessed an increasing use of spectral analysis in LFP studies in animals and in EEG and MEG studies in humans. is trend has led to an encouraging degree of convergence between these different levels of observation.
For the same reasons, we argue that spectral analysis is the prime approach for relating electrophysiological mass activity to the blood oxygenation level dependent (BOLD) contrast signal (Ogawa et al., 1990), the current mainstay of functional magnetic resonance imaging (fMRI). fMRI has proven to be an extraordinarily useful tool for identifying
Siegel M and Donner TH, Linking Band-Limited Cortical Activity to fMRI and Behavior. In: Ullsperger, M and Debener S. Simultaneous EEG and fMRI - Recording, Analysis, and Application. New York: Oxford University Press, 2010.
1http://dx.doi.org/10.1093/acprof:oso/9780195372731.001.0001
Linking Band-Limited Cortical Activity to fMRI and Behavior Markus Siegel1,2 and Tobias H. Donner3
1 The Picower Institute for Learning and Memory, Massachusetts Institute of Technology, Cambridge, MA 02139, USA ([email protected])2 Werner Reichardt Centre for Integrative Neuroscience, University of Tübingen, 72076 Tübingen, Germany3 Department of Psychology, University of Amsterdam, 1018 WB Amsterdam, The Netherlands ([email protected])

the large-scale cortical networks engaged in a variety of higher brain functions, including such seemingly elusive ones as attention, awareness, and decision-making (Cor-betta and Shulman, 2002; Haynes and Rees, 2006; Heekeren et al., 2008; Kanwisher and Wojciulik, 2000; Kastner and Ungerleider, 2000). Cognitive neuroscience could make a major step forward if we knew how to link electrophysio-logical and fMRI signals measured during perception and cognition.
In this chapter, we will !rst address the question of how electrophysiological population signals are linked to sen-sory and cognitive processing. We review a wide range of studies all suggesting that such links are typically frequency-speci!c. We will refer to these links as the “spec-tral !ngerprints” of the functional processes in a given brain region. We highlight that different classes of processes (and maybe even different classes of brain regions) seem to have remarkably different spectral !ngerprints, a fact that is oen overlooked. For example, stimulus-driven activity in sensory cortices generally seems to have a simple spectral !ngerprint, the network mechanisms of which are becom-ing increasingly clear. By contrast, the spectral !ngerprints of intrinsic, cognitive processes (such as “top-down” atten-tion or switches between different perceptual states) in the same sensory regions appear to be more complex, and their underlying mechanisms are as yet elusive. We speculate that the reason for this discrepancy is that the latter kind of processes involve stronger recurrent network interactions between distant brain areas and/or neuromodulation1 of cortical processing by ascending brainstem systems.
Second, we will discuss how the electrophysiological population signals relate to the fMRI signal. Many previous discussions of the relationship between invasive electro-physiology and the fMRI signal (e.g., Heeger and Ress, 2002; Lauritzen, 2005; Logothetis, 2008; Logothetis and Wandell, 2004) have focused on the question which aspect of neuronal activity (spiking vs. synaptic) drives the fMRI signal. We will not address this question here. Instead, we ask whether we can identify simple, general rules that gov-ern the relationship between electrophysiological popula-tion activity and the fMRI signal at a macroscopic level. Based on the evidence reviewed below, a simple answer to this question appears to be “no.” e relationship between these signals seems to depend on the speci!c functional process and, perhaps, even the brain area under study. While, again, a relatively simple relationship is beginning to emerge for stimulus-driven responses in sensory cortex, this relationship appears more complex, and as yet elusive, for higher cognitive processes. us, we propose that a fruitful approach toward integrating electrophysiology and fMRI may be an indirect one, that is, via the processes un-der study. We conclude with a list of open questions, an-swers to which might fundamentally advance our under-standing of the issues addressed here.
A Brief Primer on Band-Limited Neural Activity
Electrophysiological Population Signals
Current electrophysiological techniques provide measures of neuronal population activity across a broad range of spatial scales. Intracortical microelectrode-recordings allow for directly measuring the spike output (action potentials) of individual (single-unit activity or SUA) or multiple (multi-unit activity or MUA) neurons. While spike signals are mostly con!ned to signal components above 500 Hz, the low-frequency signal (approx. <250 Hz) recorded from intracortical microelectrodes constitutes the local !eld po-tential (LFP), which re#ects summed dendro-somatic cur-rents surrounding the electrode tip (approx. <1 mm) (Juer-gens et al., 1999; Logothetis and Wandell, 2004; Mitzdorf, 1987). e LFP averages over several hundreds of neurons, and its amplitude is thus thought to re#ect predominantly synchronized synaptic events and other slow nonsynaptic potentials (e.g., spike aerpotentials). e electromagnetic !elds corresponding to these synchronized dendritic cur-rents can also be recorded from outside of the cortex. e ECoG measures these !elds with sub- or epidurally placed electrodes, oen referred to as intracranial EEG (Lachaux et al., 2003). At the most macroscopic level, scalp EEG and MEG measure the corresponding electric/magnetic !elds using scalp electrodes (Nunez and Srinivasan, 2006) or magnetic !eld sensors (Hamalainen et al., 1993). While the intracortical LFP depends on the laminar placement of the electrode tip, the ECoG, EEG, or MEG do not provide such laminar speci!city. e ECoG, EEG, or MEG mainly re#ect the electromagnetic !elds generated by the large dendrites of pyramidal neurons, which are arranged in parallel to one another and which are oriented perpendicular to the corti-cal surface.
“Frequency Bands” and Neural Oscillations
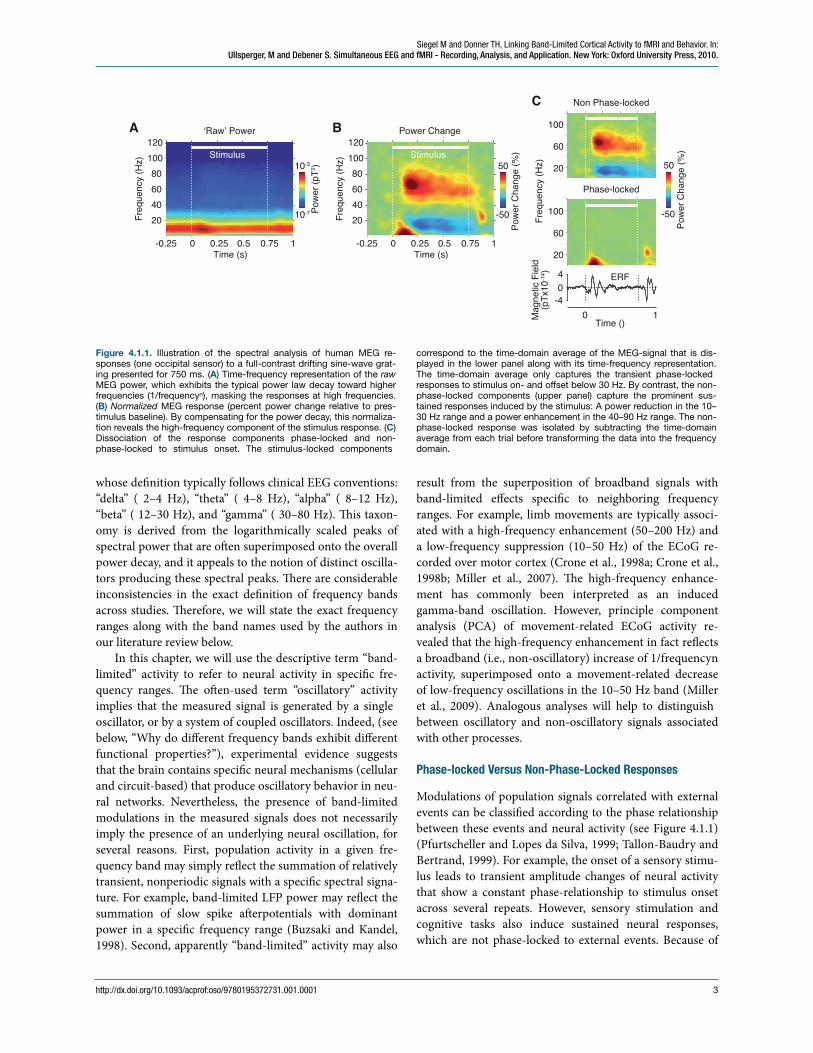
ese electrophysiological signals comprise activity over a broad frequency range. eir power roughly follows a power-law decay (1/frequencyn) (Bedard et al., 2006; Buz-saki and Draguhn, 2004; Freeman et al., 2000). us, at higher frequencies, modulations of the spectral power are typically small in absolute magnitude and, without nor-malization, oen masked by strong low-frequency compo-nents. erefore, it is useful to calculate electrophysiologi-cal responses as power changes relative to a “baseline” (e.g., prestimulus interval) spectrum for visualizing the effects of a particular experimental manipulation, and for comparing them across different frequency ranges. Figure 4.1.1 illus-trates this for MEG responses to a visual grating stimulus.
e different frequency ranges of these electrophysio-logical measures are commonly referred to as “bands,”
Siegel M and Donner TH, Linking Band-Limited Cortical Activity to fMRI and Behavior. In: Ullsperger, M and Debener S. Simultaneous EEG and fMRI - Recording, Analysis, and Application. New York: Oxford University Press, 2010.
2http://dx.doi.org/10.1093/acprof:oso/9780195372731.001.0001
whose de!nition typically follows clinical EEG conventions: “delta” ( 2–4 Hz), “theta” ( 4–8 Hz), “alpha” ( 8–12 Hz), “beta” ( 12–30 Hz), and “gamma” ( 30–80 Hz). is taxon-omy is derived from the logarithmically scaled peaks of spectral power that are oen superimposed onto the overall power decay, and it appeals to the notion of distinct oscilla-tors producing these spectral peaks. ere are considerable inconsistencies in the exact de!nition of frequency bands across studies. erefore, we will state the exact frequency ranges along with the band names used by the authors in our literature review below.
In this chapter, we will use the descriptive term “band-limited” activity to refer to neural activity in speci!c fre-quency ranges. e oen-used term “oscillatory” activity implies that the measured signal is generated by a single oscillator, or by a system of coupled oscillators. Indeed, (see below, “Why do different frequency bands exhibit different functional properties?”), experimental evidence suggests that the brain contains speci!c neural mechanisms (cellular and circuit-based) that produce oscillatory behavior in neu-ral networks. Nevertheless, the presence of band-limited modulations in the measured signals does not necessarily imply the presence of an underlying neural oscillation, for several reasons. First, population activity in a given fre-quency band may simply re#ect the summation of relatively transient, nonperiodic signals with a speci!c spectral signa-ture. For example, band-limited LFP power may re#ect the summation of slow spike aerpotentials with dominant power in a speci!c frequency range (Buzsaki and Kandel, 1998). Second, apparently “band-limited” activity may also
result from the superposition of broadband signals with band-limited effects speci!c to neighboring frequency ranges. For example, limb movements are typically associ-ated with a high-frequency enhancement (50–200 Hz) and a low-frequency suppression (10–50 Hz) of the ECoG re-corded over motor cortex (Crone et al., 1998a; Crone et al., 1998b; Miller et al., 2007). e high-frequency enhance-ment has commonly been interpreted as an induced gamma-band oscillation. However, principle component analysis (PCA) of movement-related ECoG activity re-vealed that the high-frequency enhancement in fact re#ects a broadband (i.e., non-oscillatory) increase of 1/frequencyn activity, superimposed onto a movement-related decrease of low-frequency oscillations in the 10–50 Hz band (Miller et al., 2009). Analogous analyses will help to distinguish between oscillatory and non-oscillatory signals associated with other processes.
Phase-locked Versus Non-Phase-Locked Responses
Modulations of population signals correlated with external events can be classi!ed according to the phase relationship between these events and neural activity (see Figure 4.1.1) (Pfurtscheller and Lopes da Silva, 1999; Tallon-Baudry and Bertrand, 1999). For example, the onset of a sensory stimu-lus leads to transient amplitude changes of neural activity that show a constant phase-relationship to stimulus onset across several repeats. However, sensory stimulation and cognitive tasks also induce sustained neural responses, which are not phase-locked to external events. Because of
Siegel M and Donner TH, Linking Band-Limited Cortical Activity to fMRI and Behavior. In: Ullsperger, M and Debener S. Simultaneous EEG and fMRI - Recording, Analysis, and Application. New York: Oxford University Press, 2010.
3http://dx.doi.org/10.1093/acprof:oso/9780195372731.001.0001
Figure 4.1.1. Illustration of the spectral analysis of human MEG re-sponses (one occipital sensor) to a full-contrast drifting sine-wave grat-ing presented for 750 ms. (A) Time-frequency representation of the raw MEG power, which exhibits the typical power law decay toward higher frequencies (1/frequencyn), masking the responses at high frequencies. (B) Normalized MEG response (percent power change relative to pres-timulus baseline). By compensating for the power decay, this normaliza-tion reveals the high-frequency component of the stimulus response. (C) Dissociation of the response components phase-locked and non-phase-locked to stimulus onset. The stimulus-locked components
correspond to the time-domain average of the MEG-signal that is dis-played in the lower panel along with its time-frequency representation. The time-domain average only captures the transient phase-locked responses to stimulus on- and offset below 30 Hz. By contrast, the non-phase-locked components (upper panel) capture the prominent sus-tained responses induced by the stimulus: A power reduction in the 10–30 Hz range and a power enhancement in the 40–90 Hz range. The non-phase-locked response was isolated by subtracting the time-domain average from each trial before transforming the data into the frequency domain.
-0.25 0 0.25 0.5Time (s)
Freq
uenc
y (Hz
)
0.75 1
20406080
100120
-0.25 0 0.25 0.5Time (s)
Freq
uenc
y (Hz
)
0.75 1
20406080
100120
Freq
uenc
y (Hz
)Ma
gnet
ic Fie
ld(p
Tx10
-14 )
20
60
100
20
60
100
Phase-locked
Non Phase-locked
ERF
-404
0 1Time ()
‘Raw’ Power
Stimulus
Power Change
10-7
10-3
Powe
r (pT
2 )
-50
50
Powe
r Cha
nge
(%)
-50
50
Powe
r Cha
nge
(%)
A BC
Stimulus

their variable phase-relation to external events, time-domain averaging removes these response components. us, they are not re#ected in the ERP. By contrast, spectral analysis allows for investigating non-phase-locked re-sponses: First, the signal is transformed to the frequency- or time-frequency-domain on a single-trial basis. en, the resulting complex spectrum is squared, which extracts the signal's power (i.e., variance) at a particular frequency, and discards its phase (Figure 4.1.1A). Eventually, power can be averaged across trials and normalized by a baseline-spectrum to account for the power decay toward high fre-quencies (Figure 4.1.1B).
For several reasons, the frequency domain is ideally suited for analyzing responses of electrophysiological popu-lation signals: First, cognitive processes oen evolve over extended time periods (e.g., attention, short-term memory, decision-processes) and are thus oen better re#ected in sustained non-phase-locked response components than in transient phase-locked responses. Second, such cognitive processes are oen not directly driven by external events (such as stimulus presentation). e corresponding neural responses are thus oen not precisely aligned to external events and again better captured by sustained non-phase-locked responses. e analysis of ongoing activity unrelated to external events presents a special, and the most extreme, case for which, again, spectral analysis is ideally suited, but the ERP approach is, by de!nition, impossible.2 We will here focus on task-related activity and thus not discuss studies of ongoing activity (reviewed by Laufs, 2008). ird, cognitive processes commonly display characteristic “spec-tral !ngerprints” that presumably re#ect the speci!c neural mechanisms and networks involved (see below, “Linking band-limited neural activity to behavior”). ese !nger-prints can be directly visualized in the frequency domain, which thus may provide a window into the neural mecha-nisms underlying the cognitive process under study.
When interpreting responses in the frequency domain, one needs to keep in mind that these re#ect neural activity, which is both phase-locked and non-phase-locked to exter-nal events. Signals with sharp transients contain energy across a wide range of frequencies. us, ERPs are oen re#ected by transient broadband responses in the time-frequency domain, with signi!cant power in the high fre-quency range, in the absence of a high-frequency oscilla-tion. In other words, simply detecting signi!cant power in any frequency band of the spectrum (e.g., “gamma”) does not imply that the signal contains a neuronal oscillation in that frequency range. Furthermore, one needs to be cau-tious about electromagnetic activity from non-neuronal sources such as muscles that may be picked up by extracor-tical EEG/MEG sensors. For example, Yuval-Greenberg et al. (2008) demonstrated that the transient enhancement of spontaneous microsaccades, typically occurring around 200 ms aer the onset of visual stimuli, causes a transient
broadband increase of high-frequency power in the scalp EEG that is likely generated by ocular muscles. Fortunately, such artifacts have distinct spectral and temporal pro!les that allow for dissociating them from the more sustained stimulus driven gamma-band responses (see Figures 4.1.1–4.1.3 and 4.1.5) (Fries et al., 2008a). is highlights the ad-vantage of sustained stimulation protocols (stimulus dura-tions of several seconds) as commonly used in single-unit physiology and fMRI. Furthermore, source-reconstruction or localization techniques and high-resolution eye-movement recordings will help rule out such artifacts.
Possible Functional Roles of Neuronal Phase Coherence
e band-limited power of population signals like LFP, EEG, or MEG primarily re#ects neural activity that is lo-cally synchronized across the spatial integration scale of the respective signal. More long-range synchronization of neu-ral populations, e.g., between different brain regions, can be assessed by computing the phase consistency (“coherence”) between pairs of simultaneously recorded signals (see also below, “Different windows into interactions between brain areas”).
Dynamic adjustments of neuronal coherence may pro-vide #exible mechanisms for regulating neuronal commu-nication (Engel et al., 2001; Fries, 2005; Salinas and Sejnowski, 2001). First, synchronization of presynaptic spikes may enhance their functional impact on postsynap-tic processing stages, and thus the effective connectivity between pre- and postsynaptic stages (König et al., 1996; Salinas and Sejnowski, 2001; Usrey and Reid, 1999). eo-retical (König et al., 1996; Salinas and Sejnowski, 2000; Shelley et al., 2002; Tiesinga et al., 2004) and experimental (Alonso et al., 1996; Azouz and Gray, 2000; Azouz and Gray, 2003; Bruno and Sakmann, 2006; Usrey et al., 1998) evidence suggests that cortical neurons act as “coincidence detectors”: Presynaptic spikes that arrive synchronously on a millisecond time scale are more effective in driving a postsynaptic response than nonsynchronized inputs. In fact, neurons may be particularly sensitive to such synchro-nized synaptic input in regimens of high-conductance (Shelley et al., 2002) or balanced excitation and inhibition (Salinas and Sejnowski, 2000; Salinas and Sejnowski, 2001). Second, the phase alignment between pre- and postsynaptic processing stages in the cortex may also dynamically regu-late their effective connectivity (Buzsaki and Draguhn, 2004; Fries, 2005; Womelsdorf et al., 2007): Subthreshold membrane potential oscillations induce rhythmic changes in neural excitability, and presynaptic spikes that are aligned to the excitable phase of such postsynaptic oscilla-tions are more likely to drive spiking activity at the post-synaptic stage. In light of these biophysical considerations, it is of great interest to investigate whether the cortex in fact dynamically adjusts the local or long-range coherence of
Siegel M and Donner TH, Linking Band-Limited Cortical Activity to fMRI and Behavior. In: Ullsperger, M and Debener S. Simultaneous EEG and fMRI - Recording, Analysis, and Application. New York: Oxford University Press, 2010.
4http://dx.doi.org/10.1093/acprof:oso/9780195372731.001.0001

neural oscillations for regulating information #ow, for ex-ample during selective attention or decision-making.
Phase coherence may not only regulate neural commu-nication, but also play an important role for neural coding of information. Evidence suggests that the phase of neural oscillations may provide scaffolding for information coding by the spikes of individual neurons (Kayser et al., 2009; Lee H et al., 2005; Montemurro et al., 2008; Siegel et al., 2009). For example, while monkeys remembered complex visual objects over a brief delay, spikes were synchronized to prominent theta-band (4–8 Hz) oscillations of the LFP in extrastriate visual area V4 (Lee H et al., 2005), i.e., spikes preferentially occurred at a speci!c theta-phase. Notably, not all spikes were equally informative about memory con-tent, but those at the preferred theta-phase of spiking con-veyed most information about the remembered objects. In monkey prefrontal cortex, spikes conveyed most informa-tion about two objects simultaneously held in short-term memory at speci!c phases of the mid-frequency (20–50 Hz, beta and gamma) LFP (Siegel et al., 2009). Notably, the most informative phases differed between the two remem-bered objects. Finally, stimulus-driven spiking activity in sensory cortices also conveys more information when its
timing relative to slow (<8 Hz) LFP #uctuations is taken into account (Kayser et al., 2009; Montemurro et al., 2008). In sum, the information conveyed by individual cortical neurons seems to depend critically on their spike timing, relative to coherent activity of the surrounding neural population. It is an exciting question for future research to which extent, and in which systems, the brain utilizes such a “phase-dependent coding” scheme.
Source Reconstruction of Band-Limited EEG/MEG Activity
A major challenge for understanding the functional role of band-limited population activity and relating it to fMRI responses is the comparison of results across species and spatial scales. At the sensor-level, EEG and MEG signals re#ect a coarse summation of cortical activity and thus provide only limited information about the exact cortical regions involved. Reconstruction of cortical source-level activity from the sensor-level data is a critical step in relat-ing EEG/MEG to intracortical electrophysiological or fMRI signals. Recent methodological advances yielded tools that are particularly well suited to estimate source-level activity from EEG or MEG data in the frequency domain. Speci!-cally, adaptive linear spatial !ltering techniques based on
Siegel M and Donner TH, Linking Band-Limited Cortical Activity to fMRI and Behavior. In: Ullsperger, M and Debener S. Simultaneous EEG and fMRI - Recording, Analysis, and Application. New York: Oxford University Press, 2010.
5http://dx.doi.org/10.1093/acprof:oso/9780195372731.001.0001
Figure 4.1.2. Modulation of band-limited MEG-activity by visual motion strength. Subjects viewed dynamic random dot patterns of different levels of motion strength. (A) “Motion coherence” (fraction of coherently moving dots) determines the strength of the visual motion signal. (B) Time-frequency response (percent power change relative to prestimulus baseline) across 30 MEG–sensors (indicated on the scalp projection). Stimuli induced a sustained broadband power enhancement in the gamma band (50–150 Hz) and a suppression below 50 Hz. Note the higher and broader gamma response as compared to moving gratings (Figure 4.1.1B). (C) Top panel: Spectral distribution of responses (100–500 ms past stimulus onset) for each level of motion coherence. Re-sponses are scaled separately for frequencies below and above 30 Hz.
Lower panel: Linear modulation of the response by motion coherence (percent response per percent motion coherence). The gray band (62–102 Hz) marks the strongest modulation. (D) 62–102 Hz responses as a function of motion coherence, evaluated with a linear !t. (E) Cortical distribution of the average 62–102 Hz response across all levels of motion coherence (red overlay) and of its linear modulation by visual motion strength (blue overlay). While the strongest average response was located around the calcarine, the linear modulation was maximally expressed in posterior parietal cortex (PPC) and the human motion-sensitive area MT+.(Reprinted and modi!ed with permission from Siegel et al. (2007).)
A
C D E
B
0 % 50 % 100 %Motion coherence -0.1 0 0.1 0.2 0.3
50
100
150
200
Time (s)
Freq
uenc
y (Hz
)
Powe
r Res
pons
e (%
)
-7.4
+7.4 Anterior
R
0 7# Subjects
Stimulus
Motio
n Co
h. (%
)06122550100
Frequency (Hz)
-200
20
-.040
.04
-505
Powe
r Ch
ange
(%)
Resp
. Mod
.(%
/%)
0 100 200Motion Coherence [%]
0 50 1004
6
8
10
62-1
02 H
zPo
wer C
hang
e (%
) L RPPCPPC
MT+
1st order
Avg. Resp. [%]p<10-4 p<10-7
9 14
62-102 Hz
p < 10-2/-3/-4/-5

the “beamforming” approach allow for estimating the power and coherence of cortical population activity across the brain (Gross et al., 2001; Liljestrom et al., 2005; Van Veen et al., 1997). e spatial resolution of these techniques depends on the number of MEG/EEG sensors, the signal-to-noise ratio of the recorded signals, and the number of underlying cortical sources. Estimates of the spatial resolu-tion are on the order of a few centimeters, or below for cur-rently available recording techniques (Gross et al., 2003).
Linking Band-Limited Neural Activity to Behavior
In this section, we will review studies relating band-limited cortical population activity to speci!c sensory and cogni-tive processes, focusing on visual tasks and the primate brain. Rather than providing a comprehensive review, we will try to identify general principles underlying the spec-tral !ngerprints of speci!c functional processes. To this end, we will contrast stimulus-driven signals in sensory cortex with intrinsically generated activity produced by recurrent cortical interactions and ascending neuromodu-lators during higher-level cognitive processing. is dis-tinction is certainly an oversimpli!cation, but it constitutes a very useful heuristic for sorting recent results.
Stimulus-Driven Activity in Visual Cortex
Several studies have identi!ed the frequency ranges of cor-tical mass activity that exhibit, !rst, selectivity for visual features (such as contour orientation or motion direction), and second, dependence on feature strength (such as lumi-nance contrast or motion coherence).3 ese studies sug-gest that neural gamma-band activity re#ects visual fea-tures.
Neural population responses in early visual cortex in-duced by visual stimuli exhibit a characteristic spectral sig-nature. Activity is enhanced in a broad gamma band from about 30 Hz to well above 100 Hz and suppressed below 30 Hz (e.g., in the alpha and beta band, 8–30 Hz; see Figures 4.1.1, 4.1.2, 4.1.3, and 4.1.5). In particular the stimulus-driven gamma-band enhancement is consistently measured in early visual areas ranging from LFPs in cats (Brosch et al., 1995; Eckhorn et al., 1988; Gray et al., 1989; Gray and Singer, 1989; Kayser and König, 2004; Siegel and König, 2003) and monkeys (Belitski et al., 2008; Berens et al., 2008; Frien and Eckhorn, 2000; Frien et al., 2000; Henrie and Shapley, 2005; Liu and Newsome, 2006; Logothetis et al., 2001) to human EEG or MEG (Donner et al., 2007; Fries et al., 2008a; Gruber et al., 1999; Hall et al., 2005; Hoogen-boom et al., 2005; Siegel et al., 2007; Siegel et al., 2008; Van Der Werf et al., 2008; Wyart and Tallon-Baudry, 2008). By comparison, in invasive recordings the low-frequency sup-
pression is found less consistently than in non-invasive recordings. Microelectrode recordings suggest that the gamma-band response re#ects synchronized oscillations of local neuronal ensembles. e strength of synchronization between neurons correlates with the similarity of their re-ceptive !elds and tuning properties (Brosch et al., 1995; Eckhorn et al., 1988; Frien and Eckhorn, 2000; Frien et al., 2000; Gray et al., 1989; Gray and Singer, 1989; Nir et al., 2007; Siegel and König, 2003). Hence, the amplitude of the local gamma-band LFP is tuned for speci!c sensory fea-tures and its tuning preference corresponds to the averaged selectivity of the neural population contributing to the gamma-band LFP. In primary visual cortex, the gamma-band LFP is selective for stimulus orientation (Berens et al., 2008a; Frien et al., 2000; Gray and Singer, 1989; Kayser and König, 2004; Siegel and König, 2003), spatial and temporal frequency (Kayser and König, 2004), and ocular dominance (Berens et al., 2008a). In monkey area MT, the gamma-band LFP is selective for motion direction and speed (Liu and Newsome, 2006). is selectivity is typically con!ned to a frequency range from about 50 to 100 Hz. In addition to the gamma band, several studies reported a second, weaker feature-selective frequency range from about 8 to 25 Hz. (Berens et al., 2008a; Kayser and König, 2004; Liu and Newsome, 2006; Siegel and König, 2003).
Comparison of LFP-selectivity across different kinds of visual features provides insight into the spatial integration properties of the LFP. Liu and Newsome (2006) observed that LFP responses to moving stimuli in area MT were se-lective for speed at higher frequencies (> 80 Hz) than for direction (> 40 Hz). Neurons with the same speed prefer-ence cluster in small groups of 500 m diameter, whereas neuronal clusters (“columns”) of the same direction prefer-ence span up to 2000 m perpendicular to the cortical sur-face. e authors concluded that lower LFP frequencies re#ect neuronal activity integrated across a broader spatial scale, explaining the loss of speed information, but the per-sistence of direction information. is is consistent with !ndings from monkey V1, where ocular dominance is or-ganized on a broader spatial scale than orientation tuning: e LFP re#ects ocular dominance at frequencies above 30 Hz, but preferred orientations only at above 80 Hz (Berens et al., 2008a). ese !ndings suggest that the high-frequency LFP (>80 Hz) re#ects more local activity as com-pared to the more widespread activity re#ected at gamma frequencies from about 30 to 80 Hz.
e EEG and MEG do not provide sufficient spatial resolution to delineate feature selectivity within a given cortical region (e.g., orientation columns in V1 or direction columns in MT). us, electrophysiological studies in hu-mans have focused on how population responses are modu-lated by the strength of sensory features. Consistent with the above data on feature-selectivity, these demonstrate en-hanced gamma-band activity with increasing strength of
Siegel M and Donner TH, Linking Band-Limited Cortical Activity to fMRI and Behavior. In: Ullsperger, M and Debener S. Simultaneous EEG and fMRI - Recording, Analysis, and Application. New York: Oxford University Press, 2010.
6http://dx.doi.org/10.1093/acprof:oso/9780195372731.001.0001
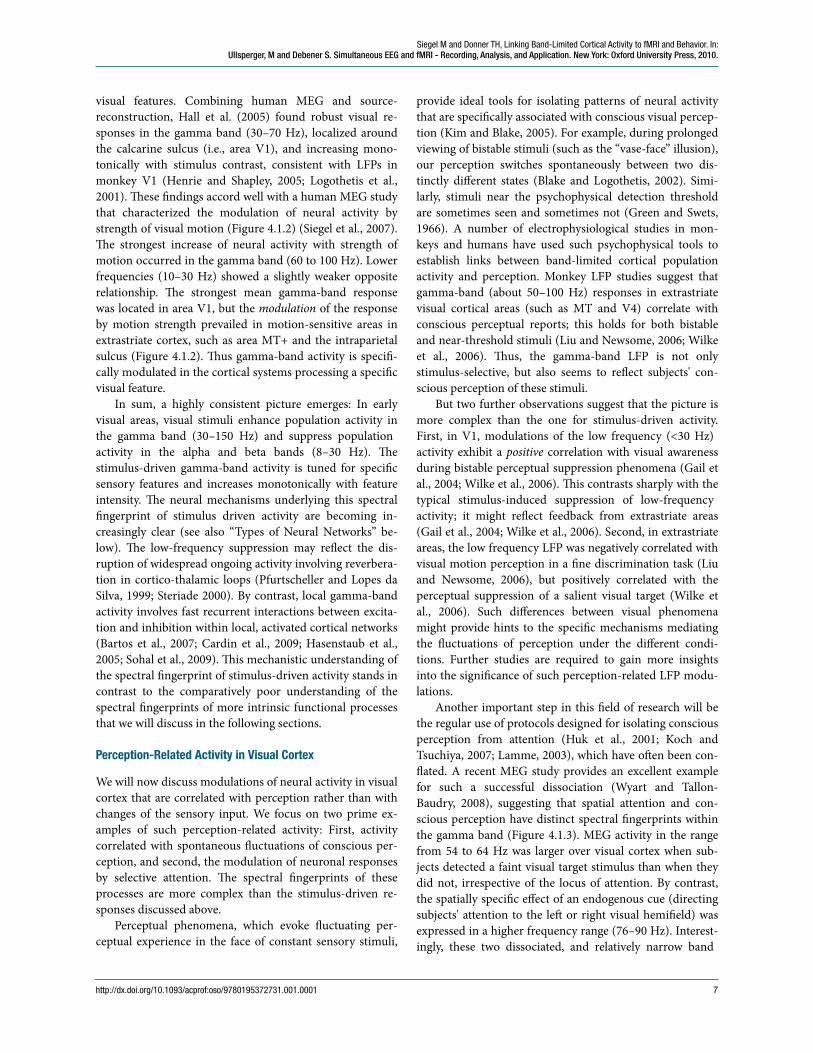
visual features. Combining human MEG and source-reconstruction, Hall et al. (2005) found robust visual re-sponses in the gamma band (30–70 Hz), localized around the calcarine sulcus (i.e., area V1), and increasing mono-tonically with stimulus contrast, consistent with LFPs in monkey V1 (Henrie and Shapley, 2005; Logothetis et al., 2001). ese !ndings accord well with a human MEG study that characterized the modulation of neural activity by strength of visual motion (Figure 4.1.2) (Siegel et al., 2007). e strongest increase of neural activity with strength of motion occurred in the gamma band (60 to 100 Hz). Lower frequencies (10–30 Hz) showed a slightly weaker opposite relationship. e strongest mean gamma-band response was located in area V1, but the modulation of the response by motion strength prevailed in motion-sensitive areas in extrastriate cortex, such as area MT+ and the intraparietal sulcus (Figure 4.1.2). us gamma-band activity is speci!-cally modulated in the cortical systems processing a speci!c visual feature.
In sum, a highly consistent picture emerges: In early visual areas, visual stimuli enhance population activity in the gamma band (30–150 Hz) and suppress population activity in the alpha and beta bands (8–30 Hz). e stimulus-driven gamma-band activity is tuned for speci!c sensory features and increases monotonically with feature intensity. e neural mechanisms underlying this spectral !ngerprint of stimulus driven activity are becoming in-creasingly clear (see also “Types of Neural Networks” be-low). e low-frequency suppression may re#ect the dis-ruption of widespread ongoing activity involving reverbera-tion in cortico-thalamic loops (Pfurtscheller and Lopes da Silva, 1999; Steriade 2000). By contrast, local gamma-band activity involves fast recurrent interactions between excita-tion and inhibition within local, activated cortical networks (Bartos et al., 2007; Cardin et al., 2009; Hasenstaub et al., 2005; Sohal et al., 2009). is mechanistic understanding of the spectral !ngerprint of stimulus-driven activity stands in contrast to the comparatively poor understanding of the spectral !ngerprints of more intrinsic functional processes that we will discuss in the following sections.
Perception-Related Activity in Visual Cortex
We will now discuss modulations of neural activity in visual cortex that are correlated with perception rather than with changes of the sensory input. We focus on two prime ex-amples of such perception-related activity: First, activity correlated with spontaneous #uctuations of conscious per-ception, and second, the modulation of neuronal responses by selective attention. e spectral !ngerprints of these processes are more complex than the stimulus-driven re-sponses discussed above.
Perceptual phenomena, which evoke #uctuating per-ceptual experience in the face of constant sensory stimuli,
provide ideal tools for isolating patterns of neural activity that are speci!cally associated with conscious visual percep-tion (Kim and Blake, 2005). For example, during prolonged viewing of bistable stimuli (such as the “vase-face” illusion), our perception switches spontaneously between two dis-tinctly different states (Blake and Logothetis, 2002). Simi-larly, stimuli near the psychophysical detection threshold are sometimes seen and sometimes not (Green and Swets, 1966). A number of electrophysiological studies in mon-keys and humans have used such psychophysical tools to establish links between band-limited cortical population activity and perception. Monkey LFP studies suggest that gamma-band (about 50–100 Hz) responses in extrastriate visual cortical areas (such as MT and V4) correlate with conscious perceptual reports; this holds for both bistable and near-threshold stimuli (Liu and Newsome, 2006; Wilke et al., 2006). us, the gamma-band LFP is not only stimulus-selective, but also seems to re#ect subjects' con-scious perception of these stimuli.
But two further observations suggest that the picture is more complex than the one for stimulus-driven activity. First, in V1, modulations of the low frequency (<30 Hz) activity exhibit a positive correlation with visual awareness during bistable perceptual suppression phenomena (Gail et al., 2004; Wilke et al., 2006). is contrasts sharply with the typical stimulus-induced suppression of low-frequency activity; it might re#ect feedback from extrastriate areas (Gail et al., 2004; Wilke et al., 2006). Second, in extrastriate areas, the low frequency LFP was negatively correlated with visual motion perception in a !ne discrimination task (Liu and Newsome, 2006), but positively correlated with the perceptual suppression of a salient visual target (Wilke et al., 2006). Such differences between visual phenomena might provide hints to the speci!c mechanisms mediating the #uctuations of perception under the different condi-tions. Further studies are required to gain more insights into the signi!cance of such perception-related LFP modu-lations.
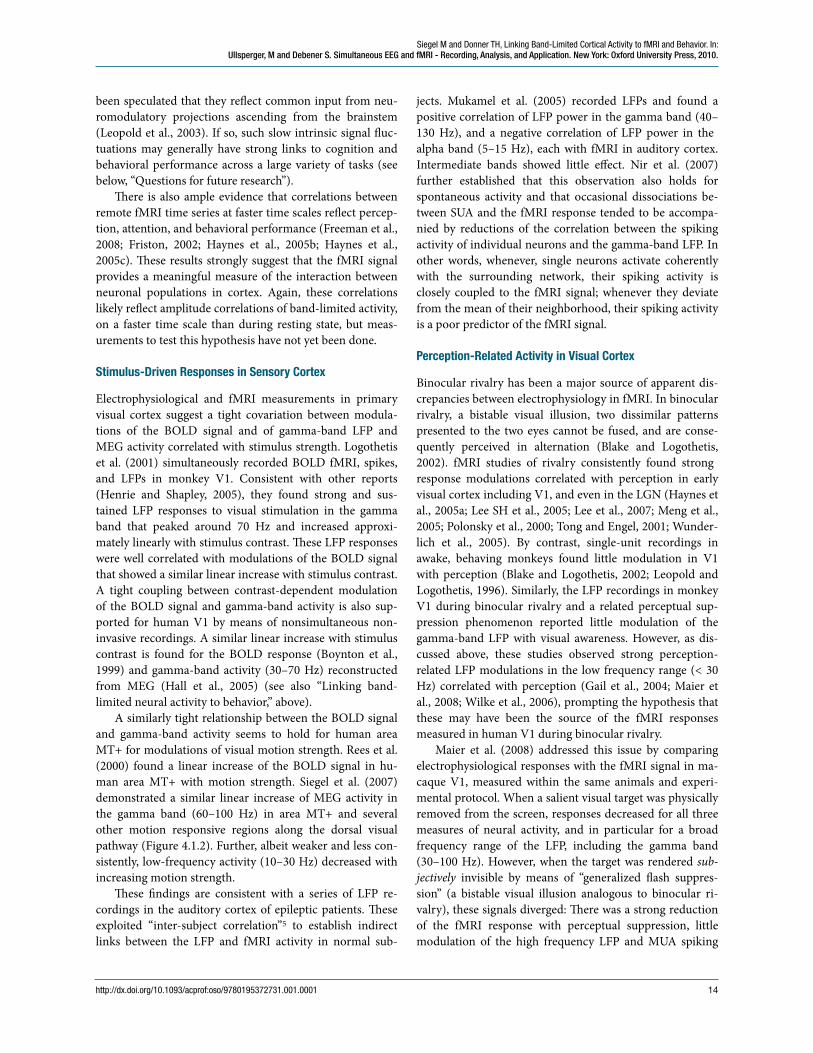
Another important step in this !eld of research will be the regular use of protocols designed for isolating conscious perception from attention (Huk et al., 2001; Koch and Tsuchiya, 2007; Lamme, 2003), which have oen been con-#ated. A recent MEG study provides an excellent example for such a successful dissociation (Wyart and Tallon-Baudry, 2008), suggesting that spatial attention and con-scious perception have distinct spectral !ngerprints within the gamma band (Figure 4.1.3). MEG activity in the range from 54 to 64 Hz was larger over visual cortex when sub-jects detected a faint visual target stimulus than when they did not, irrespective of the locus of attention. By contrast, the spatially speci!c effect of an endogenous cue (directing subjects' attention to the le or right visual hemi!eld) was expressed in a higher frequency range (76–90 Hz). Interest-ingly, these two dissociated, and relatively narrow band
Siegel M and Donner TH, Linking Band-Limited Cortical Activity to fMRI and Behavior. In: Ullsperger, M and Debener S. Simultaneous EEG and fMRI - Recording, Analysis, and Application. New York: Oxford University Press, 2010.
7http://dx.doi.org/10.1093/acprof:oso/9780195372731.001.0001

effects of detection and cue were superimposed onto the typical broadband, stimulus-driven gamma-band response from about 50 to above 100 Hz, suggesting distinct under-lying mechanisms. e detection-related modulation in the 54–64 Hz range predicted subjects' “target present” reports even on “target absent” trials (that is, when their perceptual reports were inaccurate). is further suggests that this modulation did not simply re#ect attention. Since, the authors focused their analyses on the gamma band (30–150 Hz), it is unknown whether the lower frequency activity also correlated with subjects' perceptual reports, in a similar way as in monkey V1 (see above).
Neuronal responses in visual cortex to constant sensory input can also be affected by instructing subjects to shi attention from one location or stimulus feature to another (Desimone and Duncan, 1995). Several monkey LFP stud-ies and human EEG/MEG studies have characterized the spectral signature of the “top-down” modulation of neural activity in visual cortex by selective attention. During stimulus processing, spatially selective and feature-based attention enhance gamma-band activity (30–100 Hz) in the human MEG and EEG (Gruber et al., 1999; Muller and Keil, 2004; Siegel et al., 2008; Wyart and Tallon-Baudry,
2008) and macaque area V4 (Bichot et al., 2005; Fries et al., 2001; Fries et al., 2008; Taylor et al., 2005). By contrast, before presentation of a visual stimulus, spatial attention induces a widespread suppression of alpha-band activity across visual cortex, demonstrated again in both human EEG/MEG (Siegel et al., 2008; ut et al., 2006; Worden et al., 2000; Wyart and Tallon-Baudry, 2008) and macaque area V4 (Fries et al., 2001; Fries et al., 2008b). Before and during stimulus presentation, the strength of these atten-tional modulations predicts the accuracy (Siegel et al., 2008; Taylor et al., 2005) and speed (ut et al., 2006; Womels-dorf et al., 2006) of behavioral reports. us, rather than being constant or stimulus-independent, the spectral !n-gerprint of selective attention in visual cortex seems to de-pend strongly on the presence of a visual input. is sug-gests that band-limited activity in these regions re#ects the result of a complex interaction between “bottom-up” and “top-down” signals.
e spectral !ngerprint may also differ substantially between different processing stages within visual cortex (Siegel et al., 2008). By means of MEG source-reconstruction, Siegel et al. (2008) were able to separate attentional modulations in visual cortical areas V1/V2 and
Siegel M and Donner TH, Linking Band-Limited Cortical Activity to fMRI and Behavior. In: Ullsperger, M and Debener S. Simultaneous EEG and fMRI - Recording, Analysis, and Application. New York: Oxford University Press, 2010.
8http://dx.doi.org/10.1093/acprof:oso/9780195372731.001.0001
Figure 4.1.3. Dissociated spectral !ngerprints of spatial attention and visual contrast detection. (A) Time-frequency representation of the high-frequency MEG response (in log power) of one occipital MEG sensor to low contrast gratings near psychophysical detection threshold. Follow-ing a central cue to the left or right, a grating was presented for 0.4 s in either the left or right hemi!eld, or no stimulus was presented at all. The !rst vertical line indicates cue onset, stimulus onset is at 0 ms. Subjects reported the presence/absence of the target stimulus after a variable delay. The faint grating stimuli induced an MEG response in the high gamma (50–110 Hz) range. Note the similarity to the gamma-band
responses shown in Figure 4.1.1B. (B) Scalp topography of the high gamma-band response (50–110 Hz, 50–110 ms after stimulus onset, black box in A), averaged across left and right hemi!eld stimuli. Gamma-band responses were expressed over posterior sensors overly-ing visual and parietal cortex. The sensors marked with the peak re-sponse in black constitute the ROI for averaging responses in C. (C) Effects of target detection (“awareness-related”) and of spatial cue (“attention-related”) on the high-frequency MEG-response (statistical F-maps; ***p < 0.001 corrected: n.s., nonsigni!cant effect).(Reprinted with permission from Wyart and Tallon-Baudry (2008).)
X Attention-related effect XX Awareness-related effect
Power (log)
!0.08
+0.08
100 200 300 400 5000 500
120
100 200 300 400040
60
80
100
Time (ms)Time (ms)
40
120
60
80
100
F-score
!15
+15
Freq
uenc
y (H
z)
***
***n.s.
n.s.
C
Freq
uenc
y (H
z)
50
100
Freq
uenc
y (H
z)
Time (ms)
150
-600 0008- 500
Power (log)
!0.09
+0.09
BA Stimulus-related !-band activity

MT+. Area MT+ showed attentional effects in accordance with the !ndings from sensor-level EEG/MEG and monkey V4 studies discussed above: Prestimulus activity was strongly suppressed in the alpha (5–15 Hz) and beta (15–35 Hz) band, while attention enhanced broadband gamma-band activity (35–100 Hz) during stimulation. By contrast, in V1/V2 attention selectively enhanced activity in the beta band (15–35 Hz) during stimulation and, surprisingly, sup-pressed high gamma-band activity (60–100 Hz) before stimulus onset. us, the spectral !ngerprint of attentional modulation does not only depend on the presence of sen-sory input, but may also vary qualitatively between cortical processing stages. Further studies are needed to compare attentional modulations between processing stages, and to characterize their interaction with bottom-up signals. Fur-ther, a closer integration of !ndings between monkey and human studies is needed, which can be accomplished by the use of common experimental protocols and source-reconstruction of non-invasively recorded data.
Integrative Processes in Frontal and Parietal Association
Cortex
We now turn to processes at the interface between percep-tion and action: e control of attentional selection and the #exible mapping of perceptual representations onto volun-tary actions (sensorimotor integration and decision-making). ese processes are related at a functional level, and they seem to engage an overlapping network of regions in prefrontal and posterior parietal association cortex (Corbetta and Shulman, 2002; Desimone and Duncan, 1995; Gold and Shadlen, 2007; Kastner and Ungerleider, 2000; Miller and Cohen, 2001; Schall, 2001). In particular, a large number of neuroimaging studies have implicated two cortical association regions in the control of attention: the intraparietal sulcus in posterior parietal cortex, and the
frontal eye !elds in prefrontal cortex (Corbetta and Shul-man, 2002; Donner et al., 2000; Kastner and Ungerleider, 2000; Moore et al., 2003; Serences and Yantis, 2006). Several recent studies have demonstrated that attention modulates band-limited activity within these regions, as well as their long-range coherence. However, the spectral pro!le of these effects differed markedly between studies. It remains to be clari!ed by future studies whether these discrepancies re-#ect differences in behavioral tasks, analysis methods, or the cortical regions under study.
In the macaque lateral intraparietal area (LIP), attention enhances population activity in the beta and low gamma band (25–45 Hz), while boosting coherence between areas MT and LIP in a broad alpha and beta frequency range (10–35 Hz) (Saalmann et al., 2007). is dissociation be-tween effects of attention on local processing and on inter-regional coherence is consistent with the MEG results from Siegel et al. (2008) discussed above (see “Perception-related activity in visual cortex”). In this study, attention enhanced gamma-band coherence (35–100 Hz) and suppressed al-pha- and beta-band coherence (5–35 Hz) between the in-traparietal sulcus, frontal eye !elds, and MT+ independent of visual input. is stimulus independent spectral pro!le stands in sharp contrast to strongly stimulus dependent modulation of local band-limited activity in MT+ and the intraparietal sulcus. Further, these modulations of inter-regional coherence contrast with an attentional suppression of beta-band (15–35 Hz) activity in the frontal eye !elds. e latter results underline the regional speci!city of atten-tional modulation in cortex.
e spectral !ngerprints of attention also vary between different modes of attentional control. Buschman et al. (2007) compared the spectral pro!le of frontal-parietal coherence in macaques between visual search guided by “top-down” information (a target held in working memory)
Siegel M and Donner TH, Linking Band-Limited Cortical Activity to fMRI and Behavior. In: Ullsperger, M and Debener S. Simultaneous EEG and fMRI - Recording, Analysis, and Application. New York: Oxford University Press, 2010.
9http://dx.doi.org/10.1093/acprof:oso/9780195372731.001.0001
Figure 4.1.4. Frontal-parietal coherence around 15 Hz re"ects decision-making during motor planning. (A) Time-frequency representation of coherence between spikes in the dorsal premotor area (PMd) and the LFP in the parie-tal reach region (PRR) during free (left panel) and in-structed (right panel) search. See main text for details of the task. Neuronal activity is aligned to search array on-set. The second vertical bar marks the average time of the !rst reach. The horizontal bar at the top shows the analy-sis window for panel B. (B) Spectra of z-transformed coherence between PMd spikes and the PRR LFP directly after search array onset. (C) and (D) display the same analyses as panels (A) and (B) but for spikes in PRR and the LFP in PMd. (**; p < 0.05).(Reprinted by permission from Pesaran B, Nelson MJ, Andersen RA (2008) Free choice activates a decision circuit between frontal and parietal cortex. Nature 453:406–409. Copyright Macmillan Publishers Ltd. (2008).)
0 1 2020406080
100
0 1 20
0.15
0.3
0 50 1000
10
20
30Searcharrayonset Reach
Searcharrayonset Reach
Searcharrayonset Reach
Searcharrayonset Reach
**Free Instructed
Free Instructed
z-Tra
ns. C
oher
ence
Freq
uenc
y (Hz
)
Time (s) Time (s) Frequency (Hz)
FreeInstructed
PMd spike–PRR field coherence
Time (s)
Freq
uenc
y (Hz
)
Time (s)0 1 20
20406080
100
0 1 2 0
0.05
0.1
0.15
0 50 100-202468
10 Free
z-Tra
ns. C
oher
ence
Frequency (Hz)
PRR spike–PMd field coherence
Instructed**
A
C
B
D
and attention guided by “bottom-up” stimulus saliency. In general, attention broadly enhanced coherence from about 15 to 70 Hz, but coherence was higher in the beta range (22–34 Hz) for “top-down” attention and higher in the low gamma range (35–55 Hz) for “bottom-up” attention. us, different modes of attentional control entail different modes of frontal-parietal communication, with distinct spectral !ngerprints. ese differences might re#ect different direc-tions of information #ow (i.e., frontal to parietal in “top-down” mode and vice versa in “bottom-up” mode) or dif-ferent neuronal subpopulations engaged in the two modes.
Large-scale electrophysiological recordings have also characterized the neural basis of sensorimotor integration and decision-making. ese processes seem to involve frontal-parietal activity in lower and intermediate (alpha and beta) frequency ranges (Brovelli et al., 2004; Buschman and Miller, 2007; Donner et al., 2007; Gross et al., 2004; Pesaran et al., 2008; Rubino et al., 2006). is line of evi-dence is well illustrated by a study (Pesaran et al., 2008) correlating neural activity between posterior parietal and dorsal premotor cortex while monkeys planned of a series of reach movements (Figure 4.1.4). In the condition of in-
terest (“free search”), the animals were free to choose the sequence of movements. In the control condition (“in-structed search”), a stimulus array instructed a particular sequence of movements. Coherence between spikes in premotor cortex and LFPs in the parietal reach region, and vice versa, increased transiently aer the onset of the stimu-lus array (i.e., in the period of the trial in which monkeys formed their decision about the sequence of reaches). is effect occurred in the low frequency range (peaking at around 15 Hz) and was stronger during “free” than “in-structed” search. us, decision-making seems to activate long-range coupling between the nodes of a large-scale frontal-parietal network. Further, the latency difference between the responses of each area (about 30 ms), as well as the spike-LFP coherence in both directions, further sug-gested that premotor cortex was in#uencing parietal cortex and the decision process in a feedback fashion.
Further support for the relevance of beta-band activity in decision-making comes from human MEG studies of different visual detection processes (Donner et al., 2007; Gross et al., 2004). During a motion detection task, trial-to-trial #uctuations of MEG activity in the 12–24 Hz range
Siegel M and Donner TH, Linking Band-Limited Cortical Activity to fMRI and Behavior. In: Ullsperger, M and Debener S. Simultaneous EEG and fMRI - Recording, Analysis, and Application. New York: Oxford University Press, 2010.
10http://dx.doi.org/10.1093/acprof:oso/9780195372731.001.0001
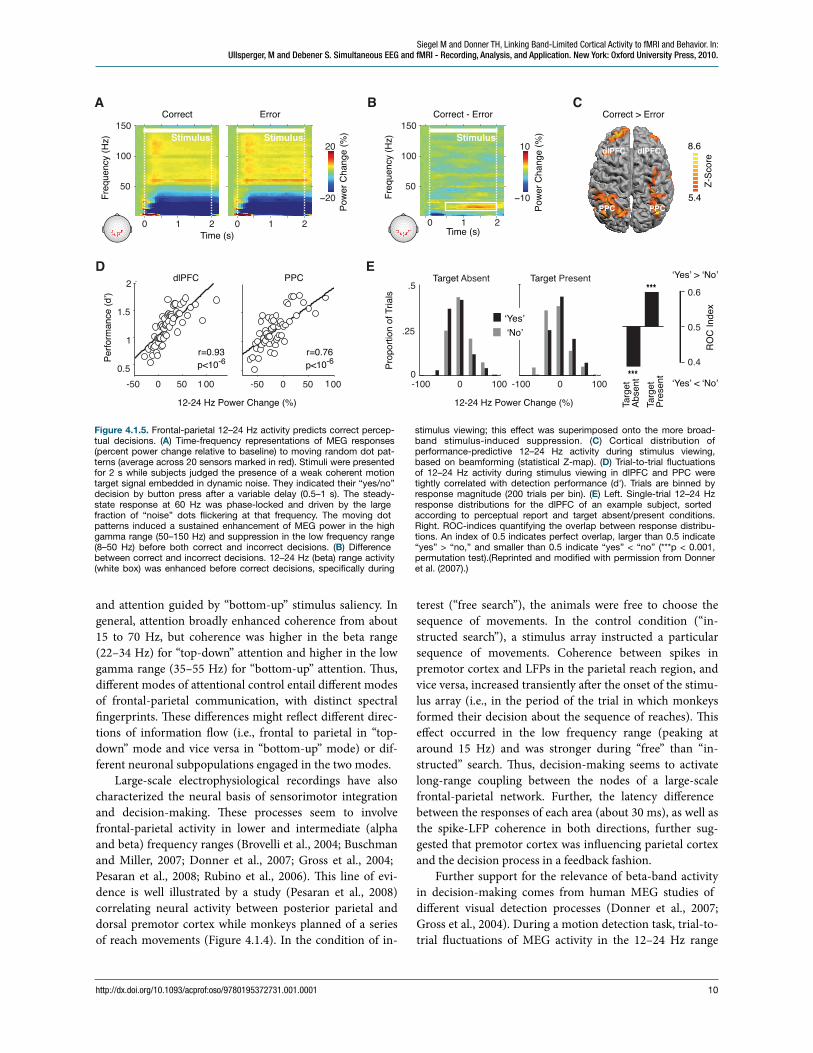
Figure 4.1.5. Frontal-parietal 12–24 Hz activity predicts correct percep-tual decisions. (A) Time-frequency representations of MEG responses (percent power change relative to baseline) to moving random dot pat-terns (average across 20 sensors marked in red). Stimuli were presented for 2 s while subjects judged the presence of a weak coherent motion target signal embedded in dynamic noise. They indicated their “yes/no” decision by button press after a variable delay (0.5–1 s). The steady-state response at 60 Hz was phase-locked and driven by the large fraction of “noise” dots "ickering at that frequency. The moving dot patterns induced a sustained enhancement of MEG power in the high gamma range (50–150 Hz) and suppression in the low frequency range (8–50 Hz) before both correct and incorrect decisions. (B) Difference between correct and incorrect decisions. 12–24 Hz (beta) range activity (white box) was enhanced before correct decisions, speci!cally during
stimulus viewing; this effect was superimposed onto the more broad-band stimulus-induced suppression. (C) Cortical distribution of performance-predictive 12–24 Hz activity during stimulus viewing, based on beamforming (statistical Z-map). (D) Trial-to-trial "uctuations of 12–24 Hz activity during stimulus viewing in dlPFC and PPC were tightly correlated with detection performance (d'). Trials are binned by response magnitude (200 trials per bin). (E) Left. Single-trial 12–24 Hz response distributions for the dlPFC of an example subject, sorted according to perceptual report and target absent/present conditions. Right. ROC-indices quantifying the overlap between response distribu-tions. An index of 0.5 indicates perfect overlap, larger than 0.5 indicate “yes” > “no,” and smaller than 0.5 indicate “yes” < “no” (***p < 0.001, permutation test).(Reprinted and modi!ed with permission from Donner et al. (2007).)
A B
Time (s)
Freq
uenc
y (Hz
)Correct Error
Time (s)
Powe
r Cha
nge
(%)
!20
20
0 1 2
50
100
150
0 1 2 0 1 2
50
100
150Stimulus Stimulus Stimulus
Correct - Error
!10
10
Powe
r Cha
nge
(%)
Freq
uenc
y (Hz
)
CCorrect > Error
PPCPPC
dlPFC dlPFC
5.4
8.6
Z-Sc
ore
Prop
ortio
n of
Tria
ls-100 0 100
‘No’‘Yes’
12-24 Hz Power Change (%)
Target Present
-100 0 1000
.25
.5
12-24 Hz Power Change (%)
Perfo
rman
ce (d
’)
p<10-6r=0.93
dlPFC
-50 0 50 1000.5
1
1.5
2 PPC
1-50 0 50 00p<10-6r=0.76
D E
0.4
0.5
0.6
ROC
Inde
x
Targ
et
Abse
ntTa
rget
Pr
esen
t***
***‘Yes’ > ‘No’
‘Yes’ < ‘No’
Target Absent

predicted correct perceptual choices of the subjects (Figure 4.1.5). is predictive activity was expressed in a wide-spread cortical network comprising frontal, parietal, and visual cortex. It did not just re#ect slow #uctuations of sub-jects' arousal state, but was speci!cally expressed during the stimulus interval. Similarly, during the “attentional blink” phenomenon4, 13–18 Hz MEG activity in frontal, parietal, and visual cortex, as well as their coherence, predicted suc-cessful target detection (Gross et al., 2004).
Importantly, the 12–24 Hz activity predicted the accu-racy of subjects' “yes/no” detection decisions, irrespective of their content (“yes/no”): On target-present trials, the activ-ity tended to be higher before “yes” than before “no” choices (i.e., “hits” > “misses”), whereas, on motion-absent trials, it showed the opposite relation to the “yes/no” choice (i.e. “correct rejects” > “misses”). us, the 12–24 Hz activ-ity does not re#ect a cortical representation (of the target or of an abstract decision variable), but the mechanism trans-forming this representation into a motor plan (deCharms and Zador, 2000).
What might be this mechanism? In many cases, percep-tual decision-making involves the accumulation of “sensory evidence” over time, which in turn seems to be mediated by persistent neuronal activity (Gold and Shadlen, 2007). As originally suggested by Hebb (1949), persistent neural ac-tivity in cortex might be established by reverberant activity within local and long-range networks. Reverberant activity can be re#ected in oscillations as measured by neural popu-lation signals (Wang, 2001). Indeed, several studies explic-itly probing the neural correlates of short-term memory in frontal, parietal, and visual cortex found these to be speci!-cally expressed in similar beta frequency ranges (Tallon-Baudry et al., 2001; Tallon-Baudry et al., 1998; Tallon-Baudry et al., 2004).
To sum up, the most consistent spectral !ngerprints of population activity are observed for stimulus-driven activ-ity in sensory cortex. Sensory stimulation generally induces stimulus-speci!c increases of gamma-band power and (less speci!c) decreases in low-frequency power. Similar princi-ples seem to apply to movement-selective activity in motor cortex (Crone et al., 1998a; Crone et al., 1998b; Miller et al., 2007; Rickert et al., 2005; Spinks et al., 2008). By contrast the spectral !ngerprints of higher cognitive processes (such as attention or decision-making) appear more complex. We suggest that one reason for this discrepancy might be that the latter processes involve strong recurrent interactions, within and between distant cortical networks, and various neuromodulators interacting with these cortical processes. In addition, the spectral !ngerprints might also differ sys-tematically between sensory cortex on the one hand and association cortices on the other hand, perhaps re#ecting distinct network properties. In light of present evidence these ideas remain largely speculative, but we can address
the more general question of what can be inferred from neural population activity in the different frequency bands.
Why Do Frequency Bands Exhibit Speci!c Functional Properties?
Several previous accounts of cortical frequency bands have mapped coarsely de!ned psychological concepts (e.g. “cog-nitive binding”) onto speci!c frequency bands (such as the “gamma-band”). is approach bears some similarity to the “neo-phrenological” approach in functional neuroimaging, which aims at labeling each region of the cerebral cortex with a speci!c cognitive process (Friston, 2002; Nichols and Newsome, 1999). We think that it will be more fruitful to approach the question at a basic neurophysiological level (i.e., the properties of individual neurons and neuronal circuits). Do the spectral !ngerprints of functional proc-esses provide hints toward the speci!c neural computations underlying these processes?
Spatial Scales of Measurements and Neural Networks
To understand the signi!cance of LFP or EEG signals in particular frequency bands, we need to consider how these signals emerge from the activity of individual neurons and their interactions. In particular, what is the relationship between signals measured at different spatial scales?
e phase-coherence of simultaneously recorded LFPs decreases with cortical distance, and coherence declines faster for higher as for lower frequencies (Frien and Eck-horn, 2000; Leopold et al., 2003). Further, feature selectivity of the LFP is con!ned to higher frequencies for sensory features that are represented in more local cortical clusters (Berens et al., 2008a; Liu and Newsome, 2006). ese re-sults could either re#ect broader spatial scales of neural interaction at lower frequencies (i.e., an active process) or simply the biophysical principles governing passive signal propagation in the cortex. In other words, the effect could simply be caused by a stronger attenuation of high-frequency signals in the cortex, which would result in the LFP re#ecting activity over a broader spatial scale at lower frequencies. Measurements of the frequency dependent cortical impedance argue against the latter explanation (Logothetis et al., 2007). Over the relevant frequency range, the impedance-spectrum along the cortical surface is largely #at within each cortical layer. is implies that the LFP propagates equally well across different spectral com-ponents, which, in turn, suggests that the frequency de-pendent decay of LFP coherence and feature selectivity indeed re#ect more local synchronization at higher fre-quencies compared to more widespread synchrony at lower frequencies.
Siegel M and Donner TH, Linking Band-Limited Cortical Activity to fMRI and Behavior. In: Ullsperger, M and Debener S. Simultaneous EEG and fMRI - Recording, Analysis, and Application. New York: Oxford University Press, 2010.
11http://dx.doi.org/10.1093/acprof:oso/9780195372731.001.0001

is relation between spatial scale and frequency is also supported by theoretical studies. It has been suggested that, for spatially more separate neural ensembles, longer con-duction delays may constrain oscillatory interactions to lower frequencies (König and Schillen, 1991; Kopell et al., 2000), consistent with several invasive animal studies and non-invasive studies in humans: Long-range, inter-regional synchronization is typically expressed at frequencies below 40 Hz (Brovelli et al., 2004; Gross et al., 2004; Pesaran et al., 2008; Roelfsema et al., 1997; Saalmann et al., 2007; Sarn-thein et al., 1998). However, some studies found also syn-chronization between distant brain areas well above 40 Hz (Buschman and Miller, 2007; Engel et al., 1991; Siegel et al., 2008).
Considering the spatial scale (or spatial resolution) of measured signals is also particularly important for the in-terpretation of the MEG and EEG. Despite the application of advanced source-reconstruction techniques, the spatial resolution of EEG/MEG is likely one order of magnitude coarser than the resolution of the LFP. us, changes in the spatial structure of synchronized population activity can lead to different effects for LFP signals on the one hand and EEG/MEG signals on the other hand. Suppose a visual stimulus reduces frequency speci!c synchronization on a broader spatial scale of a few millimeters along the cortical surface, but has little effect on synchrony on a more local scale of less than one millimeter. en, the power of the LFP will show little decrease. By contrast, the coarser spa-tial resolution of the non-invasive recordings will lead to a more prominent power reduction for EEG/MEG signals. Such an effect could explain an apparent discrepancy be-tween LFP and MEG/EEG studies of visual stimulus re-sponses: For the EEG or MEG visual stimulation induce a strong suppression of low-frequency activity over wide, posterior brain regions (Donner et al., 2007; Hoogenboom et al., 2005; Siegel et al., 2007; Siegel et al., 2008; Tallon-Baudry et al., 1998), whereas this suppression is typically weaker, or even absent, for the LFP (Belitski et al., 2008; Berens et al., 2008a; Henrie and Shapley, 2005; Lee H et al., 2005; Liu and Newsome, 2006; Siegel and König, 2003).
Types of Neural Networks
It becomes increasingly clear that the spectral pro!le of neural population activity is critically determined by bio-physical properties on the cellular and network level. An intensely investigated example is the mechanism underly-ing the cortical spindle activity (8–14 Hz) observed during slow-wave sleep (Destexhe and Sejnowski, 2003; Llinas and Steriade, 2006). Detailed in vivo and in vitro studies at the cellular and network level, combined with numerous mod-eling studies, underline the importance of intrinsic cellular properties of thalamic neurons for the generation of these rhythms. alamocortical (TC) relay cells and thalamic
reticular (RE) neurons are equipped with voltage-dependent conductances that support intrinsically oscillat-ing !ring patterns. However, the spindle-activity observed in vivo does not only depend on these intrinsic cellular properties. Instead, such activity results from the interac-tions between these thalamic cell types as well as between thalamic and cortical neurons within large-scale cortico-thalamic loops (reviewed in Destexhe and Sejnowski, 2003).
Local, synchronized gamma-band activity in the cortex provides another prime example: Inhibitory interneurons play a key role for this type of activity. Networks of synapti-cally and electrically (gap-junctions) coupled interneurons engage in rhythmic gamma-band activity (Bartos et al., 2007; Whittington et al., 1995). roughout the cortex, inhibitory neurons interact with excitatory cells in local excitatory-inhibitory loops, in which they entrain and syn-chronize excitatory cells in a rhythmic fashion. Within each oscillatory cycle, excitatory neurons spike with a sufficient decline of network inhibition during the depolarizing phase of the LFP. is triggers the !ring of inhibitory neurons, which, in turn, shuts down excitatory neurons in a syn-chronized fashion until inhibition decays and the next cycle begins. Strong evidence for this mechanism has been ob-tained from the rodent hippocampus (Csicsvari et al., 2003) and the prefrontal cortex of anesthetized ferrets (Hasen-staub et al., 2005). Furthermore, two recent studies pro-vided direct causal evidence for this mechanism by optoge-netic manipulation of fast-spiking interneurons (Cardin et al., 2009; Sohal et al., 2009). e peak frequency and band-width of these local gamma-band processes seem critically determined by the cellular properties of the participating neurons (Bartos et al., 2007). It remains open to which ex-tent this also holds for other types of neural oscillations.
Gieselmann and iele (2008) provided indirect evi-dence that gamma-band activity of the LFP indeed re#ects the underlying inhibitory activity. e authors recorded spiking activity and LFPs in V1 of behaving monkeys pre-sented with visual gratings of variable size. Gratings extend-ing beyond the summation area of receptive !elds inhibited spiking activity (presumably due to lateral inhibition), while the LFP gamma-band activity increased monotoni-cally for all grating sizes. us, rather than re#ecting only excitatory drive, the gamma-band LFP seems to re#ect the oscillatory interaction between local excitation and inhibi-tion. e fact that band-limited population activity re#ects excitatory-inhibitory interactions, and active processing within speci!c functional networks, rather than mere aver-age levels of excitation seems particularly important if one aims to link band-limited cortical population activity to the fMRI signal.
Siegel M and Donner TH, Linking Band-Limited Cortical Activity to fMRI and Behavior. In: Ullsperger, M and Debener S. Simultaneous EEG and fMRI - Recording, Analysis, and Application. New York: Oxford University Press, 2010.
12http://dx.doi.org/10.1093/acprof:oso/9780195372731.001.0001

Linking Band-Limited Neural Activity to fMRI
We will now discuss attempts to uncover the relationship between band-limited neural activity (as measured by the LFP, EEG, or MEG) on the one hand and the BOLD fMRI signal on the other hand. We will adopt a descriptive per-spective, searching for simple rules that may govern this relationship at the macroscopic level. In principle, we might be able to identify such rules despite our present lack of a detailed understanding of each of the signals' generation from the activity of individual neurons and neuronal cir-cuits. As in the previous section, we will contrast stimulus-driven responses with neural activity re#ecting higher-order cognitive processes. e relationship between band-limited activity and fMRI seems relatively simple and rea-sonably well understood for the former, but more complex, and as yet elusive, for the latter.
Simultaneous Versus Nonsimultaneous Measurements
Electrophysiological and fMRI recordings can be integrated based on either simultaneous or nonsimultaneous meas-urements. Nonsimultaneous recordings are technically less intricate, provide optimal signal quality in both recording modalities, and allow for optimizing the experimental de-sign within each modality. By contrast, simultaneous re-cordings ensure that the data in both modalities have been obtained under exactly identical conditions and are par-ticularly well suited for studies of dynamic changes, such as learning.
One general important issue in this context is that dif-ferent sources of variance can drive correlations between the signals measured with both modalities: variance across different experimental conditions and variance across time or trials within conditions. Nonsimultaneously recorded signals can only be linked based on the covariance con-trolled by experimental conditions (e.g., stimulus contrast, cognitive task, or behavioral report). Simultaneously re-corded signals, however, can also be linked based on the covariance of their trial-to-trial #uctuations, which are not controlled by the experimenter. Such intrinsic, stimulus-independent #uctuations are a pervasive feature of neural activity (Ermentrout et al., 2008; Faisal et al., 2008; Fox and Raichle, 2007; Leopold et al., 2003). One might obtain dif-ferent correlations between electrophysiology and fMRI, depending on the source of variance (experimental condi-tions vs. trial-to-trial) used for the analysis. is has imme-diate consequences for the question of whether one should perform simultaneous or nonsimultaneous recordings: e nonsimultaneous approach seems sufficient for identifying the relationship between stimulus-driven responses in the different modalities; the same holds for cognitive processes well controlled by the task at hand. By contrast, the simul-
taneous approach is preferable for determining the relation-ship between intrinsic signal #uctuations, whether meas-ured in the “resting state” or in the presence of a stimulus or task.
For the EEG, it is also important to consider that corre-lations with local fMRI signals do not necessarily identify electrophysiological activity from that same region. For example, several studies have identi!ed a correlation be-tween widespread alpha-band EEG activity on the human scalp and simultaneously recorded fMRI signals in the thalamus. Does this imply that the scalp-EEG alpha-band activity directly re#ects the electrical !elds generated by a thalamic source? Certainly not. Rather, this correlation is likely to be caused by a modulation of cortical sources of alpha-band EEG activity by thalamic input (Feige et al., 2005; Goldman et al., 2002; Mantini et al., 2007; Moosmann et al., 2003; Steriade, 2000). Such indirect correlations can be exploited for investigating which brain structures modu-late band-limited population activity in other cortical areas. However, if one aims at identifying correlations driven by identical structures for the EEG and fMRI signal, source-reconstruction techniques (see above) should be used to project the EEG data into a common source-space where they can be more directly correlated with the fMRI data.
Different Windows into Interactions Between Brain Areas
Analyses of “functional connectivity” (i.e., correlations be-tween remote fMRI time-series) are a common motif in fMRI research (Friston, 2002). In particular, studies of co-herent resting-state #uctuations across large-scale cortical and subcortical networks are increasing in popularity (Fox and Raichle, 2007). It is by no means straightforward to establish a direct correspondence between the phase coher-ence of electrophysiological signals at a !ne temporal scale and the temporal correlations of sluggish fMRI signals. e fMRI signal is likely to be blind to the phase coherence between cortical responses, at least in intermediate- and high-frequency (beta and gamma) ranges. Instead, experi-mental evidence suggests that correlations between the amplitude envelopes of band-limited cortical responses may be the source of the correlations between distant fMRI time-series (Leopold et al., 2003; Nir et al., 2008). However, it is important to note that the phase coherence and the correlation between the amplitude envelopes of two signals are independent of one another. For example, the amplitude envelopes (i.e., power) of the gamma-band responses of two regions can covary strongly, despite their phases' being ran-domly distributed. e reverse can be true as well. Slow covariations between amplitude envelopes are typically as slow as the resting-state #uctuations of the fMRI signal, in that they have a 1/f spectrum with dominant frequencies at 0.1 Hz and below (Fox and Raichle, 2007). Such slow co-variations may not play a direct role in neural coding. It has
Siegel M and Donner TH, Linking Band-Limited Cortical Activity to fMRI and Behavior. In: Ullsperger, M and Debener S. Simultaneous EEG and fMRI - Recording, Analysis, and Application. New York: Oxford University Press, 2010.
13http://dx.doi.org/10.1093/acprof:oso/9780195372731.001.0001
been speculated that they re#ect common input from neu-romodulatory projections ascending from the brainstem (Leopold et al., 2003). If so, such slow intrinsic signal #uc-tuations may generally have strong links to cognition and behavioral performance across a large variety of tasks (see below, “Questions for future research”).
ere is also ample evidence that correlations between remote fMRI time series at faster time scales re#ect percep-tion, attention, and behavioral performance (Freeman et al., 2008; Friston, 2002; Haynes et al., 2005b; Haynes et al., 2005c). ese results strongly suggest that the fMRI signal provides a meaningful measure of the interaction between neuronal populations in cortex. Again, these correlations likely re#ect amplitude correlations of band-limited activity, on a faster time scale than during resting state, but meas-urements to test this hypothesis have not yet been done.
Stimulus-Driven Responses in Sensory Cortex
Electrophysiological and fMRI measurements in primary visual cortex suggest a tight covariation between modula-tions of the BOLD signal and of gamma-band LFP and MEG activity correlated with stimulus strength. Logothetis et al. (2001) simultaneously recorded BOLD fMRI, spikes, and LFPs in monkey V1. Consistent with other reports (Henrie and Shapley, 2005), they found strong and sus-tained LFP responses to visual stimulation in the gamma band that peaked around 70 Hz and increased approxi-mately linearly with stimulus contrast. ese LFP responses were well correlated with modulations of the BOLD signal that showed a similar linear increase with stimulus contrast. A tight coupling between contrast-dependent modulation of the BOLD signal and gamma-band activity is also sup-ported for human V1 by means of nonsimultaneous non-invasive recordings. A similar linear increase with stimulus contrast is found for the BOLD response (Boynton et al., 1999) and gamma-band activity (30–70 Hz) reconstructed from MEG (Hall et al., 2005) (see also “Linking band-limited neural activity to behavior,” above).
A similarly tight relationship between the BOLD signal and gamma-band activity seems to hold for human area MT+ for modulations of visual motion strength. Rees et al. (2000) found a linear increase of the BOLD signal in hu-man area MT+ with motion strength. Siegel et al. (2007) demonstrated a similar linear increase of MEG activity in the gamma band (60–100 Hz) in area MT+ and several other motion responsive regions along the dorsal visual pathway (Figure 4.1.2). Further, albeit weaker and less con-sistently, low-frequency activity (10–30 Hz) decreased with increasing motion strength.
ese !ndings are consistent with a series of LFP re-cordings in the auditory cortex of epileptic patients. ese exploited “inter-subject correlation”5 to establish indirect links between the LFP and fMRI activity in normal sub-
jects. Mukamel et al. (2005) recorded LFPs and found a positive correlation of LFP power in the gamma band (40–130 Hz), and a negative correlation of LFP power in the alpha band (5–15 Hz), each with fMRI in auditory cortex. Intermediate bands showed little effect. Nir et al. (2007) further established that this observation also holds for spontaneous activity and that occasional dissociations be-tween SUA and the fMRI response tended to be accompa-nied by reductions of the correlation between the spiking activity of individual neurons and the gamma-band LFP. In other words, whenever, single neurons activate coherently with the surrounding network, their spiking activity is closely coupled to the fMRI signal; whenever they deviate from the mean of their neighborhood, their spiking activity is a poor predictor of the fMRI signal.
Perception-Related Activity in Visual Cortex
Binocular rivalry has been a major source of apparent dis-crepancies between electrophysiology in fMRI. In binocular rivalry, a bistable visual illusion, two dissimilar patterns presented to the two eyes cannot be fused, and are conse-quently perceived in alternation (Blake and Logothetis, 2002). fMRI studies of rivalry consistently found strong response modulations correlated with perception in early visual cortex including V1, and even in the LGN (Haynes et al., 2005a; Lee SH et al., 2005; Lee et al., 2007; Meng et al., 2005; Polonsky et al., 2000; Tong and Engel, 2001; Wunder-lich et al., 2005). By contrast, single-unit recordings in awake, behaving monkeys found little modulation in V1 with perception (Blake and Logothetis, 2002; Leopold and Logothetis, 1996). Similarly, the LFP recordings in monkey V1 during binocular rivalry and a related perceptual sup-pression phenomenon reported little modulation of the gamma-band LFP with visual awareness. However, as dis-cussed above, these studies observed strong perception-related LFP modulations in the low frequency range (< 30 Hz) correlated with perception (Gail et al., 2004; Maier et al., 2008; Wilke et al., 2006), prompting the hypothesis that these may have been the source of the fMRI responses measured in human V1 during binocular rivalry.
Maier et al. (2008) addressed this issue by comparing electrophysiological responses with the fMRI signal in ma-caque V1, measured within the same animals and experi-mental protocol. When a salient visual target was physically removed from the screen, responses decreased for all three measures of neural activity, and in particular for a broad frequency range of the LFP, including the gamma band (30–100 Hz). However, when the target was rendered sub-jectively invisible by means of “generalized #ash suppres-sion” (a bistable visual illusion analogous to binocular ri-valry), these signals diverged: ere was a strong reduction of the fMRI response with perceptual suppression, little modulation of the high frequency LFP and MUA spiking
Siegel M and Donner TH, Linking Band-Limited Cortical Activity to fMRI and Behavior. In: Ullsperger, M and Debener S. Simultaneous EEG and fMRI - Recording, Analysis, and Application. New York: Oxford University Press, 2010.
14http://dx.doi.org/10.1093/acprof:oso/9780195372731.001.0001

activity, and an intermediate reduction of the low frequency LFP. In other words, virtually identical decreases of the fMRI response during physical removal and subjective dis-appearance conditions were accompanied by distinctly dif-ferent spectral !ngerprints: e low-frequency suppression was paralleled by an enhancement in an intermediate fre-quency range (30–40 Hz), and a suppression in the high gamma frequency range (60–80 Hz). e dissociation be-tween the spectral modulations correlated with fMRI re-sponses during physical removal and perceptual suppres-sion demonstrates the context-dependent relationship be-tween these two measures of neural population activity.
A human fMRI study of “motion-induced blindness”6 (Donner et al., 2008) indicates that the topography of re-sponse modulations correlated with perceptual suppression provides clues to the underlying mechanisms, in a similar fashion as the corresponding spectral !ngerprints. Also during motion-induced blindness, the fMRI response in V1 modulated strongly with perceptual suppression. However, this modulation was not con!ned to the cortical represen-tation of the small target stimulus, but expressed through-out the entire visual !eld representation in V1. Such a “global” modulation can hardly be a speci!c correlate of the localized target suppression. When this global component was removed from the fMRI signals measured in the retino-topic target subregions of areas V1 through V4, the residual target-speci!c responses tracked the illusory target suppres-sion strongly only in V4 and showed no modulation in V1. ese residual target-speci!c responses may re#ect local modulations of spiking activity and/or the gamma-band LFP (Liu and Newsome, 2006; Logothetis and Wandell, 2004; Nir et al., 2007). By contrast, the “global” response component might re#ect widespread modulations of the low frequency LFP, perhaps driven by subcortical inputs. Future studies should characterize the topography of the low-frequency electrophysiological signal components cor-related with perceptual suppression. A more general impli-cation may be that, for the fMRI signal, it is the spatial (rather than temporal) pattern that may be used for infer-ring underlying mechanisms: Stimulus representations are expressed in the spatial !ne structure (Donner et al., 2008; Haynes and Rees, 2006), whereas neuromodulatory proc-esses acting on these representations are expressed in the global modulations (Donner et al., 2008; Jack et al., 2006).
Studies of attentional modulation of neural responses in visual cortex are another source of apparent discrepancies between electrophysiology in fMRI. First, spatial attention seems to have little effect on !ring rates in monkey V1 (De-simone and Duncan, 1995; Luck et al., 1997; but see Chen et al., 2008; Herrero et al., 2008; Roelfsema et al., 1998), but strong effect on the fMRI signal in human V1 (Brefczynski and DeYoe, 1999; Kastner et al., 1999; Ress et al., 2000; Somers et al., 1999). Second, in the absence of sensory stimulation, attention has only modest effect on baseline
!ring rates in early visual cortex (V1, V2) (Luck et al., 1997), but again a big effect on the fMRI signal (Kastner et al., 1999; Ress et al., 2000). In principle, these discrepancies could merely be due to the different species, stimuli, and behavioral protocols (e.g. near-threshold vs. suprathreshold stimuli), or they may re#ect true differences between the different signals. For example, the effects of attention on the fMRI signal could re#ect relatively small modulations of synaptic activity, which are coherent across large popula-tions of neurons, and therefore have a strong impact on population signals, but are weakly re#ected by single-unit activity. Alternatively, these dissociations might re#ect a primary modulation of the temporal structure of neuronal population activity, which, in turn, might have a particu-larly strong effect on the fMRI response.
Although there were several differences in terms of behavioral protocols, studies of band-limited population activity are beginning to shed new light on these issues. ese studies demonstrated profound attentional modula-tion of band-limited population activity in the human brain (Doesburg et al., 2008; Fan et al., 2007; Fries et al., 2001; Gruber et al., 1999; Siegel et al., 2008; Taylor et al., 2005; ut et al., 2006; Worden et al., 2000; Wyart and Tallon-Baudry, 2008). One MEG study (Siegel et al., 2008) com-pared attentional baseline and stimulus-related effects and characterized modulations in V1 and MT+ at the cortical source-level (see also above, “Linking band-limited neural activity to behavior: perception-related activity in visual cortex”). In accordance with fMRI (Kastner et al., 1999; Sapir et al., 2005) attention modulated population activity in both regions during the baseline and stimulus intervals in a spatially selective fashion. However, the spectral !n-gerprints of these effects differed strongly between V1 and MT+, and even more surprisingly, between the baseline and stimulation intervals, within each area. Invasive recordings in monkey area V4 also displayed an (albeit weaker) analo-gous difference in attention effects between baseline and stimulation intervals (Fries et al., 2008b).
In conclusion, attentional effects in visual cortex per-haps do not exhibit a stereotype relation between the BOLD signal and electrophysiological population activity in a sin-gle frequency band. However, it remains difficult to assess to which extent the difference between regions found by means of MEG can also be observed on the LFP level. For example, it remains open to which extent extracranially recorded effects are affected by interactions of center-surround type attentional modulations (Silver et al., 2007) with the comparatively low spatial resolution of EEG/MEG (see also above “Spatial Scales of Measurements and Neural Networks”).
Siegel M and Donner TH, Linking Band-Limited Cortical Activity to fMRI and Behavior. In: Ullsperger, M and Debener S. Simultaneous EEG and fMRI - Recording, Analysis, and Application. New York: Oxford University Press, 2010.
15http://dx.doi.org/10.1093/acprof:oso/9780195372731.001.0001
Integrative Processes in Frontal and Parietal Association
Cortex
Numerous fMRI studies have probed the involvement of prefrontal and posterior parietal association cortex in selec-tive attention, sensorimotor integration, and decision-making (Corbetta and Shulman, 2002; Desimone and Dun-can, 1995; Gold and Shadlen, 2007; Heekeren et al., 2008; Kanwisher and Wojciulik, 2000; Kastner and Ungerleider, 2000; Miller and Cohen, 2001; Schall, 2001). How closely are the fMRI correlates of these processes related to their electrophysiological correlates discussed in the previous section? Unfortunately, only few electrophysiological stud-ies have used experimental protocols directly comparable to the fMRI studies. Also, few studies have applied source reconstruction techniques to estimate activity speci!cally in prefrontal and parietal cortex. Both limitations hamper a close comparison between the different measurement mo-dalities.
Studies of saccade planning suggest a simple relation-ship between measurement modalities in parietal associa-tion cortex that is largely consistent with the picture emerg-ing for stimulus-driven responses in sensory cortex. Several fMRI studies have demonstrated retinotopically speci!c fMRI activity in the posterior parietal cortex when human subjects remembered the position of a visual target for a delayed saccade (Hagler and Sereno, 2006; Kastner et al., 2007; Schluppeck et al., 2005; Sereno et al., 2001; Swisher et al., 2007). Converging evidence from monkey and human electrophysiology suggests that such fMRI activity is closely linked to band-limited population activity in the gamma band. Pesaran et al. (2002) demonstrated saccade direction-selective gamma-band activity in monkey area LIP during a delay before saccade execution. Van der Werf et al. (2008) found analogous saccade direction-selective gamma-band activity in the human intraparietal sulcus.
However, the situation appears more complex for stud-ies of attention and decision processes in the same or neighboring cortical networks. ere appears to be a posi-tive correlation between electrophysiological activity in the low-beta frequency range (about 12–24 Hz) and fMRI ac-tivity in posterior parietal and prefrontal cortex during visual detection tasks. Successful target detection is typi-cally associated with increased fMRI activity in prefrontal and posterior parietal cortex; this is true for motion detec-tion in noise (Shulman et al., 2001), change detection (Beck et al., 2001), #icker detection (Carmel et al., 2006), and target letter detection (Kranczioch et al., 2005; Marois et al., 2004). Recent MEG studies found detection-related en-hancements of low beta-band (12–24 Hz) activity in corre-sponding frontal-parietal regions (Donner et al., 2007; Gross et al., 2004; Linkenkaer-Hansen et al., 2004), suggest-ing that such performance-related lower frequency activity in frontal-parietal networks correlates positively with the
fMRI response in these regions of association cortex, differ-ent from the stimulus-induced suppression of low fre-quency activity in visual cortex. is again suggests that the link between fMRI and electrophysiology may differ sub-stantially between functional processes and cortical regions.
e above studies also illustrate the point that spectral !ngerprints of different functional processes may superim-pose in a complex fashion, with unknown consequences for the fMRI signal. In particular the performance-related beta activity during motion detection was superimposed onto a more broadband (about 8–50 Hz) stimulus-induced low-frequency suppression (Figure 4.1.5); these two signal com-ponents were independent of one another in their trial-to-trial #uctuations and spatial topography (Donner et al., 2007). Both, the stimulus-induced low-frequency suppres-sion in visual and parietal cortex and the detection-related beta-band enhancement in parietal and prefrontal cortex presumably correlate with increased fMRI responses in different (partially overlapping) cortical regions. Again, this suggests a process- and perhaps area-dependence of the link between fMRI and electrophysiological mass activity.
Questions for Future Research
In the !nal part of this chapter, we will put forward three questions for future research, the answers to which will be particularly important for understanding the relationship between band-limited neural population activity and both, behavior and the fMRI signal.
What is the Link Between Intracortical and Extracranial
Electrophysiology?
Despite the convergence between LFP and EEG/MEG stud-ies that we have highlighted in this chapter, it is still an open question how exactly intracortical LFPs relate to ex-tracranial EEG/MEG signals. For example, which effect does the spatial correlation-structure of neural activity have on invasively and non-invasively recorded signals? e coarser spatial resolution of the latter suggests that they are more sensitive to long-range correlations of neural activity while the LFP primarily re#ects synchronized activity on a local spatial scale. us, depending on the signal type, the spatial correlation pro!le of neural activity and its modula-tion by stimuli or cognitive processes may have profoundly different effects. Similar open questions are to which extent the laminar pro!le of activity affects different population signals or which role the individual anatomical geometry (gyri, sulci) plays for the relationship between these signals. Quantitative measurements addressing these questions are largely missing (but see Juergens et al., 1999; Mitzdorf, 1987). Addressing them seems crucial for integrating re-sults across different signal scales, and for making infer-
Siegel M and Donner TH, Linking Band-Limited Cortical Activity to fMRI and Behavior. In: Ullsperger, M and Debener S. Simultaneous EEG and fMRI - Recording, Analysis, and Application. New York: Oxford University Press, 2010.
16http://dx.doi.org/10.1093/acprof:oso/9780195372731.001.0001
ences between these different levels of observation. Simul-taneous LFP and EEG/MEG recordings seem particularly promising for directly elucidating these questions. Fur-thermore, sub- or epidural surface electrodes (ECoG) con-stitute an intermediate scale, which might provide a valu-able link between intracortical and extracranial signals. Such “intracranial EEG” recordings for research purposes are becoming more frequent, both in human patients (Engel et al., 2005; Lachaux et al., 2003) as well as in non-human primates (Bressler et al., 1993; Tallon-Baudry et al., 2004; Taylor et al., 2005).
How Does Neural Mass Activity Relate to Local Circuit
Dynamics?
Attempts to link fMRI and electrophysiological population signals will fall short if these signals are understood as sim-ply re#ecting average “activation” levels of cortical regions with different temporal resolution. Both signals are gener-ated by complex interactions between various specialized cell-types within local neuronal circuits (e.g., Heeger and Ress, 2002; Lauritzen, 2005; Logothetis, 2008; Logothetis and Wandell, 2004). We are beginning to understand the principles underlying the processing in such micro-circuits (Douglas and Martin, 2004). It is clear that inhibitory neu-rons play an integral part in shaping basic tuning properties of individual cortical neurons (Carandini et al., 1997; Hee-ger et al., 1996; Shapley et al., 2003) as well as generating local network oscillations, e.g., in the gamma band (Bartos et al., 2007). In addition, inhibition might also play a cru-cial role in high-level cognitive processes such as selective attention (Mitchell et al., 2007). Yet, relatively little is known about how speci!c cognitive processes affect local network dynamics and how these in turn transfer into modulations of neuronal mass signals as measured with electrophysiology and fMRI. Again, integrated experimen-tal approaches using comparable behavioral protocols and combinations of electrophysiological and functional imag-ing techniques are required to address these questions. Fur-thermore, cell-type and layer-speci!c recordings, as well as genetically targeted manipulations of speci!c cell classes seem promising techniques to further our understanding of local cortical circuit dynamics and their relation to neural mass signals.
How Does Neuromodulation Shape the Spectral Fingerprints
of Cortical Processes?
Several nuclei in the basal forebrain and brainstem send massive, and relatively diffuse neuromodulatory (adrener-gic, cholinerig, etc.) projections to wide regions of the cor-tex. ese neuromodulators seem to play an important role in shaping band-limited cortical population activity (Munk et al., 1996; Rodriguez et al., 2004; Steriade, 2000). ese
ascending systems have traditionally been thought of as merely regulating slow #uctuations of coarse behavioral states, such as vigilance and arousal (Steriade, 2000). How-ever, growing theoretical and empirical evidence suggests that neuromodulators play more speci!c computational roles in selective attention, short-term memory, and decision-making (Aston-Jones and Cohen, 2005; Hasselmo, 1995; Herrero et al., 2008; Usher et al., 1999; Wang et al., 2007; Yu and Dayan, 2005). Taken together, these lines of evidence suggest that neuromodulators may be an essential factor determining the spectral !ngerprints of these cogni-tive processes. Direct studies of neuromodulator effects on cortical population activity in awake, behaving animals will provide deeper insights into this issue. Such studies could use either local (Herrero et al., 2008) or systemic (Bentley et al., 2003; Coull et al., 1999; Coull et al., 2001; Minzenberg et al., 2008) pharmacological manipulations, or simultaneous measurements of activities in subcortical neuromodulatory centers and in their cortical recipients (Minzenberg et al., 2008). e latter is one area of research for which simulta-neous EEG and fMRI recordings might prove to be ex-tremely useful. Simultaneously monitoring subcortical neu-romodulatory centers, such as the noradrenergic locus co-eruleus with fMRI and widespread band-limited activity patterns in the cortex with EEG during the performance of cognitive tasks could provide deep insights into how the spectral !ngerprints of cognitive processes are shaped by subcortical centers.
Conclusion
We have addressed the relationship of band-limited elec-trophysiological mass activity to behavior on the one hand, and to the BOLD fMRI signal on the other hand. Electro-physiological mass activity generally re#ects several differ-ent components of neuronal activity, which are generated by distinct neural mechanisms and expressed in different fre-quency ranges. e relative strengths of these components thus determine what we have called the speci!c spectral !ngerprint of a perceptual or cognitive process (and per-haps even of a given brain area involved in this process). We have highlighted a striking discrepancy between the spectral !ngerprint of stimulus-driven responses in sensory cortices and the !ngerprints of intrinsic processes (such as top-down attention or switches between perceptual states) within the same cortical areas. We speculate that this disso-ciation re#ects recurrent interactions between distant corti-cal areas and/or neuromodulation of cortical activity pat-terns by ascending systems, which are both thought to play an important role in such processes. If this idea turns out to be correct, we may be able to exploit the spectral !nger-prints of functional processes for inferring about the de-tailed mechanisms underlying these processes.
Siegel M and Donner TH, Linking Band-Limited Cortical Activity to fMRI and Behavior. In: Ullsperger, M and Debener S. Simultaneous EEG and fMRI - Recording, Analysis, and Application. New York: Oxford University Press, 2010.
17http://dx.doi.org/10.1093/acprof:oso/9780195372731.001.0001

e fMRI signal, likewise, re#ects several different components of neuronal activity. Since the sluggish fMRI signal does not have the temporal !ne structure of electro-physiological signals, we cannot use its frequency spectrum to disentangle these different components. However, we may use the scale (local vs. global) of spatial patterns to make inferences about the underlying mechanisms: Neu-ronal representations are likely to be expressed in the local structure of neural population responses, whereas neuro-modulatory processes may be expressed in more global response modulations. Importantly, the multi-component nature of electrophysiological activity and the fMRI signal explains why there does not seem to be a simple, stationary transformation between the two. is important point has oen been overlooked in recent discussions. Instead, we suggest that there may exist a cohort of such transforma-tions, one for each class of functional processes and perhaps brain areas. e close coupling between gamma-band activ-ity and the fMRI signal for stimulus-driven responses of sensory cortical regions provides a well established exam-ple, the mechanisms of which we are beginning to under-stand. In this case, identifying the spectral !ngerprints of the functional processes would also help de!ne the relation between electrophysiological activity and the fMRI signal. Even if such cohorts of transformations do not exist, char-acterizing the neural basis of a process under study with both electrophysiology and fMRI will provide more insights than each of these measurements alone.
Acknowledgments
We thank Timothy J. Buschman, Ilan Dinstein, Luke Hallum, David J. Heeger, Jörg F. Hipp, Christopher Honey, Rafael Malach, Yuval Nir, Jefferson Roy, Nava Rubin, and Robert Shapley for comments. is work has been supported by research grants from the German Acad-emy of Science Leopoldina (THD: BMBF-LPD 9901/8-136), the Na-tional Institutes of Health (THD: R01-EY16752 to David J. Heeger, MS: R01-NS035145 to Earl K. Miller), and the National Science Foundation/CELEST (MS: CGC-187353NGA to Earl K. Miller).
Notes
1. e term neuromodulation refers to the fact that these respective neurotransmitters (such as norepinephrine or acetylchholine) bind on postsynaptic receptors, which are not directly coupled to ion channels, but instead exert their effects on cortical neurons via second messenger cascades (Hasselmo, 1995).
2. In fact, this is the case, from which the spectral analysis approach to EEG has originally emerged (Mitra and Bokil, 2007).
3. We will not discuss the hypothesis that synchronized population activity serves as a relational code that represents which elemen-tary features belong to the same sensory object (“binding by syn-chrony”). Evidence has been provided in support of (Castelo-Branco et al., 2000; Eckhorn et al., 1988; Gray et al., 1989; Kreiter
and Singer, 1996) as well as against (Lamme and Spekreijse, 1998; Palanca and DeAngelis, 2005; iele and Stoner, 2003) this speci#c hypothesis, and it has been intensely debated elsewhere (Riesen-huber and Poggio, 1999; Shadlen and Movshon, 1999; Singer, 1999).
4. When two target objects (e.g., letters) are presented in close tem-poral succession during rapid serial presentation, subjects fre-quently miss the second, suggesting that attention (i.e., the mind's eye) “blinks” aer detection of the #rst.
5. “Inter-subject correlation” refers to the phenomenon that, while subjects watch engaging movies, neural population responses tend to become highly correlated across subjects, for multiple areas of the cortical hierarchy (Hasson et al., 2004).
6. Motion-induced blindness is a bistable perceptual suppression phenomenon analogous to binocular rivalry and generalized %ash suppression, in which a salient target stimulus disappears sponta-neously from conscious perception when surrounded by a moving %ow #eld, only to reappear several seconds later (Bonneh et al., 2001).
References
Alonso JM, Usrey WM, Reid RC (1996) Precisely correlated #ring in cells of the lateral geniculate nucleus. Nature 383:815–819.
Aston-Jones G|Cohen JD (2005) An integrative theory of locus coeruleus-norepinephrine function: adaptive gain and optimal performance. Annu Rev Neurosci 28:403–450.
Azouz R, Gray CM (2000) Dynamic spike threshold reveals a mecha-nism for synaptic coincidence detection in cortical neurons in vivo. Proc Natl Acad Sci U S A 97:8110–8115.
Azouz R, Gray CM (2003) Adaptive coincidence detection and dy-namic gain control in visual cortical neurons in vivo. Neuron 37:513–523.
Bartos M, Vida I, Jonas P (2007) Synaptic mechanisms of synchronized gamma oscillations in inhibitory interneuron networks. Nat Rev Neurosci 8:45–56.
Beck DM, Rees G, Frith CD, Lavie N (2001) Neural correlates of change detection and change blindness. Nat Neurosci 4:645–650.
Bedard C, Kroger H, Destexhe A (2006) Does the 1/f frequency scaling of brain signals re%ect self-organized critical states? Phys Rev Lett 97:118–102.
Belitski A, Gretton A, Magri C, Murayama Y, Montemurro MA, Lo-gothetis NK, Panzeri S (2008) Low-frequency local #eld potentials and spikes in primary visual cortex convey independent visual information. J Neurosci 28:5696–5709.
Bentley P, Vuilleumier P, iel CM, Driver J, Dolan RJ (2003) Effects of attention and emotion on repetition priming and their modulation by cholinergic enhancement. J Neurophysiol 90:1171–1181.
Berens P, Keliris GA, Ecker AS, Logothetis NK, Tolias AS (2008a) Comparing the feature selectivity of the gamma-band of the local #eld potential and the underlying spiking activity in primate vis-ual cortex. Front Syst Neurosci 2:2.
Berens P, Keliris GA, Ecker AS, Logothetis NK, Tolias AS (2008b) Feature selectivity of the gamma-band of the local #eld potential in primate primary visual cortex. Front Neurosci 2:199–207.
Bichot NP, Rossi AF, Desimone R (2005) Parallel and serial neural mechanisms for visual search in macaque area V4. Science 308:529–534.
Blake R, Logothetis NK (2002) Visual competition. Nat Rev Neurosci 3:13–21.
Bonneh YS, Cooperman A, Sagi D (2001) Motion-induced blindness in normal observers. Nature 411:798–801.
Siegel M and Donner TH, Linking Band-Limited Cortical Activity to fMRI and Behavior. In: Ullsperger, M and Debener S. Simultaneous EEG and fMRI - Recording, Analysis, and Application. New York: Oxford University Press, 2010.
18http://dx.doi.org/10.1093/acprof:oso/9780195372731.001.0001

Boynton GM, Demb JB, Glover GH, Heeger DJ (1999) Neuronal basis of contrast discrimination. Vision Res 39:257–269.
Brefczynski JA, DeYoe EA (1999) A physiological correlate of the “spotlight” of visual attention. Nat Neurosci 2:370–374.
Bressler SL, Coppola R, Nakamura R (1993) Episodic multiregional cortical coherence at multiple frequencies during visual task per-formance. Nature 366:153–156.
Brosch M, Bauer R, Eckhorn R (1995) Synchronous high-frequency oscillations in cat area 18. Eur J Neurosci 7:86–95.
Brovelli A, Ding M, Ledberg A, Chen Y, Nakamura R, Bressler SL (2004) Beta oscillations in a large-scale sensorimotor cortical network: directional in%uences revealed by Granger causality. Proc Natl Acad Sci U S A 101:9849–9854.
Bruno RM, Sakmann B (2006) Cortex is driven by weak but synchro-nously active thalamocortical synapses. Science 312:1622–1627.
Buschman TJ, Miller EK (2007) Top-down versus bottom-up control of attention in the prefrontal and posterior parietal cortices. Sci-ence 315:1860–1862.
Buzsaki G, Draguhn A (2004) Neuronal oscillations in cortical net-works. Science 304:1926–1929.
Buzsaki G, Kandel A (1998) Somadendritic backpropagation of action potentials in cortical pyramidal cells of the awake rat. J Neuro-physiol 79:1587–1591.
Carandini M, Heeger DJ, Movshon JA (1997) Linearity and normaliza-tion in simple cells of the macaque primary visual cortex. J Neuro-sci 17:8621–8644.
Cardin JA, Carlen M, Meletis K, Knoblich U, Zhang F, Deisseroth K, Tsai LH, Moore CI (2009) Driving fast-spiking cells induces gamma rhythm and controls sensory responses. Nature 459:663–667.
Carmel D, Lavie N, Rees G (2006) Conscious awareness of %icker in humans involves frontal and parietal cortex. Curr Biol 16:907–911.
Castelo-Branco M, Goebel R, Neuenschwander S, Singer W (2000) Neural synchrony correlates with surface segregation rules. Nature 405:685–689.
Chen Y, Martinez-Conde S, Macknik SL, Bereshpolova Y, Swadlow HA, Alonso JM (2008) Task difficulty modulates the activity of speci#c neuronal populations in primary visual cortex. Nat Neu-rosci 11:974–982.
Corbetta M, Shulman GL (2002) Control of goal-directed and stimulus-driven attention in the brain. Nat Rev Neurosci 3:201–215.
Coull JT, Buchel C, Friston KJ, Frith CD (1999) Noradrenergically mediated plasticity in a human attentional neuronal network. Neuroimage 10:705–715.
Coull JT, Nobre AC, Frith CD (2001) e noradrenergic alpha2 agonist clonidine modulates behavioural and neuroanatomical correlates of human attentional orienting and alerting. Cereb Cortex 11:73–84.
Crone NE, Miglioretti DL, Gordon B, Lesser RP (1998a) Functional mapping of human sensorimotor cortex with electrocortico-graphic spectral analysis. II: Event-related synchronization in the gamma band. Brain 121 (Pt 12):2301–2315.
Crone, NE, Miglioretti DL, Gordon B, Sieracki JM, Wilson MT, Ue-matsu S, Lesser RP (1998b) Functional mapping of human senso-rimotor cortex with electrocorticographic spectral analysis. I: Alpha and beta event-related desynchronization. Brain 121 (Pt 12):2271–2299.
Csicsvari J, Jamieson B, Wise KD, Buzsaki G (2003) Mechanisms of gamma oscillations in the hippocampus of the behaving rat. Neu-ron 37:311–322.
deCharms RC, Zador A (2000) Neural representation and the cortical code. Annu Rev Neurosci 23:613–647.
Desimone R, Duncan J (1995) Neural mechanisms of selective visual attention. Annu Rev Neurosci 18:193–222.
Destexhe A, Sejnowski TJ (2003) Interactions between membrane conductances underlying thalamocortical slow-wave oscillations. Physiol Rev 83:1401–1453.
Dietsch G (1932) Fourier-analyse von Elektroenkephalogrammen des Menschen. P%ger's Arch Ges Physiol 230:106–112.
Doesburg SM, Roggeveen AB, Kitajo K, Ward LM (2008) Large-scale gamma-band phase synchronization and selective attention. Cereb Cortex 18:386–396.
Donner TH, Kettermann A, Diesch E, Ostendorf F, Villringer A, Brandt SA (2000) Involvement of the human frontal eye #eld and multiple parietal areas in covert visual selection during conjunc-tion search. Eur J Neurosci 12:3407–3414.
Donner TH, Siegel M, Oostenveld R, Fries P, Bauer M, Engel AK (2007) Population activity in the human dorsal pathway predicts the accuracy of visual motion detection. J Neurophysiol 98:345–359.
Donner TH, Sagi D, Bonneh YS, Heeger DJ (2008) Opposite neural signatures of motion-induced blindness in human dorsal and ventral visual cortex. J Neurosci 28:10298–10310.
Douglas RJ, Martin KA (2004) Neuronal circuits of the neocortex. Annu Rev Neurosci 27:419–451.
Eckhorn R, Bauer R, Jordan W, Brosch M, Kruse W, Munk M, Reit-boeck HJ (1988) Coherent oscillations: a mechanism of feature linking in the visual cortex? Multiple electrode and correlation analyses in the cat. Biol Cybern 60:121–130.
Engel AK, Kreiter AK, Konig P, Singer W (1991) Synchronization of oscillatory neuronal responses between striate and extrastriate visual cortical areas of the cat. Proc Natl Acad Sci U S A 88:6048–6052.
Engel AK, Fries P, Singer W (2001) Dynamic predictions: oscillations and synchrony in top-down processing. Nat Rev Neurosci 2:704–716.
Engel AK, Moll CK, Fried I, Ojemann GA (2005) Invasive recordings from the human brain: clinical insights and beyond. Nat Rev Neu-rosci 6:35–47.
Ermentrout GB, Galan RF, Urban NN (2008) Reliability|synchrony|and noise. Trends Neurosci 31:428–434.
Faisal AA, Selen LP, Wolpert DM (2008) Noise in the nervous system. Nat Rev Neurosci 9:292–303.
Fan J, Byrne J, Worden MS, Guise KG, McCandliss BD, Fossella J, Posner MI (2007) e relation of brain oscillations to attentional networks. J Neurosci 27:6197–6206.
Feige B, Scheffler K, Esposito F, Di Salle F, Hennig J, Seifritz E (2005) Cortical and subcortical correlates of electroencephalographic alpha rhythm modulation. J Neurophysiol 93:2864–2872.
Fox MD, Raichle ME (2007) Spontaneous %uctuations in brain activity observed with functional magnetic resonance imaging. Nat Rev Neurosci 8:700–711.
Freeman J, Donner TH, Heeger DJ (2008) Interactions Between Hu-man Inferotemporal and Early Visual Areas Re%ect Feature Inte-gration. Soc Neurosci Abstr 34:316.8.
Freeman WJ, Rogers LJ, Holmes MD, Silbergeld DL (2000) Spatial spectral analysis of human electrocorticograms including the alpha and gamma bands. J Neurosci Methods 95:111–121.
Frien A. Eckhorn R (2000) Functional coupling shows stronger stimu-lus dependency for fast oscillations than for low-frequency com-ponents in striate cortex of awake monkey. Eur J Neurosci 12:1466–1478.
Frien A, Eckhorn R, Bauer R, Woelbern T, Gabriel A (2000) Fast oscil-lations display sharper orientation tuning than slower components of the same recordings in striate cortex of the awake monkey. Eur J Neurosci 12:1453–1465.
Fries P (2005) A mechanism for cognitive dynamics: neuronal com-munication through neuronal coherence. Trends Cogn Sci 9:474–480.
Siegel M and Donner TH, Linking Band-Limited Cortical Activity to fMRI and Behavior. In: Ullsperger, M and Debener S. Simultaneous EEG and fMRI - Recording, Analysis, and Application. New York: Oxford University Press, 2010.
19http://dx.doi.org/10.1093/acprof:oso/9780195372731.001.0001

Fries P, Reynolds JH, Rorie AE, Desimone R (2001) Modulation of oscillatory neuronal synchronization by selective visual attention. Science 291:1560–1563.
Fries P, Scheeringa R, Oostenveld R (2008a) Finding gamma. Neuron 58:303–305.
Fries P, Womelsdorf T, Oostenveld R, Desimone R (2008b) e effects of visual stimulation and selective visual attention on rhythmic neuronal synchronization in macaque area V4. J Neurosci 28:4823–4835.
Friston|K (2002) Beyond phrenology: what can neuroimaging tell us about distributed circuitry? Annu Rev Neurosci 25:221–250.
Gail A, Brinksmeyer HJ, Eckhorn R (2004) Perception-related modula-tions of local #eld potential power and coherence in primary visual cortex of awake monkey during binocular rivalry. Cereb Cortex 14:300–313.
Gieselmann MA, iele A (2008) Comparison of spatial integration and surround suppression characteristics in spiking activity and the local #eld potential in macaque V1. Eur J Neurosci 28:447–459.
Gold JI, Shadlen MN (2007) e neural basis of decision making. Annu Rev Neurosci 30:535–574.
Goldman RI, Stern JM, Engel J, Jr.|Cohen MS (2002) Simultaneous EEG and fMRI of the alpha rhythm. Neuroreport 13:2487–2492.
Grass AM, Gibbs FA (1938) A Fourier transform of the electroen-cephalogram. J Neurophysiol 1:521–526.
Gray CM, Singer W (1989) Stimulus-speci#c neuronal oscillations in orientation columns of cat visual cortex. Proc Natl Acad Sci U S A 86:1698–1702.
Gray CM, König P|Engel AK|Singer W (1989) Oscillatory responses in cat visual cortex exhibit inter-columnar synchronization which re%ects global stimulus properties. Nature 338:334–337.
Green DM, Swets JA (1966) Signal detection theory and psychophys-ics. New York: Wiley.
Gross J, Kujala J, Hamalainen M, Timmermann L, Schnitzler A, Salme-lin R (2001) Dynamic imaging of coherent sources: Studying neural interactions in the human brain. Proc Natl Acad Sci U S A 98:694–699.
Gross J, Timmermann L, Kujala J, Salmelin R, Schnitzler A (2003) Properties of MEG tomographic maps obtained with spatial #lter-ing. Neuroimage 19:1329–1336.
Gross J, Schmitz F, Schnitzler I, Kessler K, Shapiro K, Hommel B, Schnitzler A (2004) Modulation of long-range neural synchrony re%ects temporal limitations of visual attention in humans. Proc Natl Acad Sci U S A 101:13050–13055.
Gruber T, Muller MM, Keil A, Elbert T (1999) Selective visual-spatial attention alters induced gamma band responses in the human EEG. Clin Neurophysiol 110:2074–2085.
Hagler DJ, Jr.|Sereno MI (2006) Spatial maps in frontal and prefrontal cortex. Neuroimage 29:567–577.
Hall SD, Holliday IE, Hillebrand A, Singh KD, Furlong PL, Hadjipapas A, Barnes GR (2005) e missing link: analogous human and primate cortical gamma oscillations. Neuroimage 26:13–17.
Hamalainen M, Hari R, Ilmoniemi R.|Knuutila J|Lounasmaa OV (1993) Magnetoencephalography: theory|instrumentation|and applications to noninvasive studies of the working human brain. Rev Mod Phys 65:413–497.
Hasenstaub A, Shu Y, Haider B, Kraushaar U, Duque A, McCormick DA (2005) Inhibitory postsynaptic potentials carry synchronized frequency information in active cortical networks. Neuron 47:423–435.
Hasselmo ME (1995) Neuromodulation and cortical function: model-ing the physiological basis of behavior. Behav Brain Res 67:1–27.
Hasson U, Nir Y, Levy I, Fuhrmann G, Malach R (2004) Intersubject synchronization of cortical activity during natural vision. Science 303:1634–1640.
Haynes JD, Rees G (2006) Decoding mental states from brain activity in humans. Nat Rev Neurosci 7:523–534.
Haynes JD, Deichmann R, Rees G (2005a) Eye-speci#c effects of bin-ocular rivalry in the human lateral geniculate nucleus. Nature 438:496–499.
Haynes JD, Driver J, Rees G (2005b) Visibility re%ects dynamic changes of effective connectivity between V1 and fusiform cortex. Neuron 46:811–821.
Haynes JD, Tregellas J, Rees G (2005c) Attentional integration between anatomically distinct stimulus representations in early visual cor-tex. Proc Natl Acad Sci U S A 102:14925–14930.
Hebb DO (1949) e organization of behavior: a neuropsychological theory. New York: Wiley.
Heeger DJ, Ress D (2002) What does fMRI tell us about neuronal activity? Nat Rev Neurosci 3:142–151.
Heeger DJ, Simoncelli EP, Movshon JA (1996) Computational models of cortical visual processing. Proc Natl Acad Sci U S A 93:623–627.
Heekeren HR, Marrett S, Ungerleider LG (2008) e neural systems that mediate human perceptual decision making. Nat Rev Neuro-sci 9:467–479.
Henrie JA, Shapley R (2005) LFP power spectra in V1 cortex: the graded effect of stimulus contrast. J Neurophysiol 94:479–490.
Herrero JL, Roberts MJ, Delicato LS, Gieselmann MA, Dayan P, iele A (2008) Acetylcholine contributes through muscarinic receptors to attentional modulation in V1. Nature 454:1110–1114.
Hoogenboom N, Schoffelen JM, Oostenveld R, Parkes LM, Fries P (2005) Localizing human visual gamma-band activity in frequen-cy|time|and space. Neuroimage 29:764–773.
Huk AC, Ress D, Heeger DJ (2001) Neuronal basis of the motion aer-effect reconsidered. Neuron 32:161–172.
Jack AI, Shulman GL, Snyder AZ, McAvoy M, Corbetta M (2006) Separate modulations of human V1 associated with spatial atten-tion and task structure. Neuron 51:135-147.
Juergens E, Guettler A, Eckhorn R (1999) Visual stimulation elicits locked and induced gamma oscillations in monkey intracortical- and EEG-potentials|but not in human EEG. Exp Brain Res 129:247–259.
Kanwisher N, Wojciulik E (2000) Visual attention: insights from brain imaging. Nat Rev Neurosci 1:91–100.
Kastner S, Ungerleider LG (2000) Mechanisms of visual attention in the human cortex. Annu Rev Neurosci 23:315–341.
Kastner S, Pinsk MA, De Weerd P, Desimone R, Ungerleider LG (1999) Increased activity in human visual cortex during directed atten-tion in the absence of visual stimulation. Neuron 22:751–761.
Kastner S, DeSimone K, Konen CS, Szczepanski SM, Weiner KS, Schneider KA (2007) Topographic maps in human frontal cortex revealed in memory-guided saccade and spatial working-memory tasks. J Neurophysiol 97:3494–3507.
Kayser C, König P (2004) Stimulus locking and feature selectivity prevail in complementary frequency ranges of V1 local #eld po-tentials. Eur J Neurosci 19:485–489.
Kayser C, Montemurro MA, Logothetis NK, Panzeri S (2009) Spike-phase coding boosts and stabilizes information carried by spatial and temporal spike patterns. Neuron 61:597–608.
Kim CY, Blake R (2005) Psychophysical magic: rendering the visible “invisible.” Trends Cogn Sci 9:381–388.
Koch C, Tsuchiya N (2007) Attention and consciousness: two distinct brain processes. Trends Cogn Sci 11:16–22.
König P, Schillen TB (1991) Stimulus-Dependent assembly formation of oscillatory responses. I: Synchronization. Neural Computation 3:155–166.
König P, Engel AK, Singer W (1996) Integrator or coincidence detec-tor? e role of the cortical neuron revisited. Trends Neurosci 19:130–137.
Siegel M and Donner TH, Linking Band-Limited Cortical Activity to fMRI and Behavior. In: Ullsperger, M and Debener S. Simultaneous EEG and fMRI - Recording, Analysis, and Application. New York: Oxford University Press, 2010.
20http://dx.doi.org/10.1093/acprof:oso/9780195372731.001.0001

Kopell N, Ermentrout GB, Whittington MA, Traub RD (2000) Gamma rhythms and beta rhythms have different synchronization proper-ties. Proc Natl Acad Sci U S A 97:1867–1872.
Kranczioch C, Debener S, Schwarzbach J, Goebel R, Engel AK (2005) Neural correlates of conscious perception in the attentional blink. Neuroimage 24:704–714.
Kreiter AK, Singer W (1996) Stimulus-dependent synchronization of neuronal responses in the visual cortex of the awake macaque monkey. J Neurosci 16:2381–2396.
Lachaux JP, Rudrauf D, Kahane P (2003) Intracranial EEG and human brain mapping. J Physiol Paris 97:613–628.
Lamme VA (2003) Why visual attention and awareness are different. Trends Cogn Sci 7:12–18.
Lamme VA, Spekreijse H (1998) Neuronal synchrony does not repre-sent texture segregation. Nature 396:362–366.
Laufs H (2008) Endogenous brain oscillations and related networks detected by surface EEG-combined fMRI. Hum Brain Mapp 29:762–769.
Lauritzen|M (2005) Reading vascular changes in brain imaging: is dendritic calcium the key? Nat Rev Neurosci 6:77–85.
Lee H, Simpson GV, Logothetis NK, Rainer G (2005) Phase locking of single neuron activity to theta oscillations during working mem-ory in monkey extrastriate visual cortex. Neuron 45:147–156.
Lee SH, Blake R, Heeger DJ (2005) Traveling waves of activity in pri-mary visual cortex during binocular rivalry. Nat Neurosci 8:22–23.
Lee SH, Blake R, Heeger DJ (2007) Hierarchy of cortical responses underlying binocular rivalry. Nat Neurosci 10:1048–1054.
Leopold DA, Logothetis NK (1996) Activity changes in early visual cortex re%ect monkeys percepts during binocular rivalry. Nature 379:549–553.
Leopold DA, Murayama Y, Logothetis NK (2003) Very slow activity %uctuations in monkey visual cortex: implications for functional brain imaging. Cereb Cortex 13:422–433.
Liljestrom M, Kujala J, Jensen O, Salmelin R (2005) Neuromagnetic localization of rhythmic activity in the human brain: a comparison of three methods. NeuroImage 25:734.
Linkenkaer-Hansen K|Nikulin VV|Palva S|Ilmoniemi RJ|Palva JM (2004) Prestimulus oscillations enhance psychophysical perform-ance in humans. J Neurosci 24:10186–10190.
Liu J, Newsome WT (2006) Local #eld potential in cortical area MT: stimulus tuning and behavioral correlations. J Neurosci 26:7779–7790.
Llinas RR, Steriade M (2006) Bursting of thalamic neurons and states of vigilance. J Neurophysiol 95:3297–3308.
Logothetis NK (2008) What we can do and what we cannot do with fMRI. Nature 453:869–878.
Logothetis NK, Wandell BA (2004) Interpreting the BOLD signal. Annu Rev Physiol 66:735–769.
Logothetis NK, Pauls J, Augath M, Trinath T, Oeltermann A (2001) Neurophysiological investigation of the basis of the fMRI signal. Nature 412:150–157.
Logothetis NK, Kayser C, Oeltermann A (2007) In vivo measurement of cortical impedance spectrum in monkeys: implications for signal propagation. Neuron 55:809–823.
Luck SJ (2005) An introduction to the event-related potential tech-nique. Cambridge|MA: MIT Press.
Luck SJ, Chelazzi L, Hillyard SA, Desimone R (1997) Neural mecha-nisms of spatial selective attention in areas V1, V2, and V4 of macaque visual cortex. J Neurophysiol 77:24–42.
Maier A, Wilke M, Aura C, Zhu C, Ye FQ, Leopold DA (2008) Diver-gence of fMRI and neural signals in V1 during perceptual suppres-sion in the awake monkey. Nat Neurosci 11:1193–1200.
Mantini D, Perrucci MG, Del Gratta C, Romani GL, Corbetta M (2007) Electrophysiological signatures of resting state networks in the human brain. Proc Natl Acad Sci U S A 104:13170–13175.
Marois R, Yi DJ, Chun MM (2004) e neural fate of consciously per-ceived and missed events in the attentional blink. Neuron 41:465–472.
Meng M, Remus DA, Tong F (2005) Filling-in of visual phantoms in the human brain. Nat Neurosci 8:1248–1254.
Miller EK, Cohen JD (2001) An integrative theory of prefrontal cortex function. Annu Rev Neurosci 24:167–202.
Miller KJ, Leuthardt EC, Schalk G, Rao RP, Anderson NR, Moran DW, Miller JW, Ojemann JG (2007) Spectral changes in cortical surface potentials during motor movement. J Neurosci 27:2424–2432.
Miller KJ, Zanos S, Fetz EE, den Nijs M, Ojemann JG (2009) Decou-pling the cortical power spectrum reveals real-time representation of individual #nger movements in humans. J Neurosci 29:3132–3137.
Minzenberg MJ, Watrous AJ, Yoon JH, Ursu S, Carter CS (2008) Mo-da#nil shis human locus coeruleus to low-tonic|high-phasic activity during functional MRI. Science 322:1700–1702.
Mitchell JF, Sundberg KA, Reynolds JH (2007) Differential attention-dependent response modulation across cell classes in macaque visual area V4. Neuron 55:131–141.
Mitra P, Bokil H (2007) Observed brain dynamics. New York: Oxford University Press.
Mitzdorf U (1987) Properties of the evoked potential generators: cur-rent source-density analysis of visually evoked potentials in the cat cortex. Int J Neurosci 33:33–59.
Montemurro MA, Rasch MJ, Murayama Y, Logothetis NK, Panzeri S (2008) Phase-of-#ring coding of natural visual stimuli in primary visual cortex. Curr Biol 18:375–380.
Moore T, Armstrong KM, Fallah M (2003) Visuomotor origins of covert spatial attention. Neuron 40:671–683.
Moosmann M, Ritter P, Krastel I, Brink A, ees S, Blankenburg F, Taskin B, Obrig H, Villringer A (2003) Correlates of alpha rhythm in functional magnetic resonance imaging and near infrared spec-troscopy. Neuroimage 20:145–158.
Mukamel R, Gelbard H, Arieli A, Hasson U, Fried I, Malach R (2005) Coupling between neuronal #ring, #eld potentials, and FMRI in human auditory cortex. Science 309:951–954.
Muller MM, Keil A (2004) Neuronal synchronization and selective color processing in the human brain. J Cogn Neurosci 16:503–522.
Munk MH, Roelfsema PR, Konig P, Engel AK, Singer W (1996) Role of reticular activation in the modulation of intracortical synchroniza-tion. Science 272:271–274.
Nichols MJ, Newsome WT (1999) e neurobiology of cognition. Nature 402:C35–38.
Nir Y, Fisch L, Mukamel R, Gelbard-Sagiv H, Arieli A, Fried I, Malach R (2007) Coupling between neuronal #ring rate, gamma LFP, and BOLD fMRI is related to interneuronal correlations. Curr Biol 17:1275–1285.
Nir Y, Mukamel R, Dinstein I, Privman E, Harel M, Fisch L, Gelbard-Sagiv H, Kipervasser S, Andelman F, Neufeld MY, et al. (2008) Interhemispheric correlations of slow spontaneous neuronal %uc-tuations revealed in human sensory cortex. Nat Neurosci 11:1100–1108.
Nunez PL, Srinivasan R (2006) Electric #elds of the brain: the neuro-physics of EEG, 2nd Edition. Oxford, New York: Oxford Univer-sity Press.
Ogawa S, Lee TM, Kay AR, Tank DW (1990) Brain magnetic reso-nance imaging with contrast dependent on blood oxygenation. Proc Natl Acad Sci U S A 87:9868–9872.
Palanca BJ, DeAngelis GC (2005) Does neuronal synchrony underlie visual feature grouping? Neuron 46:333–346.
Pesaran B, Pezaris JS, Sahani M, Mitra PP, Andersen RA (2002) Tem-poral structure in neuronal activity during working memory in macaque parietal cortex. Nat Neurosci 5:805–811.
Siegel M and Donner TH, Linking Band-Limited Cortical Activity to fMRI and Behavior. In: Ullsperger, M and Debener S. Simultaneous EEG and fMRI - Recording, Analysis, and Application. New York: Oxford University Press, 2010.
21http://dx.doi.org/10.1093/acprof:oso/9780195372731.001.0001
Pesaran B, Nelson MJ, Andersen RA (2008) Free choice activates a decision circuit between frontal and parietal cortex. Nature 453:406–409.
Pfurtscheller G, Lopes da Silva FH (1999) Event-related EEG/MEG synchronization and desynchronization: basic principles. Clin Neurophysiol 110:1842–1857.
Polonsky A, Blake R, Braun J, Heeger DJ (2000) Neuronal activity in human primary visual cortex correlates with perception during binocular rivalry. Nat Neurosci 3:1153–1159.
Rees G, Friston K, Koch C (2000) A direct quantitative relationship between the functional properties of human and macaque V5. Nat Neurosci 3:716–723.
Ress D, Backus BT, Heeger DJ (2000) Activity in primary visual cortex predicts performance in a visual detection task. Nat Neurosci 3:940–945.
Rickert J, Oliveira SC, Vaadia E, Aertsen A, Rotter S, Mehring C (2005) Encoding of movement direction in different frequency ranges of motor cortical local #eld potentials. J Neurosci 25:8815–8824.
Riesenhuber M, Poggio T (1999) Are cortical models really bound by the “binding problem”? Neuron 24:87–93 and 111–125.
Rodriguez R, Kallenbach U, Singer W, Munk MH (2004) Short- and long-term effects of cholinergic modulation on gamma oscilla-tions and response synchronization in the visual cortex. J Neurosci 24:10369–10378.
Roelfsema PR, Engel AK, König P, Singer W (1997) Visuomotor inte-gration is associated with zero time-lag synchronization among cortical areas. Nature 385:157–161.
Roelfsema PR, Lamme VA, Spekreijse H (1998) Object-based attention in the primary visual cortex of the macaque monkey. Nature 395:376–381.
Rubino D, Robbins KA, Hatsopoulos NG (2006) Propagating waves mediate information transfer in the motor cortex. Nat Neurosci 9:1549–1557.
Saalmann YB, Pigarev IN, Vidyasagar TR (2007) Neural mechanisms of visual attention: how top-down feedback highlights relevant locations. Science 316:1612–1615.
Salinas E, Sejnowski TJ (2000) Impact of correlated synaptic input on output #ring rate and variability in simple neuronal models. J Neurosci 20:6193–6209.
Salinas E, Sejnowski TJ (2001) Correlated neuronal activity and the %ow of neural information. Nat Rev Neurosci 2:539–550.
Sapir A, d'Avossa G, McAvoy M, Shulman GL, Corbetta M (2005) Brain signals for spatial attention predict performance in a motion discrimination task. Proc Natl Acad Sci U S A 102:17810–17815.
Sarnthein J, Petsche H, Rappelsberger P, Shaw GL, von Stein A (1998) Synchronization between prefrontal and posterior association cortex during human working memory. Proc Natl Acad Sci U S A 95:7092–7096.
Schall JD (2001) Neural basis of deciding|choosing|and acting. Nat Rev Neurosci 2:33–42.
Schluppeck D, Glimcher P, Heeger DJ (2005) Topographic organiza-tion for delayed saccades in human posterior parietal cortex. J Neurophysiol 94:1372–1384.
Sejnowski TJ, Paulsen O (2006) Network oscillations: emerging com-putational principles. J Neurosci 26:1673–1676.
Serences JT, Yantis S (2006) Selective visual attention and perceptual coherence. Trends Cogn Sci 10:38–45.
Sereno MI, Pitzalis S, Martinez A (2001) Mapping of contralateral space in retinotopic coordinates by a parietal cortical area in hu-mans. Science 294:1350–1354.
Shadlen MN, Movshon JA (1999) Synchrony unbound: a critical evaluation of the temporal binding hypothesis. Neuron 24:67–77 and 111–125.
Shapley R, Hawken M, Ringach DL (2003) Dynamics of orientation selectivity in the primary visual cortex and the importance of cortical inhibition. Neuron 38:689–699.
Shelley M, McLaughlin D, Shapley R, Wielaard J (2002) States of high conductance in a large-scale model of the visual cortex. J Comput Neurosci 13:93–109.
Shulman GL, Ollinger JM, Linenweber M, Petersen SE, Corbetta M (2001) Multiple neural correlates of detection in the human brain. Proc Natl Acad Sci U S A 98:313–318.
Siegel M, König P (2003) A functional gamma-band de#ned by stimulus-dependent synchronization in area 18 of awake behaving cats. J Neurosci 23:4251–4260.
Siegel M, Donner TH, Oostenveld R, Fries P, Engel AK (2007) High-frequency activity in human visual cortex is modulated by visual motion strength. Cereb Cortex 17:732–741.
Siegel M, Donner TH, Oostenveld R, Fries P, Engel AK (2008) Neu-ronal synchronization along the dorsal visual pathway re%ects the focus of spatial attention. Neuron 60:709–719.
Siegel M, Warden MR, Miller EK (2009) Phase-dependent neuronal coding of objects in short-term memory. Proc Natl Acad Sci USA doi:10.1073/pnas.0908193106.
Silver MA, Ress D, Heeger DJ (2007) Neural correlates of sustained spatial attention in human early visual cortex. J Neurophysiol 97:229–237.
Singer W (1999) Neuronal synchrony: a versatile code for the de#ni-tion of relations? Neuron 24:49–65 and 111–125.
Sohal VS, Zhang F, Yizhar O, Deisseroth K (2009) Parvalbumin neu-rons and gamma rhythms enhance cortical circuit performance. Nature 459:698–702.
Somers DC, Dale AM, Seiffert AE, Tootell RB (1999) Functional MRI reveals spatially speci#c attentional modulation in human primary visual cortex. Proc Natl Acad Sci U S A 96:1663–1668.
Spinks RL, Kraskov A, Brochier T, Umilta MA, Lemon RN (2008) Selectivity for grasp in local #eld potential and single neuron activity recorded simultaneously from M1 and F5 in the awake macaque monkey. J Neurosci 28:10961–10971.
Steriade M (2000) Corticothalamic resonance|states of vigilance|and mentation. Neuroscience 101:243–276.
Swisher JD, Halko MA, Merabet LB, McMains SA, Somers DC (2007) Visual topography of human intraparietal sulcus. J Neurosci 27:5326–5337.
Tallon-Baudry C, Bertrand O (1999) Oscillatory gamma activity in humans and its role in object representation. Trends Cogn Sci 3:151–162.
Tallon-Baudry C, Bertrand O, Peronnet F, Pernier J (1998) Induced gamma-band activity during the delay of a visual short-term memory task in humans. J Neurosci 18:4244–4254.
Tallon-Baudry C, Bertrand O, Fischer C (2001) Oscillatory synchrony between human extrastriate areas during visual short-term mem-ory maintenance. J Neurosci 21:RC177.
Tallon-Baudry C, Mandon S, Freiwald WA, Kreiter AK (2004) Oscilla-tory synchrony in the monkey temporal lobe correlates with per-formance in a visual short-term memory task. Cereb Cortex 14:713–720.
Taylor K, Mandon S, Freiwald WA, Kreiter AK (2005) Coherent oscil-latory activity in monkey area v4 predicts successful allocation of attention. Cereb Cortex 15:1424–1437.
iele A, Stoner G (2003) Neuronal synchrony does not correlate with motion coherence in cortical area MT. Nature 421:366–370.
ut G, Nietzel A, Brandt SA, Pascual-Leone A (2006) Alpha-band electroencephalographic activity over occipital cortex indexes visuospatial attention bias and predicts visual target detection. J Neurosci 26:9494–9502.
Siegel M and Donner TH, Linking Band-Limited Cortical Activity to fMRI and Behavior. In: Ullsperger, M and Debener S. Simultaneous EEG and fMRI - Recording, Analysis, and Application. New York: Oxford University Press, 2010.
22http://dx.doi.org/10.1093/acprof:oso/9780195372731.001.0001

Tiesinga PH, Fellous JM, Salinas E, Jose JV, Sejnowski TJ (2004) In-hibitory synchrony as a mechanism for attentional gain modula-tion. J Physiol Paris 98:296–314.
Tong F, Engel SA (2001) Interocular rivalry revealed in the human cortical blind-spot representation. Nature 411:195–199.
Usher M, Cohen JD, Servan-Schreiber D, Rajkowski J, Aston-Jones G (1999) e role of locus coeruleus in the regulation of cognitive performance. Science 283:549–554.
Usrey WM, Reid RC (1999) Synchronous activity in the visual system. Annu Rev Physiol 61:435–456.
Usrey WM, Reppas JB, Reid RC (1998) Paired-spike interactions and synaptic efficacy of retinal inputs to the thalamus. Nature 395:384–387.
Van DerWerf J, Jensen O, Fries P, Medendorp WP (2008) Gamma-band activity in human posterior parietal cortex encodes the mo-tor goal during delayed prosaccades and antisaccades. J Neurosci 28:8397–8405.
Van Veen BD, van Drongelen W, Yuchtman M, Suzuki A (1997) Local-ization of brain electrical activity via linearly constrained mini-mum variance spatial #ltering. IEEE Trans Biomed Eng 44:867–880.
Wang M, Ramos BP, Paspalas CD, Shu Y, Simen A, Duque A, Vijay-raghavan S, Brennan A, Dudley A, Nou E, et al. (2007) Alpha2A-adrenoceptors strengthen working memory networks by inhibit-ing cAMP-HCN channel signaling in prefrontal cortex. Cell 129:397–410.
Wang XJ (2001) Synaptic reverberation underlying mnemonic persis-tent activity. Trends Neurosci 24:455–463.
Wang XJ (2003) Neural oscillations. In: Encyclopedia of cognitive science (Nadel L, ed), pp 272–280. London: MacMillan.
Whittington MA, Traub RD, Jefferys JG (1995) Synchronized oscilla-tions in interneuron networks driven by metabotropic glutamate receptor activation. Nature 373:612–615.
Wilke M, Logothetis NK, Leopold DA (2006) Local #eld potential re%ects perceptual suppression in monkey visual cortex. Proc Natl Acad Sci U S A 103:17507–17512.
Womelsdorf T, Fries P, Mitra PP, Desimone R (2006) Gamma-band synchronization in visual cortex predicts speed of change detec-tion. Nature 439:733–736.
Womelsdorf T, Schoffelen JM, Oostenveld R, Singer W, Desimone R, Engel AK, Fries P (2007) Modulation of neuronal interactions through neuronal synchronization. Science 316:1609–1612.
Worden MS, Foxe JJ, Wang N, Simpson GV (2000) Anticipatory bias-ing of visuospatial attention indexed by retinotopically speci#c alpha-band electroencephalography increases over occipital cor-tex. J Neurosci 20:RC63.
Wunderlich K, Schneider KA, Kastner S (2005) Neural correlates of binocular rivalry in the human lateral geniculate nucleus. Nat Neurosci 8:1595–1602.
Wyart V, Tallon-Baudry C (2008) Neural dissociation between visual awareness and spatial attention. J Neurosci 28:2667–2679.
Yu AJ, Dayan P (2005) Uncertainty|neuromodulation|and attention. Neuron 46:681–692.
Yuval-Greenberg S, Tomer O, Keren AS, Nelken I, Deouell LY (2008) Transient induced gamma-band response in EEG as a manifesta-tion of miniature saccades. Neuron 58:429–441.
Siegel M and Donner TH, Linking Band-Limited Cortical Activity to fMRI and Behavior. In: Ullsperger, M and Debener S. Simultaneous EEG and fMRI - Recording, Analysis, and Application. New York: Oxford University Press, 2010.
23http://dx.doi.org/10.1093/acprof:oso/9780195372731.001.0001