linking physician compensation to reimbursement in an ... papers/linking... · there is no...
TRANSCRIPT
Linking Physician Compensation to Reimbursement in an
Environment of Evolving Reimbursement Methodologies
Exploratory Paper
Jeffry S. Sears, CMA, CFM, FACMPE
August 1, 2016
This paper is being submitted in partial fulfillment of the requirements of Fellowship in
the American College of Medical Practice Executives.

1
Abstract
In an effort to identify a measure of provider activity that correlates significantly with
reimbursement in an environment combining fee-for-service and capitated payments, statistical
research was conducted to examine the relationship between total payments and the following
measures of provider activity: number of unique patients seen, charges, volume (total CPT codes
billed), and work relative value units (RVUs). It was found that number of unique patients seen
and charges correlate significantly with reimbursement in this environment. Number of unique
patients correlates highly with charges so can be used as a proxy for them. Volume (total CPT
codes billed) and work RVUs did not correlate significantly with total payments. Based on these
findings, a physician compensation plan incentivizing number of unique patients seen (in lieu of
work RVUs) was proposed for primary, secondary, and tertiary care providers. The advantages
of such a compensation plan, as well as the challenges, are discussed.
Key Words
Physician compensation, incentives, reimbursement, payments, fee for service, capitation,
number of unique patients seen, panel size, charges, volume, work relative value units (RVUs)
2
Introduction
Medical practices face a continuing challenge in designing physician compensation plans to
incentivize activities that relate to generating revenues. At a time when capitated payment has
long been established as a significant portion of reimbursement, and there is an increasing
emphasis on value-based reimbursement (“pay for performance”), physician compensation plans
based on commonly used measures of clinical productivity, charges or work relative value units
(RVUs), are becoming less relevant.
Consider the typical HMO reimbursement methodology. HMO reimbursement is typically in the
form of fixed fees (“per member per month,” or PMPM), while a small portion of total contract
reimbursement is held back for value-based incentives (“pay for performance”). This latter
portion is becoming relatively larger in newer contracts, as an increasing emphasis is placed on
pay for performance1. Clinical productivity as measured by charges or work RVUs has no
correlation with either PMPM or pay for performance. PMPM is based on the number of
members, and pay for performance is based on demonstrating efficient and medically appropriate
treatment protocols, desired clinical outcomes, patient satisfaction, and/or cost savings to the
payer. In fact, using charges or work RVUs in a capitated payer environment creates a perverse
incentive. Providers are incentivized to maximize visits, procedures, and tests, in order to
maximize these measures of clinical productivity. The result is increased cost of providing care
while HMO revenues are unaffected. Thus, in a capitated payer environment, an incentive for
providers to over utilize resources will squeeze profits or perhaps even lead to financial loss.
1 “Shifting Reimbursement Models,” Medical Economics, Modern Medicine.com, April 8, 2014.
3
Of course, the portion of total revenue that comes from PMPM and pay for performance versus
traditional or discounted fee for service varies from region to region and practice to practice.
Rarely does a practice face at or near 100% reimbursement from PMPM and pay for
performance. Likewise, rarely does a practice face at or near 100% reimbursement from
traditional or discounted fee for service. The blend of reimbursement methodologies in use today
creates conflicting incentives in order to maximize revenue, further complicating the challenge of
designing a physician compensation plan that links to revenue generation.
The purpose of the statistical research described in this paper was to test the hypothesis that there
is a measure of provider activity that correlates significantly with revenues in an environment
where reimbursement includes both PMPM and pay for performance, and traditional or
discounted fee for service. Such a metric would be appropriate as the basis for a physician
compensation plan in today’s environment, and into the future. While it was argued earlier that
this hypothesis would not be supported for charges and work RVUs, these metrics were
considered, along with volume (total CPT codes billed) and the number of unique patients seen.
(Total CPT codes billed is not limited to unique CPT codes billed but rather counts the billing of
the same code as many times as it was billed.)
Before this research is described, the variety of physician compensation plans that have been used
and are in use today will be discussed, followed by a discussion of the criteria for an effective
physician compensation plan. This background is relevant to the discussion of compensation plan
design arising out of the results of the statistical research.
4
The History and Evolution of Physician Compensation Plans
Individually Negotiated
Providers are paid whatever salary is agreed upon between themselves and the employer. A
premium is placed on the negotiation skills of the individual provider. This is the most basic and
classic version of how individual salaries are determined in any occupation in a free labor market.
While today’s physician compensation plans, as described below, place the emphasis on job
performance, or on a structure of guaranteed salaries applied to all providers, there is still an
element of individual negotiation in today’s physician compensation2. This is unavoidable, and
perhaps acceptable, since a given compensation plan cannot reflect all factors that make a
physician valuable to the practice.
“Eat What You Treat”
Revenue attributed to an individual provider’s charges is assigned to that provider, and the
provider’s identifiable direct expenses along with an allocation of indirect expenses are assigned
to that provider. (Indirect expenses should include an allowance to provide the practice with net
income to pay off debts and upgrade assets). The provider is paid the net amount. Each provider
is subject to the effects of that provider’s individual payer mix. Points of contention can include
the identification of direct expenses and the portion of indirect expenses allocated3.
2 “8 Salary Negotiation Tips,” Resources – Blog, Integrity Healthcare, ihcrecruiting.com. 3 Carter and Lankford, “Eat What You Kill,” Physician’s Compensation: Measurement, Benchmarking, and Implementation, New York, NY: John Wiley & Sons, 2000, page 30.
5
Productivity Based
Practice revenues and indirect expenses are netted together to determine the total amount
available for physician compensation and direct expenses, or the compensation pool. (Indirect
expenses should include an allowance to provide the practice with net income to pay off debts
and upgrade assets.) This pool is then allocated to providers based on a measure or measures of
clinical productivity. A provider’s identifiable direct expenses are then netted against the
provider’s share of the compensation pool to determine total salary earned. The following
illustration from the Medical Group Management Association’s Decision Pathways resource
shows the calculation4. In this example, the physicians’ “draw” is termed “base salary,” and the
additional pay related to productivity is termed a “bonus”:
4 “Physician Compensation,” Decision Pathways (web site), Medical Group Management Association.

6
Historically, a measure commonly used was charges (billings). In recent years, since the
development of various RVU systems, work RVUs have come to be combined with or to replace
billings as the measure of clinical productivity. Work RVUs are seen as more objective than
7
billings, since billings for the same set of billing codes will vary with the individual practice’s fee
schedule5.
Guaranteed (Straight Salary)
Providers are paid guaranteed salaries based on a salary structure applicable to all providers.
Salaries are set at a certain level within the salary structure depending upon specialty and
subspecialty, the type and level of skills, the amount of work experience, the degree of
administrative responsibility, and/or other work-related factors. There is no compensation
incentive for productivity or to achieve value in the sense of quality and outcomes. At the same
time, there is no incentive to over utilize practice resources. Mayo Clinic and the Cleveland
Clinic have been cited as models of straight salary physician compensation that promotes
teamwork and leads to reduced costs6. As a practical matter, when providers are on 100%
guarantee, practice leadership must develop and implement other methods to direct and motivate
providers to produce and to achieve value-oriented objectives7.
Multifaceted (Salary plus Incentive)
Multifaceted physician compensation plans have been developed to cope with conflicting
incentives of PMPM and pay for performance reimbursement versus traditional or discounted fee
for service. Also, multifaceted plans attempt to balance the security of guaranteed plans with the
incentives inherent in productivity based plans. Multifaceted plans typically include a guaranteed
5 Carter and Lankford, “Measuring Productivity,” Physician Compensation: Measurement, Benchmarking, and Implementation, New York, NY: John Wiley & Sons, 2000, pages 109-113. 6 Adler, “What Health Reform Can Learn from Cleveland Clinic,” Newsweek (web site), November 26, 2009. 7 Greenfield, “In Search of an Effective Physician Compensation Formula,” Family Practice Management (web site), American Academy of Family Physicians, October 1998.

8
portion plus an incentive based on clinical productivity8. In the case of primary care, the number
of unique patients seen, or panel size, can be an important factor in the incentive payment9.
Multifaceted plans are adding value-based measures to the incentive payment in order to link to
value-based reimbursement. As discussed above, these may include measures of quality,
outcomes, patient satisfaction, and/or cost savings10.
Multifaceted plans can be complex, with a large number of value-based and other nonproductivity
related measures affecting the incentive payment. Weeks on call may carry a separate incentive,
as well as supervision of nonphysician providers. Leadership or administrative roles may bring a
premium. A number of diverse measures, such as timeliness of completing notes and attendance
at meetings, can be included under the broad category of citizenship11.
Criteria for an Effective Physician Compensation Plan
A discussion of the criteria for effective physician compensation plans follows, along with an
evaluation of each of the types of plans described above12.
8 Darves, “Physician Compensation Models: The Basics, the Pros, and the Cons,” New England Journal of Medicine Career Center (web site), September 2004. 9 “Risk adjustment needed when doctor pay is based on patient load,” American Medical News, amednews.com (web site), August 2, 2012. 10 Ferber, “The New Models for Physician Compensation,” Physician’s Money Digest (web site), February 22, 2012. 11 Milburn and Mourar, “Special Issues in Physician Compensation,” Strategies for value-based physician
compensation, Englewood, CO: Medical Group Management Association, 2014, pages 107-124. 12 Carter and Lankford, “Four Basic Principles of Compensation,” Physician Compensation: Measurement, Benchmarking, and Implementation, New York, NY: John Wiley & Sons, 2002, pages 56-59.

9
Fairness and Equity
Providers want to work under compensation plans that treat all providers equally with regard to
job performance and personal characteristics. A provider achieving the same level of clinical
productivity or scoring the same on other measures as another provider will expect to be paid the
same. Providers will expect to be treated equally regardless of their gender, race, ethnic
background, country of origin, age, or any other personal characteristic unrelated to job
performance.
In terms of fairness and equity, individually negotiated plans are the least desirable type of plans.
Rewarding only individual negotiation skills does not recognize job performance. Allowing the
personal biases of the employer to factor into the salary decision does not promote equal
treatment of all classes of people. All the other plans described above, except guaranteed plans,
reflect fairness and equity in being based on job performance only. Providers may perceive
unfairness and inequity in the details of how compensation plans are implemented, but the
principles on which they are based are clear and appropriate. Guaranteed plans are considered
fair and equitable because all providers are paid within the same salary structure, which is based
on work-related factors.
Transparency and Predictability
Providers want a compensation plan that is understandable and verifiable. Also, they want to
trust that there are no hidden criteria influencing pay decisions.
In this regard, individually negotiated salaries again represent the least desirable approach to
physician compensation. Salary negotiations are a matter of private communication between the
10
provider and the employer’s agent. Other providers are not made aware of what factors or
negotiation techniques may have been persuasive in achieving a higher salary.
With regard to “eat what you treat” plans, to the extent that 1) providers can audit the data on
revenues and expenses, and 2) the method of allocating indirect expenses is clearly defined, such
plans meet the transparency test.
Likewise, performance measures must be clearly defined, and performance data must be
auditable, for productivity based plans and multifaceted plans to be perceived as transparent.
Practice leadership should consider limiting the number of performance measures in a
multifaceted plan so that the plan is not perceived as overly complex and not straightforward. If
practice leadership feels that a high number of performance measures are relevant and should be
used, the burden is on leadership to make sure providers understand each measure and how it
impacts compensation.
For guaranteed salary plans to meet the transparency test, factors that influence a provider’s
salary level within the pay structure must be clearly defined.
Linkage to Organizational Goals
The criteria discussed above relate to providers’ perception of a compensation plan and the
degree to which they will find it acceptable. This criterion relates to the employer’s legitimate
concern that a plan promote the interests of the practice as a whole, as well as meeting the needs
and concerns of individual providers. A well-run practice will have clearly defined quantitative
and qualitative goals based on a mission, vision, and strategy. To ensure the long-term viability
of the practice, one or more of these goals must relate to profitability.

11
A practice must be careful not to obligate itself to pay out more in physician compensation than it
will have available to pay out. With individually negotiated salaries, it is up to the employer’s
agent to understand how much the practice can afford to add to its physician compensation
budget, and hold to that amount. Under “eat what you treat” and productivity based plans (as
described above), this limitation on physician compensation in relation to available funds is built
in. (Under some productivity based plans, physician compensation is paid per work RVU, with
the amount per work RVU calculated as benchmark salary divided by benchmark work RVUs. In
this version, physician compensation is not tied to practice revenues and expenses, so there is a
risk of obligating the practice to pay out more than is available to pay.) Under guaranteed and
multifaceted plans, physician compensation expenses must be carefully budgeted. This requires
that the guaranteed salary structure, including the guaranteed salary component of a multifaceted
plan, must be adjusted so that total budgeted physician compensation is less than or equal to
budgeted revenues less overhead expenses and budgeted profit/surplus. If guaranteed salaries are
too great, there may be no funds to make incentive payments. In the worst case, guaranteed
salaries alone may exceed the amount available to pay for physician compensation.
In general, to promote profitability as a primary goal of the practice, practice leadership needs to
direct and induce providers to generate revenues and control expenses. If the practice feels a
compensation plan with incentives is appropriate, the incentive(s) used should 1) correlate with
revenue generation, and 2) not be linked to overutilization of practice resources. It has already
been noted that charges and work RVUs incentivize overutilization of practice resources. The
statistical research conducted for this study considered charges, work RVUs, volume (total CPT
codes billed), and the number of unique patients seen in an attempt to identify a measure of

12
provider activity that correlates significantly with payments in an environment with both fee-for-
service and capitated reimbursement. Since volume (total CPT codes billed) would also
incentivize overutilization of practice resources, it was hoped that the number of unique patients
seen would prove to correlate significantly with payments, since it was the only measure
considered that does not incentivize overutilization.
Statistical Analysis of Correlation between Reimbursement and Measurable Provider
Activities
Data were gathered on total payments, number of unique patients seen, charges, volume (total
CPT codes billed), and work RVUs for ten consecutive fiscal years ending June 2015 of a
department of internal medicine within an academic medical center (Table 1). This department
has approximately 300 faculty and includes primary care and 12 secondary care subspecialties.
Approximately 70% of revenue is on a discounted fee-for-service basis, and approximately 30%
is capitated, with a small percentage of value-based (pay for performance) revenue.

13
Table 1.
TOTAL
REVENUE
AND
PHYSICIAN
ACTIVITIES
Department of
Medicine
Year
Total
Payments
# Unique
Patients Charges
Volume
(CPT
codes)
Work
RVUs
FY15
111,595,420
138,367
299,293,294
1,901,306
915,093
FY14
105,030,076
132,443
288,934,607
1,879,713
888,239
FY13
93,498,591
128,549
264,511,291
1,901,853
861,688
FY12
91,579,072
126,153
248,357,277
1,676,865
834,677
FY11
89,433,167
121,350
231,379,801
1,565,321
795,071
FY10
90,005,596
122,068
233,866,721
1,575,604
823,895
FY09
89,248,237
119,434
219,185,267
1,512,806
795,411
FY08
85,848,917
120,331
215,611,555
1,661,081
790,559
FY07
84,380,036
120,943
211,017,041
1,722,497
749,361
FY06
79,233,211
117,104
196,342,220
1,601,197
662,074

14
Correlation analysis was performed, with the following results (Table 2):
Table 2.
Correlation
Total
Payments
# Unique
Patients Charges
Volume
(CPT
codes)
Work
RVUs
Total Payments 1.00
# Unique Patients 0.96 1.00
Charges 0.97 0.98 1.00
Volume (CPT
codes) 0.71 0.85 0.80 1.00
Work RVUs 0.91 0.88 0.93 0.65 1.00
Charges had the highest correlation with total payments, at 0.97. Next was number of unique
patients seen, at 0.96. These results were suggestive that the correlation between charges and
total payments is statistically significant, as well as the correlation between number of unique
patients seen and total payments. The highest correlation between any two variables was between
charges and number of unique patients seen, at 0.98. This suggests that number of unique
patients seen could be used as a proxy for charges.
Next, regression analysis was performed, treating total payments as the dependent variable and
the other data items as independent variables. These were the results (Table 3):
Table 3. Regression Statistics
Multiple R 0.999806917
R Square 0.999613871
Adjusted R Square 0.83275414
Standard Error
2,344,966
Observations 10
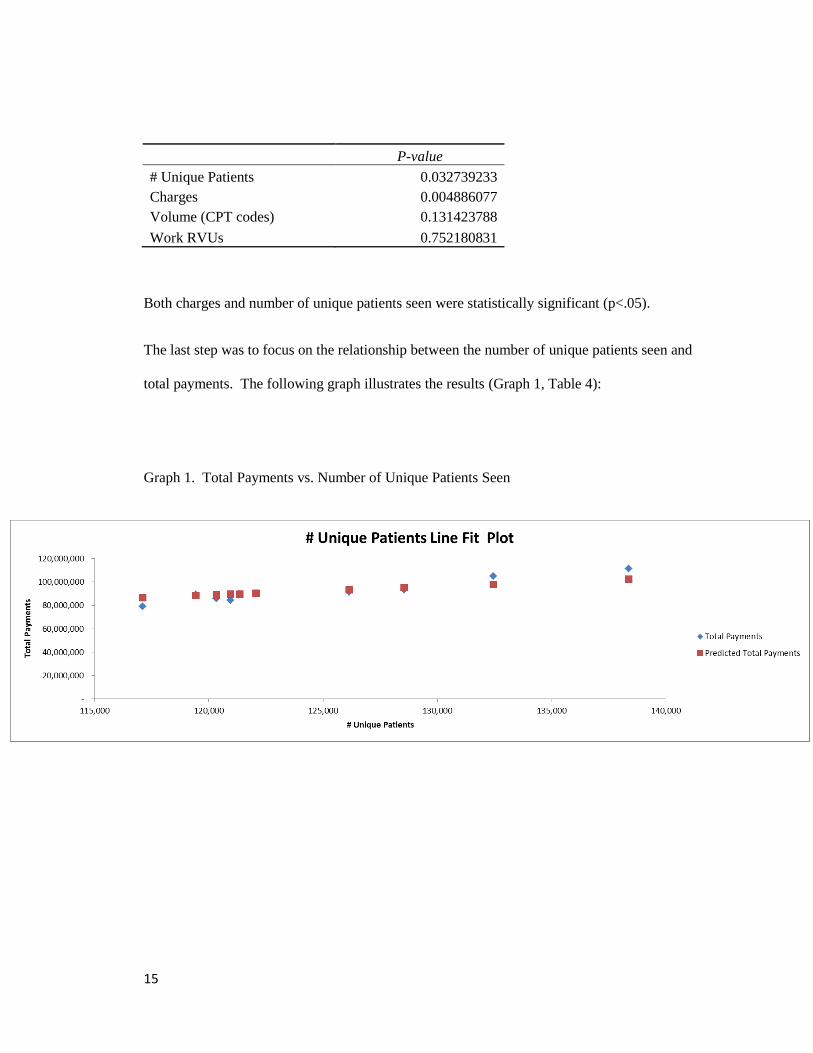
15
P-value
# Unique Patients 0.032739233
Charges 0.004886077
Volume (CPT codes) 0.131423788
Work RVUs 0.752180831
Both charges and number of unique patients seen were statistically significant (p<.05).
The last step was to focus on the relationship between the number of unique patients seen and
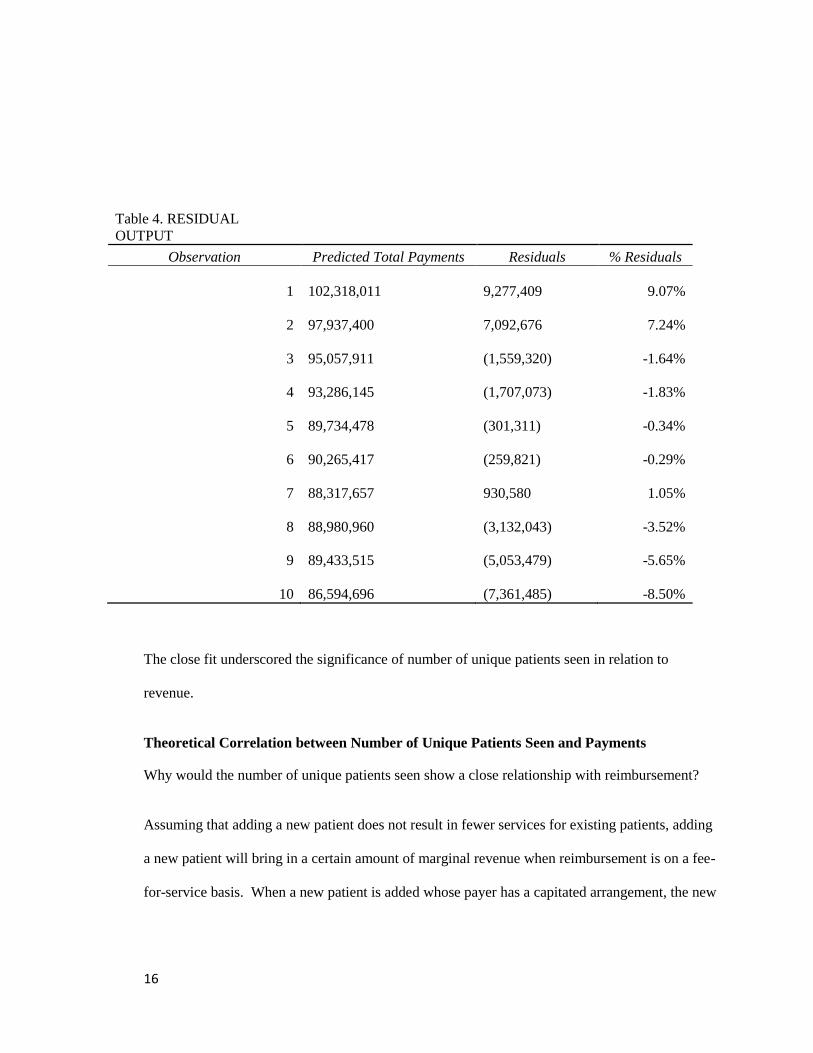
total payments. The following graph illustrates the results (Graph 1, Table 4):
Graph 1. Total Payments vs. Number of Unique Patients Seen
16
Table 4. RESIDUAL
OUTPUT
Observation Predicted Total Payments Residuals % Residuals
1
102,318,011
9,277,409 9.07%
2
97,937,400
7,092,676 7.24%
3
95,057,911
(1,559,320) -1.64%
4
93,286,145
(1,707,073) -1.83%
5
89,734,478
(301,311) -0.34%
6
90,265,417
(259,821) -0.29%
7
88,317,657
930,580 1.05%
8
88,980,960
(3,132,043) -3.52%
9
89,433,515
(5,053,479) -5.65%
10
86,594,696
(7,361,485) -8.50%
The close fit underscored the significance of number of unique patients seen in relation to
revenue.
Theoretical Correlation between Number of Unique Patients Seen and Payments
Why would the number of unique patients seen show a close relationship with reimbursement?
Assuming that adding a new patient does not result in fewer services for existing patients, adding
a new patient will bring in a certain amount of marginal revenue when reimbursement is on a fee-
for-service basis. When a new patient is added whose payer has a capitated arrangement, the new

17
patient will bring in marginal revenue in the form of additional per member per month (PMPM)
payments.
Will the number of unique patients seen continue to show a close relationship with
reimbursement as a higher percentage of reimbursement is value-based (pay for performance)?
Value-based reimbursement is applied as a percentage of overall reimbursement from a particular
payer that is “held back” in anticipation of how well the practice meets goals for quality,
outcomes, patient satisfaction, and/or cost savings to the payer. The amount of value-based
reimbursement is a function of the amount of total reimbursement related to the contract of which
it is a part. Since the number of unique patients seen logically correlates with total
reimbursement, it will continue to be relevant as value-based reimbursement becomes a larger
percentage.
Physician Compensation Plan Design and Implementation Using Number of Unique
Patients Seen
As discussed above, the number of unique patients seen has been recognized as a relevant
component of primary care physician compensation plans. Termed “panel size,” it is one
generally accepted metric for how hard a primary care physician is working. The statistical
analysis described above shows that the number of unique patients seen correlates significantly
with revenue not only for primary care but also for secondary (specialty) care. Further, the
secondary care subspecialties included in the research perform a combination of evaluation and
management services (office visits and consults) and procedures. So by inference it can be
argued that the number of unique patients seen will correlate with revenue for tertiary care as
well, i.e., surgery.

18
In order to link physician compensation plans effectively with revenue generation when both fee-
for-service and capitation methodologies are in place, the number of unique patients seen would
be substituted for commonly used clinical productivity measures such as charges or work RVUs.
In the statistical analysis above, it was noted that work RVUs did not correlate significantly with
payments. Charges did correlate significantly with payments, but the number of unique patients
seen correlated highly with charges, so could be used as a proxy for them.
Using the number of unique patients seen (in lieu of charges or work RVUs) would incentivize
physicians to grow the practice, thereby enhancing revenues in general. Primary care providers
would be incentivized to increase their panels. Secondary care providers would be incentivized
to improve their access for referrals and their availability to provide consults. Tertiary providers
would be incentivized to improve their access to those needing their services. All providers
would be incentivized to provide services with greater time efficiency. To assure that the
resulting increase in patient base and incentive for time efficiency would not be to the detriment
of patient care, measures of quality, outcomes, and patient satisfaction should be used along with
the number of unique patients seen, in a multifaceted plan. This would also reduce the incentive
not to spend enough time or effort on new patients so that more new patients can be seen, or to
skimp on follow-up care once new patients have been seen the first time.
When the use of the number of unique patients seen as a metric (in lieu of charges and work
RVUs) is proposed, it would also be helpful to propose a guaranteed salary component as well, at
least for the early phases of a new plan’s life. While it can be shown logically (and at least in this
case demonstrated statistically) that when the number of unique patients seen grows, practice
revenues grow, and charges and work RVUs should grow as well, secondary and tertiary care
19
providers will be uneasy with a metric previously used only for primary care, and all providers
may be uncomfortable with a metric that has not been as thoroughly benchmarked as charges and
work RVUs.
Conclusion
The research described above supports the existence of a close, statistically significant
relationship between the number of unique patients seen and payments, in an environment
combining both capitated and fee-for-service reimbursement. It was hypothesized that there is a
measure of provider activity which correlates with payments in any payer environment. In this
study, the number of unique patients seen turned out to be such a measure, along with charges.
But, as mentioned, charges create the incentive for overutilization of practice resources, whereas
the number of unique patients seen does not. Interestingly, in this study, work RVUs, which also
incentivize overutilization, did not show a significant correlation with payments. Thus, of the
four measures of provider activity considered, only number of unique patients seen met the
criteria to link incentives to profitability: 1) correlation with payments, and 2) no link to
overutilization of practice resources.
All things considered, however, substituting the number of unique patients seen for charges or
work RVUs in physician compensation plans is an idea whose time has not yet come. As
mentioned, this metric has been recognized to apply only to primary care. It has not been
thoroughly benchmarked, especially in relation to secondary and tertiary care. Other statistical
studies to encompass a much larger sample size and a much more diverse combination of medical

20
specialties will be needed to state with confidence the correlations (or lack thereof) between
measures of provider activity and payments that were observed in the sample used for this study.
Finally, there is an underlying assumption to the use of the number of unique patients seen that
can and will be challenged by providers. They will argue that for them to increase the number of
unique patients seen, there has to be pent up demand, i.e., a pool of new patients waiting to be
seen. They will argue that the number of unique patients seen is more a function of the practice’s
marketing efforts than of how hard they are willing to work and how effectively they provide
care. So practice leadership will need to demonstrate that if the effort is made to see new
patients, there will be new patients to see.

21
References
“8 Salary Negotiation Tips.” Resources – Blog (web site). Integrity Healthcare.
http://ihcrecruiting.com/tag/physician-salary/
Adler, Jerry. “What Health Reform Can Learn from Cleveland Clinic.” Newsweek (web site).
November 26, 2009. http://www.newsweek.com/what-health-reform-can-learn-cleveland-clinic-
76971
Carter, Lucy R. and Lankford, Sara S. Physician’s Compensation: Measurement, Benchmarking,
and Implementation. New York, NY: John Wiley & Sons, 2000.
Darves, Bonnie. Physician Compensation Models: The Basics, the Pros, and the Cons. New
England Journal of Medicine Career Center (web site). October 18, 2011.
http://www.nejmcareercenter.org/article/physician-compensation-models-the-basics-the-pros-
and-the-cons/
Ferber, Lee. The New Models for Physician Compensation. Physician’s Money Digest (web
site). February 22, 2012. http://www.hcplive.com/physicians-money-digest/practice-
management/The-New-Models-for-Physician-Compensation
Greenfield M.D., William R. “In Search of an Effective Physician Compensation Formula.”
Family Practice Management (web site). American Academy of Family Physicians. October
1998. http://www.aafp.org/fpm/1998/1000/p50.html
22
Johnson, Bruce A. and Keegan, Deborah Walker. Physician compensation plans: state-of-the-art
strategies. Englewood, CO: Medical Group Management Association, 2006.
Milburn, Jeffrey B. and Mourar, Mary. Strategies for value-based physician compensation.
Englewood, CO: Medical Group Management Association, 2014.
“Physician Compensation.” Decision Pathways (web site). Medical Group Management
Association. http://www.mgma.com/practice-resources/all-practice-resources/decision-
pathways/physician-compensation?step=6
“Risk adjustment needed when doctor pay is based on patient load.” American Medical News.
amednews.com (web site). August 2, 2012.
http://www.amednews.com/article/20120802/business/308029997/8/
“Shifting Reimbursement Models.” Medical Economics. ModernMedicine.com (web site). April
8, 2014. http://medicaleconomics.modernmedicine.com/medical-
economics/content/tags/aca/shifting-reimbursement-models-risks-and-rewards-primary-
care?page=full
Westgate, Aubrey. Physician Compensation Plan. Physicians Practice (web site). October 19,
2012. http://www.physicianspractice.com/physician-compensation/physician-compensation-plan