linking the florida standards assessments - nwea.org · pdf filelinking the florida standards...
TRANSCRIPT
LinkingtheFloridaStandardsAssessments (FSA)toNWEAMAP
October2016

Page2of26
Introduction
NorthwestEvaluationAssociation™ (NWEA™) is committed toprovidingpartnerswithusefultoolstohelpmakeinferencesfromtheMeasuresofAcademicProgress®(MAP®)interimassessment scores. One important tool is the concordance table between MAP and statesummativeassessments.Concordance tableshavebeenused fordecades to relate scoresondifferent testsmeasuring similar but distinct constructs. These tables, typically derived fromstatisticallinkingprocedures,provideadirectlinkbetweenscoresondifferenttestsandservevarious purposes. Aside fromdescribing how a score on one test relates to performance onanothertest,theycanalsobeusedtoidentifybenchmarkscoresononetestcorrespondingtoperformancecategoriesonanothertest,ortomaintaincontinuityofscoresonatestafterthetest is redesigned or changed. Concordance tables are helpful for educators, parents,administrators,researchers,andpolicymakerstoevaluateandformulateacademicstandingandgrowth.
Recently, NWEA completed a concordance study to connect the scales of the FloridaStandardsAssessment(FSA)EnglishLanguageArts(ELA)andMathematicswiththoseoftheMAP
ReadingandMAPforMathematicsassessments.Inthisreport,wepresentthe2ndthrough8thgrade cut scores onMAP reading andmathematics scales that correspond to the 2016-2017benchmarks on the FSA ELA and math tests. Information about the consistency rate ofclassificationbasedontheestimatedMAPcutscoresisalsoprovided,alongwithaseriesoftablesthat predict the probability of receiving a Level 3 (i.e., “Satisfactory”) or higher performancedesignationontheFSAassessments,basedontheobservedMAPscorestakenduringthesameschoolyear.AdetaileddescriptionofthedataandanalysismethodusedinthisstudyisprovidedintheAppendix.
OverviewofAssessments
FSAincludesaseriesofverticallyscaledachievementtestsalignedtotheFloridastatestandards inELAforgrades3-10andmathforgrades3-8,andend-of-courseassessmentsforAlgebra1,Algebra2,andGeometry.FSAtestscanbedeliveredonlineorinthepaper-and-pencilform.Foreachgradeandsubject,therearefourcutscoresthatdistinguishbetweenperformancelevels:Level1:Inadequate,Level2:BelowSatisfactory,Level3:Satisfactory,Level4:Proficient,and Level 5:Mastery. The Level 3 cut score demarks the minimum level of performanceconsideredtobe“Pass”foraccountabilitypurposes.
MAPtestsareverticallyscaledinterimassessmentsthatareadministeredintheformofacomputerizedadaptivetest(CAT).MAPtestsareconstructedtomeasurestudentachievementfromGradesKto12inmath,reading,languageusage,andscienceandarealignedtotheFlorida

Page3of26
statestandards.MAPscoresarereportedonaRaschUnit(RIT)scalewitharangefrom100to350.EachsubjecthasitsownRITscale.
To aid interpretation ofMAP scores, NWEA periodically conducts norming studies ofstudentandschoolperformanceonMAP.Forexample,the2015RITScalenormingstudy(Thum&Hauser,2015)employedmulti-levelgrowthmodelsonnearly500,000longitudinaltestscoresfromover100,000studentsthatwereweightedtocreatelarge,nationallyrepresentativenormsformath,reading,languageusage,andgeneralscience.
EstimatedMAPCutScoresAssociatedwithFSAReadinessLevels
Tables1to4reporttheFSAscaledscoresassociatedwitheachofthefiveperformancelevels,aswellastheestimatedcutscoresontheMAPtestsassociatedwiththeFSAperformancelevels.Specifically,Tables1and2applytoMAPscoresobtainedduringthespringtestingseasonforreadingandmath,respectively.Tables3and4applytoMAPteststakeninapriortestingseason(fallorwinter)forreadingandmath,respectively.Thetablesalsoreportthepercentilerank(basedontheNWEA2015MAPNorms)associatedwitheachestimatedMAPcutscore.TheMAPcutscorescanbeusedtopredictstudents’mostprobableFSAperformancelevel,basedontheirobservedMAPscores.Forexample,a6thgradestudentwhoobtainedaMAPmathscoreof230inthespringtestingseasonislikelytobeattheveryhighendofLevel3(Satisfactory)ontheFSA taken during that same testing season (see Table 2). Similarly, a 3rd grade studentwhoobtainedaMAPreadingscoreof210inthefalltestingseasonislikelytobeatLevel4(Proficient)ontheFSAtakeninthespringof3rdgrade(seeTable3).

Page4of26
TABLE1.CONCORDANCEOFPERFORMANCELEVELSCORERANGESBETWEENFSA
ELAANDMAPREADING(WHENMAPISTAKENINSPRING)
Grade
FSA
Level1 Level2 Level3 Level4 Level5
Inadequate BelowSatisfactory Satisfactory Proficient Mastery
3 240-284 285-299 300-314 315-329 330-360
4 251-296 297-310 311-324 325-339 340-372
5 257-303 304-320 321-335 336-351 352-385
6 259-308 309-325 326-338 339-355 356-391
7 267-317 318-332 333-345 346-359 360-397
8 274-321 322-336 337-351 352-365 366-403
Grade
MAP
Level1 Level2 Level3 Level4 Level5
Inadequate BelowSatisfactory Satisfactory Proficient Mastery
RIT %ile RIT %ile RIT %ile RIT %ile RIT %ile
2* 100-178 1-25 179-189 26-52 190-199 53-76 200-208 77-90 209-350 91-99
3 100-188 1-25 189-199 26-52 200-209 53-76 210-218 77-90 219-350 91-99
4 100-199 1-33 200-208 34-56 209-217 57-78 218-226 79-91 227-350 92-99
5 100-204 1-31 205-214 32-57 215-223 58-78 224-232 79-92 233-350 91-99
6 100-205 1-24 206-216 25-52 217-224 53-72 225-234 73-89 235-350 90-99
7 100-210 1-30 211-220 31-56 221-228 57-75 229-237 76-89 238-350 90-99
8 100-209 1-25 210-220 26-51 221-229 52-72 230-238 73-87 239-350 88-99Notes.1.%ile=percentile.2.Boldednumbersindicatethecutscoresconsideredtobeatleast“pass”foraccountabilitypurposes.3.*denotesGrade2benchmarksareextrapolatedfromGrade3cutscoresthatareestablishedthroughtheequipercentileprocedure
describedintheAppendix.

Page5of26
TABLE2.CONCORDANCEOFPERFORMANCELEVELSCORERANGESBETWEENFSA
ANDMAPMATH(WHENMAPISTAKENINSPRING)
Grade
FSA
Level1 Level2 Level3 Level4 Level5
Inadequate BelowSatisfactory Satisfactory Proficient Mastery
3 240-284 285-296 297-310 311-326 327-360
4 251-298 299-309 310-324 325-339 340-376
5 256-305 306-319 320-333 334-349 350-388
6 260-309 310-324 325-338 339-355 356-390
7 269-315 316-329 330-345 346-359 360-391
8 273-321 322-336 337-352 353-364 365-393
Grade
MAP
Level1 Level2 Level3 Level4 Level5
Inadequate BelowSatisfactory Satisfactory Proficient Mastery
RIT %ile RIT %ile RIT %ile RIT %ile RIT %ile
2* 100-182 1-23 183-189 24-42 190-197 43-65 198-205 66-83 206-350 84-99
3 100-194 1-25 195-201 26-44 202-209 45-67 210-217 68-84 218-350 85-99
4 100-205 1-29 206-211 30-44 212-220 45-68 221-228 69-84 229-350 85-99
5 100-213 1-31 214-222 32-52 223-231 53-73 232-240 74-88 241-350 89-99
6 100-213 1-23 214-223 24-45 224-232 46-66 233-242 67-84 243-350 85-99
7 100-215 1-22 216-225 23-43 226-236 44-67 237-247 68-85 248-350 86-99
8 100-216 1-22 217-226 23-40 227-237 41-63 238-247 64-80 248-350 81-99Notes.1.%ile=percentile.2.Boldednumbersindicatethecutscoresconsideredtobeatleast“pass”foraccountabilitypurposes.3.*denotesGrade2benchmarksareextrapolatedfromGrade3cutscoresthatareestablishedthroughtheequipercentileprocedure
describedintheAppendix.

Page6of26
TABLE3.CONCORDANCEOFPERFORMANCELEVELSCORERANGESBETWEENFSAELAANDMAPREADING(WHENMAPISTAKENINFALLORWINTERPRIORTOSPRINGFSATESTS)
Grade
FSALevel1 Level2 Level3 Level4 Level5
Inadequate BelowSatisfactory Satisfactory Proficient Mastery
3 240-284 285-299 300-314 315-329 330-3604 251-296 297-310 311-324 325-339 340-3725 257-303 304-320 321-335 336-351 352-3856 259-308 309-325 326-338 339-355 356-3917 267-317 318-332 333-345 346-359 360-3978 274-321 322-336 337-351 352-365 366-403
Grade
MAPFALLLevel1 Level2 Level3 Level4 Level5
Inadequate BelowSatisfactory Satisfactory Proficient MasteryRIT %ile RIT %ile RIT %ile RIT %ile RIT %ile
2* 100-162 1-21 163-175 22-52 176-187 53-79 188-198 80-93 199-350 94-993 100-176 1-22 177-189 23-53 190-201 54-79 202-211 80-92 212-350 93-994 100-190 1-31 191-201 32-58 202-211 59-80 212-222 81-94 223-350 94-995 100-197 1-29 198-208 30-57 209-219 58-81 220-229 82-94 230-350 94-996 100-199 1-22 200-211 23-51 212-221 52-75 222-232 76-92 233-350 93-997 100-205 1-27 206-217 28-57 218-226 58-78 227-235 79-91 236-350 92-998 100-205 1-22 206-217 23-50 218-227 51-74 228-236 75-88 237-350 89-99
Grade
MAPWINTERLevel1 Level2 Level3 Level4 Level5
Inadequate BelowSatisfactory Satisfactory Proficient MasteryRIT %ile RIT %ile RIT %ile RIT %ile RIT %ile
2* 100-173 1-23 174-185 24-53 186-195 54-77 196-205 78-92 206-350 93-993 100-184 1-23 185-196 24-52 197-207 53-78 208-216 79-91 217-350 92-994 100-196 1-31 197-206 32-57 207-215 58-78 216-225 79-92 226-350 93-995 100-202 1-30 203-212 31-57 213-222 58-80 223-231 81-93 232-350 93-996 100-203 1-23 204-215 24-53 216-223 54-73 224-233 74-90 234-350 91-997 100-208 1-28 209-219 29-56 220-227 57-76 228-236 77-90 237-350 91-998 100-208 1-24 209-219 25-51 220-228 52-72 229-237 73-88 238-350 89-99
Notes.1.%ile=percentile.2.Boldednumbersindicatethecutscoresconsideredtobeatleast“pass”foraccountabilitypurposes.3.*denotesGrade2benchmarksareextrapolatedfromGrade3cutscoresthatareestablishedthroughtheequipercentileprocedure
describedintheAppendix.

Page7of26
TABLE4.CONCORDANCEOFPERFORMANCELEVELSCORERANGESBETWEENFSAANDMAPMATH(WHENMAPISTAKENINFALLORWINTERPRIORTOSPRINGFSATESTS)
Grade
FSALevel1 Level2 Level3 Level4 Level5
Inadequate BelowSatisfactory Satisfactory Proficient Mastery
3 240-284 285-296 297-310 311-326 327-3604 251-298 299-309 310-324 325-339 340-3765 256-305 306-319 320-333 334-349 350-3886 260-309 310-324 325-338 339-355 356-3907 269-315 316-329 330-345 346-359 360-3918 273-321 322-336 337-352 353-364 365-393
Grade
MAPFALLLevel1 Level2 Level3 Level4 Level5
Inadequate BelowSatisfactory Satisfactory Proficient MasteryRIT %ile RIT %ile RIT %ile RIT %ile RIT %ile
2* 100-165 1-19 166-173 20-39 174-183 40-69 184-192 70-88 193-350 89-993 100-180 1-22 181-188 23-44 189-196 45-67 197-205 68-87 206-350 88-994 100-193 1-26 194-199 27-42 200-209 43-70 210-217 71-87 218-350 88-995 100-203 1-29 204-212 30-52 213-221 53-75 222-230 76-90 231-350 91-996 100-205 1-21 206-215 22-44 216-224 45-67 225-235 68-87 236-350 88-997 100-209 1-21 210-219 22-42 220-230 43-68 231-241 69-87 242-350 88-998 100-211 1-20 212-221 21-39 222-233 40-65 234-243 66-83 244-350 84-99
Grade
MAPWINTERLevel1 Level2 Level3 Level4 Level5
Inadequate BelowSatisfactory Satisfactory Proficient MasteryRIT %ile RIT %ile RIT %ile RIT %ile RIT %ile
2* 100-176 1-22 177-183 23-41 184-191 42-65 192-200 66-85 201-350 86-993 100-189 1-25 190-196 26-44 197-204 45-68 205-212 69-85 213-350 86-994 100-200 1-28 201-206 29-43 207-215 44-68 216-223 69-85 224-350 86-995 100-209 1-30 210-218 31-53 219-227 54-74 228-236 75-89 237-350 90-996 100-210 1-23 211-220 24-46 221-229 47-67 230-239 68-86 240-350 87-997 100-213 1-22 214-223 23-43 224-234 44-68 235-245 69-87 246-350 88-998 100-214 1-21 215-224 22-39 225-235 40-63 236-245 64-81 246-350 82-99
Notes.1.%ile=percentile.2.Boldednumbersindicatethecutscoresconsideredtobeatleast“pass”foraccountabilitypurposes.3.*denotesGrade2benchmarksareextrapolatedfromGrade3cutscoresthatareestablishedthroughtheequipercentile
proceduredescribedintheAppendix.

Page8of26
ConsistencyRateofClassification
Consistency rate of classification (Pommerich, Hanson, Harris, & Sconing, 2004),expressedintheformofaratebetween0and1,providesameanstomeasurethedeparturefromequityforconcordances(Hansonetal.,2001).ThisindexcanalsobeusedasanindicatorforthepredictivevalidityoftheMAPtests, i.e.,howaccuratelytheMAPscorescanpredictastudent’sproficiencystatusintheFSAtest.Foreachpairofconcordantscores,aclassificationisconsidered consistent if the examinee is classified into the same performance categoryregardlessofthetestusedformakingadecision.Consistencyrateprovidedinthisreportcanbecalculatedas,forthe“satisfactory”performancecategoryconcordantscores,thepercentageofexamineeswhoscoreatorabovebothconcordantscoresplusthepercentageofexamineeswhoscorebelowboth concordant scores on each test.Higher consistency rate indicates strongercongruencebetweenFSAandMAPcutscores.TheresultsinTable5demonstratethatonaverageMAPreadingscorescanconsistentlyclassifystudents’proficiency(Level3orhigher)statusonFSAELAtest82%ofthetime,andMAPmathscorescanconsistentlyclassifystudentsonFSAmathtest83%ofthetime.ThosenumbersarehighsuggestingthatbothMAPreadingandmathtestsaregreatpredictorsofthestudents’proficiencystatusontheFSAtests.
TABLE5.CONSISTENCYRATEOFCLASSIFICATIONFORMAPANDFSALEVEL3
EQUIPERCENTILECONCORDANCES
GradeELA/Reading Math
ConsistencyRate
False ConsistencyRate
FalsePositives Negatives Positives Negatives
3 0.83 0.09 0.08 0.83 0.08 0.094 0.83 0.09 0.08 0.86 0.08 0.065 0.82 0.10 0.08 0.86 0.07 0.076 0.82 0.10 0.08 0.84 0.09 0.077 0.81 0.11 0.08 0.82 0.09 0.098 0.80 0.11 0.09 0.79 0.13 0.09
ProficiencyProjection
Proficiencyprojectiontellshowlikelyastudentisclassifiedas“satisfactory”onFSAtestsbasedonhis/herobservedMAPscores.Theconditionalgrowthnormsprovidedinthe2015MAPNormswereusedtocalculatethisinformation(Thum&Hauser,2015).Theresultsofproficiencyprojection and corresponding probability of achieving “satisfactory” on the FSA tests are

Page9of26
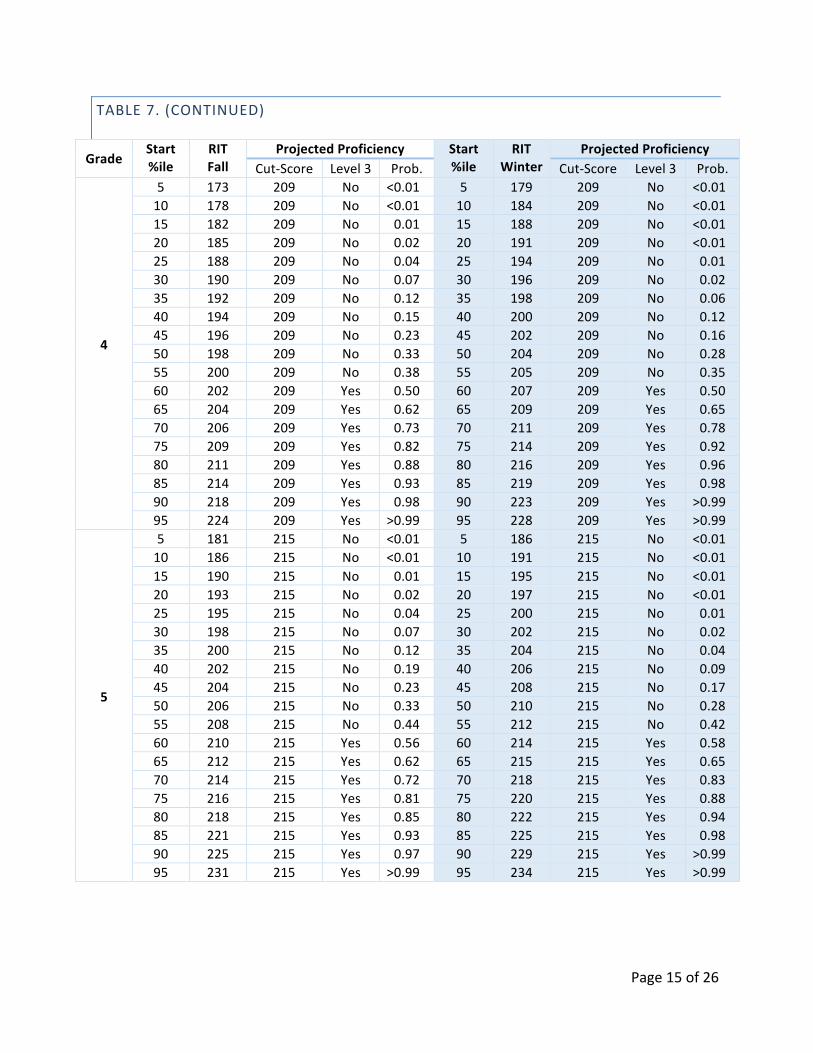
presentedinTables6to8.ThesetablesestimatetheprobabilityofscoringatLevel3oraboveonFSAinthespringandthepriorfallorwintertestingseason.Forexample,ifa3rdgradestudentobtainedaMAPmathscoreof190inthefall,theprobabilityofobtainingaLevel3orhigherFSAscore inthespringof3rdgrade is56%.Table6presentstheestimatedprobabilityofmeetingLevel 3 benchmark when MAP is taken in the spring, whereas Tables 7 and 8 present theestimatedprobabilityofmeetingLevel3benchmarkwhenMAPistakeninthefallorwinterpriortotakingtheFSAtests.

Page10of26
TABLE6.PROFICIENCYPROJECTIONANDPROBABILITYFORPASSINGFSALEVEL3(SATISFACTORY)WHENMAPISTAKENINTHESPRING
Grade
Reading Math
Start%ile
RITSpring
ProjectedProficiency Start%ile
RITSpring
ProjectedProficiency
CutScore Level3 Prob. CutScore Level3 Prob.
2
5 164 190 No <0.01 5 170 190 No <0.0110 169 190 No <0.01 10 175 190 No <0.0115 173 190 No <0.01 15 178 190 No <0.0120 176 190 No <0.01 20 181 190 No <0.0125 178 190 No <0.01 25 183 190 No 0.0130 181 190 No <0.01 30 185 190 No 0.0435 183 190 No 0.01 35 187 190 No 0.1540 185 190 No 0.06 40 189 190 No 0.3745 187 190 No 0.17 45 190 190 Yes 0.5050 189 190 No 0.38 50 192 190 Yes 0.7555 191 190 Yes 0.62 55 194 190 Yes 0.9260 193 190 Yes 0.83 60 196 190 Yes 0.9865 195 190 Yes 0.94 65 197 190 Yes 0.9970 197 190 Yes 0.99 70 199 190 Yes >0.9975 199 190 Yes >0.99 75 201 190 Yes >0.9980 201 190 Yes >0.99 80 204 190 Yes >0.9985 204 190 Yes >0.99 85 206 190 Yes >0.9990 208 190 Yes >0.99 90 209 190 Yes >0.9995 214 190 Yes >0.99 95 214 190 Yes >0.99
3
5 174 200 No <0.01 5 181 202 No <0.0110 179 200 No <0.01 10 186 202 No <0.0115 183 200 No <0.01 15 189 202 No <0.0120 186 200 No <0.01 20 192 202 No <0.0125 188 200 No <0.01 25 194 202 No <0.0130 191 200 No <0.01 30 196 202 No 0.0235 193 200 No 0.01 35 198 202 No 0.0840 195 200 No 0.06 40 200 202 No 0.2545 197 200 No 0.17 45 202 202 Yes 0.5050 199 200 No 0.38 50 203 202 Yes 0.6355 201 200 Yes 0.62 55 205 202 Yes 0.8560 202 200 Yes 0.73 60 207 202 Yes 0.9665 204 200 Yes 0.89 65 209 202 Yes 0.9970 207 200 Yes 0.99 70 211 202 Yes >0.9975 209 200 Yes >0.99 75 213 202 Yes >0.9980 211 200 Yes >0.99 80 215 202 Yes >0.9985 214 200 Yes >0.99 85 218 202 Yes >0.9990 218 200 Yes >0.99 90 221 202 Yes >0.9995 223 200 Yes >0.99 95 226 202 Yes >0.99

Page11of26
TABLE6.(CONTINUED)
Grade
Reading Math
Start%ile
RITSpring
ProjectedProficiency Start%ile
RITSpring
ProjectedProficiency
CutScore Level3 Prob. CutScore Level3 Prob.
4
5 181 209 No <0.01 5 189 212 No <0.0110 187 209 No <0.01 10 194 212 No <0.0115 190 209 No <0.01 15 198 212 No <0.0120 193 209 No <0.01 20 201 212 No <0.0125 196 209 No <0.01 25 203 212 No <0.0130 198 209 No <0.01 30 206 212 No 0.0235 200 209 No <0.01 35 208 212 No 0.0840 202 209 No 0.01 40 210 212 No 0.2545 204 209 No 0.06 45 212 212 Yes 0.5050 206 209 No 0.17 50 213 212 Yes 0.6355 208 209 No 0.38 55 215 212 Yes 0.8560 210 209 Yes 0.62 60 217 212 Yes 0.9665 212 209 Yes 0.83 65 219 212 Yes 0.9970 214 209 Yes 0.94 70 221 212 Yes >0.9975 216 209 Yes 0.99 75 224 212 Yes >0.9980 218 209 Yes >0.99 80 226 212 Yes >0.9985 221 209 Yes >0.99 85 229 212 Yes >0.9990 225 209 Yes >0.99 90 233 212 Yes >0.9995 230 209 Yes >0.99 95 238 212 Yes >0.99
5
5 188 215 No <0.01 5 195 223 No <0.0110 193 215 No <0.01 10 201 223 No <0.0115 197 215 No <0.01 15 205 223 No <0.0120 199 215 No <0.01 20 208 223 No <0.0125 202 215 No <0.01 25 210 223 No <0.0130 204 215 No <0.01 30 213 223 No <0.0135 206 215 No <0.01 35 215 223 No <0.0140 208 215 No 0.01 40 217 223 No 0.0245 210 215 No 0.06 45 219 223 No 0.0850 212 215 No 0.17 50 221 223 No 0.2555 214 215 No 0.38 55 223 223 Yes 0.5060 216 215 Yes 0.62 60 225 223 Yes 0.7565 217 215 Yes 0.73 65 228 223 Yes 0.9670 220 215 Yes 0.94 70 230 223 Yes 0.9975 222 215 Yes 0.99 75 232 223 Yes >0.9980 224 215 Yes >0.99 80 235 223 Yes >0.9985 227 215 Yes >0.99 85 238 223 Yes >0.9990 231 215 Yes >0.99 90 242 223 Yes >0.9995 236 215 Yes >0.99 95 248 223 Yes >0.99

Page12of26
TABLE6.(CONTINUED)
Grade
Reading Math
Start%ile
RITSpring
ProjectedProficiency Start%ile
RITSpring
ProjectedProficiency
CutScore Level3 Prob. CutScore Level3 Prob.
6
5 192 217 No <0.01 5 198 224 No <0.0110 197 217 No <0.01 10 204 224 No <0.0115 201 217 No <0.01 15 208 224 No <0.0120 203 217 No <0.01 20 211 224 No <0.0125 206 217 No <0.01 25 214 224 No <0.0130 208 217 No <0.01 30 217 224 No 0.0135 210 217 No 0.01 35 219 224 No 0.0440 212 217 No 0.06 40 221 224 No 0.1545 214 217 No 0.17 45 223 224 No 0.3750 216 217 No 0.38 50 225 224 Yes 0.6355 218 217 Yes 0.62 55 227 224 Yes 0.8560 219 217 Yes 0.73 60 230 224 Yes 0.9865 221 217 Yes 0.89 65 232 224 Yes >0.9970 223 217 Yes 0.97 70 234 224 Yes >0.9975 226 217 Yes >0.99 75 237 224 Yes >0.9980 228 217 Yes >0.99 80 239 224 Yes >0.9985 231 217 Yes >0.99 85 243 224 Yes >0.9990 235 217 Yes >0.99 90 247 224 Yes >0.9995 240 217 Yes >0.99 95 253 224 Yes >0.99
7
5 193 221 No <0.01 5 199 226 No <0.0110 199 221 No <0.01 10 206 226 No <0.0115 202 221 No <0.01 15 210 226 No <0.0120 205 221 No <0.01 20 214 226 No <0.0125 208 221 No <0.01 25 217 226 No <0.0130 210 221 No <0.01 30 219 226 No 0.0135 212 221 No <0.01 35 222 226 No 0.0840 214 221 No 0.01 40 224 226 No 0.2545 216 221 No 0.06 45 226 226 Yes 0.5050 218 221 No 0.17 50 229 226 Yes 0.8555 220 221 No 0.38 55 231 226 Yes 0.9660 222 221 Yes 0.62 60 233 226 Yes 0.9965 224 221 Yes 0.83 65 235 226 Yes >0.9970 226 221 Yes 0.94 70 238 226 Yes >0.9975 228 221 Yes 0.99 75 241 226 Yes >0.9980 231 221 Yes >0.99 80 244 226 Yes >0.9985 234 221 Yes >0.99 85 247 226 Yes >0.9990 238 221 Yes >0.99 90 251 226 Yes >0.9995 243 221 Yes >0.99 95 258 226 Yes >0.99

Page13of26
TABLE6.(CONTINUED)
Grade
Reading Math
Start%ile
RITSpring
ProjectedProficiency Start%ile
RITSpring
ProjectedProficiency
CutScore Level3 Prob. CutScore Level3 Prob.
8
5 194 221 No <0.01 5 199 227 No <0.0110 200 221 No <0.01 10 206 227 No <0.0115 204 221 No <0.01 15 211 227 No <0.0120 207 221 No <0.01 20 215 227 No <0.0125 209 221 No <0.01 25 218 227 No <0.0130 212 221 No <0.01 30 221 227 No 0.0235 214 221 No 0.01 35 224 227 No 0.1540 216 221 No 0.06 40 226 227 No 0.3745 218 221 No 0.17 45 229 227 Yes 0.7550 220 221 No 0.38 50 231 227 Yes 0.9255 222 221 Yes 0.62 55 233 227 Yes 0.9860 224 221 Yes 0.83 60 236 227 Yes >0.9965 226 221 Yes 0.94 65 238 227 Yes >0.9970 228 221 Yes 0.99 70 241 227 Yes >0.9975 231 221 Yes >0.99 75 244 227 Yes >0.9980 233 221 Yes >0.99 80 247 227 Yes >0.9985 236 221 Yes >0.99 85 251 227 Yes >0.9990 240 221 Yes >0.99 90 255 227 Yes >0.9995 246 221 Yes >0.99 95 262 227 Yes >0.99
Note.%ile=percentile

Page14of26
TABLE7.PROFICIENCYPROJECTIONANDPROBABILITYFORPASSINGFSAELALEVEL3(SATISFACTORY)WHENMAPISTAKENINTHEFALLORWINTERPRIORTOSPRINGFSATESTS
GradeStart%ile
RITFall
ProjectedProficiency Start%ile
RITWinter
ProjectedProficiencyCutScore Level3 Prob. CutScore Level3 Prob.
2
5 149 190 No <0.01 5 160 190 No <0.0110 155 190 No 0.01 10 165 190 No <0.0115 159 190 No 0.03 15 169 190 No <0.0120 162 190 No 0.06 20 172 190 No 0.0125 164 190 No 0.10 25 174 190 No 0.0230 167 190 No 0.15 30 176 190 No 0.0535 169 190 No 0.22 35 178 190 No 0.1040 171 190 No 0.30 40 180 190 No 0.1845 173 190 No 0.35 45 182 190 No 0.2950 175 190 No 0.45 50 184 190 No 0.4355 177 190 Yes 0.55 55 186 190 Yes 0.5060 179 190 Yes 0.60 60 188 190 Yes 0.6465 181 190 Yes 0.70 65 190 190 Yes 0.7770 183 190 Yes 0.78 70 192 190 Yes 0.8675 185 190 Yes 0.81 75 194 190 Yes 0.9380 188 190 Yes 0.90 80 197 190 Yes 0.9885 191 190 Yes 0.94 85 200 190 Yes 0.9990 195 190 Yes 0.98 90 203 190 Yes >0.9995 200 190 Yes 0.99 95 209 190 Yes >0.99
3
5 162 200 No <0.01 5 171 200 No <0.0110 168 200 No 0.01 10 176 200 No <0.0115 172 200 No 0.02 15 180 200 No <0.0120 175 200 No 0.03 20 183 200 No 0.0125 178 200 No 0.08 25 185 200 No 0.0230 180 200 No 0.13 30 188 200 No 0.0635 182 200 No 0.16 35 190 200 No 0.0940 184 200 No 0.24 40 192 200 No 0.1745 186 200 No 0.34 45 194 200 No 0.2850 188 200 No 0.39 50 196 200 No 0.4255 190 200 Yes 0.50 55 198 200 Yes 0.5860 192 200 Yes 0.61 60 199 200 Yes 0.6565 194 200 Yes 0.66 65 201 200 Yes 0.7870 197 200 Yes 0.80 70 204 200 Yes 0.9175 199 200 Yes 0.87 75 206 200 Yes 0.9480 202 200 Yes 0.92 80 208 200 Yes 0.9785 205 200 Yes 0.97 85 211 200 Yes 0.9990 209 200 Yes 0.99 90 215 200 Yes >0.9995 214 200 Yes >0.99 95 221 200 Yes >0.99
Page15of26
TABLE7.(CONTINUED)
GradeStart%ile
RITFall
ProjectedProficiency Start%ile
RITWinter
ProjectedProficiencyCut-Score Level3 Prob. Cut-Score Level3 Prob.
4
5 173 209 No <0.01 5 179 209 No <0.0110 178 209 No <0.01 10 184 209 No <0.0115 182 209 No 0.01 15 188 209 No <0.0120 185 209 No 0.02 20 191 209 No <0.0125 188 209 No 0.04 25 194 209 No 0.0130 190 209 No 0.07 30 196 209 No 0.0235 192 209 No 0.12 35 198 209 No 0.0640 194 209 No 0.15 40 200 209 No 0.1245 196 209 No 0.23 45 202 209 No 0.1650 198 209 No 0.33 50 204 209 No 0.2855 200 209 No 0.38 55 205 209 No 0.3560 202 209 Yes 0.50 60 207 209 Yes 0.5065 204 209 Yes 0.62 65 209 209 Yes 0.6570 206 209 Yes 0.73 70 211 209 Yes 0.7875 209 209 Yes 0.82 75 214 209 Yes 0.9280 211 209 Yes 0.88 80 216 209 Yes 0.9685 214 209 Yes 0.93 85 219 209 Yes 0.9890 218 209 Yes 0.98 90 223 209 Yes >0.9995 224 209 Yes >0.99 95 228 209 Yes >0.99
5
5 181 215 No <0.01 5 186 215 No <0.0110 186 215 No <0.01 10 191 215 No <0.0115 190 215 No 0.01 15 195 215 No <0.0120 193 215 No 0.02 20 197 215 No <0.0125 195 215 No 0.04 25 200 215 No 0.0130 198 215 No 0.07 30 202 215 No 0.0235 200 215 No 0.12 35 204 215 No 0.0440 202 215 No 0.19 40 206 215 No 0.0945 204 215 No 0.23 45 208 215 No 0.1750 206 215 No 0.33 50 210 215 No 0.2855 208 215 No 0.44 55 212 215 No 0.4260 210 215 Yes 0.56 60 214 215 Yes 0.5865 212 215 Yes 0.62 65 215 215 Yes 0.6570 214 215 Yes 0.72 70 218 215 Yes 0.8375 216 215 Yes 0.81 75 220 215 Yes 0.8880 218 215 Yes 0.85 80 222 215 Yes 0.9485 221 215 Yes 0.93 85 225 215 Yes 0.9890 225 215 Yes 0.97 90 229 215 Yes >0.9995 231 215 Yes >0.99 95 234 215 Yes >0.99

Page16of26
TABLE7.(CONTINUED)
GradeStart%ile
RITFall
ProjectedProficiency Start%ile
RITWinter
ProjectedProficiencyCut-Score Level3 Prob. Cut-Score Level3 Prob.
6
5 186 217 No <0.01 5 190 217 No <0.0110 192 217 No <0.01 10 196 217 No <0.0115 196 217 No 0.02 15 199 217 No <0.0120 198 217 No 0.03 20 202 217 No 0.0125 201 217 No 0.07 25 204 217 No 0.0230 203 217 No 0.12 30 207 217 No 0.0635 205 217 No 0.19 35 209 217 No 0.1240 207 217 No 0.23 40 211 217 No 0.2245 209 217 No 0.33 45 212 217 No 0.2850 211 217 No 0.44 50 214 217 No 0.4255 213 217 Yes 0.56 55 216 217 Yes 0.5060 215 217 Yes 0.61 60 218 217 Yes 0.6565 217 217 Yes 0.72 65 220 217 Yes 0.7870 219 217 Yes 0.81 70 222 217 Yes 0.8875 221 217 Yes 0.84 75 224 217 Yes 0.9480 224 217 Yes 0.93 80 226 217 Yes 0.9785 226 217 Yes 0.96 85 229 217 Yes 0.9990 230 217 Yes 0.99 90 233 217 Yes >0.9995 236 217 Yes >0.99 95 238 217 Yes >0.99
7
5 189 221 No <0.01 5 192 221 No <0.0110 195 221 No <0.01 10 198 221 No <0.0115 199 221 No 0.01 15 201 221 No <0.0120 202 221 No 0.02 20 204 221 No <0.0125 204 221 No 0.04 25 207 221 No 0.0130 206 221 No 0.07 30 209 221 No 0.0335 209 221 No 0.12 35 211 221 No 0.0640 211 221 No 0.19 40 213 221 No 0.0945 213 221 No 0.28 45 215 221 No 0.1750 214 221 No 0.33 50 217 221 No 0.2855 216 221 No 0.39 55 219 221 No 0.4260 218 221 Yes 0.50 60 221 221 Yes 0.5865 220 221 Yes 0.61 65 223 221 Yes 0.7270 222 221 Yes 0.72 70 225 221 Yes 0.8375 225 221 Yes 0.81 75 227 221 Yes 0.9180 227 221 Yes 0.88 80 230 221 Yes 0.9785 230 221 Yes 0.95 85 232 221 Yes 0.9890 234 221 Yes 0.98 90 236 221 Yes >0.9995 240 221 Yes >0.99 95 242 221 Yes >0.99

Page17of26
TABLE7.(CONTINUED)
GradeStart%ile
RITFall
ProjectedProficiency Start%ile
RITWinter
ProjectedProficiencyCut-Score Level3 Prob. Cut-Score Level3 Prob.
8
5 191 221 No <0.01 5 194 221 No <0.0110 197 221 No 0.01 10 199 221 No <0.0115 201 221 No 0.03 15 203 221 No <0.0120 204 221 No 0.06 20 206 221 No 0.0125 207 221 No 0.10 25 209 221 No 0.0230 209 221 No 0.16 30 211 221 No 0.0535 211 221 No 0.22 35 213 221 No 0.1040 213 221 No 0.26 40 215 221 No 0.1845 215 221 No 0.35 45 217 221 No 0.2950 217 221 No 0.45 50 219 221 No 0.4355 219 221 Yes 0.55 55 221 221 Yes 0.5760 221 221 Yes 0.60 60 223 221 Yes 0.7165 223 221 Yes 0.69 65 225 221 Yes 0.8270 225 221 Yes 0.78 70 227 221 Yes 0.9075 228 221 Yes 0.84 75 229 221 Yes 0.9580 230 221 Yes 0.90 80 232 221 Yes 0.9885 234 221 Yes 0.96 85 235 221 Yes 0.9990 237 221 Yes 0.98 90 239 221 Yes >0.9995 243 221 Yes >0.99 95 244 221 Yes >0.99
Note.%ile=percentile

Page18of26
TABLE8.PROFICIENCYPROJECTIONANDPROBABILITYFORPASSINGFSAMATHLEVEL3(SATISFACTORY)WHENMAPISTAKENINTHEFALLORWINTERPRIORTOSPRINGFSATESTS
GradeStart%ile
RITFall
ProjectedProficiency Start%ile
RITWinter
ProjectedProficiencyCutScore Level3 Prob. CutScore Level3 Prob.
2
5 155 190 No 0.01 5 165 190 No <0.0110 160 190 No 0.03 10 170 190 No <0.0115 163 190 No 0.07 15 173 190 No 0.0120 166 190 No 0.16 20 175 190 No 0.0325 168 190 No 0.19 25 178 190 No 0.1130 170 190 No 0.28 30 180 190 No 0.2135 172 190 No 0.39 35 181 190 No 0.2740 174 190 Yes 0.50 40 183 190 No 0.4245 175 190 Yes 0.50 45 185 190 Yes 0.5850 177 190 Yes 0.61 50 186 190 Yes 0.6655 179 190 Yes 0.72 55 188 190 Yes 0.7960 180 190 Yes 0.76 60 190 190 Yes 0.8965 182 190 Yes 0.84 65 191 190 Yes 0.9270 184 190 Yes 0.88 70 193 190 Yes 0.9575 186 190 Yes 0.93 75 195 190 Yes 0.9880 188 190 Yes 0.96 80 197 190 Yes 0.9985 191 190 Yes 0.98 85 200 190 Yes >0.9990 194 190 Yes 0.99 90 203 190 Yes >0.9995 199 190 Yes >0.99 95 208 190 Yes >0.99
3
5 169 202 No <0.01 5 176 202 No <0.0110 174 202 No 0.01 10 181 202 No <0.0115 177 202 No 0.04 15 184 202 No 0.0120 179 202 No 0.08 20 187 202 No 0.0225 182 202 No 0.17 25 189 202 No 0.0530 184 202 No 0.22 30 191 202 No 0.1035 185 202 No 0.27 35 193 202 No 0.2040 187 202 No 0.38 40 195 202 No 0.3445 189 202 Yes 0.50 45 197 202 Yes 0.5050 190 202 Yes 0.56 50 198 202 Yes 0.5855 192 202 Yes 0.68 55 200 202 Yes 0.7460 194 202 Yes 0.78 60 202 202 Yes 0.8665 195 202 Yes 0.83 65 203 202 Yes 0.9070 197 202 Yes 0.89 70 205 202 Yes 0.9575 199 202 Yes 0.92 75 207 202 Yes 0.9880 201 202 Yes 0.96 80 209 202 Yes 0.9985 204 202 Yes 0.99 85 212 202 Yes >0.9990 207 202 Yes >0.99 90 215 202 Yes >0.9995 212 202 Yes >0.99 95 220 202 Yes >0.99

Page19of26
TABLE8.(CONTINUED)
GradeStart%ile
RITFall
ProjectedProficiency Start%ile
RITWinter
ProjectedProficiencyCut-Score Level3 Prob. Cut-Score Level3 Prob.
4
5 179 212 No <0.01 5 185 212 No <0.0110 184 212 No 0.01 10 190 212 No <0.0115 188 212 No 0.03 15 194 212 No <0.0120 190 212 No 0.06 20 197 212 No 0.0225 193 212 No 0.14 25 199 212 No 0.0530 195 212 No 0.22 30 201 212 No 0.1035 197 212 No 0.32 35 203 212 No 0.2040 198 212 No 0.38 40 205 212 No 0.3445 200 212 Yes 0.50 45 207 212 Yes 0.5050 202 212 Yes 0.62 50 209 212 Yes 0.6655 204 212 Yes 0.73 55 211 212 Yes 0.8060 205 212 Yes 0.73 60 212 212 Yes 0.8665 207 212 Yes 0.83 65 214 212 Yes 0.9370 209 212 Yes 0.89 70 216 212 Yes 0.9775 211 212 Yes 0.94 75 218 212 Yes 0.9980 214 212 Yes 0.98 80 221 212 Yes >0.9985 216 212 Yes 0.99 85 223 212 Yes >0.9990 220 212 Yes >0.99 90 227 212 Yes >0.9995 225 212 Yes >0.99 95 232 212 Yes >0.99
5
5 187 223 No <0.01 5 192 223 No <0.0110 193 223 No <0.01 10 198 223 No <0.0115 196 223 No 0.01 15 201 223 No <0.0120 199 223 No 0.02 20 204 223 No <0.0125 202 223 No 0.05 25 207 223 No 0.0130 204 223 No 0.09 30 209 223 No 0.0235 206 223 No 0.15 35 211 223 No 0.0540 208 223 No 0.23 40 213 223 No 0.1145 210 223 No 0.33 45 215 223 No 0.2050 211 223 No 0.38 50 217 223 No 0.3455 213 223 Yes 0.50 55 219 223 Yes 0.5060 215 223 Yes 0.62 60 221 223 Yes 0.6665 217 223 Yes 0.72 65 223 223 Yes 0.8070 219 223 Yes 0.81 70 225 223 Yes 0.8975 221 223 Yes 0.88 75 228 223 Yes 0.9780 224 223 Yes 0.95 80 230 223 Yes 0.9985 227 223 Yes 0.98 85 233 223 Yes >0.9990 230 223 Yes 0.99 90 237 223 Yes >0.9995 236 223 Yes >0.99 95 242 223 Yes >0.99

Page20of26
TABLE8.(CONTINUED)
GradeStart%ile
RITFall
ProjectedProficiency Start%ile
RITWinter
ProjectedProficiencyCut-Score Level3 Prob. Cut-Score Level3 Prob.
6
5 192 224 No <0.01 5 196 224 No <0.0110 198 224 No <0.01 10 202 224 No <0.0115 202 224 No 0.02 15 205 224 No <0.0120 205 224 No 0.05 20 209 224 No 0.0125 207 224 No 0.09 25 211 224 No 0.0230 209 224 No 0.15 30 214 224 No 0.0735 212 224 No 0.28 35 216 224 No 0.1540 214 224 No 0.38 40 218 224 No 0.2745 216 224 Yes 0.50 45 220 224 No 0.4250 218 224 Yes 0.62 50 222 224 Yes 0.5855 220 224 Yes 0.72 55 224 224 Yes 0.7360 222 224 Yes 0.81 60 226 224 Yes 0.8565 224 224 Yes 0.88 65 228 224 Yes 0.9370 226 224 Yes 0.93 70 230 224 Yes 0.9775 228 224 Yes 0.96 75 233 224 Yes 0.9980 231 224 Yes 0.99 80 236 224 Yes >0.9985 234 224 Yes 0.99 85 239 224 Yes >0.9990 238 224 Yes >0.99 90 243 224 Yes >0.9995 243 224 Yes >0.99 95 248 224 Yes >0.99
7
5 195 226 No <0.01 5 198 226 No <0.0110 201 226 No <0.01 10 204 226 No <0.0115 205 226 No 0.01 15 208 226 No <0.0120 209 226 No 0.05 20 212 226 No 0.0125 211 226 No 0.08 25 215 226 No 0.0330 214 226 No 0.18 30 217 226 No 0.0735 216 226 No 0.27 35 220 226 No 0.2040 218 226 No 0.38 40 222 226 No 0.3445 221 226 Yes 0.56 45 224 226 Yes 0.5050 223 226 Yes 0.68 50 226 226 Yes 0.6655 225 226 Yes 0.78 55 228 226 Yes 0.8060 227 226 Yes 0.86 60 230 226 Yes 0.9065 229 226 Yes 0.92 65 233 226 Yes 0.9770 231 226 Yes 0.95 70 235 226 Yes 0.9975 234 226 Yes 0.98 75 238 226 Yes >0.9980 237 226 Yes >0.99 80 240 226 Yes >0.9985 240 226 Yes >0.99 85 244 226 Yes >0.9990 244 226 Yes >0.99 90 248 226 Yes >0.9995 250 226 Yes >0.99 95 254 226 Yes >0.99

Page21of26
TABLE8.(CONTINUED)
GradeStart%ile
RITFall
ProjectedProficiency Start%ile
RITWinter
ProjectedProficiencyCut-Score Level3 Prob. Cut-Score Level3 Prob.
8
5 197 227 No <0.01 5 199 227 No <0.0110 203 227 No 0.01 10 206 227 No <0.0115 208 227 No 0.03 15 210 227 No <0.0120 211 227 No 0.08 20 214 227 No 0.0125 214 227 No 0.15 25 217 227 No 0.0630 217 227 No 0.26 30 220 227 No 0.1635 219 227 No 0.35 35 222 227 No 0.2840 222 227 Yes 0.50 40 225 227 Yes 0.545 224 227 Yes 0.60 45 227 227 Yes 0.6550 226 227 Yes 0.70 50 229 227 Yes 0.7955 229 227 Yes 0.82 55 231 227 Yes 0.8860 231 227 Yes 0.88 60 234 227 Yes 0.9665 233 227 Yes 0.92 65 236 227 Yes 0.9970 236 227 Yes 0.96 70 239 227 Yes >0.9975 238 227 Yes 0.98 75 241 227 Yes >0.9980 241 227 Yes 0.99 80 245 227 Yes >0.9985 245 227 Yes >0.99 85 248 227 Yes >0.9990 249 227 Yes >0.99 90 253 227 Yes >0.9995 256 227 Yes >0.99 95 259 227 Yes >0.99
Note.%ile=percentile

Page22of26
SummaryandDiscussion
ThisstudyproducedasetofcutscoresonMAPreadingandmathtestsforGrades2to8thatcorrespondtoeachFSAperformancelevel.ByusingmatchedscoredatafromasampleofstudentsfromFlorida,thestudydemonstratesthatMAPscorescanaccuratelypredictwhetherastudentcouldbeproficientoraboveonthebasisofhis/herMAPscores.Thisstudyalsousedthe 2015NWEAnorming study results to project a student’s probability tomeet proficiencybasedonthatstudent’spriorMAPscores in fallandwinter.TheseresultswillhelpeducatorspredictstudentperformanceinFSAtestsasearlyaspossibleandidentifythosestudentswhoareatriskoffailingtomeetrequiredstandardssothattheycanreceivenecessaryresourcesandassistancetomeettheirgoals.
Whileconcordancetablescanbehelpfulandinformative,theyhavegenerallimitations.First,theconcordancetablesprovideinformationaboutscorecomparabilityondifferenttests,butthescorescannotbeassumedtobeinterchangeable.InthecaseforFSAandMAPtests,astheyarenotparallelincontent,scoresfromthesetwotestsshouldnotbedirectlycompared.Second,while the sample data used in this studywere collected from 84 schools in Florida,cautionsshouldbeexercisedwhengeneralizingtheresultstotesttakerswhodiffersignificantlyfromthissample.Finally,cautionsshouldalsobeexercisediftheconcordedscoresareusedforasubpopulation.NWEAwillcontinuetogatherinformationaboutFSAperformancefromotherschoolsinFloridatoenhancethequalityandgeneralizabilityofthestudy.

Page23of26
References
Hanson,B.A.,Harris,D.J.,Pommerich,M.,Sconing,J.A.,&Yi,Q.(2001).Suggestionsfortheevaluationanduseofconcordanceresults.(ACTResearchReportNo.2001-1).IowaCity,IA:ACT,Inc.
Kolen,M.J.,&Brennan,R.L.(2004).Testequating,scaling,andlinking.NewYork:Springer.
Pommerich,M.,Hanson,B.,Harris,D.,&Sconing,J.(2004).Issuesinconductinglinkagebetweendistincttests.AppliedPsychologicalMeasurement,28(4),247-273.
ThumY.M.,&Hauser,C.H.(2015).NWEA2015MAPNormsforStudentandSchoolAchievementStatusandGrowth.NWEAResearchReport.Portland,OR:NWEA.
Page24of26
Appendix
DataandAnalysis
Data
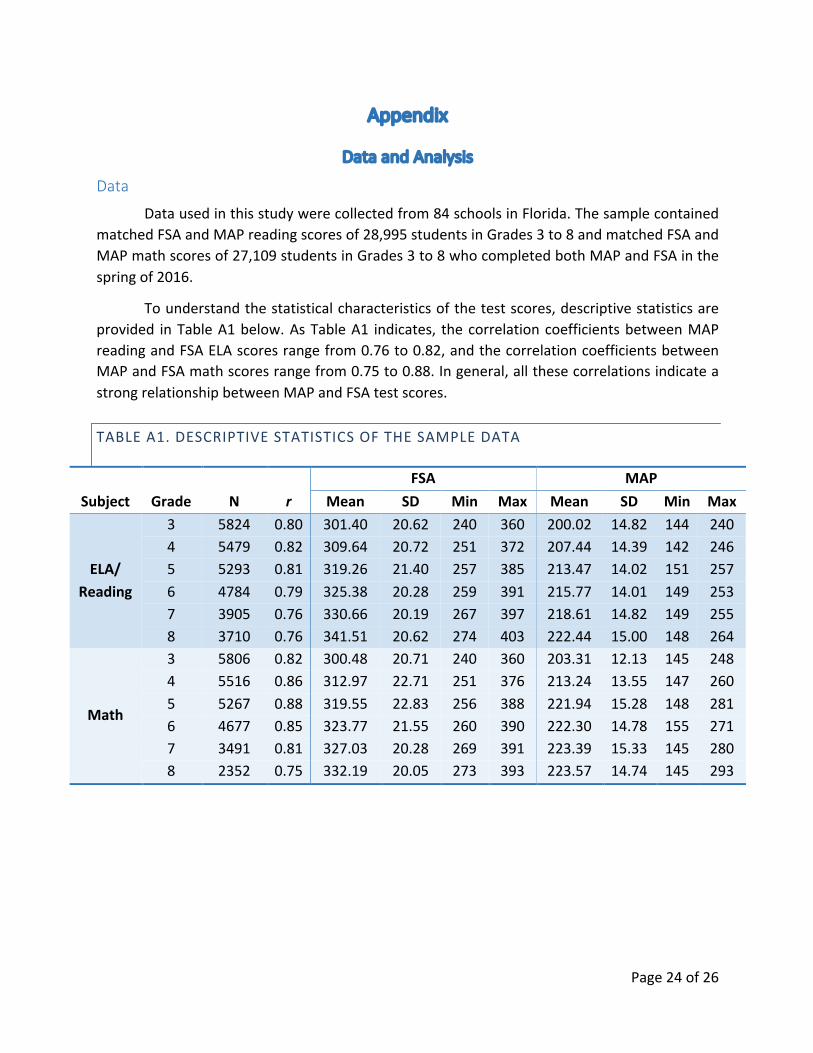
Datausedinthisstudywerecollectedfrom84schoolsinFlorida.ThesamplecontainedmatchedFSAandMAPreadingscoresof28,995studentsinGrades3to8andmatchedFSAandMAPmathscoresof27,109studentsinGrades3to8whocompletedbothMAPandFSAinthespringof2016.
Tounderstandthestatisticalcharacteristicsofthetestscores,descriptivestatisticsareprovided inTableA1below.AsTableA1 indicates, thecorrelationcoefficientsbetweenMAPreadingandFSAELAscoresrangefrom0.76to0.82,andthecorrelationcoefficientsbetweenMAPandFSAmathscoresrangefrom0.75to0.88.Ingeneral,allthesecorrelationsindicateastrongrelationshipbetweenMAPandFSAtestscores.
TABLEA1.DESCRIPTIVESTATISTICSOFTHESAMPLEDATA
FSA MAPSubject Grade N r Mean SD Min Max Mean SD Min Max
ELA/Reading
3 5824 0.80 301.40 20.62 240 360 200.02 14.82 144 2404 5479 0.82 309.64 20.72 251 372 207.44 14.39 142 2465 5293 0.81 319.26 21.40 257 385 213.47 14.02 151 2576 4784 0.79 325.38 20.28 259 391 215.77 14.01 149 2537 3905 0.76 330.66 20.19 267 397 218.61 14.82 149 2558 3710 0.76 341.51 20.62 274 403 222.44 15.00 148 264
Math
3 5806 0.82 300.48 20.71 240 360 203.31 12.13 145 2484 5516 0.86 312.97 22.71 251 376 213.24 13.55 147 2605 5267 0.88 319.55 22.83 256 388 221.94 15.28 148 2816 4677 0.85 323.77 21.55 260 390 222.30 14.78 155 2717 3491 0.81 327.03 20.28 269 391 223.39 15.33 145 2808 2352 0.75 332.19 20.05 273 393 223.57 14.74 145 293

Page25of26
EquipercentileLinkingProcedure
Theequipercentileprocedure (e.g.,Kolen&Brennan,2004)wasused toestablish theconcordancerelationshipbetweenFSAandMAPscoresforgrades3to8inELA/readingandmath.Thisprocedurematchesscoresonthetwoscalesthathavethesamepercentilerank(i.e.,theproportionofscoresatorbeloweachscore).
Supposeweneedtoestablishtheconcordedscoresbetweentwotests.𝑥isascoreonTest𝑋 (e.g., FSA). Its equipercentile equivalent score on Test𝑌 (e.g., MAP), 𝑒& 𝑥 ,can beobtainedthroughacumulative-distribution-basedlinkingfunctiondefinedinEquation(A1):
𝑒& 𝑥 = 𝐺*+[𝑃 𝑥 ] (A1)
where𝑒& 𝑥 istheequipercentileequivalentofscoresonFSAonthescaleofMAP,𝑃 𝑥 isthepercentilerankofagivenscoreonTest𝑋.𝐺*+istheinverseofthepercentilerankfunctionforscores on Test𝑌 which indicates the scores on Test𝑌 corresponding to a given percentile.Polynomial loglinear pre-smoothing was applied to reduce irregularities of the frequencydistributionsaswellasequipercentilelinkingcurve.
ConsistencyrateofClassification
Consistencyrateofclassificationaccuracy,expressedintheformofaratebetween0and1,measures the extent towhichMAP scores (and theestimatedMAP cut scores) accuratelypredictedwhetherstudentsinthesamplewouldpass(i.e.,Level3orhigher)onFSAtests.
Tocalculateconsistencyrateofclassification,samplestudentsweredesignated“BelowFSAcut”or“AtoraboveFSAcut”basedon theiractualFSAscores.Similarly, theywerealsodesignatedas“BelowMAPcut”or“AtoraboveMAPcut”basedontheiractualMAPscores.A2-waycontingencytablewasthentabulated(seeTableA2),classifyingstudentsas“Satisfactory”on the basis of FSA cut score and concordantMAP cut score. Students classified in the truepositive(TP)categorywerethosepredictedtobePassbasedontheMAPcutscoresandwerealsoclassifiedasPassbasedontheFSAcutscores.Studentsclassifiedinthetruenegative(TN)category were those predicted to be Not Pass based on theMAP cut scores and were alsoclassifiedasNotPassbasedontheFSAcutscores.Studentsclassifiedinthefalsepositive(FP)categorywerethosepredictedtobePassbasedontheMAPcutscoresbutwereclassifiedasNotPassbasedontheFSAcutscores.Studentsclassifiedinthefalsenegative (FN)categorywerethosepredicatedtobeNotPassbasedontheMAPcutscoresbutwereclassifiedasPassbasedon the FSA cut scores. The overall consistency rate of classification was computed as theproportionofcorrectclassificationsamongtheentiresampleby(TP+TN)/(TP+TN+FP+FN).

Page26of26
TABLEA2.DEFINITIONOFCONSISTENCYRATEFORFSATOMAPCONCORDANCE
FSAScore
BelowFSAcut AtorAboveFSAcut
MAPScoreBelowMAPcut TrueNegaqve FalsePosiqve
AtorAboveMAPcut FalseNegaqve TruePosiqveNote.Shadedcellsaresummedtocomputetheconsistencyrate.
ProficiencyProjection
MAP conditional growth norms provide student’s expected gain scores across testingseasons(Thum&Hauser,2015).Thisinformationisutilizedtopredictastudent’sperformanceon the FSA based on that student’s MAP scores in prior seasons (e.g. fall and winter). TheprobabilityofastudentachievingLevel3(Pass)onFSA,basedonhis/herfallorwinterMAPscoreisgiveninEquation(A2):
𝑃𝑟 𝐴𝑐ℎ𝑖𝑒𝑣𝑒𝑖𝑛𝑔𝐿𝑒𝑣𝑒𝑙3𝑖𝑛𝑠𝑝𝑟𝑖𝑛𝑔 𝑎𝑅𝐼𝑇𝑠𝑐𝑜𝑟𝑒𝑜𝑓𝑥) = 1 − Φ 𝑥 + 𝑔 − 𝑐
𝑆𝐷 (𝐴2)
where,Φisastandardizednormalcumulativedistribution,𝑥isthestudent’sRITscoreinfallorwinter,𝑔istheexpectedgrowthfromfallorwintertospringcorrespondingto𝑥,𝑐istheMAPcut-scoreforspring,and𝑆𝐷istheconditionalstandarddeviationofgrowthfromfallorwintertospring.
FortheprobabilityofastudentachievingLevel3ontheFSAtests,basedonhis/herspringscore𝑠,itcanbecalculatedbyEquation(A3):
𝑃𝑟 𝐴𝑐ℎ𝑖𝑒𝑣𝑒𝑖𝑛𝑔𝐿𝑒𝑣𝑒𝑙3𝑖𝑛𝑠𝑝𝑟𝑖𝑛𝑔 𝑎𝑅𝐼𝑇𝑠𝑐𝑜𝑟𝑒𝑜𝑓𝑠𝑖𝑛𝑠𝑝𝑟𝑖𝑛𝑔) = 1 − Φ 𝑠 − 𝑐𝑆𝐸 (𝐴3)
whereSEisthestandarderrorofmeasurementforMAPreadingormathtest.
Foundedbyeducatorsnearly40yearsago,NorthwestEvaluationAssociation(NWEA)isaglobalnot-for-profiteducationalservicesorganizationknownforourflagshipinterimassessment,MeasuresofAcademicProgress(MAP).Morethan7,800partnersinU.S.schools,schooldistricts,educationagencies,andinternationalschoolstrustustoofferpre-kindergartenthroughgrade12assessmentsthataccuratelymeasurestudentgrowthandlearningneeds,professionaldevelopmentthatfosterseducators’abilitytoacceleratestudentlearning,andresearchthatsupportsassessmentvalidityanddatainterpretation.Tobetterinforminstructionandmaximizeeverylearner’sacademicgrowth,educatorscurrentlyuseNWEAassessmentswithnearlyeightmillionstudents.
©NorthwestEvaluationAssociation2016.MeasuresofAcademicProgress,MAP,andPartneringtohelpallkidslearnareregisteredtrademarksofNorthwestEvaluationAssociationintheU.S.andinothercountries.NorthwestEvaluationAssociationandNWEAaretrademarksofNorthwestEvaluationAssociationintheU.S.andinothercountries.Thenamesofothercompaniesandtheirproductsmentionedarethetrademarksoftheirrespectiveowners.