linking the higher order scales of the mmpi-2-rf to … · iii linking the higher order scales of...
TRANSCRIPT
LINKING THE HIGHER ORDER SCALES OF THE MMPI-2-RF to SECOND ORDER SCALES OF THE MCMI-III AXIS I SCALES: A STUDY OF CONCURRENT AND
CONSTRUCT VALIDITY
A Dissertation by
Blake K. Webster
Master of Science, Pittsburg State University, 2007
Bachelor of Science, Missouri Southern State University, 1998
Submitted to the Department of Psychology and the faculty of the Graduate School of
Wichita State University in partial fulfillment of
the requirements for the degree of Doctor of Philosophy
July 2013

Copyright 2013 by Blake K. Webster
All Rights Reserved
iii
LINKING THE HIGHER ORDER SCALES OF THE MMPI-2-RF TO SECOND ORDER SCALES OF THE MCMI-III AXIS I SCALES: A STUDY OF CONCURRENT
AND CONSTRUCT VALIDITY
The following faculty members have examined the final copy of this dissertation for form and content, and recommend that it be accepted in partial fulfillment of the requirement for the degree of Doctor of Philosophy with a major in Psychology.
_____________________________ Darwin Dorr, Committee Chair _____________________________ Paul Ackerman, Committee Member _____________________________ Don Morgan, Committee Member _____________________________ Nancy McKellar, Committee Member _____________________________ Louis Medvene, Committee Member _____________________________ Charles Burdsal, Committee Member Accepted for the College of Liberal Arts and Sciences
___________________________________________ Ron Matson, Interim Dean Accepted for the Graduate School ____________________________________________ Abu S.M. Masud, Interim Dean

iv
DEDICATION
To my parents, my wife, my brother, and my son

v
ACKNOWLEDGMENTS
I would like to thank my advisor, Dr. Dorr for his unending patience and kind heart. His
interest and enthusiasm for this project, along with his academic acumen and editorial oversight,
made this project a reality. I am eternally grateful for all that he has done for me and taught me.
He has been the heart of my time at WSU and he is a tremendous asset to anything he touches.
I would also like to thank Dr. Don Morgan and Dr. Charles Burdsal for their continued
interest in this project. They have given me so much in time, attention, and sage advice. Thank
you for constantly going out of your way for me.
I would also like to acknowledge the entire psychology faculty at Wichita State
University for their support, guidance, and mentoring over the past several years. I would
especially like to thank my committee for their willingness to serve on this dissertation. Their
editorial comments proved tremendously instructive and astute.
vi
ABSTRACT
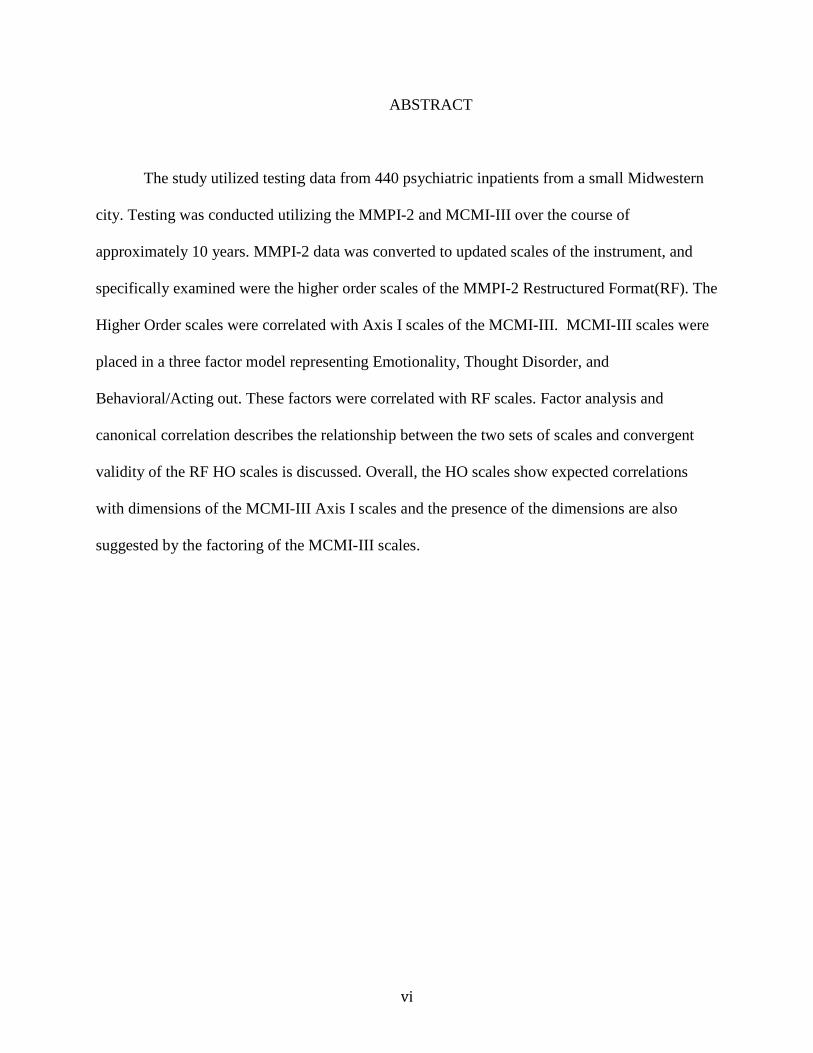
The study utilized testing data from 440 psychiatric inpatients from a small Midwestern
city. Testing was conducted utilizing the MMPI-2 and MCMI-III over the course of
approximately 10 years. MMPI-2 data was converted to updated scales of the instrument, and
specifically examined were the higher order scales of the MMPI-2 Restructured Format(RF). The
Higher Order scales were correlated with Axis I scales of the MCMI-III. MCMI-III scales were
placed in a three factor model representing Emotionality, Thought Disorder, and
Behavioral/Acting out. These factors were correlated with RF scales. Factor analysis and
canonical correlation describes the relationship between the two sets of scales and convergent
validity of the RF HO scales is discussed. Overall, the HO scales show expected correlations
with dimensions of the MCMI-III Axis I scales and the presence of the dimensions are also
suggested by the factoring of the MCMI-III scales.
vii
TABLE OF CONTENTS
Chapter Page I. INTRODUCTION 1 A brief history of the MMPI-2 4
Refining the instrument 6 The ongoing problem of high scale intercorrelation 7 Descriptions of further problems 9
Introducing the MMPI-2 10 The beginning of the revolution: Assessing the first factor 11
On with the revolution: Restructuring the Clinical Scales 14 The Four step process of removing demoralization from the clinical scales 16
The RF project 21 The history of higher order dimensions: the need for HO scales 21 Higher order dimension on the MMPI-2-RF 26 The specifics of the RF HO scales 27 Emotional/Internalizing Dysfunction (EID) 30 Thought Dysfunction (THD) 31 Behavioral/Externalizing Dysfunction (BXD) 31 The need for convergent validity 32 MCMI-III 33 A word about factor analysis 36 Factor analysis and the MCMI-III 37
II. PURPOSE OF STUDY 39 III. METHODOLOGY 40 Setting 40 Measures 40 Procedure 42 Statistical Analysis 43 IV. RESULTS 45 Canonical Correlation 49 V. DISCUSSION 51 Limitations 54 Future directions 55 REFERENCES 57 APPENDIX 66
viii
LIST OF TABLES
Tables Page
1. Clinical Scales and their Restructured Scale Equivalents 18
2. RC and Clinical Scale Correlations: Outpatient Sample 19
2.1. RC and Clinical Scale Correlations: Inpatient Sample 20
3. RF Higher Order Scale Correlations with RC Derivatives 27
4. Pattern Matrix for MCMI-III: Axis I Scales Three Factor Rotation 46
4.1. Factor Correlation Matrix 46
5. Internal Consistency Alphas for RF HO Scales: Current Sample and 47 Norm Sample 6. MCMI-III Factor Score Intercorrelations 48
7. Correlations of RF HO Scales with MCMI-III Factor Scores 48
8. MCMI-III Factor Scores: Correlations with MCMI Axis I Scales 48
9. RF HO Correlations with MCMI-III Axis I Scales 49
10. Canonical Solution for MMPI RF HO Scales and MCMI-III Axis I Scales 49
10.1. Statistical Significance of Each Canonical Function 50
Figures
1. Eysenck’s Hierarchical Model 2
2. Watson and Tellegen’s 1985 Model of Emotional Polarity 16
1
CHAPTER 1
INTRODUCTION
This study examined the relationship of the new Higher Order Scales (HO) of the
Minnesota Multiphasic Personality Inventory-2 Restructured Format (MMPI-2 RF; Ben-Porath
& Tellegen, 2008) to higher order dimensions derived for the Axis I Scales of the Millon Clinical
Multiaxial Inventory-3rd Edition. The MMPI-2 RF is the most recent update of the MMPI-2, a
gold standard for over 70 years in the field of personality assessment.
In restructuring the MMPI-2-RF (RF) the authors made several major changes to the
instrument. One major change was that the original 567 item pool was reduced to 338 to make it
shorter and more manageable. Second, the RF has over 29 new scales and a large number of
older scales were eliminated entirely. Third, the new Restructured Scales (please see below)
completely replace the original Clinical Scales (Basic Nine). Finally, the RF has been entirely
reorganized to the end of making its profiles more logical and orderly. Part of the reorganization
involved a new hierarchical format with the introduction of three levels of scale breadth. In
short, the authors of the RF sought to address longstanding limitations and criticism of the
original instrument.
Hierarchical models in personality assessment predate the birth of the MMPI by over a
half-century. The origins of hierarchical models began with researchers examining the
associations between thousands of adjectives of personality. The “hierarchy” began to develop
when descriptors were made to group clusters of adjectives. This rich history is covered in a
later section of this paper but it is worth noting here that the introduction of a hierarchical
organization to the MMPI-2 RF is a novel interpretive shift, which effectively changes how the
instrument is approached and utilized. According to Goldberg (1993),“Any complete taxonomy

2
of personality traits must include both the vertical and horizontal features of their meaning. The
vertical aspect refers to the hierarchical relations among traits (e.g., reliability is a more abstract
and general concept than punctuality)” (p. 170). Goldberg also wrote, “For example, both
Eysenck (1970) and Cattell (1947) have developed explicitly hierarchical representations”…
More recently Costa and McRae (1995) began to adopt interpretive strategies of personality,
which were structured in a hierarchical framework. This hierarchical framework, according to
Goldberg (1993), organizes descriptors from either a top down or bottom up approach: Top
down indicated by large, broad descriptors of personality supported by more specific adjectives,
such as the concept of extraversion supported by descriptors of “social” or more specifically,
“enjoys parties”. A bottom up approach would be looking first at the more specific indicators
and predicting personality based on more sensitive, targeted adjectives. Figure 1 illustrates the
concept of traditional hierarchical models within the context of Eysenck’s model of personality
(Eysenck, 1970).
Figure 1: Eysenck’s Hierarchical Model
Traditionally, the MMPI categorized personality and pathology in a rather specific way.
The clinical scales, and the subsequent subscales, are largely intended to report symptoms and
3
pathology (i.e., psychological difficulty) a person may be experiencing. The RF has attempted to
enhance this tradition with the addition of broadband measures and effectively “restructure” the
various levels of interpretation on the MMPI.
The RF introduces three levels of scales: a) Higher Order Scales HO, which focus on
broad dimensions of psychopathology, b) nine intermediate level scales (the nine new RC scales)
and c) 18 lower order or facet scales. This organization of the new MMPI reflects the
psychometric constructs of bandwidth and fidelity, terms borrowed from communication theory
of years ago (Cronbach & Gleser, 1965; Shannon &Weaver, 1949). Bandwidth refers to the
amount of information that is conveyed in a message. Fidelity refers to the accuracy of
information, or the fine-tuning of information being conveyed. This organizational format allows
us to assess persons on three levels of breadth from very broad to very specific. The HO scales
provide information on internalization, externalizing, and thought disorder. The inclusion of the
HO scales in the MMPI-2 RF was an attempt by the test developers to introduce an organizing
scheme based around large broad band measures as a first line of interpretation and then guiding
examiners to interpret more “specific scales”. The RF Manual indicates that these new HO
scales should be examined first when interpreting the new RF profiles. The Manual states that
once the HO scales have been reviewed, examiners are to move on to the intermediate level RC
Scales, then on to the newly arranged Specific Problem and Interest Scales, and round out the
interpretation with a consideration of the Personality Psychopathology Five (PSY-5) Scales.
Essentially, MMPI-2 RF analysis begins with the guidance of the HO scales and their role cannot
be overstated (Ben-Porath & Tellegen, 2008).
Because several of the MMPI-2 RF scales are new, it is important to conduct a series of
concurrent validity studies to examine their psychometric properties to establish initial empirical

4
correlates of all the new scales. The main purpose of this study was to assess the HO scales.
Specifically, the HO scales are examined in relation to higher order scales derived for the Millon
Clinical Multiaxial Inventory-Third Edition, also a gold standard in the field of personality
assessment. Through correlational matrices, factor analytic work, and canonical correlation, a
better understanding of these broadband measures will be gained for this new version of an
industry standard.
The publication of the MMPI-2-RF is a momentous event in the history of the evolution
of the MMPI. The magnitude of this event can be best appreciated in the context of its long and
rich history. Hence, a brief history of the MMPI will now be traced from its beginning in the
early 1940s to its latest evolution published in 2008.
A Brief History of the MMPI-2
The Birth and Growth of an Idea
Hathaway and McKinley (1943), both faculty members at the University of Minnesota
Medical School, developed their instrument in a hospital setting. They began working on the
inventory in the 1930s and hoped to develop an empirically based self-report instrument that
would provide an efficient and reliable means of arriving at accurate diagnoses. It was also
hoped that the instrument would help identify cases in which physical symptoms are likely to
have an emotional basis.
Hathaway and McKinley began their search for test items by reviewing a wide variety of
personality related statements gleaned from psychological and psychiatric case histories, and
reports, textbooks, and earlier published scales of personality and social views. They began with
a pool of about 1000 items. They constructed the scales of their inventory by the method of
contrasted groups. The patients known to exhibit various psychiatric categories (using the
5
Kraepelinian paradigm of the day) constituted the psychiatric criterion group (about 225 people)
and relatives and other hospital visitors (about 725 people) constituted the normal criterion
group.
The original patient subgroups were hypochondriasis, depression, hysteria, psychopathic
deviate, paranoia, psychasthenia, schizophrenia, and hypomania. In an effort to make their
inventory as empirically based as possible, Hathaway and McKinley employed a technique that
was novel and innovative for the time known as criterion keying.
The method of criterion keying places no emphasis on the content of a test item. Rather,
items are chosen only if they discriminate between persons in the various patient groups and
non-patients. Therefore items that tend to be endorsed by persons in the depression criterion
group and not endorsed by members of the normal criterion group are considered to be measures
of depression. Those items that discriminated depressed patients from normals then were
aggregated into a depression scale; those that discriminated between paranoid patients from
normals were then aggregated into a paranoid scale and so on. It cannot be emphasized how
innovative this procedure was at the time. For the first time an item was not chosen “rationally”
by a presumed expert because of its content. It was only chosen if it could be demonstrated
empirically that the item discriminated between members of contrasted groups. The authors of
the original MMPI noted, “they (the items) are not selected for their content or theoretical
import…it is accepted if it appears to differentiate” (p. 31-32). This procedure represented an
enormous breakthrough in the quest to construct psychological inventories that had a clear
empirical basis.
The number of items in the resulting inventory was reduced to about half the original
size. Then the authors created scales assessing test-taking approach also known as validity

6
scales. Scales were developed to measure the tendency to over report and under report emotional
problems. Some of these data were used to “correct” for underreporting. The validity scales
were a great help to clinicians struggling to determine if the profile (group of scales) was
technically valid thus providing a basis of confidence or no confidence in the reliability and
validity of the inventory. The original MMPI profile consisted of four validity scales and nine
Clinical Scales known by their nickname, the “basic nine.”
The innovations just described represented a major advance in assessment science and the
MMPI became one of the most used tests in the history of psychological testing (Graham,
2012). The remarkable research in clinical use of the instrument stimulated an enormous
research base of over 10,000 empirical articles on various aspects of the instrument. The research
base supported the development of myriad new scales being added to the MMPI, some lasting
decades because of strong research support and others disappeared for lack of empirical
grounding.
Refining the Instrument
From its very beginning the MMPI enjoyed widespread acceptance, clinical acclaim, and
empirical support. The MMPI was used in medical and psychiatric clinics and its use in those
settings continues (e.g., Butcher, 2006). It was also widely used outside of medical and mental
health settings for personnel screening for sensitive jobs like airline pilots, police, or nuclear
power plant operators (Butcher, Ones, & Cullen, 2006). There is significant use of the MMPI-2
in forensic settings (e.g., Pope, Butcher, & Seelen, 2006), including correctional (e.g., Megargee,
2006; Sneyers, Sloore, Rossi, & Derksen, 2007), family custody (e.g., Ezzo, Pinsoneault, &
Evans, 2007), and personal injury evaluations (e.g., Butcher & Miller, 2006; Livingston,
Jennings, Colotla, Reynolds, & Shercliffe, 2006).
7
In a way it was, to some extent, a victim of its own success; the personality assessment
field was slow to welcome change to the instrument. However, during its first decade of clinical
use it became apparent that the instrument was not up to accomplishing its original purpose
which was the accurate diagnosis of new (unknown) patients (Graham, 2012). It was found that,
for example, patients with known depression indeed, usually had elevations on the depression
scale. However, they also often obtained high scores on other scales as well. Further, normal
persons sometimes obtained elevated scores on Clinical Scales.
The Ongoing Problem of High Scale Intercorrelation
Any description of problems with the original instrument usually begins with the
descriptions of high scale intercorrelation of the clinical scales. This problem in particular
explains or is related to many of the shortcomings of the original inventory.
Although empirical keying was a psychometric innovation at the time, it led to a number
of unintended consequences regarding scale intercorrelation. First, because Hathaway and
McKinley used an item if it discriminated groups of normals from groups of patients with
particular diagnoses, many items of the original set ended up on more than one scale. For
example, items assessing fatigue appear on both the psychasthenia and Schizophrenia Clinical
Scales. This poses an obvious problem of discriminant validity, which reflects the ability of a
scale to differentiate between existing pathologies. Adhering to the principle of empirical
keying, Hathaway and McKinley would simply use an item for scale inclusion if a particular
psychiatric group endorsed it and the non-clinical group did not. Naturally, with inpatients
determining the scales, there was overlap among the differing diagnoses; meaning schizophrenic
patients may have had similar symptoms of depression or body fatigue as depressed or manic

8
patients. In other words, scale intercorrelation makes it difficult to determine which property of a
scale is actually elevating the score.
Additionally, high scale intercorrelation continued as a problem throughout subscales
development and revisions of the instrument. Because of this statistical redundancy, Greene
(2012) indicated it was difficult to essentially know where to start with the instrument. For
example, the author points out that scales with different names have very similar correlational
loadings. An examination of the MMPI-2 norming groups shows Scale 7 (Psychasthenia), [PT]),
Welsh Anxiety (A), College Maladjustment (Mt), Post Traumatic Stress Disorder-Keane (PK),
and Restructured Clinical Demoralization (RcD) scales all measure general subjective distress
and negative affect with intercorrelations greater than .90. The intercorrelations obviously were a
result of the empirical keying process and the abundance of new scales measuring similar
concepts.
Contributing to interpretive problems caused by high scale intercorrelations was the way
the scales were originally named. The scales were named for the diagnostic group used in the
contrasted groups design. In retrospect this seems odd for authors who wanted a truly empirical
inventory. Hathaway confided that this was one of the biggest mistakes he ever made. He
learned quickly from clinical practice and the burgeoning research literature that the scales often
did not measure exactly what the name of the scale purported to measure. For example, the
Schizophrenia Scale is not a very good measure of schizophrenia. However, the emerging
research noted above revealed that the scale measured something not unlike schizophrenia. The
research revealed that the scale called Schizophrenia does measure disturbances in thinking,
mood, and behavior. We may find misrepresentations of reality, delusions and hallucinations and
so on. Hathaway decided that the best way to eliminate the problem of excess meaning would be
9
to disregard the scale names and replace them with a scale number, e.g. Schizophrenia was
simply known as the “8” scale. We know, based on extensive research, what scale 8 measures
and it is not exactly schizophrenia. Hence, all the basic nine Clinical Scales are now referred to
by their number.
Additionally, early efforts to ameliorate the problem of low discriminant validity, in
addition to changing scale names, were aided by examinations of profile patterns of the clinical
scales. Ongoing research revealed that various profiles (patterns of scale elevations relative to
other scale scores) do indeed describe patterns of personality traits and psychopathology.
Descriptions of Further Problems
Another major historical problem with the MMPI is that the original norm groups
(normal and patients) were very inadequate in terms of numbers and stratification. Hence, the
norms, the backbone of this kind of instrument, were a poor representation of both the clinical
and non-clinical population.
Another emergent problem is that although some items were found to discriminate
depressed patients from normals, and hysterical patients from normals and so on, the question
remained, how well did the MMPI distinguish between depressed and hysterical patients? The
fact is that it did not do a particularly good job of this. The reason is that Hathaway and
McKinley overlooked one thing that should have been obvious. The non-normals were all
psychiatric inpatients! It can be easily inferred that a common thread could be shared by the life
experiences of most or all of the basic nine psychiatric patients; some sort of common distress, a
morale problem, and/or common emotional distress, etc.
Interestingly, very early factor analytic studies revealed that all of the basic nine Clinical
Scales loaded on a common major factor often called the “first factor” which has been related to
10
a subjective blueness, anxiety, and/or psychological malaise which is briefly discussed later.
Interestingly, all the scales were saturated with this factor.
Despite the problems outlined above, the MMPI continued to enjoy widespread and
successful use for decades.
Introducing the MMPI-2
Hathaway, himself, often expressed concern about some of the limitations of the MMPI
and lamented the lack of progress in refining it. In a foreword to Dahlstrom (1972) he wrote:
If another twelve years were to go by without having gone on to a better instrument or better procedure for the practical needs, I fear that the MMPI, like some other tests, might have changed from a hopeful innovation to an aged obstacle. Do not misunderstand me. I am not agreeing with a few critics who have already called for the funeral and written the epitaph. They have not yet identified what is better. We cannot lay down even a Stone Age ax if we have no better one to hew with (p. xiv).
In the early 1970s discussions began regarding the possible mechanics of revising the
MMPI. Some of the issues involved rules and laws governing the publishing arrangements of
the MMPI. By the early 1980s sufficient technical and legal changes had been made in this
venue to make revision of the MMPI feasible. It is essential to emphasize that the focus of the
1980’s revision was re-standardization. A norm referenced assessment instrument is only as
good as its norms. A norm base that is small, poorly stratified and represented, and dated cannot
satisfy the highest psychometric requirements (Anstasi & Urbina, 1997). Hathaway and
McKinley resources were initially very meager and they were forced to settle with what they had
for norms.
The revision of the MMPI consisted of two parts. First, enormous resources were made
available to undertake an extensive renorming project. There would be no more complaints about
being compared to Minnesota farmers when taking the MMPI. Secondly, many of the original
items were dated, sexist, and awkward and in great need of revision. For example, the much
11
maligned item “I have black tarre bowel movements.” was banished forevermore. However,
the format of the MMPI-2 was fairly close to the original consisting of the basic nine Clinical
Scales as well as myriad auxiliary scales.
At this point it must be emphasized that the publishers of the MMPI-2 made a deliberate
decision to leave the basic structure of the inventory mostly as is. The problems of the poor
discriminant validity of the basic nine Clinical Scales were not addressed. The challenges posed
by the so-called first factor were not addressed. The reasons that the MMPI-2 was not more
thoroughly revised was that the publishers feared that practicing clinicians, who were the major
consumers of the instrument, would find the new inventory unacceptable. Once clinicians
become very familiar with a useful tool they are reluctant to abandon it for a new edition. A
second, and more scientifically sound reason for limiting the degree of inventory revision, is that
the MMPI enjoyed a remarkable empirical base that contributed immeasurably to its prestige and
acceptance. A major revision of the scales would distance them from their research base.
However, the technical weakness of the original scales would not go away and there was a
pressing scientific need to address these issues if a technically superior instrument were to be
created. This was Hathaway’s dream.
The beginning of the revolution: Assessing the first factor
The authors of the MMPI-2 did not address the problem of low discriminant validity. One
cannot hope to approximate construct validity if one cannot demonstrate discriminant validity.
Item overlap contributed to poor discriminant validity. This was a technical problem that should
not be too difficult to solve. However a greater issue is the first factor problem, which was
directly relevant to construct validity. The presence of these problems raised two crucial
12
questions: a)“Are the scales measuring the same construct?” and b) “What are the differences
between the groups or scales?”
The first step in addressing the problem was to flesh out the first factor and determine
whether it was a construct that could be helpful in understanding psychopathology. Theorists
had described the first factor in various ways. Cottle (1950) viewed the first factor as a
generalized psychoticism that individuals with psychopathology experience. Tyler (1951)
believed that the first factor was not a specific form of psychopathology but rather represented
the general maladjustment of an individual with psychopathology. Welsh (1956) described the
first factor as anxiety-laden and believed that individuals with psychopathology responded to
MMPI items in a defensive way. He reasoned that this defensiveness could possibly be
measured in a separate instrument. Millimet (1971) examined several instruments that were
created to measure this generalized anxiety (Wiggins, 1973), and gave these measures to patients
along with the MMPI. He believed that the clinician could interpret a patient’s MMPI in light of
the degree to which this anxiety influenced the response set. Welsh’s A (Anxiety) scale allowed
for measurement of a construct similar to the first factor on the MMPI, but it did not increase the
discriminant validity of the MMPI. Jackson and Messick (1961) believed the first factor to be an
artifact of the response set adopted by the test taker. But Block (1965) noted that the first factor
was useful clinically in understanding an individual’s personality and psychopathology and held
that the first factor reflected more than merely response bias.
This selective review reveals that several influential investigators took the presence of the
first factor seriously. At or about the time of the work developing the MMPI-2, several workers
led by Auke Tellegen and Yossef S. Ben-Porath greatly accelerated research on the first factor
and its relationship to the entire MMPI. Tellegen, Ben-Porath, McNulty, Arbisi, Graham, and
13
Kaemmer (2003) employed the greatly expanded MMPI-2 norm base to conduct a large
exploratory factor analysis at the item level and again found unambiguous evidence of a first
factor.
Tellegen et al. reviewed this finding and concluded that the first factor was a “broad
emotionally colored dimension” which they called “Demoralization” (p. 1) in honor of Jerome
Frank who coined the term (1974). This common dimension among all the Clinical Scales or
“clinical scale groups” makes many argue that the Clinical Scales are vulnerable to
oversensitivity or “floating profiles” (i.e., all scales elevate due to an individual’s depression and
not due to the properties of the construct the scale essentially wishes to describe). Tellegen et al.
proposed that Demoralization was a distinct construct that had clinical significance in the
assessment of psychopathology (see development of RC Scales). However, the composition of
the Clinical Scales did not allow the clinician to separate Demoralization from the constructs
that each Clinical Scale was intended to measure in the first place. Tellegen et al. therefore
chose to remove demoralization items, which loaded on the factor from the basic nine scales and
put it on its own scale. This procedure would bring enormous change to the basic nine scales
which would largely obviate 60 years of research on the “basic nine” Clinical Scales and the
empirical confidence of thousands of clinicians who used them. Hence, the authors of
Restructured Clinical scales concluded that total exclusion of the original Clinical Scales would
be impractical. So the idea of the “basic nine” was retained.
After the demoralization items were removed from the basic nine, they were restructured
by a rebuilding process. The intent was to reconstruct them to the end that they measure what
they were intended to measure while ridding them as much as possible of demoralization. The
product was a new basic nine including the Demoralization Scale (RCd) and eight of the original
14
basic nine (with MF removed). These new RC scales were added to the subsequent edition of the
MMPI-2 as an addition to the MMPI-2 interpretive profile.
On with the revolution: Restructuring the Clinical Scales
Tellegen et al. (2003) developed the Restructured Clinical scales, or RC Scales, for the
MMPI-2. The RC Scales have attempted to address the problems of high scale intercorrelation
and the lack of discriminant validity between scales on the MMPI-2. The authors point out that
the RC Scales were designed to preserve the important descriptive properties of the existing
MMPI-2 scales while enhancing their distinctiveness. In short, the newly restructured clinical
scales were developed to further define and interpret original clinical scale constructs, such as
depression and schizophrenia, while increasing discriminant validity. Tellegen et al. indicated
that the constructs for the RC scales were defined by professional judgment guided by clinical
impressions. Clinical impressions were given for items fitting an established clinical construct,
such as schizophrenia and mania. The clinicians used historically valid convergent evidence and
data to substantiate their impressions. All significant data dependent decisions regarding the RC
scales were based on independent analysis of four sample groups. Two groups consisted of 832
men and 380 women who completed the MMPI-2 in a residential substance abuse treatment
facility (McKenna & Butcher, 1987). The remaining two groups consisted of 232 men and 191
women who completed the MMPI-2 at one of three psychiatric facilities in Ohio or Minnesota;
facilities were either a psychiatric inpatient unit or a county hospital (Graham & Butcher, 1988).
It is important to note that while data were obtained from new participant groups, the constructs
were developed by professional clinicians from established ideas about the origins of pathology.
In essence, it is a further attempt to build a bridge between observed pathology and scientific
conceptualization.
15
As mentioned, Welsh’s Depression and Anxiety scale or “A scale” (Welsh, 1956, 2000)
was sometimes referred to as the “MMPI-2 first factor” which described subjective aspects of
anxiety and depression. In keeping with Frank (1974) who first identified a broad subjective
depression in inpatients as “demoralization”, Tellegen et al. borrowed the term for their first
factor (e.g., Demoralizatoin, RCd) and describe it as a subjective state of feeling bad, down, or
blue. Further, Tellegen et al. (2003) attempted to address high scale intercorrelation and item
overlap by removing this broad subjective factor from the Clinical Scales and making it a scale
of its own. The researchers point out that by removing aspects of demoralization from the
Clinical Scales, such as feeling fatigued, feeling blue, lacking motivation, and feeling sad, the
more specific defining issues of the individual scales would emerge independent of an ever
present demoralization. The researchers reiterate that the clinical significance of demoralization
needs to be measured, but that it should be measured once, independent of other pathology.
Watson and Tellegen (1985) suggested that demoralization appears to over emphasize
similarities in scales that are thought to be independent of one another, and further, that
demoralization is not the distinctive core of any of the Clinical Scales. That is, differences in
scales can be attributed, at least partially, to a core component that exists outside of
demoralization. This assumption motivated the researchers to identify a Demoralization
dimension in the MMPI-2 item pool, remove these items denoting Demoralization from each
clinical scale, and thus create a new set of scales, the Restructured Clinical Scales, which would
represent a clearer and more valid core descriptor of each scale.
Methodologically, the demoralizing factor was extracted by elaboration of previous
research done by Watson and Tellegen’s (1985). Watson and Tellegen first initiated a model of
Positive Affect (PA) and Negative Affect (NA) in which poles of negative emotions and positive
16
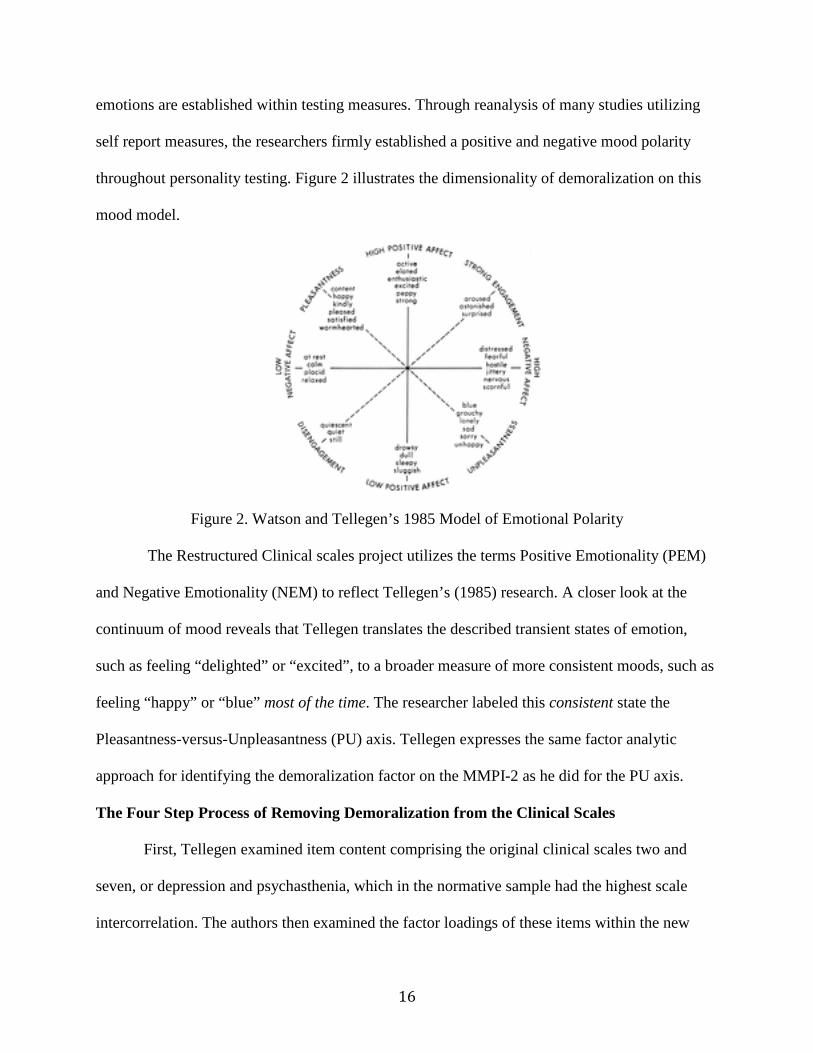
emotions are established within testing measures. Through reanalysis of many studies utilizing
self report measures, the researchers firmly established a positive and negative mood polarity
throughout personality testing. Figure 2 illustrates the dimensionality of demoralization on this
mood model.
Figure 2. Watson and Tellegen’s 1985 Model of Emotional Polarity
The Restructured Clinical scales project utilizes the terms Positive Emotionality (PEM)
and Negative Emotionality (NEM) to reflect Tellegen’s (1985) research. A closer look at the
continuum of mood reveals that Tellegen translates the described transient states of emotion,
such as feeling “delighted” or “excited”, to a broader measure of more consistent moods, such as
feeling “happy” or “blue” most of the time. The researcher labeled this consistent state the
Pleasantness-versus-Unpleasantness (PU) axis. Tellegen expresses the same factor analytic
approach for identifying the demoralization factor on the MMPI-2 as he did for the PU axis.
The Four Step Process of Removing Demoralization from the Clinical Scales
First, Tellegen examined item content comprising the original clinical scales two and
seven, or depression and psychasthenia, which in the normative sample had the highest scale
intercorrelation. The authors then examined the factor loadings of these items within the new
17
four group data set used in the scale development. Based on the factor loadings of items from
scales two and seven on the new data sets, the researchers chose any item with a Primary Factor
(PF1) loading of .50 or higher for the Demoralization scale. A total of 14 items had PF1 loadings
of at least .50 and ultimately 10 items were selected from this process for consideration for the
Demoralization scale. Next, through a complicated series of statistical rotations, the researchers
extracted 23 demoralizing items from the remainder of the MMPI-2 item pool, examined overlap
between previous demoralizing items, and ultimately picked a total of 18 items for the final
Demoralization scale.
In addition to removing the demoralizing component from each Clinical scale, the
researchers identified items with high factor loadings on the “core” of each scale, such as
schizophrenia or mania. These questions made up what the researchers denoted as “seed scales.”
This was accomplished by assigning to a given seed scale those items that had the highest
loadings on the scale’s core factor and that did not have significant factor loadings on the
Demoralization factor. Also, once the item was assigned to a seed scale, the item was not used
for any other Restructured Scale; thus attempting to make the seed scales distinct to promote
discriminate validity. In addition, items were eliminated from most scales if they “were not
appropriately correlated with conceptually relevant external criterion measures” (Graham, 2006,
p. 154).
In total, eight RC scales (Table 2) representing core elements of Clinical Scales, 1, 2, 3,
4, 6, 7, 8, and 9 were developed in addition to the demoralization scale.
18
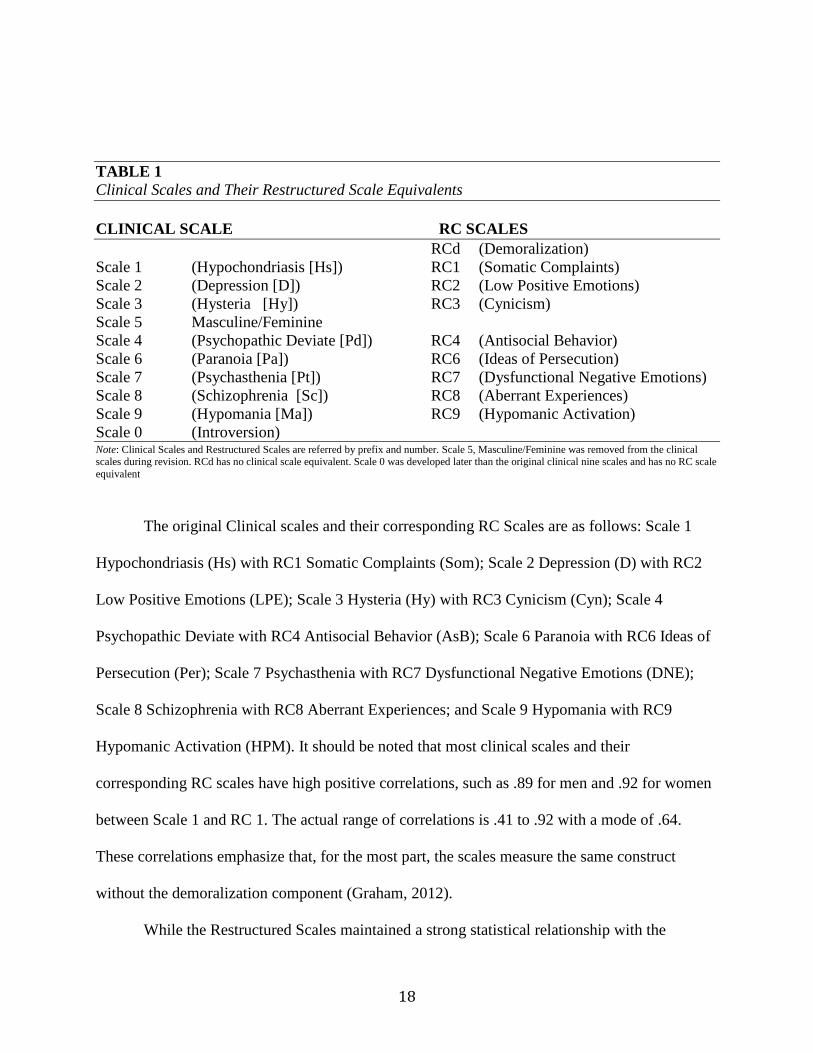
TABLE 1 Clinical Scales and Their Restructured Scale Equivalents CLINICAL SCALE RC SCALES RCd (Demoralization) Scale 1 (Hypochondriasis [Hs]) RC1 (Somatic Complaints) Scale 2 (Depression [D]) RC2 (Low Positive Emotions) Scale 3 (Hysteria [Hy]) RC3 (Cynicism) Scale 5 Masculine/Feminine Scale 4 (Psychopathic Deviate [Pd]) RC4 (Antisocial Behavior) Scale 6 (Paranoia [Pa]) RC6 (Ideas of Persecution) Scale 7 (Psychasthenia [Pt]) RC7 (Dysfunctional Negative Emotions) Scale 8 (Schizophrenia [Sc]) RC8 (Aberrant Experiences) Scale 9 (Hypomania [Ma]) RC9 (Hypomanic Activation) Scale 0 (Introversion) Note: Clinical Scales and Restructured Scales are referred by prefix and number. Scale 5, Masculine/Feminine was removed from the clinical scales during revision. RCd has no clinical scale equivalent. Scale 0 was developed later than the original clinical nine scales and has no RC scale equivalent
The original Clinical scales and their corresponding RC Scales are as follows: Scale 1
Hypochondriasis (Hs) with RC1 Somatic Complaints (Som); Scale 2 Depression (D) with RC2
Low Positive Emotions (LPE); Scale 3 Hysteria (Hy) with RC3 Cynicism (Cyn); Scale 4
Psychopathic Deviate with RC4 Antisocial Behavior (AsB); Scale 6 Paranoia with RC6 Ideas of
Persecution (Per); Scale 7 Psychasthenia with RC7 Dysfunctional Negative Emotions (DNE);
Scale 8 Schizophrenia with RC8 Aberrant Experiences; and Scale 9 Hypomania with RC9
Hypomanic Activation (HPM). It should be noted that most clinical scales and their
corresponding RC scales have high positive correlations, such as .89 for men and .92 for women
between Scale 1 and RC 1. The actual range of correlations is .41 to .92 with a mode of .64.
These correlations emphasize that, for the most part, the scales measure the same construct
without the demoralization component (Graham, 2012).
While the Restructured Scales maintained a strong statistical relationship with the
19
original basic nine they also relieved the original scales of item overlap and heavy scale
intercorrelation. The authors indicated they hoped to capture the essence or “seed” constructs of
the original Clinical Scales, but with a cleaner, more discriminant representation of the indicated
pathology (Greene, 2011). In other words, the RC Scales represent constructs such as mania and
antisocial personality, without the sensitivity to general subjective depression which Ben-Porath
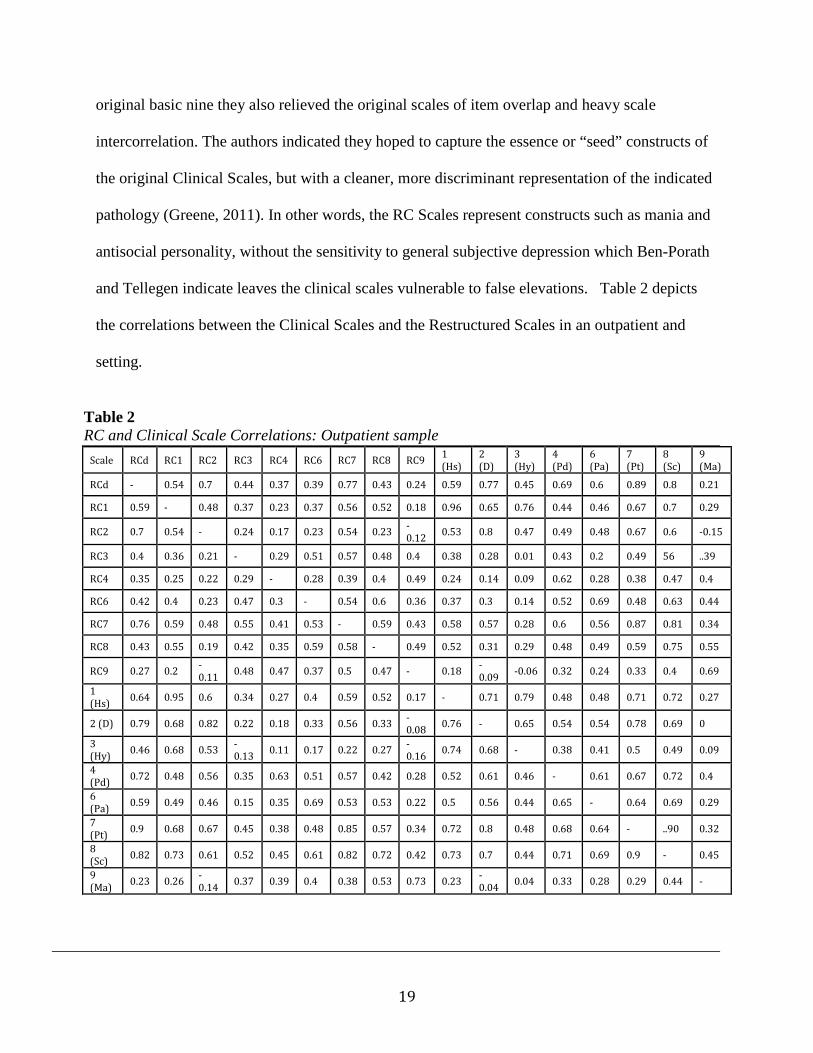
and Tellegen indicate leaves the clinical scales vulnerable to false elevations. Table 2 depicts
the correlations between the Clinical Scales and the Restructured Scales in an outpatient and
setting.
Table 2 RC and Clinical Scale Correlations: Outpatient sample
Scale RCd RC1 RC2 RC3 RC4 RC6 RC7 RC8 RC9 1 (Hs)
2 (D)
3 (Hy)
4 (Pd)
6 (Pa)
7 (Pt)
8 (Sc)
9 (Ma)
RCd - 0.54 0.7 0.44 0.37 0.39 0.77 0.43 0.24 0.59 0.77 0.45 0.69 0.6 0.89 0.8 0.21
RC1 0.59 - 0.48 0.37 0.23 0.37 0.56 0.52 0.18 0.96 0.65 0.76 0.44 0.46 0.67 0.7 0.29
RC2 0.7 0.54 - 0.24 0.17 0.23 0.54 0.23 -0.12 0.53 0.8 0.47 0.49 0.48 0.67 0.6 -0.15
RC3 0.4 0.36 0.21 - 0.29 0.51 0.57 0.48 0.4 0.38 0.28 0.01 0.43 0.2 0.49 56 ..39
RC4 0.35 0.25 0.22 0.29 - 0.28 0.39 0.4 0.49 0.24 0.14 0.09 0.62 0.28 0.38 0.47 0.4
RC6 0.42 0.4 0.23 0.47 0.3 - 0.54 0.6 0.36 0.37 0.3 0.14 0.52 0.69 0.48 0.63 0.44
RC7 0.76 0.59 0.48 0.55 0.41 0.53 - 0.59 0.43 0.58 0.57 0.28 0.6 0.56 0.87 0.81 0.34
RC8 0.43 0.55 0.19 0.42 0.35 0.59 0.58 - 0.49 0.52 0.31 0.29 0.48 0.49 0.59 0.75 0.55
RC9 0.27 0.2 -0.11 0.48 0.47 0.37 0.5 0.47 - 0.18 -
0.09 -0.06 0.32 0.24 0.33 0.4 0.69
1 (Hs) 0.64 0.95 0.6 0.34 0.27 0.4 0.59 0.52 0.17 - 0.71 0.79 0.48 0.48 0.71 0.72 0.27
2 (D) 0.79 0.68 0.82 0.22 0.18 0.33 0.56 0.33 -0.08 0.76 - 0.65 0.54 0.54 0.78 0.69 0
3 (Hy) 0.46 0.68 0.53 -
0.13 0.11 0.17 0.22 0.27 -0.16 0.74 0.68 - 0.38 0.41 0.5 0.49 0.09
4 (Pd) 0.72 0.48 0.56 0.35 0.63 0.51 0.57 0.42 0.28 0.52 0.61 0.46 - 0.61 0.67 0.72 0.4
6 (Pa) 0.59 0.49 0.46 0.15 0.35 0.69 0.53 0.53 0.22 0.5 0.56 0.44 0.65 - 0.64 0.69 0.29
7 (Pt) 0.9 0.68 0.67 0.45 0.38 0.48 0.85 0.57 0.34 0.72 0.8 0.48 0.68 0.64 - ..90 0.32
8 (Sc) 0.82 0.73 0.61 0.52 0.45 0.61 0.82 0.72 0.42 0.73 0.7 0.44 0.71 0.69 0.9 - 0.45
9 (Ma) 0.23 0.26 -
0.14 0.37 0.39 0.4 0.38 0.53 0.73 0.23 -0.04 0.04 0.33 0.28 0.29 0.44 -
20
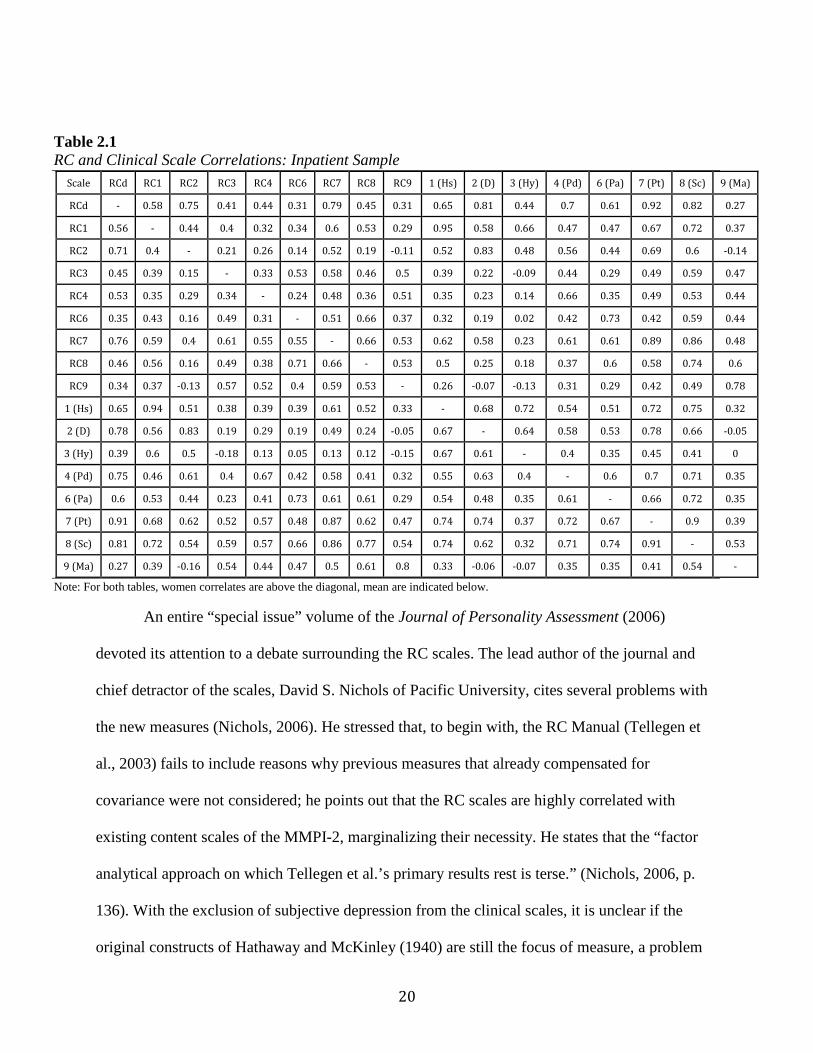
Table 2.1 RC and Clinical Scale Correlations: Inpatient Sample
Scale RCd RC1 RC2 RC3 RC4 RC6 RC7 RC8 RC9 1 (Hs) 2 (D) 3 (Hy) 4 (Pd) 6 (Pa) 7 (Pt) 8 (Sc) 9 (Ma)
RCd - 0.58 0.75 0.41 0.44 0.31 0.79 0.45 0.31 0.65 0.81 0.44 0.7 0.61 0.92 0.82 0.27
RC1 0.56 - 0.44 0.4 0.32 0.34 0.6 0.53 0.29 0.95 0.58 0.66 0.47 0.47 0.67 0.72 0.37
RC2 0.71 0.4 - 0.21 0.26 0.14 0.52 0.19 -0.11 0.52 0.83 0.48 0.56 0.44 0.69 0.6 -0.14
RC3 0.45 0.39 0.15 - 0.33 0.53 0.58 0.46 0.5 0.39 0.22 -0.09 0.44 0.29 0.49 0.59 0.47
RC4 0.53 0.35 0.29 0.34 - 0.24 0.48 0.36 0.51 0.35 0.23 0.14 0.66 0.35 0.49 0.53 0.44
RC6 0.35 0.43 0.16 0.49 0.31 - 0.51 0.66 0.37 0.32 0.19 0.02 0.42 0.73 0.42 0.59 0.44
RC7 0.76 0.59 0.4 0.61 0.55 0.55 - 0.66 0.53 0.62 0.58 0.23 0.61 0.61 0.89 0.86 0.48
RC8 0.46 0.56 0.16 0.49 0.38 0.71 0.66 - 0.53 0.5 0.25 0.18 0.37 0.6 0.58 0.74 0.6
RC9 0.34 0.37 -0.13 0.57 0.52 0.4 0.59 0.53 - 0.26 -0.07 -0.13 0.31 0.29 0.42 0.49 0.78
1 (Hs) 0.65 0.94 0.51 0.38 0.39 0.39 0.61 0.52 0.33 - 0.68 0.72 0.54 0.51 0.72 0.75 0.32
2 (D) 0.78 0.56 0.83 0.19 0.29 0.19 0.49 0.24 -0.05 0.67 - 0.64 0.58 0.53 0.78 0.66 -0.05
3 (Hy) 0.39 0.6 0.5 -0.18 0.13 0.05 0.13 0.12 -0.15 0.67 0.61 - 0.4 0.35 0.45 0.41 0
4 (Pd) 0.75 0.46 0.61 0.4 0.67 0.42 0.58 0.41 0.32 0.55 0.63 0.4 - 0.6 0.7 0.71 0.35
6 (Pa) 0.6 0.53 0.44 0.23 0.41 0.73 0.61 0.61 0.29 0.54 0.48 0.35 0.61 - 0.66 0.72 0.35
7 (Pt) 0.91 0.68 0.62 0.52 0.57 0.48 0.87 0.62 0.47 0.74 0.74 0.37 0.72 0.67 - 0.9 0.39
8 (Sc) 0.81 0.72 0.54 0.59 0.57 0.66 0.86 0.77 0.54 0.74 0.62 0.32 0.71 0.74 0.91 - 0.53
9 (Ma) 0.27 0.39 -0.16 0.54 0.44 0.47 0.5 0.61 0.8 0.33 -0.06 -0.07 0.35 0.35 0.41 0.54 -
Note: For both tables, women correlates are above the diagonal, mean are indicated below.
An entire “special issue” volume of the Journal of Personality Assessment (2006)
devoted its attention to a debate surrounding the RC scales. The lead author of the journal and
chief detractor of the scales, David S. Nichols of Pacific University, cites several problems with
the new measures (Nichols, 2006). He stressed that, to begin with, the RC Manual (Tellegen et
al., 2003) fails to include reasons why previous measures that already compensated for
covariance were not considered; he points out that the RC scales are highly correlated with
existing content scales of the MMPI-2, marginalizing their necessity. He states that the “factor
analytical approach on which Tellegen et al.’s primary results rest is terse.” (Nichols, 2006, p.
136). With the exclusion of subjective depression from the clinical scales, it is unclear if the
original constructs of Hathaway and McKinley (1940) are still the focus of measure, a problem
21
Nichols (2006) refers to as construct drift. Tellegen (2006) counters the criticism with a staunch
defense of his scales lauding the empirically validated research that he asserts Nichols neglects,
primarily that demoralization as a construct can stand alone and is not something that is always
interceded with other measures. In any case, the view of this study will echo the sentiment that
overall, the RC scales have been widely accepted among the American Psychological
Association members, but would benefit from further convergent validity studies and discussion
(Butcher, 2006).
The RF Project
The MMPI-2 Restructured Form (MMPI-2-RF; Ben-Porath & Tellegen, 2008) is the
most recent update to a long line of revisions to the original MMPI. Ben-Porath and Tellegen
constructed the RC Scales to represent the original constructs of the Clinical scales but with
better discriminant validity. Ben-Porath and Tellegen (2010) indicate the RC scales did not
measure all the important characteristics that could be assessed by the MMPI-2 item pool.
Therefore, the MMPI-2 RF has 50 scales including 9 RC scales, 7 revised Validity scales, 1 new
Validity scale, 3 new Higher Order scales, 23 new Specific Problems scales, 2 new Interest
scales, and revised versions of the Personality Psychopathology Five (PSY-5) scales.
The MMPI-2 Restructured Form has 338 items. The items were selected from the original
567 and the RC Scales have effectively replaced the Clinical Scales. The methodology and
rationale of item inclusion paralleled that of the RC project (Greene, 2011) for scales
representing specific problems throughout the MMPI-2. However, there was also the intent to
capture large broad-band measures of pathology (Greene, 2011) due to both the historical
presence of broad band dimensions in personality assessment and the emergence of dimensional
properties with descriptors in the coming DSM-V (Ben-Porath & Tellegen, 2008).
22
The History of Higher Order Factors: The Need for HO Scales
Golberg (1993) noted there is a long history of personality assessments measuring
personality at different levels (i.e., broader factors vs. narrower traits). Trait explanations are
typically noted as more specific narrower band of larger, broader dimensions of personality. For
example, a broad- band dimension of assessed emotional problems may have a facet level
analysis of “depression” or “anxiety”. According to Costa and McCrae (1995), factor analytic
studies conducted by Guilford, Cattell, and Eysenck were among the first to adopt formal
hierarchical “dimensional” models, with each researcher choosing to examine different levels of
adjectives. Further, as Goldberg (1993) discusses, personality theorists have addressed differing
levels of descriptors by either examining levels horizontally or vertically. Horizontal adjectives
of personality are examined across a particular level of description, such as examining specific
items. Vertical approaches then describe personality on a north/south vertical slope where
descriptors move from specific to global and vice versa.
Ben-Porath (2012) gives a succinct background of the origins of hierarchical models.
To paraphrase Ben-Porath, Heyman and Wiersma (1906) gave a 90 item personality rating
scale to over 3,000 physicians. The physicians were asked to describe people they knew
intimately. The descriptions were then correlated with basic Galton coefficients first
introduced in 1889. The relationships among these descriptors were then grouped based
on positive correlations. Higher order descriptors were then formed from similarities
observed in the grouping variables. Interestingly, as Ben-Porath points out and researchers
confirm, a majority of the eight major groupings found by Heyman and Wiersma hold
constant today (Digman, 1972).
23
Traditionally, higher order dimensions of personality are derived from a bottom-up
scheme (Costa & McCrae, 1995). That is, test authors construct large item pools intended to
represent psychological constructs, and then correlates of those constructs are grouped together.
This process has led to some debate in the field of personality assessment about the number of
factors (e.g., ranging from 2 to 16), which can, by dimension, represent all levels of personality.
Part of the debate stems from both how the items are constructed, such as labeling issues and
construct validity concerns, to how the items are then subsequently grouped. Ben-Porath (2012)
suggests despite these procedural debates, factor analytic studies continued to clearly illustrate
the presence of a behavioral (i.e., acting out vs constriction) and emotional (e.g., elevated vs.
depressed mood) component to personality assessment.
Efforts to delineate the higher order structure of the MMPI began shortly after
publication of the test. Commenting on a problem that plagued most of these studies from their
inception, Wiggins (1968) noted, “The dangers implicit in factoring MMPI scales with
overlapping items continues to be announced (Adams & Horn, 1965; Shure & Rogers, 1965) and
ignored (Slater & Scarr, 1964)” (p. 314). Other sources of difficulty in this endeavor were, as
stated, reliance on the misleading labels of the Clinical Scales and assignment of alternative
labels that also failed to accurately characterize the constructs emerged from these investigations.
As noted previously in this paper, results of these early studies and results from his own
work led Welsh (1956) to identify two primary dimensions in the MMPI that he labeled Anxiety
(A) and Repression (R). Further research utilizing Welsh’s primary dimensions illustrated
psychometric problems with these labels. Specifically, the labels were psychodynamic and non-
specific which led to internal consistency problems and lack of diagnostic clarity. Kassebaum,
Couch, and Slater (1959), much like Welsh, confirmed the broad dimensionality of the MMPI,
24
but they did so by extending their correlations beyond the parameters Welsh utilized. The
researchers then compared the relationships among the dimensional grouping to hierarchical
factors found on other instruments (e.g., Eysenck,, 1953; Guilford, 1939). The researchers
concluded that higher order factors on other instruments were consistent with broad dimensions
found on the MMPI. According to Kassebaum et al. the broad factors were defined by both an
emotional and behavioral polarity.
Ben-Porath (2012) noted that factor analytic studies of the Personality Assessment
Inventory (PAI; Morey, 1991) illustrate similar broad dimensions of psychopathology. To
paraphrase Ben-Porath (2012), Ruiz and Edens (2008) utilized a large prisoner population
and found broad internalizing factors among the population. They also identified a
dimension defined by acting out or externalizing.
More specifically, the internalizing dimension was characterized by suicidality,
depression, anxiety, and schizophrenia. The externalizing factor was primarily defined by
aggressiveness, antisocial behavior, and drug and alcohol problems. Ben-Porath continues
that Blais (2010) conducted a joint factor analysis of the PAI and NEO Personality Inventory-
Revised (NEO-PI-R; Costa & McCrae, 1992). While the NEO measures normal pathology, three
broad dimensional factors were observed across the two instruments. The dimensions were
consistent with broad dimensions found in other normal personality measures; two of these
dimensions, according to Ben-Porath, were reminiscent of externalizing and internalizing.
The finding and labeling of the higher-order dimensions of Internalizing and
Externalizing link the adult psychopathology literature to a structure identified by Achenbach
and Edelbrock (1978) as characterizing child and adolescent psychopathology. These authors
observed that two broad-band dimensions, labeled alternatively Overcontrolled/Internalizing
25
Syndromes and Undercontrolled/Externalizing Syndromes, had emerged from several factor
analytically based lines of research. The starting point for these investigations was Achenbach’s
(1966) study of case history data obtained from 600 4-15-year old boys and girls treated at
inpatient and outpatient facilities. Behavioral problems reported in these case records were rated
and factor analyzed, identifying several more narrowly focused constructs (e.g., aggressive
behavior, phobias) as well as the two broad-band dimensions just mentioned. Achenbach and
Edelbrock (1978) reviewed the results of 15 subsequent studies, conducted by various
investigators with different measures and sources (i.e., case histories, self-report, teacher report,
and parent report), and found that all identified a similar pair of higher-order dimensions.
The findings just described point to considerable similarity and overlap in the higher-
order dimensions identified with measures of normal personality and psychopathology. On the
basis of a review of a broad body of similar research, O’Connor (2002) concluded “the
dimensional universes of normality and abnormality are apparently the same, at least according
to data derived from contemporary assessment instruments” (p. 962). Encouraged by such
findings, Markon, Krueger, and Watson (2005) sought to delineate the structure of normal and
abnormal personality using an integrative hierarchical approach. On the basis of a meta-analysis
of previous investigations of measures of normal and abnormal personality and new analyses
conducted with a number of instruments, these authors concluded that a hierarchical structure,
composed of two higher-order dimensions related to Negative and Positive Emotionality, could
account for common variance among these measures. Markon and colleagues also found
meaningful subordinate three-, four-, and five-factor structures. Consistent with findings in the
normal personality domain, in the three-factor structure, the Negative Emotionality factor split
26
into one that focuses more specifically on negative emotional experiences and a second
disinhibition factor analogous to an acting out factor seen in other research.
Tellegen and Ben-Porath (2008) note that among hierarchical factors emergent in the
literature of personality assessment, noticeably absent is the presence of a factor related to
disordered thinking. The authors point out the normalcy of this problem in the context of non-
clinical samples; however among more pathological test takers, this is somewhat perplexing. The
authors also describe the long history of researchers making differential diagnosis based on three
broad domains of psychopathology gleaned from profile patterns apparent in the MMPI.
Traditionally the domains have been Psychosis, Psychoneurosis, and Conduct Disorder. Ben-
Porath (2012) indicates “throughout the test’s history, clinicians have either explicitly or
implicitly used the MMPI to assess three broad types of psychopathology related to emotional,
thought, and behavioral dysfunction, yet factor analytic studies of the instrument consistently
failed to identify a distinctive thought dysfunction dimension”. (p. 100) Both Tellegen and Ben-
Porath explain the failure of previous factor analytic work (i.e., prior to the RC project) to
produce a thought disorder factor is largely due to high intercorrelations of the original Clinical
Scales and the saturation of the clinical scales with demoralization; they point out that both of
these factors inhibit the factors to discriminate.
Ben-Porath and Tellegen (2008/2011) indicate the inclusion of the HO Scales to the RF
project was done not only to capture more succinct broad dimensional measures which, as
discussed, have historical roots in personality assessment, but also to aid in ease of interpretation
of the new instrument; thereby addressing a chief criticism of the MMPI-2 regarding scale
clarity, disorganization of concepts, and difficult interpretation for novice users.
Higher Order Dimensions on the MMPI-2 RF
27
Building on historical examples of factor analytic studies of the MMPI and the MMPI-2
(Tellegen 1964; Welsh, 1956; 2000) and more recent factorings of the RC Scales (Sellbom, Ben-
Porath, & Bagby, 2008), Ben-Porath and Tellegen include Higher Order scales which capture not
only historically relevant emotional and behavioral factors, but a new third factor of thought
difficulty. Subsequently, the new thought disorder factor is now emergent among factor analytic
studies of the RC Scales (Sellbom, Ben-Porath, & Bagby, 2008) and the technical manual for the
RF project indicates that factor analyses of the RC Scales “conducted with three clinical samples
consistently identified a coherent three-factor structure representing emotional, thought, and
behavioral dysfunction (Ben-Porath & Tellegen, 2008, p. 17).
The Specifics of the RF Higher Order Scales
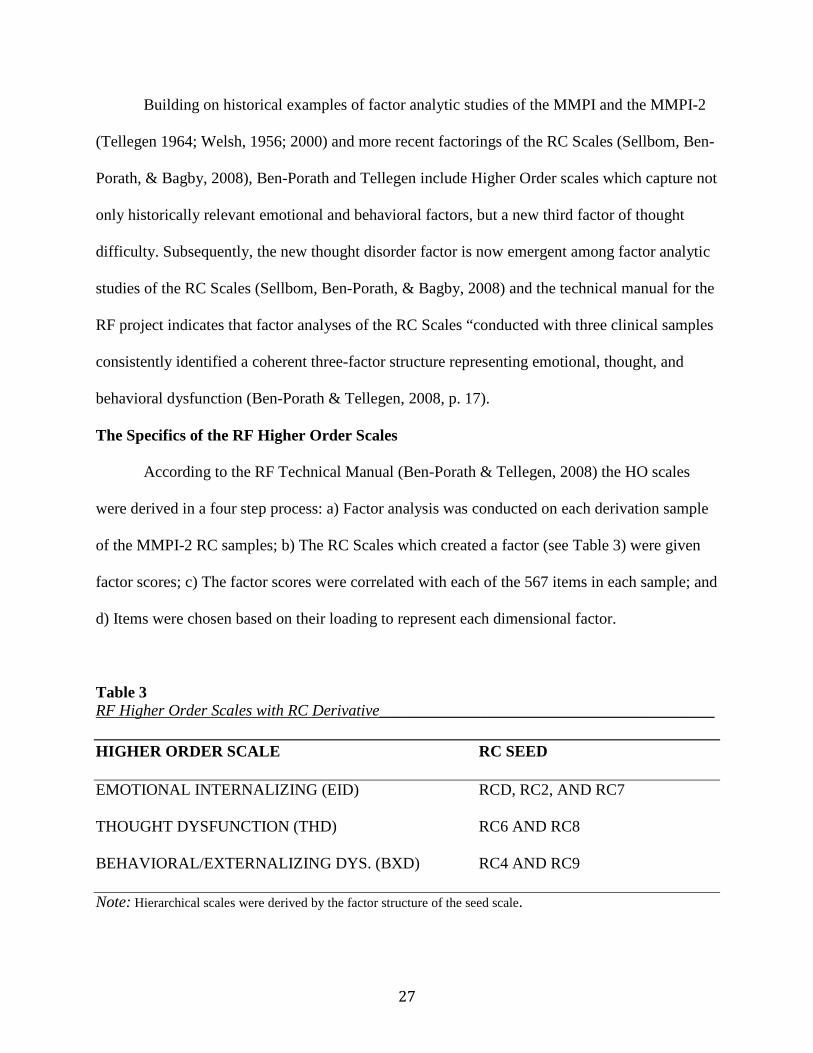
According to the RF Technical Manual (Ben-Porath & Tellegen, 2008) the HO scales
were derived in a four step process: a) Factor analysis was conducted on each derivation sample
of the MMPI-2 RC samples; b) The RC Scales which created a factor (see Table 3) were given
factor scores; c) The factor scores were correlated with each of the 567 items in each sample; and
d) Items were chosen based on their loading to represent each dimensional factor.
Table 3 RF Higher Order Scales with RC Derivative__________________________________________ HIGHER ORDER SCALE RC SEED
EMOTIONAL INTERNALIZING (EID) RCD, RC2, AND RC7
THOUGHT DYSFUNCTION (THD) RC6 AND RC8
BEHAVIORAL/EXTERNALIZING DYS. (BXD) RC4 AND RC9
Note: Hierarchical scales were derived by the factor structure of the seed scale.
28
The EID scale contains 41 items. Greene (2011) indicates the primary category
represented by the scale is general subjective distress and College Maladjustment. Greene points
out the 41 items EID scale utilizes 14 items (58.3% of the total RCd scale) from the
Demoralization (RCd) scale, 11 items (64.7% of the total RC2) from the Low Positive Emotions
(RC2) scale, 8 items (40.0% of the total Intr-r) from the Introversion/Low Positive Emotionality
Revised (Intr-r) scale, 7 items (29.2% of the total RC7) from the Dysfunctional Negative
Emotions (RC7) scale, and 5 items from the Negative Emotions/Neuroticism Revised (NEGE-r)
scale.
Further, Green (2011) indicates the EID scale shares 4 items (100%) from the Self-Doubt
(SFD) scale, 3 items (42.9%) from Stress and Worry (STW) scale, and 2 items (28.6%, 40%)
from the Anger Proneness (ANP) and Helplessness/Hopelessness (HLP) scales, respectively.
Next, Green (2011) indicates the Thought Dysfunction (THD) scale is a 26-item scale,
which essentially embodies two dimensions: psychotic behaviors/symptoms and infrequent
responses. The THD scale utilizes 22 of its items from the Psychoticism-revised (PSYC-r) scale,
13 items (76.5%) with the Ideas of Persecution (RC6) scale, and 13 items (72.2%) from the
Aberrant Experiences (RC8) scale. The THD scale utilizes one item from the Neurological
Complaints (NUC) scale and otherwise does not utilize any items with other specific problem
scales.
Finally, Green (2011) indicates the Behavioral/Externalizing Dysfunction (BXD) scale
represents four categories within its domain: antisocial attitudes, disconstraint, substance abuse,
and anger/aggression. The 23 item scale utilizes 15 items (75.0%) from the Disconstraint-revised
(Disc-r) scale, 13 items (59.0%) from the Antisocial Behaviors (RC4) scale, 9 items (32.1%)
from the Hypomanic Activation (RC9) scale, and 4 items (22.2%) from the Aggression-revised

29
(AGGR-r-r) scale. The BXD scale shares 6 items (100.0%) from the Juvenile Conduct Problems
(JCP) scale, 5 items (71.4%) from the Substance Abuse (SUB scale, and 2 items (22.2%) from
the Aggression (AGG) scale.
In the end, most of the items comprising the scales are represented on the RC Scales (e.g.,
concerning THD, all of the selected items are scored on either RC 6 or RC 8; and all but one of
the items selected for BXD are scored on RC4 or RC 9) (Ben-Porath & Tellegen, 2008). There
is no item overlap among the broad-band higher order measures.
In the MMPI-2 RF Technical Manual, Tellegen and Ben-Porath (2008/2011) report
reliability estimates of internal consistency Cronbachs alpha for the HO Scales which are .69
(THD) .91 (BXD) and .85 (EID) in the normative sample and .79 (BXD), .95 (EID), and .80
(THD) in several clinical samples. The associated standard errors of measurement, expressed as
T Scores, range from three to six across settings, reflecting overall good reliability of the HO
Scales in clinical and nonclinical samples. Tellegen and Ben-Porath also report intercorrelations
between the HO Scales in the normative and several clinical samples ranging between .18 to .38,
with a median of about .30. This reflects moderate relationships between the scales and appears
to meet the purpose of the project.
In the MMPI-2 RF Technical Manual, Tellegen and Ben-Porath (2008/2011) report
empirical correlates of the HO scales. Ben-Porath (2012) summarizes the databases as follows:
individuals receiving outpatient and inpatient mental health and substance abuse treatment services, medical patients, criminal defendants and civil disability claimants, and college students. As would be expected, a broad range of empirical correlates was found. Various types of criteria were available for these analyses, including extensive ratings provided by therapists and intake workers at an outpatient community mental center, systematic record reviews conducted at two psychiatric inpatient facilities and a forensic pretrial assessment center, and various commonly used self-report measures for mental health and medical outpatients, individuals receiving substance abuse treatment, disability claimants, and college students (p. 104).
30
The following is a summary of the HO Scale correlates identified in the Technical
Manual as summarized by Ben-Porath (2012).
Emotional/Internalizing Dysfunction (EID)
According to Ben-Porath (2012) intake workers described both men and women in the
outpatient community mental health samples as sad and depressed. They were also described by
their therapists as “sad, insecure, depressed, pessimistic, lonely, tearful, experiencing suicidal
ideation, self-punishing, feeling inferior, feeling hopeless and helpless, feeling like a failure, self-
degrading, self-doubting, being overly sensitive to criticism, not coping well with stress,
anxious” (p. 104). High scores on EID for both men and women were also associated with sleep
difficulty, feeling overwhelmed, feeling that life is a strain, and fatigue.
According to Ben-Porath (2012), empirical correlates of EID for psychiatric inpatients
included depression, sleep difficulties, fatigue, suicidal ideation and a history of suicide attempts,
an admitting diagnosis of depression, and a history of antidepressant medication. EID scores
were correlated substantially with measures of “depression, anxiety, anger, behavioral inhibition,
and somatization” (p. 105) in the VA sample. In the substance abuse treatment sample, higher
EID scores were defined by depression characterized by hopelessness, anger, and hostility.
Criminal defendant empirical correlates with EID were noted for depression and dysphoric
mood, having been abused, suicide attempts, a history of being prescribed psychotropic
medication and utilizing outpatient mental health. According to Ben-Porath (2012), the disability
claimants “higher EID scores were associated with measures of dysphoria, inadequacy,
despondence, depression, anxiety, obsessive worry, and emotional features associated with
PTSD” (p. 105). Finally, EID scores showed a positive relationship with Negative Emotionality
31
and Stress reactivity and scored negatively with Positive Emotionality and well being (Ben-
Porath, 2012;Tellege & Ben-Porath, 2008/2011).
Thought Dysfunction (THD)
According to Tellegen and Ben-Porath (2008/2011), because thought disordered
individuals were typically referred to outside agencies, very few empirical correlates of THD
were observed in the outpatient facility. However, according to Ben-Porath (2012) “the inpatient
samples had strong correlations of THD with being admitted for treatment of psychosis,
presenting with delusions and hallucinations, being prescribed antipsychotic medication, being
diagnosed with Schizophrenia” (p. 105). The RF manual also shows strong correlations of THD
with prescriptions of antipsychotic medication at discharge in two of the three samples. The VA
samples showed strong correlations with THD with Magical Ideation and Perceptual Aberration
scales. High scores for THD among the criminal defendants were associated with the
prescription of antipsychotic medication, a history of suicide attempts, lower IQ scores and
intellectual functioning. In the disability claimants, THD scores were associated with psychosis
and dissociation. Further, THD scores were correlated with interpersonal alienation and altered
states.
Behavioral/Externalizing Dysfunction (BXD)
For both men and women in the community mental health samples, higher BXD scores
were related to previous arrests, antisocial personality disorder, substance abuse, suicide
attempts, anger, aggression, family problems and “having difficulty trusting others, being
resentful, having stormy interpersonal relationships, being self-indulgent, being power oriented
and overbearing in interpersonal relationships, exercising poor judgment, and being excitable
and impulsive” (Ben-Porath, 2012, p. 106). Higher BXD scores among inpatients were noted for

32
substance abuse (i.e., intoxication at admission) and recent usage of drugs and alcohol. Also
noted were correlations with violent histories, involvement with the courts in the VA sample, and
measures of anger in the outpatient and substance abuse samples. Further the substance abuse
sample revealed higher scores on BXD correlated with measures of aggression, anger, and
substance abuse. Higher scores for criminal defendants on BXD were correlated with a “history
of school truancy, being arrested and placed on probation as a juvenile, violent behavior, abuse
of alcohol and various drugs, having attempted suicide in the past, and diagnoses of substance
use and Antisocial Personality disorders.” (Ben-Porath, 2012, p. 106). Finally, high scores on
BXD for the disability claimants’ sample were strongly associated with trauma exposure and
substance abuse.
The empirical correlates addressed by the various groups of the norm sample reveal both
discriminate validity for the new scales and expected correlates throughout the samples. In other
words, the psychopathology symptoms, personality characteristics, and behavioral tendencies
represented by the correlates are consistent with what the scales are reportedly trying to measure.
The Need for Convergent Validity
In essence, convergent validity studies give credence to new constructs in the field of
assessment. Improvements, innovations, or in this study’s case, a reworking of an instrument,
need to be validated. Convergent validity studies link new measurement forms with more
established criteria. These changes with previously established measures in the field to illustrate
that changes or innovations are empirically grounded with correlates of other well-established
measures. In this study, we have the addition of the HO scales to the MMPI-2 RF. Examining the
convergent validity of the HO scales with the Millon Clinical Multiaxial Inventory-III, fourth
33
edition (MCMI-III; Millon, 2009) will shed further empirical light on the properties of these
scales.
MCMI-III
The original version of the Millon Clinical Multiaxial Inventory was published by
Theodore Millon in 1977. The researcher linked it to diagnostic categories of the then DSM-III.
Following revisions made to the DSM, in 1987 Millon updated the assessment to reflect changes
in diagnostics at the time. A third version was published in 1994 and this version was
subsequently renormed in 2008; hence the somewhat misleading name of MCMI-III 4th Edition
on the manual cover.
Choca (2004) suggests the MCMI is “one of the most popular instruments of its kind
(Belter & Piotrowski, 1999; Camera, Nathan, & Puente, 1998; Piotrowski & Keller, 1989;
Piotrowski & Lubin, 1989, 1990; Watkins, Campbell, Nieberding, & hallmark, 1995)” (p.9). The
inventory is used internationally (Jackson, Rudd, Gazis, & Edwards, 1991; Vereycken,
Vertommen, & Corveleyn, 2002) and is used extensively in mental health interventions
(Retzlaff, Stoner, & Kleinsasser, 2002), forensic evaluations (Schutte, 2001), and the evaluation
of military personnel (Vereycken et al., 2002). Choca (2004) indicates only the MMPI and the
Rorschach have been the focus of more research in personality assessment.
There are several reasons the MCMI-III serves as beneficial convergent validity for the
new HO Scales: a) The structure of the test offers relevant description to the Higher Order
Dimensions; b) The theoretical underpinnings of the instrument are aligned with a Higher Order
Structure; c) The use of base rate scores; and d) The psychometric properties of the MCMI-III
are well established and acceptable.

34
First, the MCMI-III scales are grouped into categories of personality and
psychopathology to reflect the DSM distinction between Axis II and Axis I, respectively.
Separate scales distinguish the more enduring personality characteristics of patients (Axis II)
from the acute clinical disorders they display (Axis I), a distinction judged to be of considerable
value by test developers and clinicians (Dahlstrom, 1972). Profiles based on all 24 clinical scales
may be interpreted to illuminate the interplay between long-standing characterological patterns
and the distinctive clinical symptoms currently being manifested. Thus, the MCMI is designed to
describe persons in terms of larger broadband characteristics and those identifying states that
accompany them. This diagnostic grouping is particularly beneficial for the current convergent
validity study. The new MMPI-2 RF HO Scales are broadband scales, which would benefit from
Axis I convergent validity studies. If the HO scales are valid measures of broadband domains,
they should behave much like the larger groupings established for the MCMI; the moderate and
severe MCMI descriptor scales (i.e., the Axis I scales) should align accordingly.
Secondly, the MCMI theory evolved from a personality theory anchored in behavior and
reinforcement principles to the current description of pathology based in evolutionary theory
(Millon, 1990; Millon & Davis, 1996). The MCMI-III manual explains:
“With this change, personality disorders are seen as evolutionary constructs derived from the fundamental tasks that all organisms confront, namely, the struggle to exist or survive (pleasure vs. pain), the effort to adapt to the environment or adapt the environment to oneself (passive vs. active), and the organism’s strategy to make reproductive investments in kin or offspring versus an investment in its own personal replication (other versus self).” (p. 4) These polarities represent an experience of personality based on evolutionary principles.
Millon’s theory transcends any one school of personality and the Axis II dimensions captured on
the MCMI represent “personality disorders…. across the entire matrix of the person, with
expression throughout several clinical domains” (p. 4). With this expression, the MCMI profile
35
gives a higher order description of an individual in the strictest sense of the term. The Axis I
scales are themselves specific problems for these “higher orders” which makes the instrument an
appropriate fit for the purpose of the current study.
To be clear, test construction of the MCMI-III was not intended to be hierarchical in
nature per se. Rather, scales were designed to represent membership in either Axis I or Axis II
domains. For purposes of this study, the placement of scales in either area makes it especially
fruitful for an RF convergent validity study because researchers may choose the area of most
interest. For our purposes, we are interested in the empirical correlates of specific syndromes
describing higher order categories gleaned from the original reconstructed scales. Further, the
MMPI is traditionally an Axis I instrument. The new RF HO scales are describing larger,
empirically derived, factors that the authors suggest are accentuated by the Specific Problems
content. Therefore, the discrete placement of the Axis I scales into a category of their own, while
not specifically intended as hierarchical, is an advantage of the use of the MCMI-III in the
current study.
Thirdly, the scale scores for the MCMI-III are reported as Base Rate (BR) scores, where
BR scores take into consideration the base rate of the disorder being measured. While
contributing to the development of the DSM-III, Millon witnessed the distribution of disorders
across populations. This experience taught him that psychopathology is not normally distributed;
thus, he utilized base rates as a means of obtaining the most sensitivity and specificity. As Millon
states, this “provides a basis for selecting optimal differential diagnostic cutting lines and also
ensures that the frequency of the MCMI-III-generated diagnoses and profile patterns will be
comparable to representative clinical prevalence rates (Millon et al., 2009)” (p. 9). This aspect of

36
the MCMI-III makes it especially fruitful for a convergent validity study in that it will highlight
the specificity and the sensitivity of the HO scales
Finally, the MCMI-III is a well-established measure. There are more than 600 research
studies published that utilize the MCMI test as a major assessment (Millon et al., 2009). The
items on the MCMI-III, were chosen using a combination of rational sort based on concordance
with Millon theory and empirical fit. The instrument incorporates Theodore Millon’s theoretical
formation of psychopathology and possesses internal consistency (reliability) coefficients
between .82 and .90. However, the MCMI-III is shorter with just 175 questions. The instrument
is often given in tandem with the MMPI-2 to clarify Axis II diagnostic issues.
A Word About Factor Analysis
Charles Spearman (1904) is credited with the statistical technique of factor analysis.
Simply, correlations across descriptors are drawn which provide an overarching variable.
Spearman, for example, noticed that school children who were remarkable performers in one
area tended to do well in other, seemingly unrelated areas. This fostered the notion of a general
cognitive ability, now known as g, which can be related to other “second order” factors of
intelligence.
Raymond Cattell (1974) later expanded on Spearman’s theory using factor analysis and
included other factors, with their respective second order loadings, such as motivation and
psychology. (Cattell also developed other innovative accouterments to factor analysis, such as
scree tests and similarity coefficients) Cattell’s use of factor analysis led to the theory describing
crystallized and fluid intelligence.
Specifically to psychology, Cattell’s use of factor analysis led to his 16 Personality
Factors theory of personality. This is regarded by many in the personality world as the beginning
37
of the inductive movement into explanations of personality (i.e., using sound statistical
techniques to inform explanations). Many personality theorists indicate Cattell’s use of factor
analysis, which draws larger domains described by second order groupings, as the beginning of
the 5 factor movement. Factor analysis is now inextricably linked to validity discussions and the
psychometric properties of modern day personality inventories. Specifically to our study, factor
analysis is utilized to provide convergent validity of postulated higher order factors (i.e., the HO
Scales) with established clinical syndromes based on an instrument incorporating them in a
historically horizontal fashion.
Factor Analysis and the MCMI-III
Cuevas, Garcia, Aluja, and Garcia (2008) indicate factor analyses of earlier versions of
the MCMI have produced somewhat inconsistent solutions, but all have produced similar three
and four factor solutions. The authors suggest several reasons for inconclusive results but
highlight “many conjointly factored the PD and clinical Axis-I type scales of the MCMI,
whereas others factored only the PD scales” (p.60). The authors also suggest previous studies
have factored items instead of scales and some have used clinical samples, whereas others have
used non-clinical populations. Despite the lack of cohesion around a solid factor structure, there
is general agreement among MCMI researcher that there seems to be three overall factors
variously called maladjustment, acting out or behavioral problems, and thought disorder or
psychoticism. For example, Craig and Bivens (1998) factored the MCMI-III and found three
factors and suggested “in comparing our results with previous factor analytic studies on the
MCMI and the MCMI-II, we find close agreement with prior studies…all studies have found a
factor variously labeled maladjustment, general maladjustment, general distress, emotional
distress” (p. 19). The authors continue, “ a second factor labeled Paranoid Behavior/Thinking
38
with Detached Emotionality, was found in most previous MCMI and MCMI-II studies which
were variously labeled paranoid behavior and thinking…almost all studies have found a factor
variously labeled restraint/aggression, extraverted acting out” (p. 195).
Rendinell-Salamone, Leiker, Partridge, Dorr, and Webster (2010) performed a series of
exploratory factor analytic studies of the dimensionality of the MCMI-III in a large sample of
psychiatric inpatients. Utilizing factor analytic techniques anchored by oblique varimax
rotations, rather than uncorrelated orthogonal factors which are historically unreliable and often
misleading regarding factor structures, factor structures were guided by Parallel Analysis,
Minimum average partial test, Standard error Scree tests, and number of eigenvalues equal to or
greater than one. Our preliminary findings of both singular and combined factor structures of the
Personality Disorder and clinical syndrome scales reveal results consistent with research stated
above (Webster, Latronica, Partridge, Dorr, & Morgan, 2011; Partridge, Dorr, Webster, &
Rendinell, 2010; Webster, Partridge, Dorr, Morgan, 2010).
39
CHAPTER 2
PURPOSE OF THE STUDY
The purpose of this study is to deepen our understanding of the nature of the new MMPI-
2-RF HO scales in relation to higher order dimensions derived from the MCMI-III Axis I scales.
That is, this study will examine the patterns of covariation of the new MMPI HO scales with
higher order scales derived through the use of factor analysis from the well established MCMI-
III Axis I scales. Thus it is a concurrent validity study. This will require performing a factor
analysis of the MCMI-III Axis I scales using the most up-to-date statistical technology. In this
process it will also be possible to build a correlation matrix to describe the construct validity of
the three dimensions of psychopathology identified by Ben-Porath and Tellegen.
The addition of Higher Order scales to the MMPI-2 constitutes a new approach to
interpretation of an industry gold standard. Test administrators are encouraged to first look at the
HO scales before moving on to more specific scales and view the entire profile in light of
elevations rendered on the broad dimensional measures. This guiding principle alone makes
future research with these scales paramount. As stated, it is important with any new scale on any
instrument to investigate the convergent validity properties with other more established
measures. Both to determine discriminant and convergent validity of the HO’s, this study
investigated the factor structure of the RF HO scale with higher order dimensions derived for the
Axis I scales of the MCMI-III.
40
CHAPTER 3
METHODOLOGY
The study sample consisted of data obtained from 440 adult psychiatric inpatients; 47.5%
were male and 52.5% female. The mean age was 34 years and the mean years of education were
12.8 years. The ethnicity reported by these patients was as follows: 88.3% Caucasian, 6.1%
African-American, 3% Native American, 1.6% Hispanic, .5% Asian, “other”. The principal
diagnoses given to this population were as follows: 60% mood disorders, 8.3% schizophrenic
and other psychotic disorders, 6.8% substance abuse disorders, 4.3% anxiety disorders, and
13.8% “other”. In addition to the principal diagnoses, 49% of this patient population was given a
comorbid Axis II diagnosis. Approximately 5% of all patients at this setting are administered the
MMPI-2 and MCMI-III as part of their admittance, as these cases tend to be very complex and
puzzling. The demographic information may be viewed in Table 4 in the Appendices.
Setting
The subjects in this study were hospitalized in an inpatient psychiatric facility in a
medium-sized Midwestern city. Patients were admitted between December 1996 and May 2004.
The length of stay for patients ranged from one day to 28 days, with the length of inpatient stays
declining over the years in response to decreases by managed care in length of authorized stays.
The average length of stay was 7 days. In the course of admission, all patients received a
complete medical work-up to rule out medical pathology. Psychological testing was requested to
assist with the process of diagnosing psychiatric disorders.
Measures
Minnesota Multiphasic Personality Inventory-2 (MMPI-2). The MMPI-2 (Butcher,
41
Dahlstrom, Graham, Tellegen, & Kaemmer, 1989) is a 567-item self-report inventory designed
to assess patterns of personality and psychopathology in adults. Respondents to the MMPI-2 are
asked to make true/false decisions as to whether each item applies to them. The MMPI-2 was
scored using NCS and Pearson Assessment’s computerized scoring program Microtest-Q, which
calculates the scales used in this study. Specifically, RF Higher Order scales were calculated for
the MMPI-2 using question sets provided in the RF Technical Manual. The MMPI-2 RF project
is the latest addition to the longstanding MMPI. The HO scales were added for increased
diagnostic descriptive power and increased organizational flow of the instrument. It is important
to note no new items were added to the MMPI for the RF project. The MMPI is traditionally
used as an Axis I measure, however the inclusion of the HO scales suggests descriptions
typically consistent with assessment measures with broader descriptions of pathology (e.g.,
NEO-PI, MCMI).
Millon Clinical Multiaxial Inventory-Third Edition (MCMI-III). The MCMI-III
(Millon, Millon, Davis, & Grossman, 2009) is a 175-item self-report inventory also designed to
assess patterns of personality and psychopathology in adults. Respondents are asked to make
true/false decisions as to whether each item applies to them. Scale scores are reported as Base
Rate (BR) scores, where BR scores take into consideration the base rate of the disorder being
measured. The MCMI-III was scored using NCS and Pearson Assessment’s computerized
scoring program Microtest-Q, which calculates the following the scales used in this study. 4
Modifying Indices (used for exclusion criteria), 7 Clinical Syndromes scales, and 3 Severe
Clinical Syndromes scales.
Clinical Syndromes Scales (Millon, Millon, Davis, & Grossman, 2009). These scales
measure common Axis I clinical syndromes, which are viewed as embedded within the context
42
of a client’s basic personality pattern. Axis I clinical syndrome scales are particular to
descriptions of pathology, such as depression and mania. These scales are typically used on the
MCMI-III to enhance diagnostic indicators of the MCMI-III Axis II scales.
Severe Clinical Syndromes Scales. These scales, similar to the Clinical Syndromes
Scales, measure markedly severe Axis I clinical syndromes. For example, depression in the
clinical syndrome scales is enhance by severe depression indicators grouped in this category.
Refer to Appendix B for de-identified sample profiles of the MMPI-2 RF HO Scales and the,
MMPI-2-RC scales, and the MCMI-III scales.
Procedure
All subjects completed the MMPI-2 and the MCMI-III during their inpatient hospital stay
as part of a psychological assessment; respondents typically took the assessments during one
administration period. A Licensed Psychologist or a Psychology Intern provided each patient
with written and verbal instructions prior to testing and each test was scored using Microtest-Q.
In the analysis, only valid test results were included. Any tests that were shown to be invalid due
to inconsistent item endorsement, under-reporting, or over-reporting of psychopathology by a
patient were excluded from this study (Arbisi & Ben-Porath, 1998; Ladd, 1998). Though the F
scale was often used to establish invalidity due to patient exaggeration of symptoms, inpatients
with serious psychopathology often earn high scores (Graham, 2003, 2006); therefore, no F
cutoff was set. Additionally, the L scale was designed to detect attempts by patients to under
report symptoms (Greene, 2011). In the current sample high L scale scores were rare (15 cases
with L T-scores >75), therefore no cutoff was set. MMPI-2 profiles with VRIN raw
scores > 13,TRIN raw scores <5 or >13, Fp T scores >100, and Cannot Say raw scores >32, as
43
well as MCMI-III profiles with 2 or more items endorsed on the scale V were excluded from
analysis (Graham, 2003 & 2006; Morgan, Schoenberg, Dorr, & Burke, 2002).
Statistical Analysis
The MCMI-III Axis I scales were factor analyzed. From this analysis, three weighted
factor scores were derived and labeled as our working “higher order” scales for the MCMI.
These factor score correlations were then compared with the MMPI-2-RF Higher Order scales;
inter-correlations were examined for significance.
Finally, a canonical correlation was run to examine the dimensionality of the higher order
scales in relation to the derived factor scores for the MCMI Axis I scales.
Sherry and Hanson (2005) explain canonical correlation analysis (CCA) as a statistical
procedure, which often has the same aim as multiple regression within the General Linear Mode
(GLM). Much like in a standard multiple regression, canonical correlation shows the relationship
between two sets of variables. The researchers suggest that one set of variables may be thought
of as a predictor variable and another set as criterion variables. Canonical analysis creates a
synthetic variable, comprised of common variance among each set, and compares these synthetic
variables to each other. The result is a simple Pearson correlation coefficient. Each correlation
coefficient is known as a canonical function and there will be as many functions as there are the
smallest number of variables in a set (e.g., comparing five items to three items will produce three
functions).
A canonical analysis was performed comparing the three higher order scales to the
derived factor scores for the MCMI-II Axis I scales. Essentially, we examined shared variance
by exploring the overlap in dimensions among the two sets. This procedure provides convergent

44
validity for the HO scales as well as validates the presence of HO dimensions on the Axis I
scales.

45
CHAPTER 4
RESULTS
Patterns of inter-correlation among the MCMI-III Clinical Scales are shown in Appendix
A. The coefficients above the diagonal are based on the sample used in this study and those
below are from the normative group. Of the 45 pairs of coefficients 11 deviate more than .10, 7
deviate more than .15 and 4 deviate more than .20. Overall the patterns of co-variation in the
present sample and the normative sample are reasonably similar. This suggests that the variables
used in this study are likely supported by the body of normative data. Appendix A lists relevant
scale intercorrelations for this study.
Principle component analysis was initially used to assess the dimensionality of the
MCMI-III Clinical Scales in this sample. Principle axis factoring utilizing promax (oblique)
rotations was then used to develop MCMI-III second order factor scales more or less analogous
to the Higher Order scales of the MMPI-2-RF. Kaiser-Guttman, Cattell Scree Tests, (shown in
Appendix C), applied parallel analysis and minimum average parcel (MAP, Velicer, 1976) were
used to determine how many factors to rotate. The combination of these techniques suggested
rotating three factors.
Prior to rotation, three factors were extracted which accounted for 82.5% of the total
variance. Two, four, and five factors were also rotated. The pattern matrix for the three factor
solution appears in Table 4 and the factor correlations matrix appears in Table 4.1.
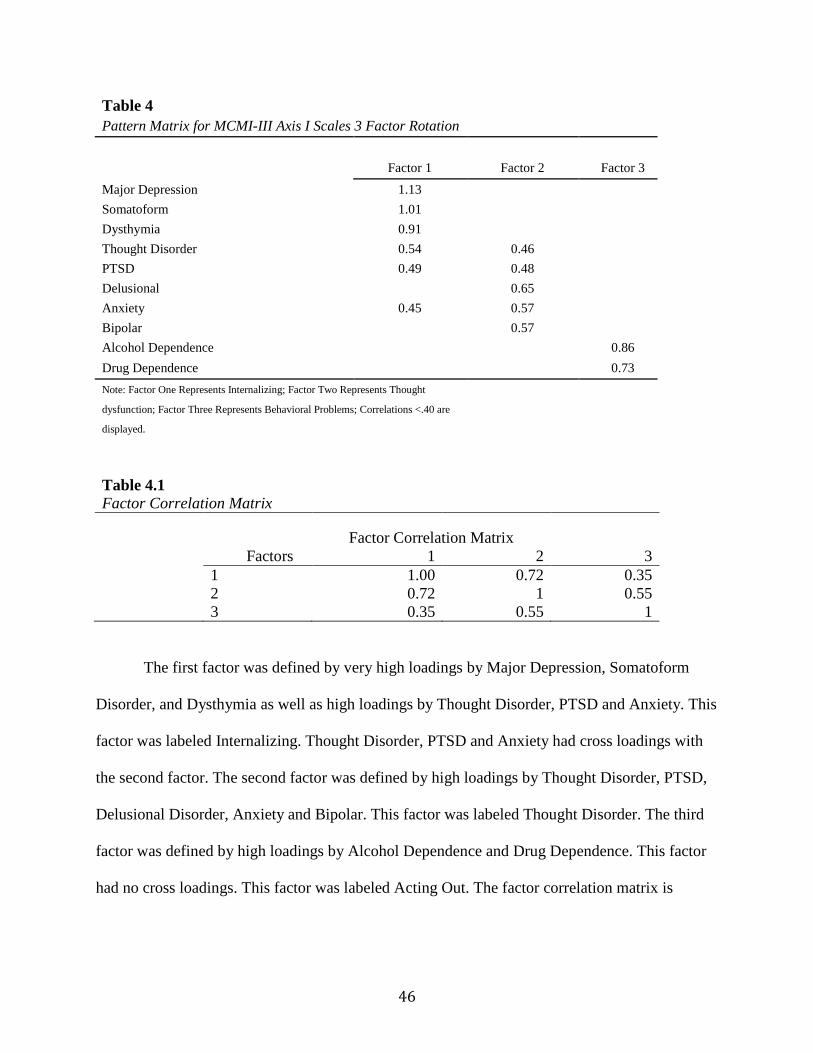
46
Table 4 Pattern Matrix for MCMI-III Axis I Scales 3 Factor Rotation
Factor 1 Factor 2 Factor 3 Major Depression 1.13
Somatoform 1.01
Dysthymia 0.91
Thought Disorder 0.54 0.46
PTSD 0.49 0.48
Delusional
0.65
Anxiety 0.45 0.57
Bipolar
0.57
Alcohol Dependence
0.86
Drug Dependence 0.73 Note: Factor One Represents Internalizing; Factor Two Represents Thought
dysfunction; Factor Three Represents Behavioral Problems; Correlations <.40 are
displayed.
Table 4.1 Factor Correlation Matrix
Factor Correlation Matrix
Factors 1 2 3
1 1.00 0.72 0.35
2 0.72 1 0.55
3 0.35 0.55 1
The first factor was defined by very high loadings by Major Depression, Somatoform
Disorder, and Dysthymia as well as high loadings by Thought Disorder, PTSD and Anxiety. This
factor was labeled Internalizing. Thought Disorder, PTSD and Anxiety had cross loadings with
the second factor. The second factor was defined by high loadings by Thought Disorder, PTSD,
Delusional Disorder, Anxiety and Bipolar. This factor was labeled Thought Disorder. The third
factor was defined by high loadings by Alcohol Dependence and Drug Dependence. This factor
had no cross loadings. This factor was labeled Acting Out. The factor correlation matrix is
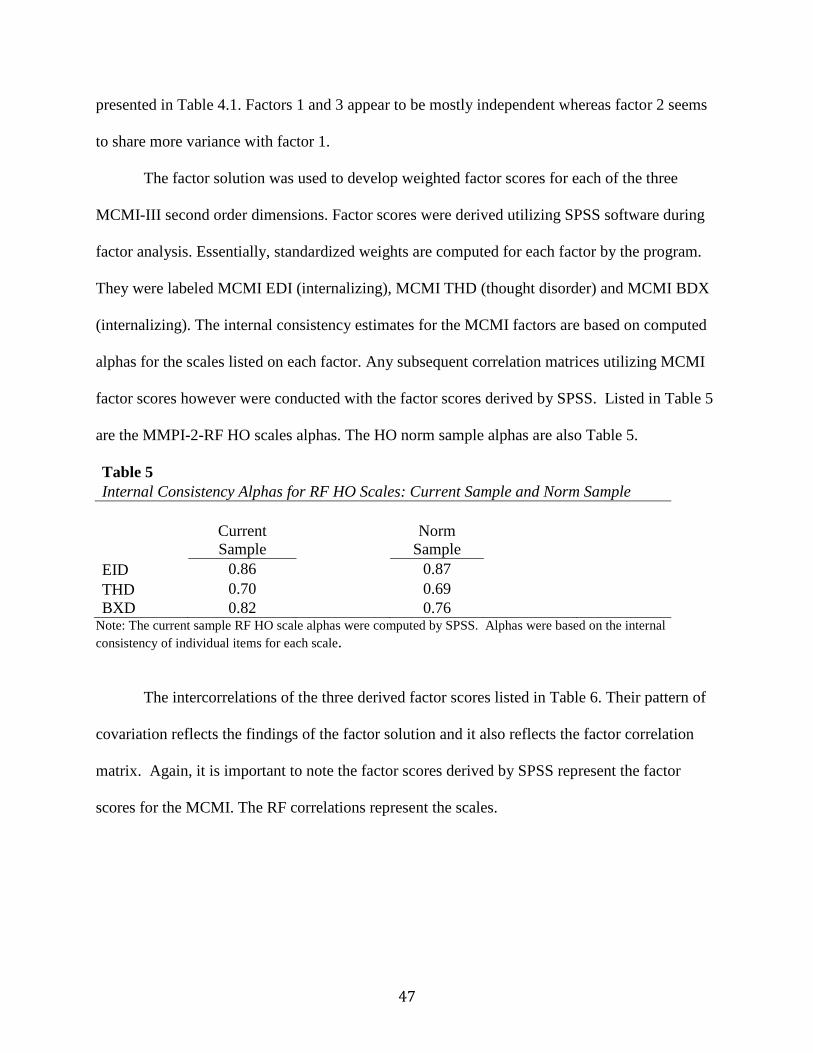
47
presented in Table 4.1. Factors 1 and 3 appear to be mostly independent whereas factor 2 seems
to share more variance with factor 1.
The factor solution was used to develop weighted factor scores for each of the three
MCMI-III second order dimensions. Factor scores were derived utilizing SPSS software during
factor analysis. Essentially, standardized weights are computed for each factor by the program.
They were labeled MCMI EDI (internalizing), MCMI THD (thought disorder) and MCMI BDX
(internalizing). The internal consistency estimates for the MCMI factors are based on computed
alphas for the scales listed on each factor. Any subsequent correlation matrices utilizing MCMI
factor scores however were conducted with the factor scores derived by SPSS. Listed in Table 5
are the MMPI-2-RF HO scales alphas. The HO norm sample alphas are also Table 5.
Table 5 Internal Consistency Alphas for RF HO Scales: Current Sample and Norm Sample
Current Sample
Norm Sample
EID 0.86 0.87 THD 0.70 0.69 BXD 0.82 0.76
Note: The current sample RF HO scale alphas were computed by SPSS. Alphas were based on the internal consistency of individual items for each scale.
The intercorrelations of the three derived factor scores listed in Table 6. Their pattern of
covariation reflects the findings of the factor solution and it also reflects the factor correlation
matrix. Again, it is important to note the factor scores derived by SPSS represent the factor
scores for the MCMI. The RF correlations represent the scales.

48
Table 6 MCMI Factor Score Intercorrelations
MCMI EID MCMI THD MCMI BXD MCMI EID 1 0.75 0.39 MCMI THD 0.75 1 0.61 MCMI BXD 0.39 0.61 1
Table 7 shows the correlations between the MCMI higher order factor scores and the
MMPI-2-RF Higher order scales. This matrix reveals high convergence between the MMPI-2-RF
Higher Order scales and those developed for the MCMI-III in this stud for EID and BXD. The
THD dimension reflects less orthogonality.
Table 7 Correlations of RF HO Scales with MCMI Factor Scores
MCMI EID MCMI THD MCMI BXD RF EID 0.83 0.65 0.34 RF THD 0.38 0.52 0.22 RF BXD 0.21 0.45 0.7
Table 8 lists the correlations of the new MCMI higher order factor scales with the
MCMI-III Axis I scales. Visual inspection of the pattern of coefficient suggests that it parallels
the results of the three factor pattern matrix
Table 8 MCMI Factor Scores Correlated with MCMI Axis I Scales
MCMI EID MCMI THD MCMI BXD Anxiety 0.84 0.90 0.44 Somatoform 0.89 0.59 0.25 Bipolar 0.40 0.65 0.52 Dysthymic 0.94 0.73 0.40 Alcohol Dependence 0.36 0.50 0.94 Drug Dependence 0.26 0.51 0.86 Post Traumatic Stress 0.84 0.87 0.47 Thought Disorder 0.88 0.90 0.51 Major Depression 0.98 0.62 0.33 Delusional Disorder 0.32 0.57 0.33
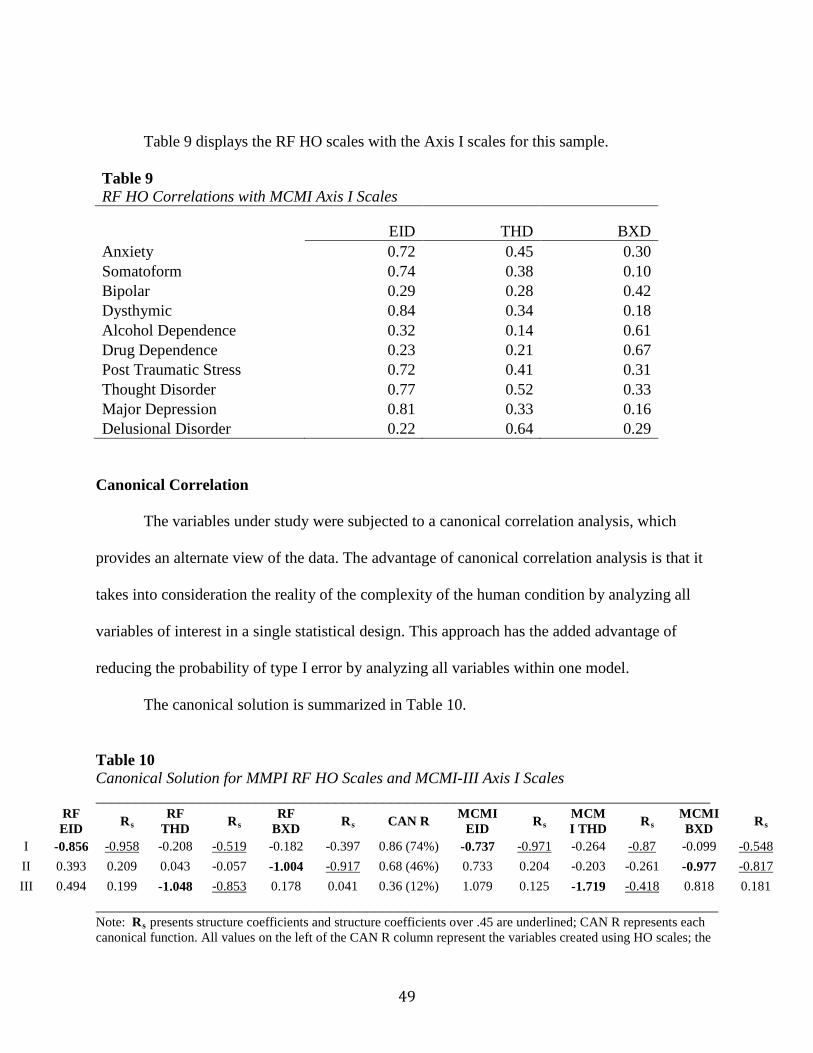
49
Table 9 displays the RF HO scales with the Axis I scales for this sample.
Table 9 RF HO Correlations with MCMI Axis I Scales
EID THD BXD Anxiety 0.72 0.45 0.30 Somatoform 0.74 0.38 0.10 Bipolar 0.29 0.28 0.42 Dysthymic 0.84 0.34 0.18 Alcohol Dependence 0.32 0.14 0.61 Drug Dependence 0.23 0.21 0.67 Post Traumatic Stress 0.72 0.41 0.31 Thought Disorder 0.77 0.52 0.33 Major Depression 0.81 0.33 0.16 Delusional Disorder 0.22 0.64 0.29
Canonical Correlation
The variables under study were subjected to a canonical correlation analysis, which
provides an alternate view of the data. The advantage of canonical correlation analysis is that it
takes into consideration the reality of the complexity of the human condition by analyzing all
variables of interest in a single statistical design. This approach has the added advantage of
reducing the probability of type I error by analyzing all variables within one model.
The canonical solution is summarized in Table 10.
Table 10 Canonical Solution for MMPI RF HO Scales and MCMI-III Axis I Scales _____________________________________________________________________________
RF EID Rs
RF THD Rs
RF BXD Rs CAN R MCMI
EID Rs MCMI THD Rs
MCMI BXD Rs
I -0.856 -0.958 -0.208 -0.519 -0.182 -0.397 0.86 (74%) -0.737 -0.971 -0.264 -0.87 -0.099 -0.548 II 0.393 0.209 0.043 -0.057 -1.004 -0.917 0.68 (46%) 0.733 0.204 -0.203 -0.261 -0.977 -0.817 III 0.494 0.199 -1.048 -0.853 0.178 0.041 0.36 (12%) 1.079 0.125 -1.719 -0.418 0.818 0.181
______________________________________________________________________________ Note: Rs presents structure coefficients and structure coefficients over .45 are underlined; CAN R represents each canonical function. All values on the left of the CAN R column represent the variables created using HO scales; the

50
right side represents variables created by the MCMI Axis one scales. Values which represent dimensional overlap for each function are in bold.
Table 10.1 Statistical Significance of Each Canonical Function
Wilk's Chi Square DF Sig 0.12 858.70 9 p<.001 0.46 310.03 4 p<.001 0.86 57.250 1 P<.001
The canonical analysis yielded three functions. The variance explained by each pair of
canonical variates which are orthogonal to each other explains a portion of the available
variance. The first canonical correlation was .86 (74% of shared variance), the second.68 (.46%
of shared variance) and the third.36 (.12% shared variance). Using Wilk’s criteria, displayed in
Table 10.1, each canonical function was a statistically significant contributor to the model
The first canonical function is unambiguously define by very high structure coefficients
by MMIP-2-RF EID (-.958 ) and MCMI EDI (-.971). The solution is very clean with no cross
loadings. The second canonical function is unambiguously defined by very high structure
coefficients by MMPI-2-RF BDX (-.917) and MCMI BDX (-.817). The third canonical function
is defined by a very high structure coefficient by MMPI-2-RF THD (-.853) and a moderately
high structure coefficient by MCMI THD (-.418).
51
CHAPTER 5
DISCUSSION
This study examined the link between the new MMPI-2-RF Higher Order scales and a set
of second order factor scores derived from factor analyzing the Axis I scales of the MCMI-III in
a sample of psychiatric inpatients. The patterns of covariation among the scales obtained in this
sample were similar to the parallel patterns in the normative group. The Axis I scales of the
MCMI-III were factored using principle component analysis initially and then principle axis
factoring utilizing promax (oblique) rotations. The various means of determining the number of
factors to rotate let to a three factor solution which accounted for 82.5% of the total variance.
The three factors were labeled internalizing, thought disorder and externalizing. Using this factor
solution weighted factor scores were developed for each of the dimensions of the MCMI-III Axis
I scales which were named MCMI-III EID (internalizing), MCMI-III THD (thought disorder)
and MCMI-III BXD (externalizing).
The three MCMI-III factor scores were then correlated with the corresponding MMPI-2-
RF Higher Order scale and their relationship was also studied with canonical correlation
analysis. These analyses revealed a considerable degree of convergent validity for the
internalizing and externalizing and a lesser but viable degree of convergent validity for the
thought disorder construct.
It is important to recognize that although both of the instruments used in this study are
self reports in nature they are also very dissimilar. The MMPI is an ancient instrument that was
originally created via the use of criterion keying. The only theory that guided its construction
was the prevailing psychiatric diagnostic system of the day which was in its infancy. The MCMI
was intentionally based on a highly systematized theory of personality and psychopathology that,

52
itself, was lodged in the much older sciences of physics and biology. From their very beginning,
the items and the scales of the Millon were consciously linked to elements of his theory as well
as grounded in sound psychometric theory. Additionally, the MMPI items and scales were
developed to address what we call today Axis I phenomena. The Millon scales were originally
specifically designed to assess Axis II pathology with the Axis I scales added for the
convenience of the clinicians using the scales. Thus, although the two sets of measures are not as
different from each other as, say a projective technique and a questionnaire, it is reasonable to
say that they differ on many dimensions and qualities as well. As such, a comparison of the
patterns of covariation of the two instruments can be used as a reliable gage of convergence in
the multitrait-multimethod sense. The finding that the two sets of three measures of three
constructs are highly related provides us with credible evidence of construct validity. The pattern
of the findings of the canonical analysis nicely demonstrates how the method can be an elegant
way to test for construct validity. And it is a method that is much more parsimonious than the
series of statistical tests of significance that one must use in the Campbell and Fiske method.
The MMPI-2-RF Higher Order scales are very new in the scheme of psychological
testing of psychopathology, appearing just five years ago. No one has ever published higher
order scales for the MCMI-III. The ones used in this dissertation are the first ones known to this
writer. However, as is the case with the Higher Order scales they are based on years of research
on the parent instrument. Hence, at the least we have here a concurrent validity study. And as
argued in the previous paragraph we also have strong evidence of construct validity.
Obviously the evidence for construct validity is higher form the internalizing and
externalizing constructs than for the thought disorder. This is not surprising. In the first place the
internalizing and externalizing constructs have been recognized in the empirical literature since
53
Cattell (1945) was conducting the first explorations of what eventually became the Big Five.
Further, in his recent (2012) text on the RF Ben-Porath refers to “A missing construct: Thought
Dysfunction.” (p. 101). In this section he writes “Although understandable in the context of
normal personality inventories, consistent failure of factor-analytic studies of the MMPI/MMPI-
2 and PAI to identify a distinctive dimension related to thought dysfunction is puzzling, given
the inclusion of relevant measures on both inventories.” (p. 101). Never the less, Ben-Porath
believed that assessment of thought disorder is an essential element in an instrument intended to
assess psychosis. Hence, he and Tellegen used items from RC6 and RC8 to construct THD.
Muddying the already muddy waters is the fact that the MCMI-III was originally
intended to measure Axis II pathology and most researchers and practitioners agree that this is
what the instrument does best. As noted above the Axis I scales were included in the various
editions of the Millon scales for the convenience of practicing clinicians. Should we, indeed,
expect the MCMI-III to be the reigning gage of an Axis I disorder such as psychotic thinking?
Add to this picture is the fact that Webster et al. in his many factor solutions of the MCMI-III
(using several different methods) has found that the namesake scale for the thought disorder
construct (Thought Disorder) either loads unambiguously on a factor defined by depression,
demoralization and anxiety or it cross loads on this dimension and on a factor defined by
delusion as it did in the present analysis. Webster has never found that the Thought Disorder
scale loads unambiguously and exclusively on a factor defined only by psychotic like scales.
Therefore, in view of the tentativeness of Ben-Porath’s assertions about a thought
disorder factor on the MMPI-2-RF and our consistent findings that the Millon Thought Disorder
itself has a tenuous relationship with a psychotic thinking like factor, it is not surprising that the
54
strength of the covariation between the RF THD and MCMI THD higher order scales are less
than robust.
Limitations
Although 440 psychiatric inpatients constitutes a reasonably large sample, it is small
when one is attempting to identify universal hierarchical dimensions of psychopathology. The
MMPI-2-RF Higher Order scales were developed using the MMPI-2 restandardization stratified
sample of 2600 persons and included 1138 women and 1462 men. The MMPI-2 stratified
sample included non-patients, out-patients and in-patients. The MCMI-III was renormed in 2009
and this renorming was also done with a large stratified sample. The MCMI-III was normed on
out-patients and in-patients. To be consistent with Millon’s intentions no non-patients were used.
The MCMI-III higher order scales were derived from the present sample of 440 psychiatric
inpatients. Obviously, caution must be used in extrapolating the findings of this study to the
population.
The MCMI-III BXD factor was defined by high loadings by the Alcohol and Drug
Dependence scales. The scale that was developed on the basis of this finding was labeled Acting
Out. It could be argued that a more accurate name for the scale might be Substance Abuse. This
might be a reasonable alternate name for the scale. However, because the intent of the study was
to help determine if the two instruments under study had similar higher order factors it seemed
reasonable to call this third factor Acting Out. Perhaps a more compelling reason to retain this
Acting Out label for the MMPI-III is the composition of the Alcohol and Drug items. The
MCMI-III scales are divided into “prototypal” items (which are given a weight of 2) which are
supposed to be at the center of the dimension being measured and “nonprototypal” items (which
are given a weight of 1) which are supposed to be related to the dimension being measured. The
55
alcohol and drug prototypal items directly assess substance abuse. However, both scales have an
even greater number of nonprototypal items that assess acting out, irresponsibility, cruelness,
selfishness, and incorrigible behavior. Finally, the MMPI-2-RF BXD scales contains some
substance abuse items. Because substance abuse is very often accompanied by general acting out
behavior it seemed reasonable, for the purposes of this study, to use the term acting out. Further,
empirical correlates of the RF BXD scale were heavily defined by substance abuse in the norm
sample; the inpatient sample cited in the manual also showed strong correlations with substance
abuse.
Finally, Ben-Porath (2012) summarized the history of dimensional models in personality
assessment. His work was summarized in this paper and the findings presented here add to the
validity of the presence of broad dimensional measures of emotionalizing, acting out, and
thought disorder. The canonical correlation clearly showed the dimensional overlap between the
set of scales and the factor scores and elegantly described the presence of the three factors.
Future Directions
A logical next step based on the findings presented here would be a cross validation study
with a much larger sample. It may be possible to expand the working sample by partnering with
other workers in the field with similar databases. It may prove beneficial to observe the
reliability of the dimensions across inpatient, outpatient, and community samples.
Secondly, it would be beneficial to explore the conceptual frame of “acting out” on the
MCMI-III as defined by substance abuse. As explained under limitations the Alcohol and Drug
Dependence scales contain prototypal and nonprototypal items. The prototypal items specifically
mention alcohol and drugs. The nonprototypal items do not. Millon himself broke three of his
original MCMI scales into two separate scales. For example, the MCMI-III scale Avoidant (2A)
56
and Depressive (2B) were originally one scale. They were subsequently divided into two more
homogenous scales. The question of naming the MCMI-III acting out factor may be answered by
dividing each substance dependence scale into two scales, one representing direct substance
abuse and the second identifying irresponsible impulsive behavior. The prototypal vs.
nonprototypal items may be sorted through item factor analysis, utilizing a larger sample. The
two sets of scales could then be placed in a factor analysis of the MCMI-III Axis I scales, which
would allow an examination of the patterns of loadings. It could then be determined if the
substance abuse and the irresponsibility scales both load on a single factor or break into
something else.
Finally, the combination of factor analysis and canonical correlation proved particularly
insightful for this study. Studies that attempt to describe common dimensionality across
instruments may also benefit from the dual lens of these statistical techniques. Future researchers
may extend this technique to describe commonalities among the RC scales and the specific
problem scales of the MMPI RF with the all of the clinical scales of the MCMI (i.e., Axis I and
Axis II). Because of the ubiquitous tandem use of the two instruments, future research describing
dimensional overlap will prove insightful when conceptualizing Axis I and Axis II pathology
through a three-factor model.

57
REFERENCES
58
Achenbach, T.M. (1966). The classification of children’s psychiatric symptoms: A factor analytic study. Psychological Monographs, 80, 1-37. Achenbach, T. M., & Edelbrock, C.S. (1978). The classification of child psychopathology: A review and analysis of empirical efforts. Psychological Bulletin, 85, 1275-1301. Anastasi, A., & Urbina, S. (1997). Psychological testing (7th Edition). New York: Prentice Hall. Archer, R.P. (2006). A perspective on the Restructured Clinical (RC) Scale project. Journal of Personality Assessment, 87, 179-185. Arbisi, P.A., & Ben-Porath, Y.S. (1998). Characteristics of the MMPI-2 F(p) scale as a function of diagnosis in an inpatient VA sample. Psychological Assessment, 10, 221-228. Blais, M.A. (2010). The common structure of normal personality and psychopathology: Preliminary exploration in a non-patient sample. Journal of Personality and Individual Differences, 48, 322-326. Block, J. (1965). The challenge of response sets. New York: Appoeten-Century-Crofts. Butcher, J.N>, Dahlstrom, W.G., Graham, J.R., Tellegen, A., & Kaemmer, B. (1989). Manual for the restandardized Minnesota Multiphasic Personality Inventory: MMPI-2: An administrative and interpretive guide. Minneapolis: University of Minnesota Press. Jackson, H.J., Rudd, R., Gazis, J., & Edwards, J. (1991). Using the MCMI-I to diagnose personality disorders in inpatients: Axis I/Axis II associations and sex differences. Austrian Psychologist, 26, 37-41. Ladd, J.S. (1998). The F(p) Infrequency-Psychopathology scale with chemically dependent inpatients. Journal of Clinical Psychology, 54, 665-671. Butcher, J.N., Graham, J.R., Kamphuis, J.H., & Rouse, S.V. (2006). Evaluating MMPI-2 research: Considerations for practitioners. In J.N. Butcher (Ed.), MMPI-2: A practitioner's guide (pp. 15-38). Washington, DC: APA. Butcher, J.N., Hamilton, C.K., Rouse, S.V., & Cumella, E.J. (2006). The deconstruction of the Hy scale of MMPI-2: failure of RC3 in measuring somatic symptom expression. Journal of Personality Assessment, 87, 186-192. Butcher, J.N., & Miller, K.B. (2006). Personality assessment in personal injury litigation. In Irving B. Wiener & Allen K. Hess (Eds.), The handbook of forensic psychology, (3rd ed., pp. 140-166). Hoboken, NJ: Wiley. Butcher, J.N., Ones, D.S., & Cullen, M. (2006). Personnel screening with the MMPI-2. In J.N. Butcher (Ed.). MMPI-2: The practioner’s handbook (pp.381-406) Washington, D.C.: American Psychological Association.
59
Ben-Porath, Y. S. (2012). Interpreting the MMPI-2-RF. Minneapolis: University of Minnesota Press. Ben-Porath, Y. S., & Tellegen, A. (2008/2011). MMPI-2-RF (Minnesota Multiphasic Personality Inventory-2 Restructured Form): Manual for administration, scoring, and interpretation. Minneapolis: University of Minnesota Press. Campbell, D.T., & Fiske, D.W. (1959). Convergent and discriminant validation by the multitrait- multimethod matrix. Psychological Bulletin, 56, 81–105. Cattell, R. B. (1946). The description and measurement of personality. Yonkers. NY: World Book. Cattrell, R. B., (1945). The description of personality: Principles and findings in a factor analysis. American Journal of Psychology, 58, 69-90. Cattell, R. B., Eber, H. W., & Tatsuoka, M. M. (1970). The handbook for the Sixteen Personality Factor Questionnaire. Champaign. IL: Institute for Personality and Ability Testing. Choca, J. (2004) Interpretive guide to the Millon Clinical Multiaxial Inventory (3rd Edition). American Psychological Association. Costa, P.T., & McCrae, R.R. (1995). Domains and facets: Hierarchical personality assessment using the revised NEO Personality Inventory. Journal of Personality Assessment, 64, 21- 50. Costa, P.T., Zonderman, A.B., McCrae, R.R., & Williams, R.B. (1992). NEO PI-R professional manual. Odessa, Fl: Psychological Assessment Resources. Cottle, W. C. (1950). A factorial study of the multiphasic, Strong, Kuder, and Bell inventories using a population of adult males. Psychometrika, 15, 25-47. Craig, R.J. (1999). Testimony on the Millon Clinical Multiaxial Inventory: review, commentary, and guidelines. Journal of Personality Assessment, 73, 290–304. Craig, R.J., & Bivens, A. (1998). Factor structure of the MCMI-III. Journal of Personality Assessment, 70, 190–196. Craig, R.J., & Olson, R.E. (1997). Assessing PTSD with the Millon Clinical Multiaxial Inventory-III. Journal of Clinical Psychology, 53, 943–952. Cuevas, L., Garcia, L.F., Aluja, A., & Garcia, O. (2008). Exploratory and confirmatory factorial structure of the MCMI-III personality disorders: Overlapping versus non-overlapping scales. European Journal of Psychiatry, 22, 59-68.
60
Craig, R.J., & Bivens, A. (1998). Factor Structure of the MCMI-III. Journal of Personality Assessment, 70, 190-196. Cronbach, L.J., & Gleser, G.C. (1965). Psychological tests and personnel decisions. (2nd ed). Urbana: University of Illinois Press. Dahlstrom, W.G. (1972). Wither the MMPI? In J.N. Butcher (Ed.) Objective personality assessment: Changing perspectives (pp. 85-115). New York: Academic Press. Dahlstrom, W.G., Graham, J.R., Tellegen, A., Kaemmer, B. (1989). MMPI-2: Minnesota Multiphasic Personality Inventory-2: Manual for administration and scoring. Minneapolis: University of Minnesota Press. Davis, R.D., Wenger, A., & Guzman, A. (1997). Validation of the MCMI-III. In T. Millon (Ed.) The Millon inventories: Clinical and personality assessment (pp. 327–359). New York: Guilford. Digman, J. M. (1979, November). The five major domains of personality variables: Analysis of personality questionnaire data in the light of the five robust factors emerging from studies of rated characteristics. Paper presented at the annual meeting of the Society of Multivariate Experimental Psychology. Los Angeles. Dyer, F.J. (1997). Application of the Millon inventories in forensic psychology. In T. Millon (Ed.) The Millon inventories: Clinical and personality assessment (pp. 124–139) New York: Guilford. Eysenck, H.J. (1970). The Structure of Human Personality (3rd ed.). London, England: Methuen. Eysenck, H.J., & Eysenck, M.W. (1985). Personality and Individual Differences: A Natural Science Approach. New York: Plenum Press. Flynn, P.M., & McMahon, R.C. (1997). MCMI applications in substance abuse. In T. Millon (Ed.), The Millon inventories: Clinical and personality assessment (pp. 1873–190). New York: Guilford. Frank, J.D. (1974). Psychotherapy: The restoration of morale. American Journal of Psychiatry, 131, 271-274. Galton, F. (1888). Co-relations and their measurement. Proceedings of the Royal Society London Series, 45, 135-145. Goldberg, L.R. (1993a). The structure of personality traits: Vertical and horizontal aspects. In D.C. Funder, R. Parke, C. Tomlinson-Keasey & K. Widaman (Eds.). Studying lives through time: Personality and development (pp. 169-188). Washington, DC: American Psychological Association.
61
Goldberg, L.R. (1993b). The structure of phenotypic personality traits. American Psychologist, 48, 26-34. Gondolf, E.W. (1999). MCMI-III results for batterer program participants in four cities: Less “pathological than expected”. Journal of Family Violence, 14, 1–17. Graham, J. R. (2012). MMPI-2: Assessing Personality and Psychopathology (5th ed.). New York: Oxford University Press. Greene, R.L. (2011). MMPI-2/MMPI-2-RF: An Interpretive Manual (3rd ed.). New York: Allyn&Bacon. Graham, J.R., & Butcher, J.N. (March, 1988). Differentiating Schizophrenic and Major Affective Disorder Inpatients with the revised form of the MMPI. Paper presented at the 23rd annual Symposium on Recent Developments in the MMPI, St. Petersburg Beach, FL. Guilford, J.P. (1939). General psychology. New York: Van Nostrans. Hathaway, S.R., & McKinley, J.C. (1940). A multiphasic personality schedule (Minnesota): Construction of the schedule. Journal of Psychology: Interdisciplinary & Applied, 10, 249-254. Hathaway, S.R., & McKinley, J.C. (1943). The Minnesota Multiphasic Personality Inventory Manual. New York: Psychological Corporation. Heyman, G., & Wiersma, E. (1906). Beitrage zur spezillen psychoogie auf grund einer massenunterschung. Zeitschrift fur Psychologie, 43, 81-127. Jackson, D.N. & Messick, S. (1962). Response styles and assessment of psychopathology. In S. Messick & J. Ross (Eds.), Measurement in personality and cognition (pp. 129-155). New York: Wiley Kaplan, S.A., Bradley, J.C., & Ruscher, J.B. (2004). The inhibitory role of cynical disposition in the provision and receipt of social support: The case of the September 11th terrorist attacks. Personality and Individual Differences, 37, 1221-1232. Kassebaum, G.G., Couch, A. S., & Slater, P.E. (1959). The factorial dimensions of the MMPI. Journal of Consulting Psychology, 23, 226-236. Livingston, R.B., Jennings, E., Colotla, V.A., Reynolds, C.R., & Shercliffe, R.J. (2006). MMPI-2 code-type congruence of injured workers. Psychological Assessment, 18, 126-30. Markon, K.E., Krueger, R.F., & Watson, D. (2005). Delineating the structure of normal and abnormal personality: An integrative hierarchical approach. Journal of Personality and Social Psychology, 88, 139-157.
62
McCann, J.T. (1990). A multitrait-multimethod analysis of the MCMI-II clinical syndrome scales. Journal of Personality Assessment, 55, 465–476 McKenna, T., & Butcher, J.N. (1987, April). Continuity of the MMPI with Alcoholics. Paper presented at the 22nd Annual Symposium on Recent Developments in the MMPI, Seattle, WA. Meehl, P.E. (1945). The dynamics of structured personality tests. Journal of Clinical Psychology, 1, 296-303. Megargee, Edwin I. (2006). Using the MMPI-2 in Criminal Justice and Correctional Settings. Minneapolis: University of Minnesota Press. Millimet, C.R. (1970). Manifest anxiety-defensiveness scale: First factor of the MMPI revisited. Psychological Reports, 27, 630-616. Millon, T. (1981). Manual for the Millon Clinical Multiaxial Inventory (MCMI). Minneapolis, MN: National Computer Systems. Millon, T. (1987). Manual for the Millon Clinical Multiaxial Inventory—II (MCMI–II). Minneapolis, MN: National Computer Systems. Millon, T., Davis, R. D., & Millon, C. (1997). Manual for the Millon Clinical Multiaxial Inventory—III (MCMI–III) (2nd ed.). Minneapolis, MN: National Computer Systems. Millon, T., Millon, C., & Davis, R. D. (1994). Manual for the Millon Clinical Multiaxial Inventory—III (MCMI–III). Minneapolis, MN: National Computer Systems. Millon, T., & Millon, C., Davis, R.D., & Grossman, S. (2009). Manual for the Millon Clinical Multiaxial Inventory—III (MCMI–III) (4th ed.). Minneapolis, MN: National Computer Systems. Morgan, C. D., Schoenberg, M. R., Dorr, D. A., & Burke, M. (2002). Over-report on the MCMI– III: Concurrent validation with the MMPI–2 using a psychiatric inpatient sample. Journal of Personality Assessment, 78, 288–300. Morey, L.C. (1996). Personality Assessment Inventory: Professional Manual. Odessa, FL: Psychological Assessment Resources. Nichols, D. (2006). The trials of separating bath water from baby: A review and critique of the MMPI-2 Restructured Clinical Scales. Journal of Personality Assessment, 87, 134-151. O’Connor, B.P. (2002). The search for dimensional structure differences between normality and abnormality: A statistical review of published data on personality and psychopathology. Journal of Personality and Social Psychology, 83, 962-982.
63
Partridge, R.W., Dorr, D., Webster, B. & Rendinell, D. (2010) Linking MMPI-2 Restructured (RC) Scales to MCMI-III Axis I Scales. Poster presented at the Annual Meeting of the American Psychological Association, San Diego, CA Pearson Education Inc. (2007). Assessment for Clinical and Psychological Use. Retrieved June 26, 2007 from Pearson Assessment Webs site: http://www.pearsonassessment.com/resources/rcscales-faqs.htm Pinsoneault, T.B., & Ezzo, F.R. (2012). A comparison of MMPI-2-RF profiles between child maltreatment and non-maltreatment custody cases. Journal of Forensic Psychology Practice, 12, 227 237. Pope, K.S., Butcher, J.N., & Seelen, J. (2006). The MMPI, MMPI-2, and MMPI-A In Court: A Practical Guide for Expert Witnesses and Attorneys (3rd Edition). Washington, DC: American Psychological Association. Retzlaff, P.D., Stoner, J., & Kleinsasser, D. (2002). The use of the MCMI-III in the screening and triage of offenders. International Journal of Offender Therapy and Comparative Criminology, 46, 319-332. Rogers, R., Sewell, K.W., Harrison, K.S., & Jordan, M.J. (2006). The MMPI-2 Restructured Clinical Scales: A paradigmatic shift in scale development. Journal of Personality Assessment, 87, 152-160. Rouse, S. V., Greene, R.L., Butcher, J. N., Nichols, D. S., & Williams, C. L. (2008). What do the MMPI-2 Restructured Clinical Scales reliably measure? Answers from multiple research settings. Journal of Personality Assessment, 90, 435-442. Ruiz, M.A., & Edens, J.F. (2008). Recovery and replication of internalizing and externalizing dimensions within the Personality Assessment Inventory. Journal of Personality Assessment, 90, 585-592. Schutte, J.M. (2001). Using the MCMI-III in forensic evaluations. American Journal of Forensic Psychology, 19, 5-20. Sneyers, M., Sloore, H. Rossi, G., Derksen, J.J. (2007). Using the Megargee system among Belgian prisoners: Cross-cultural prevalence of the MMPI-2 based types. Psychology Representative, 100, 746-54 Sellbom, M., Ben-Porath, Y. S. & Bagby, R. M. (2008). On the hierarchical structure of mood and anxiety disorders: Confirmatory evidence and elaboration of a model of temperament markers. Journal of Abnormal Psychology, 117, 576-590. Sellbom, M., Ben-Porath, Y. S., Graham, J. R., Arbisi, P. A., & Bagby, R. M. (2005). Susceptibility of the MMPI-2 Clinical, Restructured Clinical (RC), and Content Scales to over reporting and underreporting. Assessment, 12, 79-85.

64
Shannon, C. E., & Weaver, W. (1949). The Mathematical Theory of Communication. Urbana, IL: University of Illinois Press. Spearman, C. (1904) “General intelligence”: Objectively determined and measured. The American Journal of Psychology, 15, 201-292. Tellegen, A. (1964). The Minnesota Multiphasic Personality Inventory. In L.E. Abt & B.F. Reiss [Eds.] Progress in clinical psychology [Vol. 6, pp. 30-48]. New York: Grune and Stratton. Tellegen, A., & Ben-Porath, Y. S. (2008/2011). MMPI-2-RF (Minnesota Multiphasic Personality Inventory-2 Restructured Form): Technical manual. Minneapolis: University of Minnesota Press. Tellegen, A., Ben-Porath, Y. S., McNulty, J. L., Arbisi, P. A., Graham, J. R., & Kaemmer, B. (2003). MMPI-2 Restructured Clinical (RC) Scales: Development, validation, and interpretation. Minneapolis: University of Minnesota Press. Tellegen, A., Ben-Porath, Y. S., & Sellbom, M. (2009). Construct validity of the MMPI-2- Restructured Clinical (RC) Scales: Reply to Rouse, Greene, Butcher, Nichols, & Williams. Journal of Personality Assessment, 91, 211-221. Tellegen, A., Ben-Porath, Y. S., Sellbom, M., Arbisi, P. A., McNulty, J. L., & Graham, J. R. (2006). Further evidence on the validity of the MMPI-2 Restructured Clinical (RC) Scales: Addressing questions raised by Rogers et al. and Nichols. Journal of Personality Assessment, 87, 148-171 Tyler, C.B. (1951). A factorial analysis of fifteen MMPI scales. Journal of Consulting Psychology, 15, 541-546. Vereycken, J., Vertommen, H., & Corveleyn, J. (2002). Authority conflicts and personality disorders. Journal of Personality Disorders, 16, 41-51. Watson, D., & Tellegen, A. (1985). Toward a consensual structure of mood. Psychological Bulletin, 98, 219-235. Webster, B., Latronica, B., Partridge, R.W., Dorr, D. & Morgan, C.D. (2011). The Multidimensionality of the MMMPI-2 RC Scales: A Factor Analysis with an Inpatient Setting. Poster presented at the Annual Meeting of the Society for Personality Assessment, Boston, MA. Webster, B., Partridge, R.W., Dorr, D. & Morgan, C.D. (2010) Relationship of MMPI-2 Restructured Format (RF) Higher Order Scales to MCMI-III Axis I Scales. Poster presented at the Annual Meeting of the American Psychological Association, San Diego, CA.
65
Welsh, G.S. (1956). Factor dimensions A and R. In G. S. Welsh & W. G. Dahlstrom (Eds.), Basic readings on the MMPI in psychology and medicine. Minneapolis: University of Minnesota Press. Welsh, G.S. (2000). Factor dimensions A and R. In J.N. Butcher (Ed.), Basic Sources on the MMPI-2 (pp. 73-92). Minneapolis: University of Minnesota Press. (Original work published 1956) Wiggins, J.S. (1973). Personality and Prediction: Principles of Personality Assessment. Reading, MA: Addison-Wesley.

66
APPENDICES
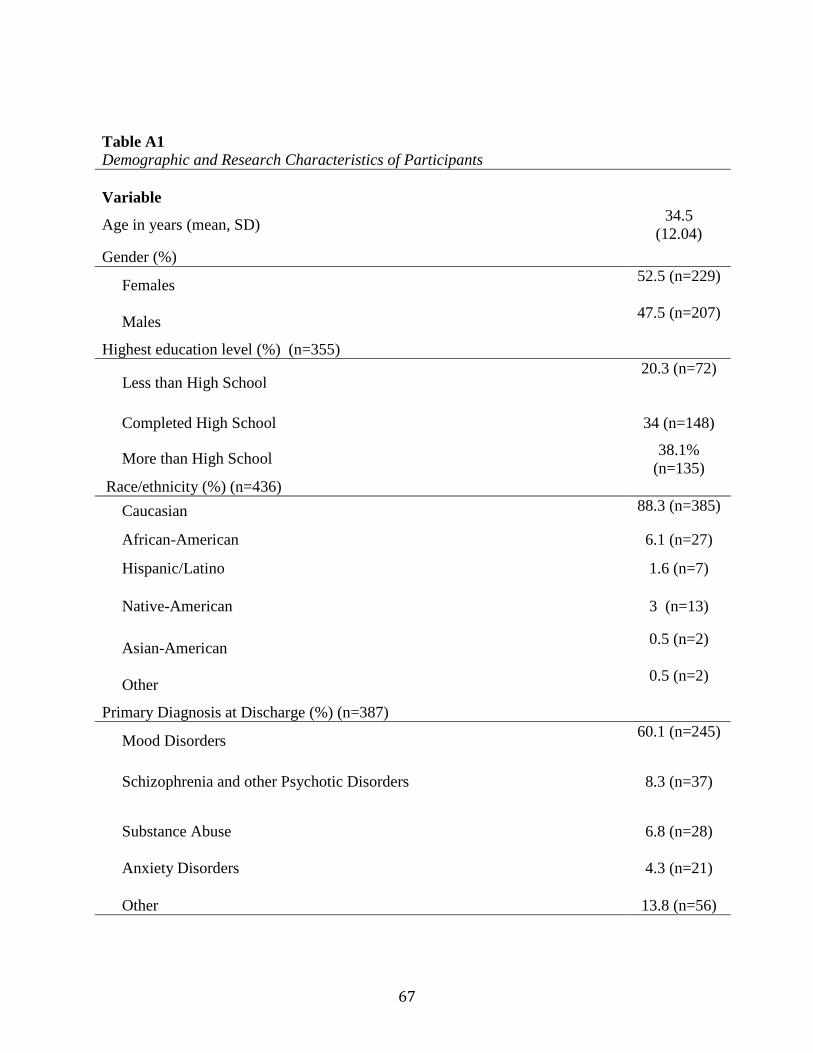
67
Table A1 Demographic and Research Characteristics of Participants
Variable
Age in years (mean, SD) 34.5 (12.04)
Gender (%)
Females 52.5 (n=229)
Males 47.5 (n=207)
Highest education level (%) (n=355)
Less than High School 20.3 (n=72)
Completed High School 34 (n=148)
More than High School 38.1% (n=135)
Race/ethnicity (%) (n=436) Caucasian 88.3 (n=385)
African-American 6.1 (n=27)
Hispanic/Latino 1.6 (n=7)
Native-American 3 (n=13)
Asian-American 0.5 (n=2)
Other 0.5 (n=2)
Primary Diagnosis at Discharge (%) (n=387)
Mood Disorders 60.1 (n=245)
Schizophrenia and other Psychotic Disorders 8.3 (n=37)
Substance Abuse 6.8 (n=28)
Anxiety Disorders 4.3 (n=21)
Other 13.8 (n=56)
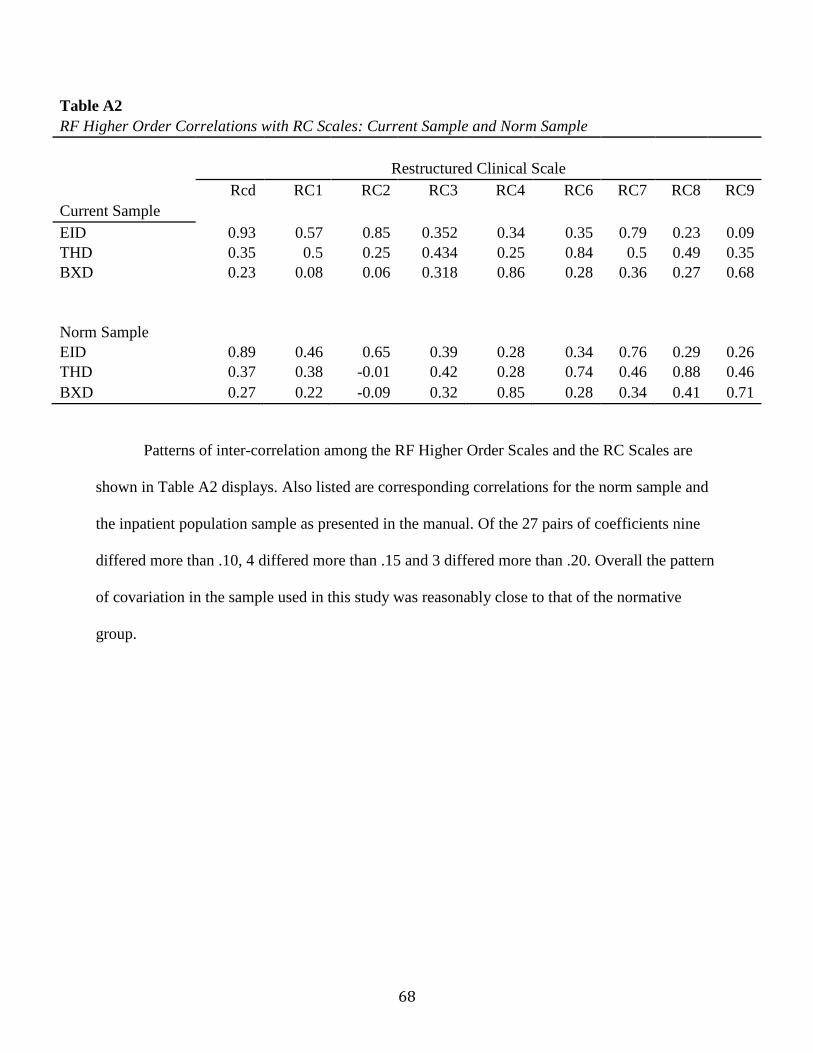
68
Table A2 RF Higher Order Correlations with RC Scales: Current Sample and Norm Sample
Restructured Clinical Scale
Rcd RC1 RC2 RC3 RC4 RC6 RC7 RC8 RC9
Current Sample EID 0.93 0.57 0.85 0.352 0.34 0.35 0.79 0.23 0.09
THD 0.35 0.5 0.25 0.434 0.25 0.84 0.5 0.49 0.35 BXD 0.23 0.08 0.06 0.318 0.86 0.28 0.36 0.27 0.68
Norm Sample
EID 0.89 0.46 0.65 0.39 0.28 0.34 0.76 0.29 0.26 THD 0.37 0.38 -0.01 0.42 0.28 0.74 0.46 0.88 0.46 BXD 0.27 0.22 -0.09 0.32 0.85 0.28 0.34 0.41 0.71
Patterns of inter-correlation among the RF Higher Order Scales and the RC Scales are
shown in Table A2 displays. Also listed are corresponding correlations for the norm sample and
the inpatient population sample as presented in the manual. Of the 27 pairs of coefficients nine
differed more than .10, 4 differed more than .15 and 3 differed more than .20. Overall the pattern
of covariation in the sample used in this study was reasonably close to that of the normative
group.
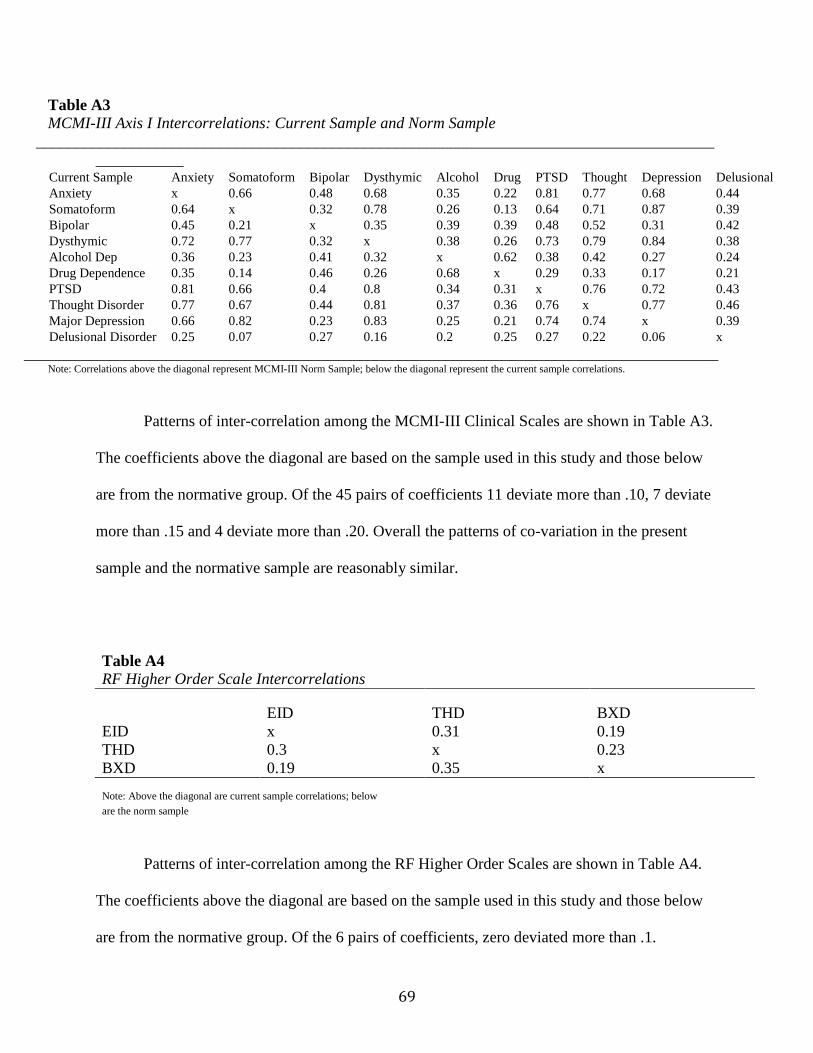
69
Table A3 MCMI-III Axis I Intercorrelations: Current Sample and Norm Sample
________________________________________________________________________________________________
Current Sample Anxiety Somatoform Bipolar Dysthymic Alcohol Drug PTSD Thought Depression Delusional Anxiety x 0.66 0.48 0.68 0.35 0.22 0.81 0.77 0.68 0.44 Somatoform 0.64 x 0.32 0.78 0.26 0.13 0.64 0.71 0.87 0.39 Bipolar 0.45 0.21 x 0.35 0.39 0.39 0.48 0.52 0.31 0.42 Dysthymic 0.72 0.77 0.32 x 0.38 0.26 0.73 0.79 0.84 0.38 Alcohol Dep 0.36 0.23 0.41 0.32 x 0.62 0.38 0.42 0.27 0.24 Drug Dependence 0.35 0.14 0.46 0.26 0.68 x 0.29 0.33 0.17 0.21 PTSD 0.81 0.66 0.4 0.8 0.34 0.31 x 0.76 0.72 0.43 Thought Disorder 0.77 0.67 0.44 0.81 0.37 0.36 0.76 x 0.77 0.46 Major Depression 0.66 0.82 0.23 0.83 0.25 0.21 0.74 0.74 x 0.39 Delusional Disorder 0.25 0.07 0.27 0.16 0.2 0.25 0.27 0.22 0.06 x
_______________________________________________________________________________________ Note: Correlations above the diagonal represent MCMI-III Norm Sample; below the diagonal represent the current sample correlations.
Patterns of inter-correlation among the MCMI-III Clinical Scales are shown in Table A3.
The coefficients above the diagonal are based on the sample used in this study and those below
are from the normative group. Of the 45 pairs of coefficients 11 deviate more than .10, 7 deviate
more than .15 and 4 deviate more than .20. Overall the patterns of co-variation in the present
sample and the normative sample are reasonably similar.
Table A4
RF Higher Order Scale Intercorrelations
EID THD BXD EID x 0.31 0.19 THD 0.3 x 0.23 BXD 0.19 0.35 x Note: Above the diagonal are current sample correlations; below are the norm sample
Patterns of inter-correlation among the RF Higher Order Scales are shown in Table A4.
The coefficients above the diagonal are based on the sample used in this study and those below
are from the normative group. Of the 6 pairs of coefficients, zero deviated more than .1.
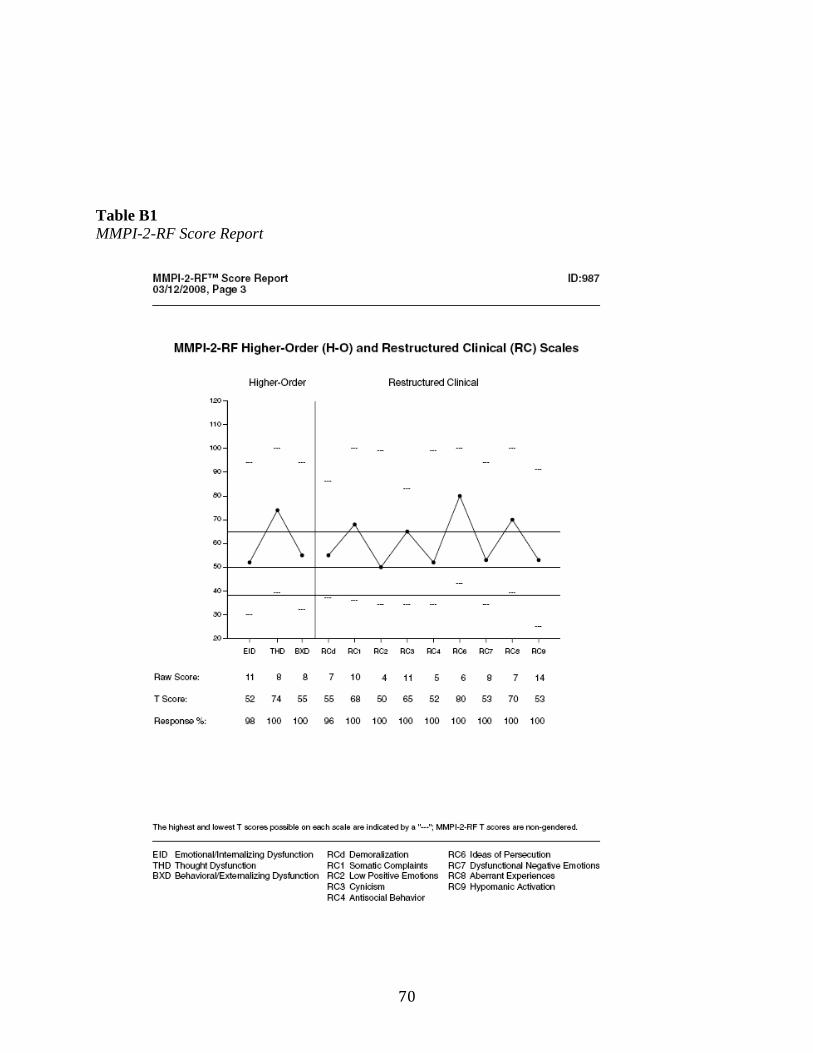
70
Table B1 MMPI-2-RF Score Report
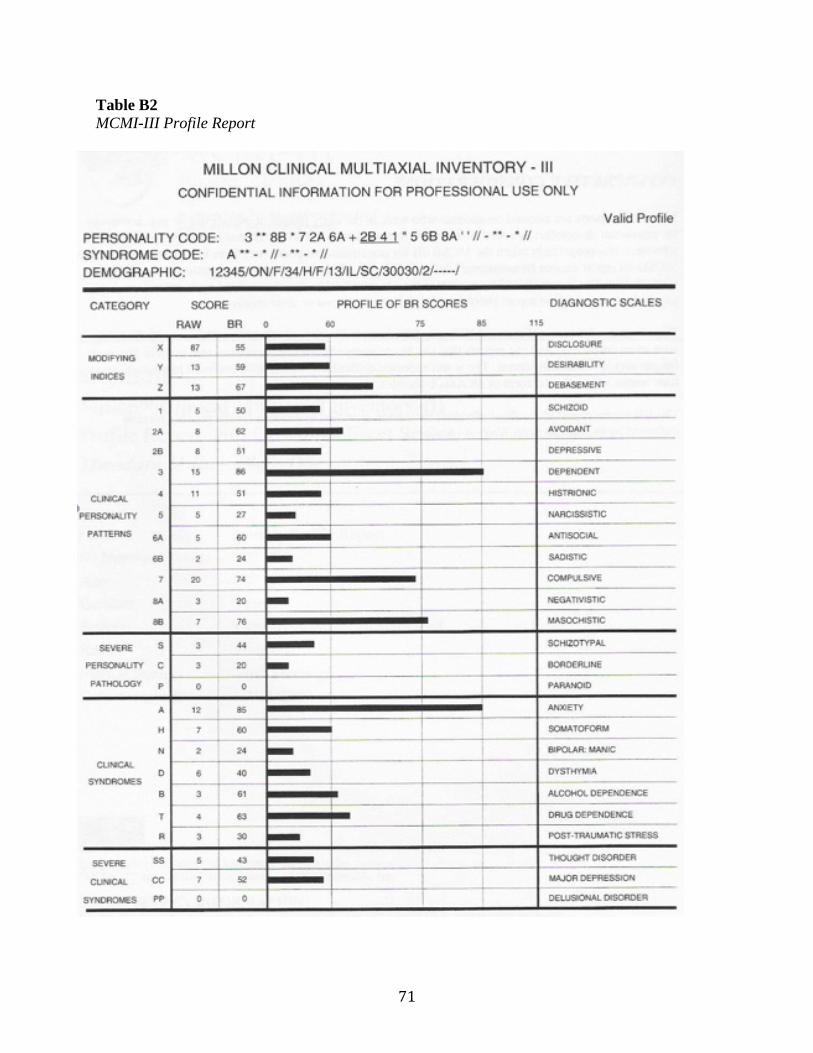
71
Table B2 MCMI-III Profile Report
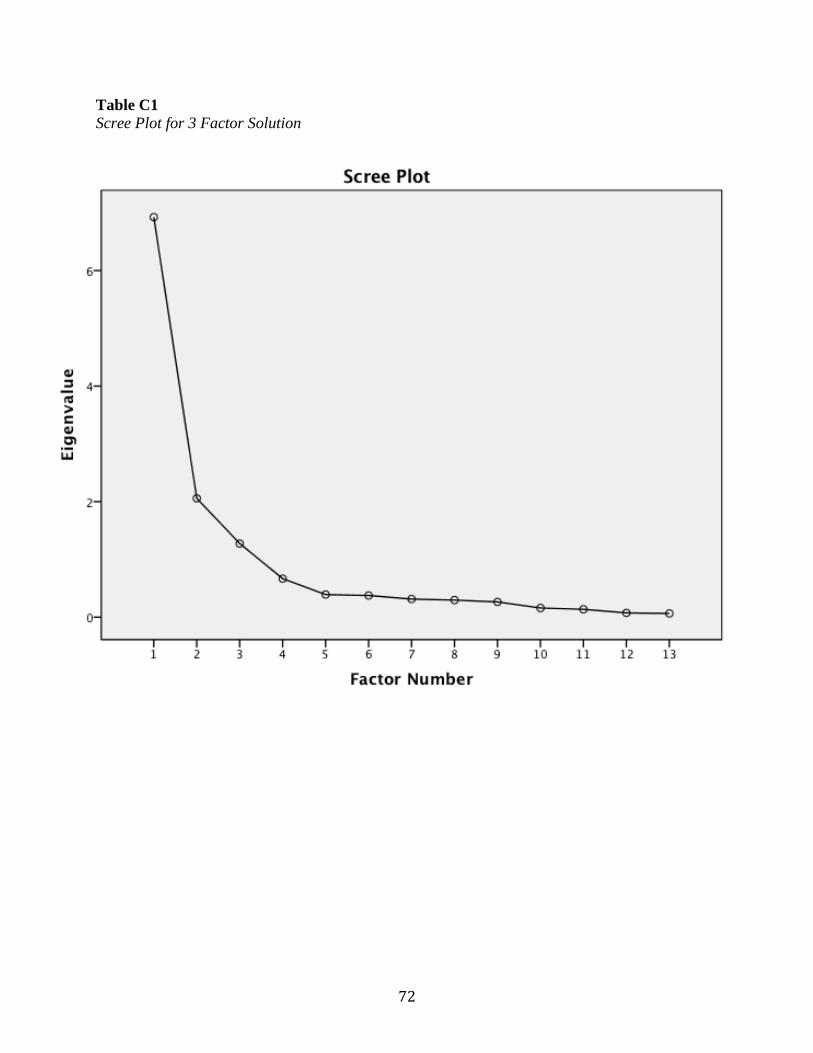
72
Table C1 Scree Plot for 3 Factor Solution