linking the signaling cascades and dynamic …sb.cs.cmu.edu/sdrem//files/sdrem_supplement.pdf ·...
TRANSCRIPT

1
Linking the Signaling Cascades and Dynamic Regulatory
Networks Controlling Stress Responses
Anthony Gitter, Miri Carmi, Naama Barkai, and Ziv Bar-Joseph
Supplementary Information
Supplementary Results 2
Short model details and support 2
HOG gold standard 9
Long model details and support 13
Comparison to HOG pathway literature 19
Microscopy and FACS 21
Extended discussion of knockout results 24
Confirmation of TF activity timing 30
Literature support for validated proteins 31
MAPK pathway cross-talk 33
Target of rapamycin (TOR) model 34
Arabidopsis thaliana immune response model 42
Physical Network Models and ResponseNet comparison 49
GeneReg comparison 51
Parameter selection and robustness 53
Convergence properties 61
Supplementary Methods 65
DREM modification details 65
Interaction network weighting 67
Osmotic stress data and validation 69
Microscopy 71
Flow cytometry 71
Knockout analysis 72
TOR data and validation 75
Arabidopsis thaliana data, settings, and evaluation 76
Physical Network Models, ResponseNet, and GeneReg settings 76
Supplementary Tables S20 and S21 .xls files
Supplementary References 79

2
Supplementary Results
Short model details and support
Because TFs that are active along a regulatory path are typically active at many splits along that
path, Fig. 2A only displays TFs the first time they are active along a path. Supplementary Fig.
S1 shows the full set of TF annotations for the short model. Supplementary Tables S1 and S2
contain the full set of targets and internal nodes in the short model as well as the external sources
that support them. Our literature search was not exhaustive, and in particular we did not
investigate proteins for which there was already other evidence of HOG pathway involvement.
When SDREM is run on the short expression data and protein-DNA edges are not included in the
interaction network, a smaller network is predicted (Supplementary Fig. S3). Without protein-
DNA edges in the signaling pathways, the predicted TFs and internal nodes still significantly
overlap with the gold standard (p-values 1.03 × 10⁻³
and 1.97 × 10⁻⁶
, respectively). These PPI-
only SDREM predictions were similar to the original predictions with 85% of the PPI-only
predictions appearing in the original model.
3
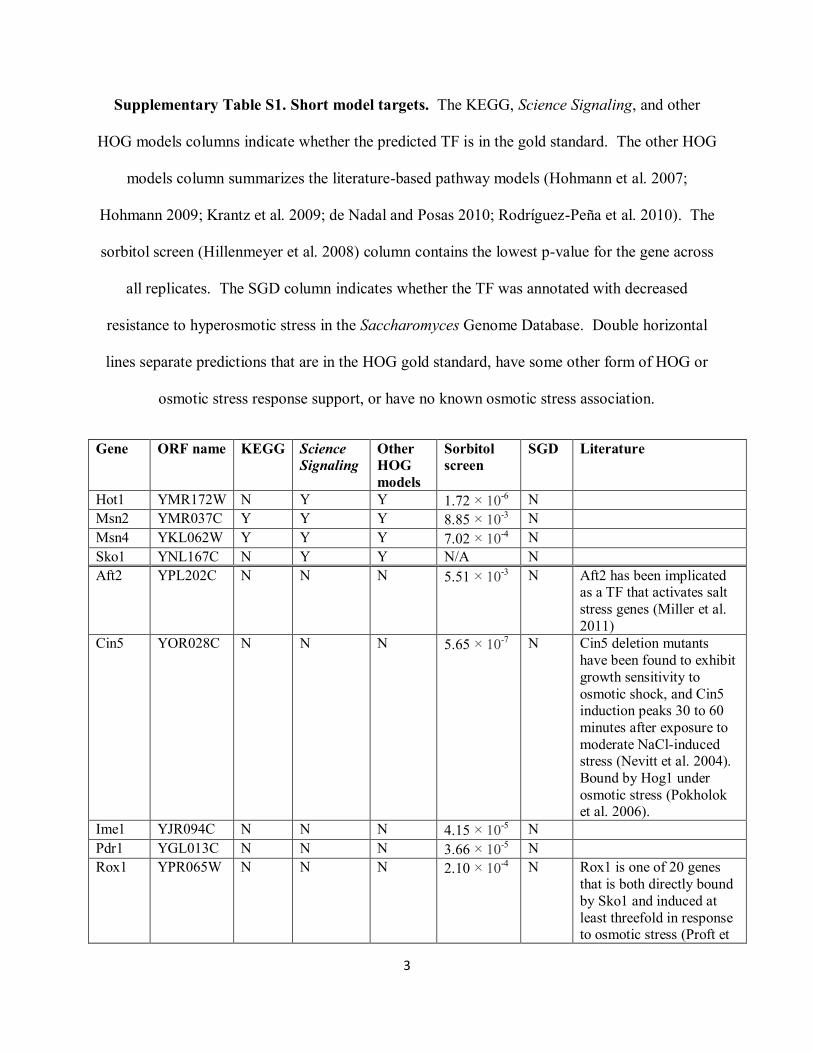
Supplementary Table S1. Short model targets. The KEGG, Science Signaling, and other
HOG models columns indicate whether the predicted TF is in the gold standard. The other HOG
models column summarizes the literature-based pathway models (Hohmann et al. 2007;
Hohmann 2009; Krantz et al. 2009; de Nadal and Posas 2010; Rodríguez-Peña et al. 2010). The
sorbitol screen (Hillenmeyer et al. 2008) column contains the lowest p-value for the gene across
all replicates. The SGD column indicates whether the TF was annotated with decreased
resistance to hyperosmotic stress in the Saccharomyces Genome Database. Double horizontal
lines separate predictions that are in the HOG gold standard, have some other form of HOG or
osmotic stress response support, or have no known osmotic stress association.
Gene ORF name KEGG Science
Signaling
Other
HOG
models
Sorbitol
screen
SGD Literature
Hot1 YMR172W N Y Y 1.72 × 10⁻⁶ N
Msn2 YMR037C Y Y Y 8.85 × 10⁻³ N
Msn4 YKL062W Y Y Y 7.02 × 10⁻⁴ N
Sko1 YNL167C N Y Y N/A N
Aft2 YPL202C N N N 5.51 × 10⁻³ N Aft2 has been implicated
as a TF that activates salt
stress genes (Miller et al.
2011)
Cin5 YOR028C N N N 5.65 × 10⁻⁷ N Cin5 deletion mutants
have been found to exhibit
growth sensitivity to
osmotic shock, and Cin5 induction peaks 30 to 60
minutes after exposure to
moderate NaCl-induced stress (Nevitt et al. 2004).
Bound by Hog1 under
osmotic stress (Pokholok et al. 2006).
Ime1 YJR094C N N N 4.15 × 10⁻⁵ N
Pdr1 YGL013C N N N 3.66 × 10⁻⁵ N
Rox1 YPR065W N N N 2.10 × 10⁻⁴ N Rox1 is one of 20 genes
that is both directly bound
by Sko1 and induced at
least threefold in response to osmotic stress (Proft et

4
al. 2005).
Sok2 YMR016C N N N 7.94 × 10⁻¹¹
Y
Spt23 YKL020C N N N 3.78 × 10⁻¹⁰
N
Yap6 YDR259C N N N 2.13 × 10⁻³ N Yap6 is a TF associated
with osmotic stress response (Ni et al. 2009).
Dig1 YPL049C N N N 3.11 × 10⁻² N
Gts1 YGL181W N N N 2.00 × 10⁻³ N
Phd1 YKL043W N N N 1.94 × 10⁻² N
Rap1 YNL216W N N N N/A N Rap1 may play a role in
regulating ribosomal
protein genes in response to osmotic stress, but not
as significantly as Ifh1
(Wade et al. 2004).
Stb1 YNL309W N N N N/A N
Ste12 YHR084W N N N N/A N When Hog1 or Pbs2 is
deleted Ste12 is activated
by osmotic stress (O‟Rourke et al. 2002).
Swi5 YDR146C N N N 3.89 × 10⁻¹ N

5
Supplementary Table S2. Short model internal nodes. See Supplementary Table S1 for
column descriptions.
Gene ORF name KEGG Science
Signaling
Other
HOG
models
Sorbitol
screen
SGD Literature
Cdc24 YAL041W N N Y N/A N
Hog1 YLR113W Y Y Y 1.00 × 10⁻²⁰
Y
Pbs2 YJL128C Y Y Y 1.00 × 10⁻²⁰
Y
Ste11 YLR362W Y Y Y N/A Y
Ste20 YHL007C Y Y Y 6.33 × 10⁻¹ Y
Ypd1 YDL235C Y Y Y N/A N
Aft1 YGL071W N N N 7.51 × 10⁻¹ Y Aft1 has been implicated
as a TF that activates salt
stress genes (Miller et al. 2011)
Asf1 YJL115W N N N 7.96 × 10⁻¹ N Asf1 reassembles
chromatin following hyperosmotic-stress-
induced transcription
(Klopf et al. 2009).
Bem1 YBR200W N N N 1.00 N Bem1 contributes to Ste20‟s function in the
HOG pathway (Winters
and Pryciak 2005).
Cdc28 YBR160W N N N N/A N Osmotic stress decreases the kinase activity of the
Cln3-Cdc28 complex
(Bellí et al. 2001).
Cks1 YBR135W N N N N/A N Cks1 is salt sensitive (Yu
and Reed 2004).
Cln2 YPL256C N N N 2.15 × 10⁻¹ N Cln2 is downregulated in
osmotic stress conditions (Bellí et al. 2001).
Dig2 YDR480W N N N 2.03 × 10⁻⁵ N
Far1 YJL157C N N N 5.83 × 10⁻⁴ Y
Gal11 YOL051W N N N 1.25 × 10⁻¹ N Deletion of Mediator
complex members
including Gal11 revealed that Mediator is essential
for gene expression in
response to osmotic stress
(Zapater et al. 2007).
Hht1 YBR010W N N N 8.05 × 10⁻⁶ N
Kss1 YGR040W N N N 3.86 × 10⁻³ N Although Kss1 is a
MAPK in the filamentous growth pathway, it can
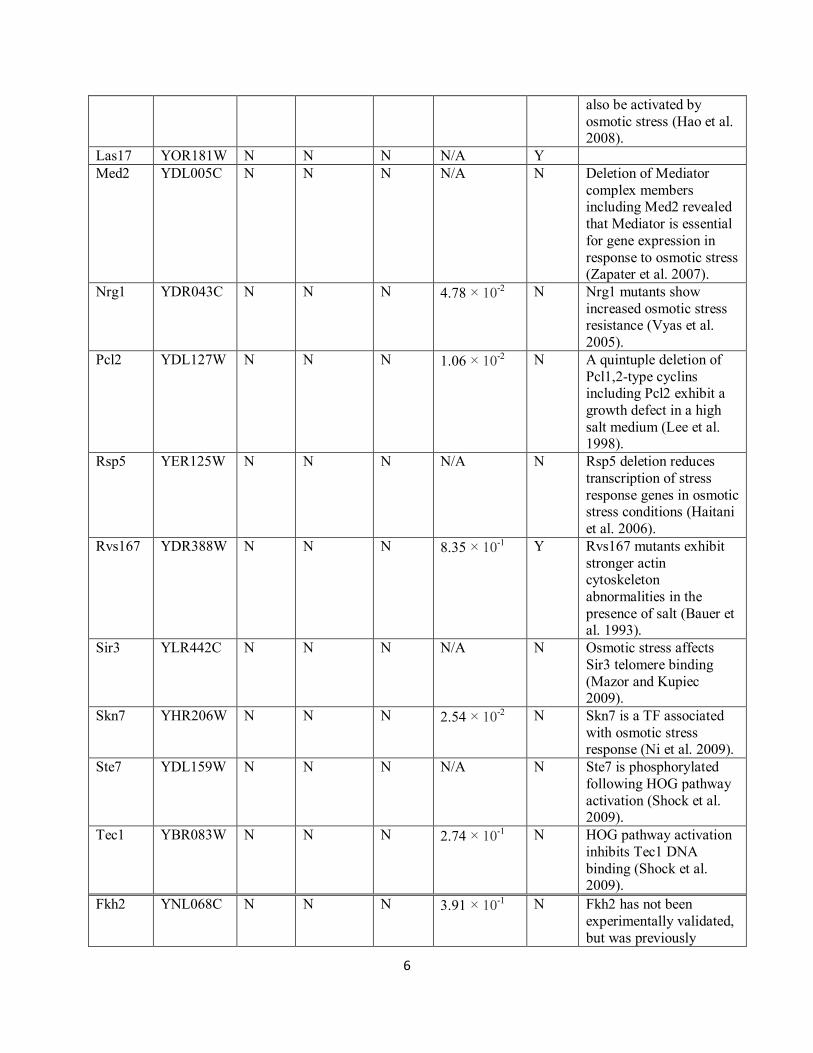
6
also be activated by
osmotic stress (Hao et al. 2008).
Las17 YOR181W N N N N/A Y
Med2 YDL005C N N N N/A N Deletion of Mediator
complex members including Med2 revealed
that Mediator is essential
for gene expression in
response to osmotic stress (Zapater et al. 2007).
Nrg1 YDR043C N N N 4.78 × 10⁻² N Nrg1 mutants show
increased osmotic stress resistance (Vyas et al.
2005).
Pcl2 YDL127W N N N 1.06 × 10⁻² N A quintuple deletion of
Pcl1,2-type cyclins including Pcl2 exhibit a
growth defect in a high
salt medium (Lee et al. 1998).
Rsp5 YER125W N N N N/A N Rsp5 deletion reduces
transcription of stress
response genes in osmotic stress conditions (Haitani
et al. 2006).
Rvs167 YDR388W N N N 8.35 × 10⁻¹ Y Rvs167 mutants exhibit
stronger actin cytoskeleton
abnormalities in the
presence of salt (Bauer et al. 1993).
Sir3 YLR442C N N N N/A N Osmotic stress affects
Sir3 telomere binding
(Mazor and Kupiec 2009).
Skn7 YHR206W N N N 2.54 × 10⁻² N Skn7 is a TF associated
with osmotic stress response (Ni et al. 2009).
Ste7 YDL159W N N N N/A N Ste7 is phosphorylated
following HOG pathway
activation (Shock et al. 2009).
Tec1 YBR083W N N N 2.74 × 10⁻¹ N HOG pathway activation
inhibits Tec1 DNA
binding (Shock et al. 2009).
Fkh2 YNL068C N N N 3.91 × 10⁻¹ N Fkh2 has not been
experimentally validated,
but was previously

7
predicted to be a
significant hyperosmotic
shock TF (Lin et al. 2007).
Fus3 YBL016W N N N N/A N When Hog1 or Pbs2 is
deleted Fus3 is activated
by osmotic stress (O‟Rourke et al. 2002).
Hap4 YKL109W N N N 8.78 × 10⁻² N
Hhf1 YBR009C N N N 8.86 × 10⁻³ N
Hhf2 YNL030W N N N N/A N
Hht2 YNL031C N N N 3.44 × 10⁻¹ N
Kti12 YKL110C N N N 5.79 × 10⁻¹ N
Rpo21 YDL140C N N N N/A N
Srb5 YGR104C N N N 4.53 × 10⁻¹ N
Ste5 YDR103W N N N N/A N Ste5 facilitates osmotic stress-related MAPK
pathway cross-talk in
Pbs2 mutants (Flatauer et al. 2005).
Swi4 YER111C N N N 1.75 × 10⁻¹ N Temperature sensitivity
of Swi4 mutants is
suppressed by sorbitol (Madden et al. 1997).
Swi6 YLR182W N N N 7.38 × 10⁻¹ N

8
Supplementary Figure S1. Short model active TFs

9
HOG gold standard
Supplementary Table S3 presents the entire HOG gold standard, composed of figures from
KEGG (Kanehisa and Goto 2000), the Science Signaling Database of Cell Signaling
(http://stke.sciencemag.org/cgi/cm/stkecm;CMP_14620), and several literature sources
(Hohmann et al. 2007; Hohmann 2009; Krantz et al. 2009; de Nadal and Posas 2010; Rodríguez-
Peña et al. 2010). Supplementary Fig. S2 emphasizes the diversity among these seven gold
standard models. Only 9 of the 42 proteins are present in all of the gold standard sources.
Fifteen proteins appear in only one source, indicating that there may be less certainty that these
proteins are truly HOG pathway members.

10
Supplementary Table S3. Complete HOG gold standard. All 42 members of the HOG gold
standard are listed, including the sources, and are sorted in descending order by the number of
databases or literature sources they appear in. TFs are denoted with „Y‟ in the TF column.
Gene ORF name TF KEGG Sci.
Sig.
Hohmann
et al 2007
Hohmann
2009
Krantz
et al
2009
de Nadal
& Posas
2010
Rodríguez-
Peña et al
2010
Hog1 YLR113W N X X X X X X X
Pbs2 YJL128C N X X X X X X X
Sho1 YER118C N X X X X X X X
Sln1 YIL147C N X X X X X X X
Ssk1 YLR006C N X X X X X X X
Ssk2 YNR031C N X X X X X X X
Ste11 YLR362W N X X X X X X X
Ste20 YHL007C N X X X X X X X
Ypd1 YDL235C N X X X X X X X
Cdc42 YLR229C N X X X X X X
Ssk22 YCR073C N X X X X X X
Msb2 YGR014W N X X X X X
Ste50 YCL032W N X X X X X
Hot1 YMR172W Y X X X X
Msn2 YMR037C Y X X X X
Msn4 YKL062W Y X X X X
Opy2 YPR075C N X X X X
Ptc1 YDL006W N X X X X
Ptp2 YOR208W N X X X X
Ptp3 YER075C N X X X X
Hkr1 YDR420W N X X X
Sko1 YNL167C Y X X X
Cdc24 YAL041W N X X
Cla4 YNL298W N X X
Msn1 YOL116W Y X X
Rck2 YLR248W N X X
Smp1 YBR182C Y X X
Act1 YFL039C N X
Ctt1 YGR088W N X
Eft1 YOR133W N X
Eft2 YDR385W N X
Glo1 YML004C N X
Gpd1 YDL022W N X
Mcm1 YMR043W Y X
Nbp2 YDR162C N X
Ptc2 YER089C N X
Ptc3 YBL056W N X
Rck1 YGL158W N X
Rpd3 YNL330C N X

11
Sin3 YOL004W N X
Ssn6 YBR112C N X
Tup1 YCR084C N X
Supplementary Figure S2. HOG gold standard source agreement. The histogram shows how
many HOG proteins appear in the specified number of gold standard sources (i.e. databases or
HOG literature).

12
Supplementary Figure S3. Short model signaling network without protein-DNA edges.
Only proteins that interact with other high-confidence predictions are shown (7 are excluded).

13
Long model details and support
Fig. 3A only displays TFs the first time they are active along a path except for Hog1 and Sko1,
which are shown a second time along the uppermost regulatory path to emphasize the connection
between the signaling and regulatory components. Supplementary Fig. S4 provides the full set
of TF annotations for the long model. Fig. 3B does not include the targets Gal4 and Sfp1
because they are connected to the sensory proteins via intermediate nodes whose scores fell
below our threshold for inclusion in the model. Nevertheless, these targets are still well-
connected to the source nodes. Supplementary Tables S4 and S5 contain the full set of targets
and internal nodes in the long model as well as the external sources that support them.
To test whether some of the secondary TFs are likely to be controlled transcriptionally instead of
by signaling cascades, we examined the subset of target TFs that are only active at the late time
points (15 minutes or later). Of the 8 TFs meeting this criterion, 5 (Gcn4, Pdr1, Phd1, Sok2, and
Swi5) are indeed differentially expressed in the long gene expression dataset at or before the
time point where they are predicted to regulate their bound genes. These 5 TFs are also
connected to the sources via paths that include one or more protein-DNA binding edges
suggesting that they participate in the stress response due to transcriptional activation.
Specifically, for all 8 of the late TFs, more than 50% of all paths from sources to them include at
least one protein-DNA interaction. In contrast, the early TFs (those that are first active before 15
minutes) tend to be connected via paths with far fewer protein-DNA edges. Five of the 20 early
TFs are primarily connected to sources with paths that contain only PPI, and one of them (Skn7)
is only connected to the sources via PPIs.

14
To further investigate the putative transcriptional activation of the late TFs, we reran SDREM on
the long expression data but left the protein-DNA binding edges out of the interaction network
(these interactions were still used when learning the regulatory paths). Gcn4, Pdr1, and Phd1 are
no longer predicted in this setting, which suggests that the transcriptional component of the
interaction network is required for their activation. This alternate PPI-only long model is still
significantly representative of the HOG pathway (p-values of 0.0100 and 8.24 × 10⁻⁸
for the TF
and signaling protein overlaps with the gold standard, respectively). The PPI-only model
constructed contained 51 proteins overall, the same number as the original long model, and they
had 34 proteins in common (67%).

15
Supplementary Figure S4. Long model active TFs
16
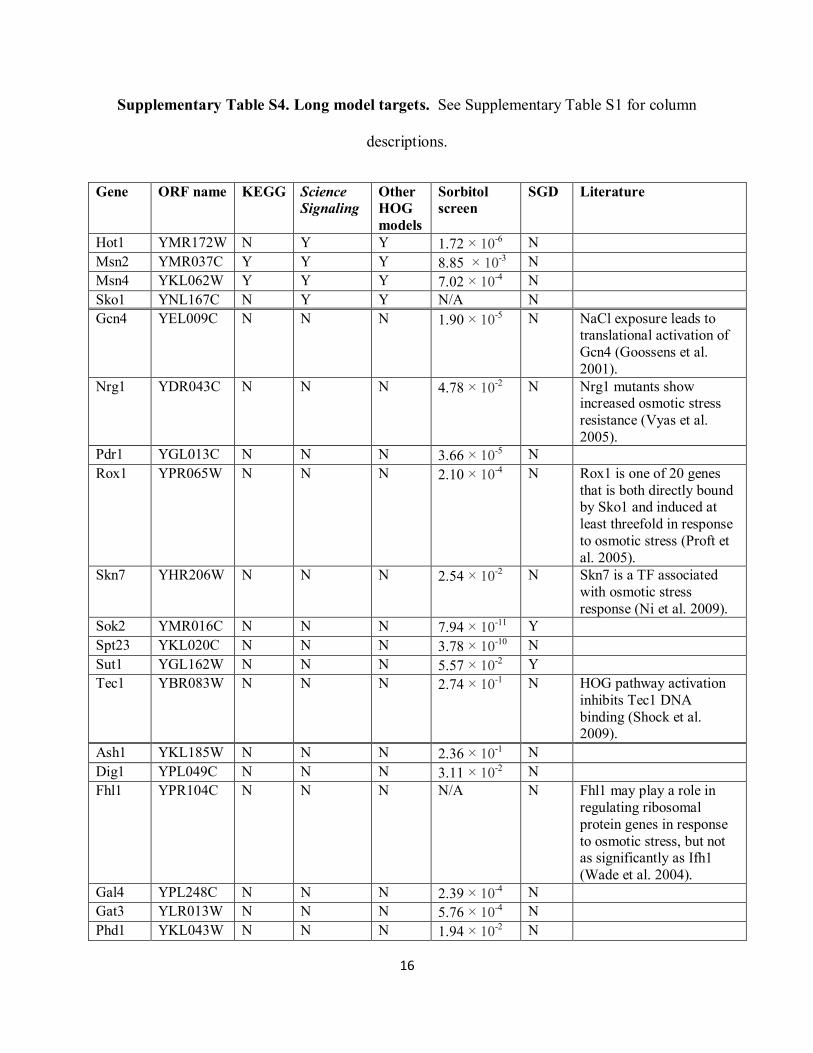
Supplementary Table S4. Long model targets. See Supplementary Table S1 for column
descriptions.
Gene ORF name KEGG Science
Signaling
Other
HOG
models
Sorbitol
screen
SGD Literature
Hot1 YMR172W N Y Y 1.72 × 10⁻⁶ N
Msn2 YMR037C Y Y Y 8.85 × 10⁻³
N
Msn4 YKL062W Y Y Y 7.02 × 10⁻⁴ N
Sko1 YNL167C N Y Y N/A N
Gcn4 YEL009C N N N 1.90 × 10⁻⁵ N NaCl exposure leads to
translational activation of
Gcn4 (Goossens et al.
2001).
Nrg1 YDR043C N N N 4.78 × 10⁻² N Nrg1 mutants show
increased osmotic stress
resistance (Vyas et al.
2005).
Pdr1 YGL013C N N N 3.66 × 10⁻⁵ N
Rox1 YPR065W N N N 2.10 × 10⁻⁴ N Rox1 is one of 20 genes
that is both directly bound by Sko1 and induced at
least threefold in response
to osmotic stress (Proft et
al. 2005).
Skn7 YHR206W N N N 2.54 × 10⁻² N Skn7 is a TF associated
with osmotic stress
response (Ni et al. 2009).
Sok2 YMR016C N N N 7.94 × 10⁻¹¹
Y
Spt23 YKL020C N N N 3.78 × 10⁻¹⁰
N
Sut1 YGL162W N N N 5.57 × 10⁻² Y
Tec1 YBR083W N N N 2.74 × 10⁻¹ N HOG pathway activation
inhibits Tec1 DNA
binding (Shock et al. 2009).
Ash1 YKL185W N N N 2.36 × 10⁻¹ N
Dig1 YPL049C N N N 3.11 × 10⁻² N
Fhl1 YPR104C N N N N/A N Fhl1 may play a role in
regulating ribosomal
protein genes in response
to osmotic stress, but not as significantly as Ifh1
(Wade et al. 2004).
Gal4 YPL248C N N N 2.39 × 10⁻⁴ N
Gat3 YLR013W N N N 5.76 × 10⁻⁴ N
Phd1 YKL043W N N N 1.94 × 10⁻² N
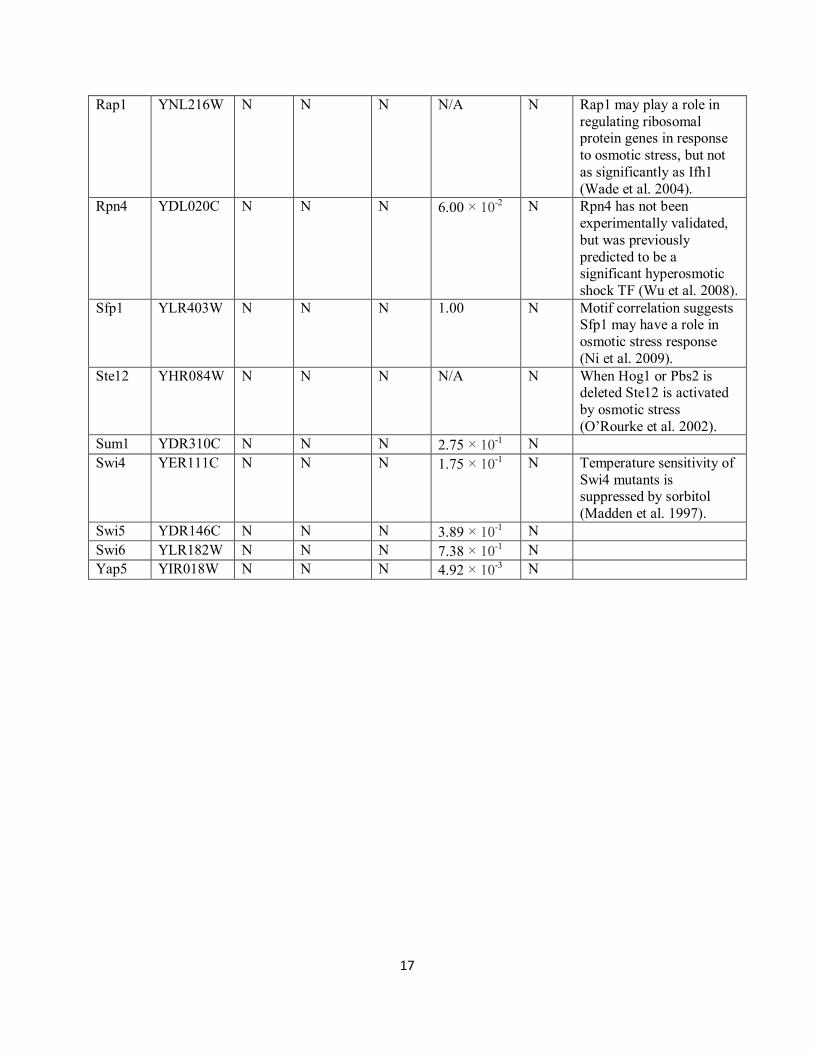
17
Rap1 YNL216W N N N N/A N Rap1 may play a role in
regulating ribosomal protein genes in response
to osmotic stress, but not
as significantly as Ifh1
(Wade et al. 2004).
Rpn4 YDL020C N N N 6.00 × 10⁻² N Rpn4 has not been
experimentally validated,
but was previously
predicted to be a significant hyperosmotic
shock TF (Wu et al. 2008).
Sfp1 YLR403W N N N 1.00 N Motif correlation suggests Sfp1 may have a role in
osmotic stress response
(Ni et al. 2009).
Ste12 YHR084W N N N N/A N When Hog1 or Pbs2 is deleted Ste12 is activated
by osmotic stress
(O‟Rourke et al. 2002).
Sum1 YDR310C N N N 2.75 × 10⁻¹ N
Swi4 YER111C N N N 1.75 × 10⁻¹ N Temperature sensitivity of
Swi4 mutants is suppressed by sorbitol
(Madden et al. 1997).
Swi5 YDR146C N N N 3.89 × 10⁻¹ N
Swi6 YLR182W N N N 7.38 × 10⁻¹ N
Yap5 YIR018W N N N 4.92 × 10⁻³ N
18
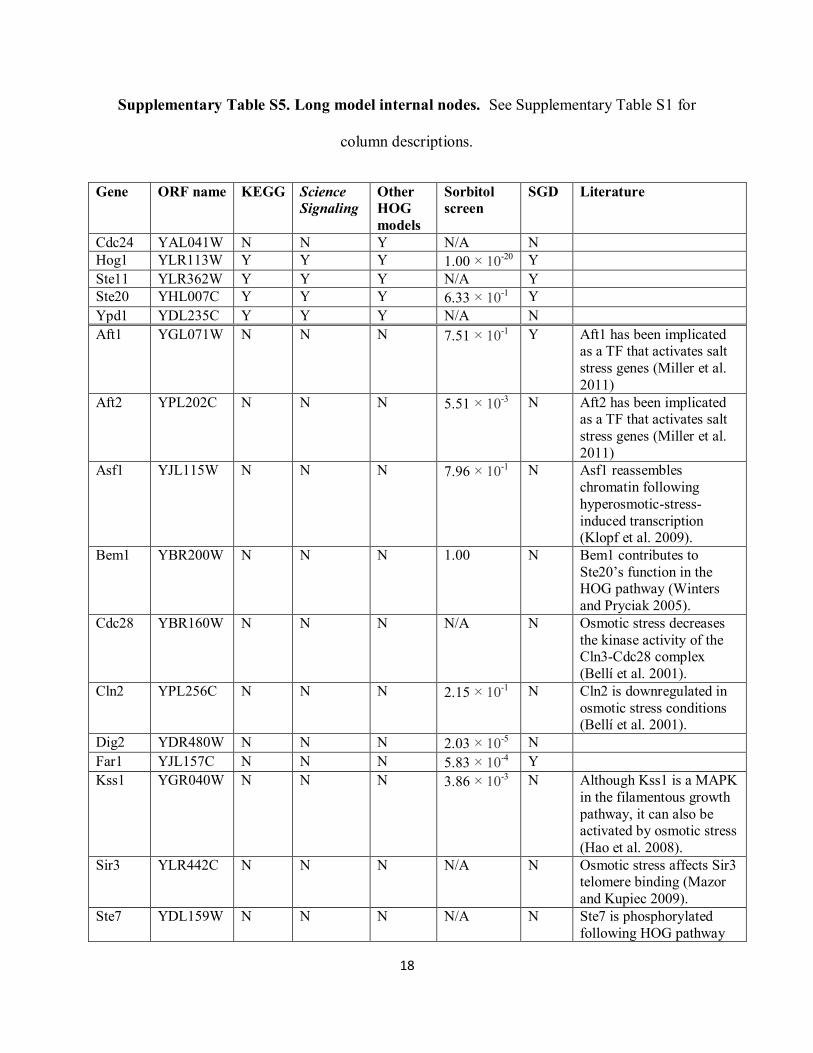
Supplementary Table S5. Long model internal nodes. See Supplementary Table S1 for
column descriptions.
Gene ORF name KEGG Science
Signaling
Other
HOG
models
Sorbitol
screen
SGD Literature
Cdc24 YAL041W N N Y N/A N
Hog1 YLR113W Y Y Y 1.00 × 10⁻²⁰
Y
Ste11 YLR362W Y Y Y N/A Y
Ste20 YHL007C Y Y Y 6.33 × 10⁻¹ Y
Ypd1 YDL235C Y Y Y N/A N
Aft1 YGL071W N N N 7.51 × 10⁻¹ Y Aft1 has been implicated
as a TF that activates salt
stress genes (Miller et al.
2011)
Aft2 YPL202C N N N 5.51 × 10⁻³ N Aft2 has been implicated
as a TF that activates salt
stress genes (Miller et al.
2011)
Asf1 YJL115W N N N 7.96 × 10⁻¹ N Asf1 reassembles
chromatin following
hyperosmotic-stress-
induced transcription (Klopf et al. 2009).
Bem1 YBR200W N N N 1.00 N Bem1 contributes to
Ste20‟s function in the HOG pathway (Winters
and Pryciak 2005).
Cdc28 YBR160W N N N N/A N Osmotic stress decreases
the kinase activity of the Cln3-Cdc28 complex
(Bellí et al. 2001).
Cln2 YPL256C N N N 2.15 × 10⁻¹ N Cln2 is downregulated in
osmotic stress conditions (Bellí et al. 2001).
Dig2 YDR480W N N N 2.03 × 10⁻⁵ N
Far1 YJL157C N N N 5.83 × 10⁻⁴ Y
Kss1 YGR040W N N N 3.86 × 10⁻³ N Although Kss1 is a MAPK
in the filamentous growth
pathway, it can also be activated by osmotic stress
(Hao et al. 2008).
Sir3 YLR442C N N N N/A N Osmotic stress affects Sir3 telomere binding (Mazor
and Kupiec 2009).
Ste7 YDL159W N N N N/A N Ste7 is phosphorylated
following HOG pathway

19
activation (Shock et al.
2009).
Yap6 YDR259C N N N 2.13 × 10⁻³ N Yap6 is a TF associated
with osmotic stress
response (Ni et al. 2009).
Fus3 YBL016W N N N N/A N When Hog1 or Pbs2 is
deleted Fus3 is activated by osmotic stress
(O‟Rourke et al. 2002).
Gts1 YGL181W N N N 2.00 × 10⁻³ N
Rad53 YPL153C N N N N/A N
Ste4 YOR212W N N N N/A N
Ste5 YDR103W N N N N/A N Ste5 facilitates osmotic
stress-related MAPK pathway cross-talk in Pbs2
mutants (Flatauer et al.
2005).
Yap7 YOL028C N N N 2.14 × 10⁻⁴ N
Comparison to HOG pathway literature
Although many of the edges between correctly predicted HOG gold standard members are
oriented properly as well (Fig. 2B and 3B), there are cases where the inferred orientation is
inconsistent with the HOG literature. Both the short and long models contain the predicted edge
Ste11→Ste20. However, the gold standard reveals that Ste20→Ste11 is the true orientation (de
Nadal and Posas 2010).
Fifteen proteins in the HOG gold standard, including one TF, are only annotated as HOG
pathway members in a single source (Supplementary Table S3). Due to this lack of consensus, it
is reasonable to believe that these proteins are less likely than the others to be involved in the
HOG pathway or at the very least play peripheral roles. Interestingly, all 15 proteins are
excluded from the short and long model predictions, and the gold standard overlaps are
accordingly more significant when considering only gold standard proteins that are cited in
multiple sources.
20
SDREM is designed to discover directed cascades between the upstream sources and the inferred
active TFs. Therefore, it is unable to recover pathway members that are further upstream of the
given sources, which explains the absence of Opy2 and Hkr1 in SDREM‟s predictions. Ptc2,
Ptc3, Ptp2, and Ptp3 are HOG members that are not between the sources and TFs in the gold
standard diagrams. Unlike Ptc2 and Ptc3, Ptp2 and Ptp3 are actually on a small number of
source-target paths in the short and long models‟ oriented networks, but their node scores are 0,
signifying that they are only found on low-confidence paths. Similarly, gold standard members
Eft1 and Eft2 are not included in either osmotic stress model because they are not on any source-
target paths in these models. This is consistent with the Science Signaling HOG pathway
diagram, the only gold standard source that contains these two proteins, in which they are
downstream of Hog1 but not upstream of any HOG pathway TFs.
Because the HOG gold standard only incorporates literature that provides a network diagram of
the HOG pathway, we also compared our predictions with other recent HOG pathway evidence
that is not reflected in the gold standard. Mas et al (Mas et al. 2009) explored Hog1‟s targeting
of the RSC complex, a phenomenon missed in the SDREM models. Zapater et al (Zapater et al.
2007) studied Hog1‟s role in the recruitment of SAGA, Mediator, and Pol II in osmotic stress
conditions, and identified Mediator complex genes that exhibit osmotic stress sensitivity. Of
these, SDREM predicted GAL11 and MED2 but did not recover PGD1 or SRB4. Kim and Shah
(Kim and Shah 2007) identified new Hog1 substrates Krs1, Tdh3, Hsp26, and Shm2 that
SDREM did not predict.

21
Microscopy and FACS
Some of the cell boundaries in the microscopy image were ambiguous, and the corresponding
cells were excluded from our localization analysis. Supplementary Fig. S5 shows the regions of
interest (ROIs) that were drawn on the cells that had clearly defined boundaries. Our supporting
website contains the original images, images after ImageJ (Abramoff et al. 2004) processing,
ROI files that can be loaded into ImageJ, and the standard deviations of the pixel intensities of all
cells included in the analysis.
Although Cin5 exhibited statistically significant differential nuclear localization in the images
shown in Fig. 4A and Supplementary Fig. S5, this was not the case for all images analyzed. A
Cin5 image from 6 minutes after treatment had a p-value of 0.491. However, additional later
images from the 40 and 50 minute time points yielded p-values of 5.54 × 10⁻⁶
and 0.0579,
respectively, and were more consistent with the results reported in the main text. This indicates
that at the earlier time point, at which time SDREM predicts Cin5 is active (Fig. 2A), Cin5 had
not yet localized to the nucleus in response to the osmotic stress. We believe the difference in
timing could be due to differences in experimental procedures and conditions between our
microscopy analysis and the gene expression dataset. Whereas we applied 1M sorbitol as the
osmotic stress, the expression dataset utilized in the short model used 0.4M NaCl (Romero-
Santacreu et al. 2009).
The fluorescence-activated cell sorting experiments validated not only the osmotic stress
relevance of the SDREM predictions Rox1 and Gcn4, but also the timing of their involvement.
The elevated Rox1 protein levels were detected 30 minutes after treatment, supporting SDREM‟s

22
predictions that it is active from 8 minutes onward in the short model and as late as 45 minutes in
the long model. Gcn4‟s differential protein expression was detected 1 hour after treatment,
consistent with the prediction that Gcn4 is active at the latest divergence point in the long model.

23
Supplementary Figure S5. Differential nuclear localization after treatment with sorbitol.
ROIs for cells with discernable boundaries are drawn in purple and numbered.

24
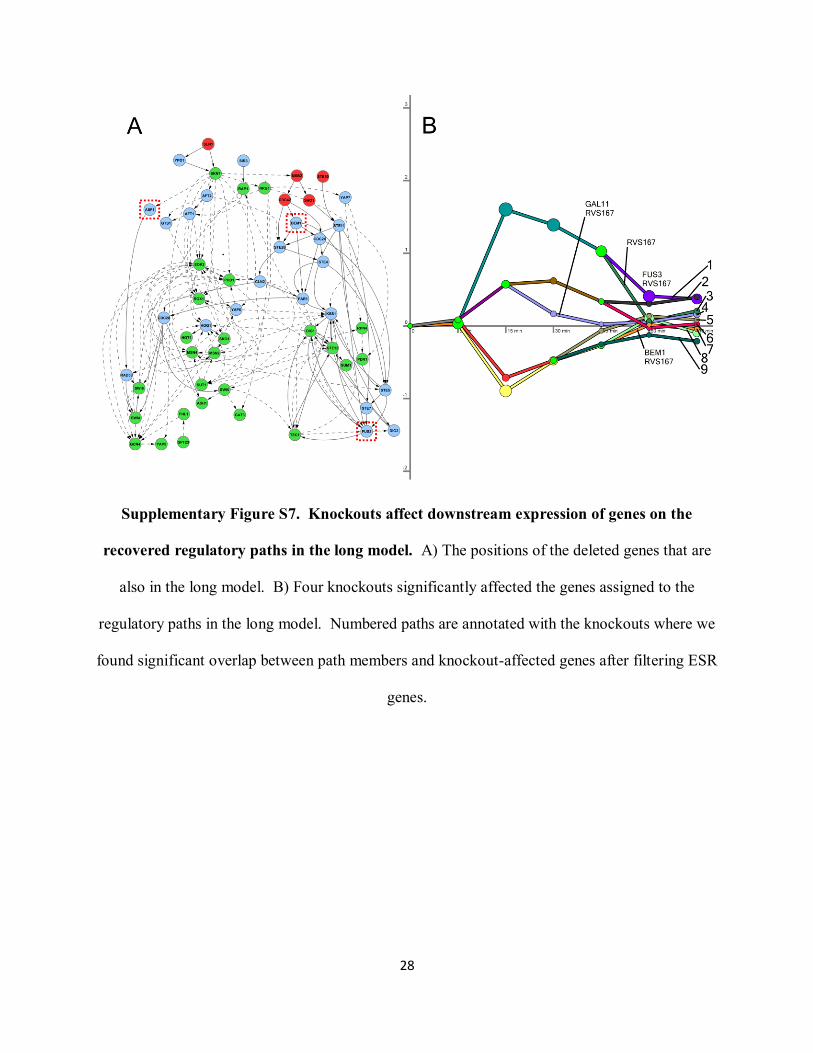
Extended discussion of knockout results
The genes we deleted were selected from the short model (Fig. 5A), but half of these nodes were
present in the long network model as well (Supplementary Fig. S7A). The others were still
present in some directed source-target paths, but fell below our threshold for inclusion among the
highest-confidence predictions. Supplementary Fig. S7B shows the long model‟s regulatory
paths whose genes significantly overlap with the knockout-affected genes after filtering
environmental stress response (ESR) genes (Gasch et al. 2000). Supplementary Table S21
(Excel spreadsheet) provides the details of these overlaps for the short and long models including
p-values. For both the short and long models, the significant knockout overlaps when the
general stress response genes are not filtered are a superset of the filtered knockouts
(Supplementary Fig. S6 and S8 and Supplementary Table S21). In all cases, the number of
regulatory paths that are enriched with one or more knockouts is significant (Supplementary
Table S6).
To more directly connect our knockout results to the predicted signaling pathways, we examined
the TFs controlling the regulatory paths whose genes were significantly affected by the KO
experiments. In addition to Asf1 (main text), we found several other cases where the loss of a
signaling protein affects paths controlled by the downstream TFs in our oriented network. One
such example involves Bem1. The genes that are differentially repressed after BEM1 deletion in
sorbitol significantly overlap path 7 in the long model (Supplementary Fig. S7B), a path on
which genes are repressed at 5 minutes and then gradually recover after 15 minutes. SDREM
predicts five TFs that are actively controlling genes on this path – Ste12, Tec1, Swi6, Dig1, and

25
Spt23 – and all five are indeed downstream of Bem1 in the oriented network (Supplementary
Fig. S7A).
The genes affected by the GAL11 KO further validate our predictions. Differentially expressed
genes in the gal11Δ mutant significantly overlap with five paths in the short model (Fig. 5B). Of
these, all but path 8 are controlled in part by Pdr1 early in the response (Supplementary Fig. S1),
the only TF downstream of Gal11 in the high-confidence short model network (Fig. 5A). In fact,
Pdr1 is directly bound by Gal11 in the oriented network. Rvs167 is upstream of 15 TFs in the
short model, which explains why its deletion affects so many regulatory paths (Fig. 5B). The
majority of the TFs controlling these paths are downstream of Rvs167 in the oriented network.
For instance, 6 of the 7 TFs controlling path 1‟s split from path 2 are downstream of Rvs167.
Additional examples exist as well, and as a whole our knockouts support our predictions in both
the short and long models.
Although we were able to use the oriented network to explain many of the effects we observed
when predicted signaling proteins were deleted, in some cases the abundance of paths involving
the deleted node impaired these efforts. Especially for proteins like Bem1 that are further
upstream in the signaling network and directly interact with the sensory proteins (Fig. 5A and
Supplementary Fig. S7A), there are many TFs that are downstream of them in the network
(Supplementary Table S21). Thus, there is ambiguity when determining exactly how the
deletion impacted gene expression because any of these TFs could have been affected by the
deletion, but for any given TF there are typically other parallel paths that do not involve the
deleted node. Similarly, many regulatory paths are partially controlled by a large number of TFs,

26
and in almost all cases at least some of these TFs are downstream of each of our deletions
(Supplementary Table S21). The degree of overlap between the downstream TFs and TFs on a
regulatory path alone is not predictive of whether the deletion will significantly affect the
regulatory path. Furthermore, any errors in the network orientation can impair our ability to
explain the observed knockout effects.
In general, the differentially activated genes after a knockout overlapped the upper regulatory
paths and repressed genes overlapped lower paths. We can explain this phenomenon in many
cases, but it is nevertheless counterintuitive. One would expect to see more cases where the
positive regulators downstream of the deleted protein are deactivated after the knockout, which
causes the genes on that path to be differentially repressed instead of activated.

27
Supplementary Figure S6. Knockouts affecting short model regulatory paths without ESR
filtering
28
Supplementary Figure S7. Knockouts affect downstream expression of genes on the
recovered regulatory paths in the long model. A) The positions of the deleted genes that are
also in the long model. B) Four knockouts significantly affected the genes assigned to the
regulatory paths in the long model. Numbered paths are annotated with the knockouts where we
found significant overlap between path members and knockout-affected genes after filtering ESR
genes.
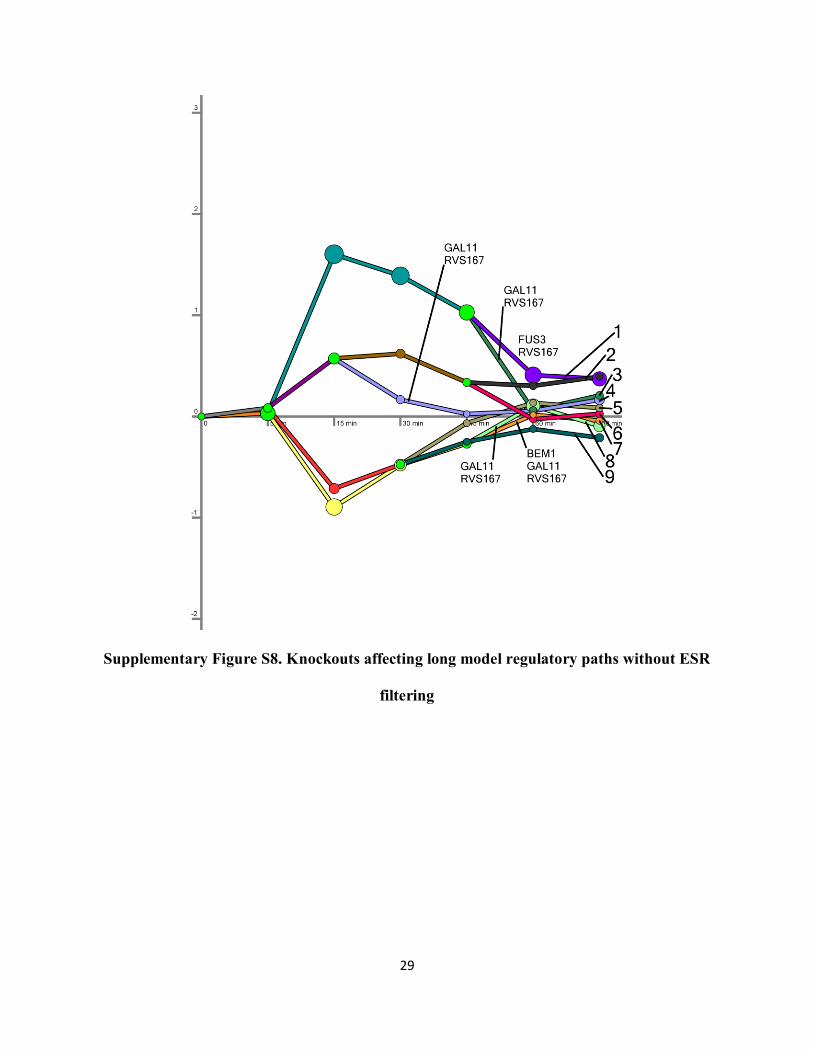
29
Supplementary Figure S8. Knockouts affecting long model regulatory paths without ESR
filtering

30
Supplementary Table S6. Random regulatory path enrichment. For the short and long
model, genes were randomly assigned to regulatory paths and the enrichment of the knockout-
affected genes was calculated (Supplementary Methods). The number of true regulatory paths
that are enriched is shown along with the number of times out of 100,000 trials that the specified
number of random paths are enriched. Regardless of whether ESR genes are filtered, the
resulting empirical p-values are significant.
Model Short Short Long Long
ESR filtered Yes No Yes No
Actual paths enriched 7 7 4 5
0 random paths enriched count 76353 72268 74408 73906
1 random paths enriched count 21147 24217 22732 23060
2 random paths enriched count 2359 3246 2692 2863
3 random paths enriched count 137 263 164 169
4 random paths enriched count 4 6 4 2
5 random paths enriched count 0 0 0 0
6 random paths enriched count 0 0 0 0
7 random paths enriched count 0 0 0 0
8 random paths enriched count 0 0 0 0
9 random paths enriched count 0 0 0 0
10 random paths enriched count 0 0 N/A N/A
p-value < 10-5 < 10
-5 4 × 10
-5 < 10
-5
Confirmation of TF activity timing
We previously discussed how the genes affected by BEM1‟s deletion significantly overlap genes
on path 7 in the long model and how the TFs downstream of Bem1 in the network control this
path. Because hundreds of genes are repressed at the split at 5 minutes on this path, at least some
of these TFs must be exerting a negative regulatory influence. However, our knockout results
suggest that a subset of these TFs, possibly including the repressors, also control the restoration
of gene expression to its steady state levels. The evidence of this is twofold. First, DREM
predicts that some of the TFs controlling the downward path at the 5 minute split also control the
upward path at 60 minutes when this path diverges into paths 7 and 8 (Supplementary Fig. S4).

31
This subset includes at least one TF traditionally considered to be a transcriptional repressor,
Dig1 (Kusari et al. 2004). Moreover, when Bem1 is deleted, genes that are differentially
repressed significantly overlap path 7, which means they either return to prestress levels more
slowly than in wild type cells or not at all. Gene expression levels in the bem1Δ mutant strain
were measured 30 minutes after sorbitol treatment, which supports the possibility that BEM1‟s
knockout severs the connection to the downstream TFs that are responsible for gene expression
recovery after the initial repression at 5 minutes. Therefore, the BEM1 knockout demonstrates
that the time at which TFs are activated along this regulatory path was predicted correctly.
Literature support for validated proteins
We have shown that 3 of the 4 predicted TFs we investigated experimentally – Cin5, Gcn4, and
Rox1 – localized to the nucleus and/or increased in expression in response to osmotic stress.
Previous work provides further support for some of these findings and indicates that this
activation may be important for overcoming sorbitol-induced stress. For example, cin5Δ mutants
have been found to exhibit growth sensitivity to osmotic shock, and CIN5 induction peaks 30 to
60 minutes after exposure to moderate NaCl-induced stress (Nevitt et al. 2004). Gcn4 has also
been shown to play a role in salt-induced stress. Following NaCl exposure, mutations that incite
Gcn4 activity also increase sensitivity to salt (Goossens et al. 2001). Osmotic stress mRNA
synthesis analysis also reported Gcn4 as a regulator of salt stress genes (Miller et al. 2011).
A few of the signaling proteins we validated using knockouts were similarly identified as playing
diverse roles in the osmotic stress response. Single and double knockouts revealed that Asf1
operates together with Rtt109 and in parallel with Arp8 to reassemble chromatin following
32
hyperosmotic stress-induced transcription (Klopf et al. 2009). Bem1‟s involvement in the HOG
pathway is tightly coupled with Cdc42, which was selected as a source protein in our study, and
Ste20, a kinase recovered in both the short and long models. Binding domain mutations revealed
that both Bem1 and Cdc42 independently contribute to Ste20‟s function in the HOG pathway.
Whereas single Bem1 or Cdc42 binding domain mutations yielded only partial defects in
osmoresistance, a double mutation generated a much stronger phenotype (Winters and Pryciak
2005). In both of our network models, we recover the correct orientations of the Bem1→Ste20
and Cdc42→Ste20 PPI.
Genes affected by the RVS167 knockout in sorbitol had the strongest overlaps with the regulatory
paths. Under normal growth conditions, rvs167Δ mutants display slight deregulation of the actin
cytoskeleton. However, in the presence of NaCl, the actin cytoskeleton of the mutant strain is
completely deregulated and exhibits many abnormalities (Bauer et al. 1993). Although our
single knockout only weakly confirmed Pcl2‟s involvement in the HOG pathway, a study by Lee
et al (Lee et al. 1998) provides insight into this result. They found that a mutant strain in which
PCL2 was deleted was able to colonize in a high salt environment, but a quintuple deletion of
Pcl1,2-type cyclins (pcl1Δ pcl2Δ clg1Δ pcl5Δ pcl9Δ) failed to grow on this medium.
Redundancy among these cyclins obscured the salt sensitivity phenotype in the single deletion.
The fact that our algorithm correctly recovered Pcl2 as an osmotic stress participant despite the
weak support in its single knockout affirms our strategy to rely on dynamic gene expression data
instead of knockouts for model inference. Interestingly, it was also reported that the Pcl2-Pho85
kinase phosphorylates Rvs167 (Lee et al. 1998). Much like RVS167 deletion strains, the

33
quintuple Pcl1,2-type cyclin deletion exhibited abnormalities in the actin cytoskeleton that were
more pronounced in the presence of salt.
MAPK pathway cross-talk
Extensive efforts have been made to understand the mechanisms that prevent cross-talk in yeast
MAPK signaling pathways. Although the filamentous growth and pheromone-response share
many members with the HOG pathway (Kanehisa and Goto 2000), activation of the respective
MAPKs and downstream genes is quite specific. McClean et al reported that cross-talk between
the HOG and pheromone pathways is filtered via mutual inhibition between Hog1 and Fus3, the
MAPK in the pheromone pathway, and suggested that such mutual inhibition may be utilized in
maintaining specificity of other MAPK pathways as well (McClean et al. 2007). Despite the
MAPK pathway specificity in wild type cells (McClean et al. 2007), when Hog1 and the HOG
pathway MAPK kinase (MAPKK) Pbs2 are mutated, Fus3 is activated by osmotic stress
(O‟Rourke et al. 2002). This is also the case for Ste12, a member of the filamentous growth and
pheromone pathways (O‟Rourke et al. 2002) that was predicted as an osmotic stress responder
by SDREM. Similarly, in pbs2Δ strains, Ste5, a pheromone pathway member also included in
our predictions, facilitates MAPK pathway cross-talk (Flatauer et al. 2005). Interestingly, other
predictions that are primarily members of the filamentous growth and/or pheromone pathways
have been reported to be affected by osmotic stress in wild type cells. These include the
filamentous growth MAPK Kss1, the MAPKK Ste7, and the TF Tec1 (Hao et al. 2008; Shock et
al. 2009).

34
Although there is evidence that the six aforementioned proteins have osmotic stress affiliations
in either wild type or mutant strains, their inclusion in SDREM‟s models suggests that it can
have difficulty distinguishing between MAPK pathways. Because our network orientation
objective function promotes multiple parallel paths between sources and targets and some
proteins (e.g. Cdc42, Msb2, Sho1, Ste11, Ste20, and Ste50) are common to multiple MAPK
pathways, the algorithm predicts paths through these other MAPK pathway members. For
example, in the final oriented network in the short model all of the most relevant HOG TFs
(Hot1, Msn2, Msn4, and Sko1) can be connected to the source proteins via short, high-
confidence paths through Fus3. Thus, the sophisticated cross-talk prevention mechanisms are
unable to be recovered from the PPI and transcriptional data alone.
Target of rapamycin (TOR) model
The second stress response we studied with SDREM is the target of rapamycin (TOR) signaling
pathway. Although yeast contains two complexes, TORC1 and TORC2, in which the Tor
proteins are members, only TORC1 is inhibited by the drug rapamycin (Zaman et al. 2008).
Thus, we used the five TORC1 complex members as the sources in our TOR pathway modeling:
Kog1, Lst8, Tco89, Tor1, and Tor2 (Zaman et al. 2008) (Supplementary Fig. S9). Tor2 is only a
TORC1 complex member in the absence of Tor1, but we include both proteins as sources.
TORC1 has been shown to respond to not only rapamycin but also caffeine (Kuranda et al.
2006), nitrogen source quality (Zaman et al. 2008), and other stimuli.
The TOR response expression data (Urban et al. 2007) contained measurements at 20, 30, 60, 90,
120, and 180 minutes. Unlike the long osmotic stress expression dataset, the genes differentially

35
expressed in the TOR response generally remained activated or repressed for the full 3 hours and
did not return to steady state during this period (Supplementary Fig. S10). Along with the
extensive TF-gene binding data from cells grown in rich media (MacIsaac et al. 2006), SDREM
was also provided rapamycin-specific data for 14 TFs previously implicated in the TOR response
(Harbison et al. 2004).
Despite the prior evidence for these TFs‟ TOR involvement, conventional TOR pathway
representations contain very limited knowledge of the downstream TFs. One model (Zaman et
al. 2008) contains only Gln3, Msn2, Msn4, and Sfp1, and SGD shows no TFs annotated with the
Gene Ontology (Ashburner et al. 2000) term „TOR signaling cascade‟
(http://www.yeastgenome.org/cgi-bin/GO/goTerm.pl?goid=31929). In contrast, SDREM
predicts that 23 TFs are active regulators in the TOR pathway (Supplementary Fig. S10), and of
these only Sfp1 is a member of the previous TOR models. Nevertheless, we found support for
17 of these predictions (74%) in the two aforementioned TOR pathway models, rapamycin
screens (Chan et al. 2000; Xie et al. 2005; Hillenmeyer et al. 2008), a set of genes curated by
SGD that have a rapamycin resistance phenotype (http://www.yeastgenome.org/cgi-
bin/phenotype/phenotype.fpl?property_value=rapamycin), and/or previous literature
(Supplementary Table S8). We refer to this collection of evidence (excluding the literature) as
our extended gold standard.

36
Supplementary Figure S9. Rapamycin model regulatory paths. The rapamycin response
model contains 15 regulatory paths. Unlike the long osmotic stress model, the differentially
expressed genes remain highly or lowly expressed after the initial shock for the duration of the
experiments. TFs are shown only the first time they appear on a path.

37
Supplementary Figure S10. Rapamycin model signaling network. The sources, signaling
proteins, and active TFs in the rapamycin model are displayed. The TF Gat3 does not appear in
the figure because it does not directly interact with other predicted pathway members. Rather, it
is influenced by upstream proteins via paths containing other proteins that were not deemed to be
core members of the response.

38
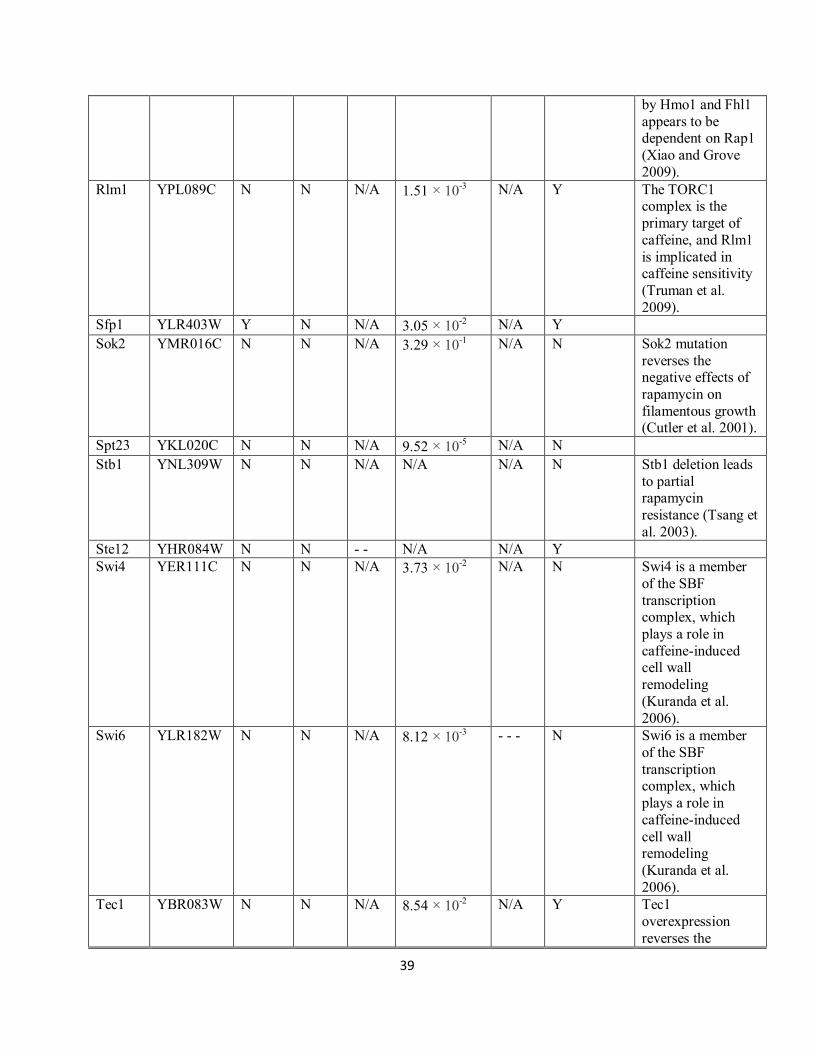
Supplementary Table S8. TOR model targets. The Zaman et al (Zaman et al. 2008) and SGD
model columns indicate whether the predicted TF is a member of these TOR pathway
representations. In the Xie et al column (Xie et al. 2005), the number of „-‟ symbols indicates
the degree of rapamycin sensitivity, if any. The Hillenmeyer et al column provides the lowest p-
value in multiple replicates of another rapamycin screen (Hillenmeyer et al. 2008). Each „-‟ in
the Chan et al column indicates an order of magnitude decrease in rapamycin resistance (Chan et
al. 2000). The rapamycin phenotype annotations were collected from SGD.
Gene ORF name Zaman
et al
SGD
model
Xie
et al
Hillenmeyer
et al
Chan
et al
Rapamycin
phenotype
Literature
Ash1 YKL185W N N N/A 2.69 × 10⁻⁵
N/A Y
Dal81 YIR023W N N N/A 1.00 × 10⁻²⁰
N/A N Dal81 was implicated as a TF
active in rapamycin
response (Bar-
Joseph et al. 2003) based on evidence
in (Scott et al.
2000).
Dig1 YPL049C N N N/A 3.18 × 10⁻⁶
N/A Y
Fhl1 YPR104C N N N/A N/A N/A N The TOR pathway
regulation of ribosomal protein
transcription
involves Fhl1
(Martin et al. 2004; Xiao and Grove
2009).
Fkh2 YNL068C N N N/A 5.55 × 10⁻¹⁷
N/A N
Gcn4 YEL009C N N N/A 4.18 × 10⁻¹
N/A N Many Gcn4 targets
are induced by
rapamycin, and a subset of these
requires Gcn4 for
full induction
(Natarajan et al. 2001).
Mbp1 YDL056W N N N/A 1.88 × 10⁻³
N/A Y
Rap1 YNL216W N N N/A N/A N/A N Downstream TOR pathway
transcriptional
activity controlled
39
by Hmo1 and Fhl1
appears to be dependent on Rap1
(Xiao and Grove
2009).
Rlm1 YPL089C N N N/A 1.51 × 10⁻³
N/A Y The TORC1 complex is the
primary target of
caffeine, and Rlm1
is implicated in caffeine sensitivity
(Truman et al.
2009).
Sfp1 YLR403W Y N N/A 3.05 × 10⁻²
N/A Y
Sok2 YMR016C N N N/A 3.29 × 10⁻¹
N/A N Sok2 mutation
reverses the negative effects of
rapamycin on
filamentous growth (Cutler et al. 2001).
Spt23 YKL020C N N N/A 9.52 × 10⁻⁵
N/A N
Stb1 YNL309W N N N/A N/A N/A N Stb1 deletion leads
to partial rapamycin
resistance (Tsang et
al. 2003).
Ste12 YHR084W N N - - N/A N/A Y
Swi4 YER111C N N N/A 3.73 × 10⁻²
N/A N Swi4 is a member
of the SBF
transcription complex, which
plays a role in
caffeine-induced cell wall
remodeling
(Kuranda et al.
2006).
Swi6 YLR182W N N N/A 8.12 × 10⁻³
- - - N Swi6 is a member
of the SBF
transcription complex, which
plays a role in
caffeine-induced
cell wall remodeling
(Kuranda et al.
2006).
Tec1 YBR083W N N N/A 8.54 × 10⁻²
N/A Y Tec1
overexpression
reverses the
40
negative effects of
rapamycin on filamentous growth
(Cutler et al. 2001).
Gat3 YLR013W N N N/A 3.28 × 10⁻³
N/A N
Hap1 YLR256W N N N/A N/A N/A N
Ndd1 YOR372C N N N/A N/A N/A N
Pdr1 YGL013C N N N/A 1.00 × 10⁻³
N/A N
Yap5 YIR018W N N N/A 4.56 × 10⁻¹
N/A N
Yap7 YOL028C N N N/A 2.45 × 10⁻¹
N/A N
SDREM identifies 25 additional proteins that connect TORC1 to the downstream TFs
(Supplementary Fig. S9). Of these, 14 (56%) are present in the extended gold standard or were
found to have possible links to the TOR pathway in a literature search (Supplementary Table
S9). Altogether, the overlap between SDREM‟s TOR predictions and the extended gold
standard is significant (p-value 2.55 × 10⁻³
using Fisher‟s exact test). Therefore, even though
very few predictions were present in the two canonical TOR models and many known TOR
members were not recovered, SDREM accurately identifies an extended TOR pathway
representation. The SDREM model includes many proteins that are traditionally primarily
associated with other signaling pathways but are affected by rapamycin, for example Dig1, and
explains how they may in fact be involved in the rapamycin response.

41
Supplementary Table S9. TOR model internal nodes. See Supplementary Table S8 for
column descriptions.
Gene ORF name Zaman
et al
SGD
model
Xie
et al
Hillenmeyer
et al
Chan
et al
Rapamycin
phenotype
Literature
Act1 YFL039C N N - - - - N/A N/A Y
Bem1 YBR200W N N N/A 1.62 × 10⁻²
- - - N
Cdc28 YBR160W N N N/A N/A N/A N TORC1 mediates Cdc5, which
activates Cdc28
(Nakashima et al. 2008).
Cln2 YPL256C N N N/A 1.47 × 10⁻⁸
N/A N Rapamycin
treatment reduces
Cln2 levels (Zinzalla et al.
2007).
Fus3 YBL016W N N N/A N/A N/A Y
Gal11 YOL051W N N N/A 3.01 × 10⁻¹
N/A Y
Hek2 YBL032W N N N/A 4.82 × 10⁻⁹
N/A N
Rsp5 YER125W N N N/A N/A N/A N Rsp5 deletion blocks the effects
of rapamycin on
Hxt1, a TOR
signaling target (Schmelzle et al.
2004).
Sir3 YLR442C N N N/A N/A N/A Y
Slt2 YHR030C N N - - - 1.82 × 10⁻³
- - - - Y
Srb2 YHR041C N N N/A 7.73 × 10⁻³
- - N
Ste4 YOR212W N N N/A N/A N/A N Rapamycin effects have been shown to
be Ste4-dependent
(Zhu and Wang
2009).
Ste5 YDR103W N N N/A N/A N/A N Rapamycin effects
have been shown to
be Ste5-dependent (Zhu and Wang
2009).
Tsc11 YER093C N Y N/A N/A N/A N
Cdc24 YAL041W N N N/A N/A N/A N
Dig2 YDR480W N N N/A 3.52 × 10⁻¹
N/A N
Far1 YJL157C N N N/A 8.82 × 10⁻²
N/A N
Med6 YHR058C N N N/A N/A N/A N
Myo4 YAL029C N N N/A 2.54 × 10⁻¹
N/A N
Rgr1 YLR071C N N N/A N/A N/A N

42
Rpo21 YDL140C N N N/A N/A N/A N
She2 YKL130C N N N/A 1.60 × 10⁻²
N/A N
Srb4 YER022W N N N/A N/A N/A N
Srb5 YGR104C N N N/A 2.36 × 10⁻¹
N/A N
Srb7 YDR308C N N N/A N/A N/A N
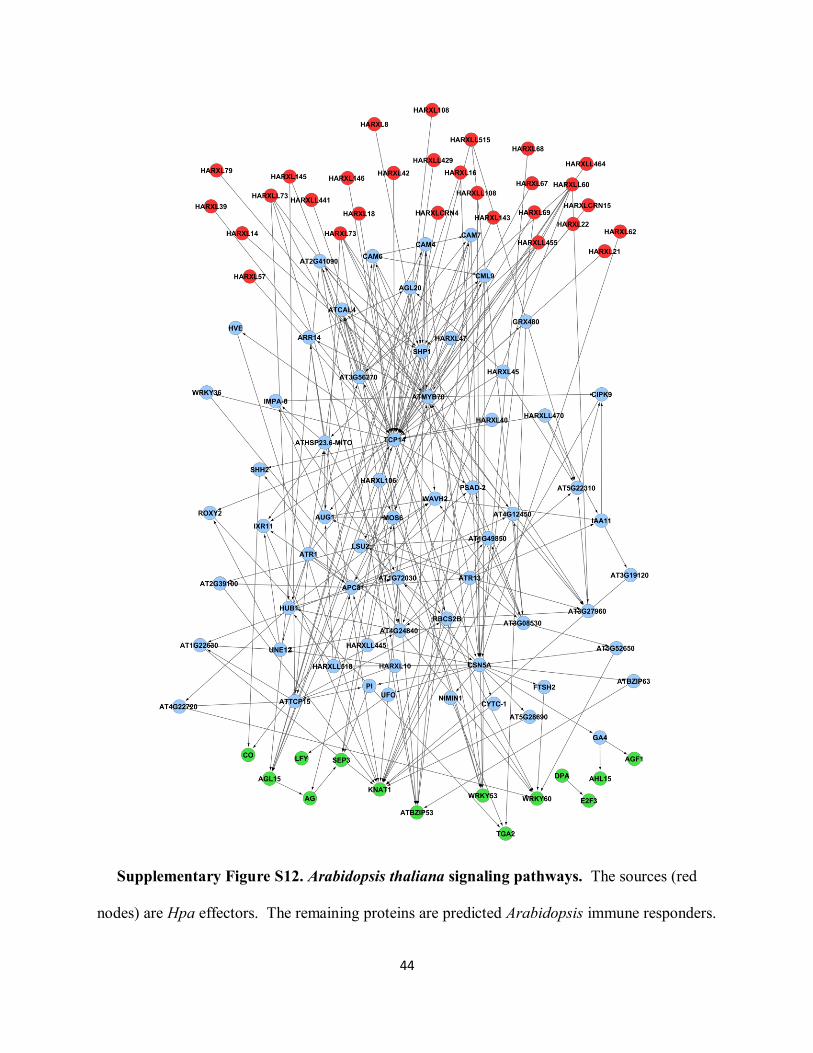
Arabidopsis thaliana immune response model
Although the gene expression measurements span nearly one week, the inferred regulatory paths
in the SDREM model of Arabidopsis response to Hyaloperonospora arabidopsidis (Hpa)
indicate that the transcriptional changes are sustained over this long period (Supplementary Fig.
S11). Many of the predicted active TFs are active at numerous splits along the regulatory paths.
We found that these TFs are very strongly connected to the Hpa effectors (the pathogen proteins
used as the sources) in the signaling network and hence have strong activity priors. However,
they bind relatively few genes on some of the regulatory paths so their high activity scores are
primarily due to the strong priors (which are invariant across the different splits) as opposed to
the behavior of their bound genes at each split. The signaling pathways in the SDREM model
are shown in Supplementary Fig. S12, and Supplementary Table S10 provides the full model
including the sources and SDREM predictions.
Mukhtar et al examined insertion mutants of 17 Arabidopsis proteins that are targeted by both
Hpa and the Pseudomonas syringae bacterium (Mukhtar et al. 2011). Fifteen of these exhibited
enhanced host susceptibility or resistance to infection by various Hpa isolates, and 6 of the
validated proteins – APC8, AT3G27960, ATTCP15, CSN5A, LSU2, and TCP14 – were
predicted by SDREM (p-value 7.29 × 10⁻⁸
, Fisher‟s exact test). Another 7 of SDREM‟s
predictions – internal nodes HUB1, MOS6, and NIMIN1 as well as targets TGA2, TGA3,

43
WRKY53, and WRKY60 – were annotated as “defense response” proteins in Gene Ontology
(Ashburner et al. 2000).
Supplementary Figure S11. Arabidopsis thaliana regulatory paths.
44
Supplementary Figure S12. Arabidopsis thaliana signaling pathways. The sources (red
nodes) are Hpa effectors. The remaining proteins are predicted Arabidopsis immune responders.
45
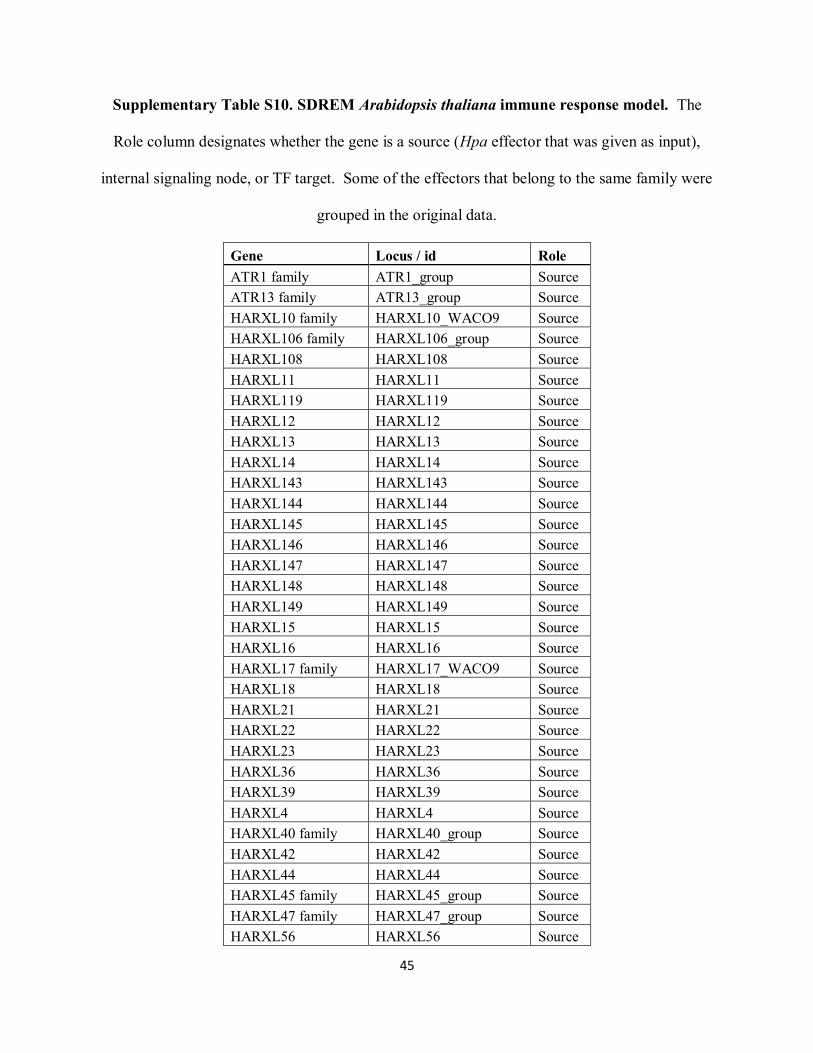
Supplementary Table S10. SDREM Arabidopsis thaliana immune response model. The
Role column designates whether the gene is a source (Hpa effector that was given as input),
internal signaling node, or TF target. Some of the effectors that belong to the same family were
grouped in the original data.
Gene Locus / id Role
ATR1 family ATR1_group Source
ATR13 family ATR13_group Source
HARXL10 family HARXL10_WACO9 Source
HARXL106 family HARXL106_group Source
HARXL108 HARXL108 Source
HARXL11 HARXL11 Source
HARXL119 HARXL119 Source
HARXL12 HARXL12 Source
HARXL13 HARXL13 Source
HARXL14 HARXL14 Source
HARXL143 HARXL143 Source
HARXL144 HARXL144 Source
HARXL145 HARXL145 Source
HARXL146 HARXL146 Source
HARXL147 HARXL147 Source
HARXL148 HARXL148 Source
HARXL149 HARXL149 Source
HARXL15 HARXL15 Source
HARXL16 HARXL16 Source
HARXL17 family HARXL17_WACO9 Source
HARXL18 HARXL18 Source
HARXL21 HARXL21 Source
HARXL22 HARXL22 Source
HARXL23 HARXL23 Source
HARXL36 HARXL36 Source
HARXL39 HARXL39 Source
HARXL4 HARXL4 Source
HARXL40 family HARXL40_group Source
HARXL42 HARXL42 Source
HARXL44 HARXL44 Source
HARXL45 family HARXL45_group Source
HARXL47 family HARXL47_group Source
HARXL56 HARXL56 Source

46
HARXL57 HARXL57 Source
HARXL59 HARXL59 Source
HARXL60 HARXL60 Source
HARXL62 HARXL62 Source
HARXL63 HARXL63 Source
HARXL64 HARXL64 Source
HARXL65 HARXL65 Source
HARXL67 HARXL67 Source
HARXL68 HARXL68 Source
HARXL69 HARXL69 Source
HARXL70 HARXL70 Source
HARXL72 HARXL72 Source
HARXL73 HARXL73 Source
HARXL74 HARXL74 Source
HARXL75 family HARXL75_WACO9 Source
HARXL76 family HARXL76_WACO9 Source
HARXL77 family HARXL77_group Source
HARXL78 family HARXL78_group Source
HARXL79 HARXL79 Source
HARXL8 HARXL8 Source
HARXL80 family HARXL80_group Source
HARXL89 HARXL89 Source
HARXLCRN15 HARXLCRN15 Source
HARXLCRN17 HARXLCRN17 Source
HARXLCRN4 HARXLCRN4 Source
HARXLL108 HARXLL108 Source
HARXLL148 HARXLL148 Source
HARXLL169 HARXLL169 Source
HARXLL429 HARXLL429 Source
HARXLL431 family HARXLL431_WACO9 Source
HARXLL437 HARXLL437 Source
HARXLL440 HARXLL440 Source
HARXLL441 HARXLL441 Source
HARXLL445 family HARXLL445_group Source
HARXLL446 HARXLL446 Source
HARXLL449 HARXLL449 Source
HARXLL455 HARXLL455 Source
HARXLL464 HARXLL464 Source
HARXLL468 HARXLL468 Source
HARXLL470 family HARXLL470_WACO9 Source
HARXLL480 HARXLL480 Source

47
HARXLL492 HARXLL492 Source
HARXLL493 HARXLL493 Source
HARXLL495 HARXLL495 Source
HARXLL497 HARXLL497 Source
HARXLL515 HARXLL515 Source
HARXLL516 family HARXLL516_WACO9 Source
HARXLL517 family HARXLL517_WACO9 Source
HARXLL518 family HARXLL518_WACO9 Source
HARXLL519 family HARXLL519_WACO9 Source
HARXLL520 family HARXLL520_WACO9 Source
HARXLL60 HARXLL60 Source
HARXLL62_A HARXLL62_A Source
HARXLL62_B HARXLL62_B Source
HARXLL73 HARXLL73 Source
HARXLL73 family HARXLL73_group Source
HARXLL91 HARXLL91 Source
HARXLL94 HARXLL94 Source
AGL20 AT2G45660 Internal
APC8 AT3G48150 Internal
ARR14 AT2G01760 Internal
AT1G22630 AT1G22630 Internal
AT1G49850 AT1G49850 Internal
AT1G72030 AT1G72030 Internal
AT2G39100 AT2G39100 Internal
AT2G41090 AT2G41090 Internal
AT3G08530 AT3G08530 Internal
AT3G19120 AT3G19120 Internal
AT3G27960 AT3G27960 Internal
AT3G56270 AT3G56270 Internal
AT4G12450 AT4G12450 Internal
AT4G22720 AT4G22720 Internal
AT4G24840 AT4G24840 Internal
AT5G22310 AT5G22310 Internal
AT5G28690 AT5G28690 Internal
AT5G52650 AT5G52650 Internal
ATBZIP63 AT5G28770 Internal
ATCAL4 AT2G41100 Internal
ATHSP23.6-MITO AT4G25200 Internal
ATMYB70 AT2G23290 Internal
ATR1 ATR1 Internal
ATR13 ATR13 Internal

48
ATTCP15 AT1G69690 Internal
AUG1 AT2G41350 Internal
CAM4 AT1G66410 Internal
CAM6 AT5G21274 Internal
CAM7 AT3G43810 Internal
CIPK9 AT1G01140 Internal
CML9 AT3G51920 Internal
CSN5A AT1G22920 Internal
CYTC-1 AT1G22840 Internal
FTSH2 AT2G30950 Internal
GA4 AT1G15550 Internal
GRX480 AT1G28480 Internal
HARXL10 HARXL10 Internal
HARXL106 HARXL106 Internal
HARXL40 HARXL40 Internal
HARXL45 HARXL45 Internal
HARXL47 HARXL47 Internal
HARXLL445 HARXLL445 Internal
HARXLL470 HARXLL470 Internal
HARXLL518 HARXLL518 Internal
HUB1 AT2G44950 Internal
HVE AT2G02560 Internal
IAA11 AT4G28640 Internal
IMPA-6 AT1G02690 Internal
IXR11 AT1G62990 Internal
LSU2 AT5G24660 Internal
MOS6 AT4G02150 Internal
NIMIN1 AT1G02450 Internal
PI AT5G20240 Internal
PSAD-2 AT1G03130 Internal
RBCS2B AT5G38420 Internal
ROXY2 AT5G14070 Internal
SHH2 AT3G18380 Internal
SHP1 AT3G58780 Internal
TCP14 AT3G47620 Internal
UFO AT1G30950 Internal
UNE12 AT4G02590 Internal
WAVH2 AT5G65683 Internal
WRKY36 AT1G69810 Internal
AG AT4G18960 Target
AGF1 AT4G35390 Target

49
AGL15 AT5G13790 Target
AHL15 AT3G55560 Target
AP2 AT4G36920 Target
ATBZIP53 AT3G62420 Target
AT-HSFC1 AT3G24520 Target
CO AT5G15840 Target
DPA AT5G02470 Target
E2F3 AT2G36010 Target
HY5 AT5G11260 Target
KNAT1 AT4G08150 Target
LFY AT5G61850 Target
PIL5 AT2G20180 Target
POC1 AT1G09530 Target
SEP3 AT1G24260 Target
TGA2 AT5G06950 Target
TGA3 AT1G22070 Target
WRKY53 AT4G23810 Target
WRKY60 AT2G25000 Target
Physical Network Models and ResponseNet comparison
PNM predicts a very large set of proteins, 445 for the short expression data and 309 for the long
expression data. Even though it predicts over 6 times more proteins than SDREM in both cases,
it recovers only 2 or 3 more gold standard proteins than SDREM, resulting in less significant
overlaps. The noteworthy omission of Hog1 in the PNM network constructed with the long
expression data and insignificant overlap between the predicted TFs and gold standard TFs
indicate the HOG pathway is not well-represented even in the large predicted network. In the
main text, we anecdotally demonstrated 7 interactions from the HOG pathway that SDREM
oriented correctly in the short model. Of these 7, PNM correctly orients the edges Ste50→Ste11,
Sho1→Pbs2, Pbs2→Hog1, and Hog1→Sko1 but does not include the edges Sho1→Ste11,
Ste11→Pbs2, or Hog1→Hot1 in its pathways. Although this sample is far too small to draw any
broad conclusions, these results may suggest that PNM can correctly orient critical HOG

50
pathway edges but struggles to identify the relevant nodes and interactions relative to SDREM
(Table 1).
When run with the default settings, ResponseNet‟s capping parameter is set to 0.7, which
controls the maximum edge weight in the network. The majority of the edge weights in our
interaction network are ≥ 0.7 so this leads to a network where most of the edges have the same
maximum weight of 0.7. Consequently, ResponseNet struggles to predict internal signaling
nodes in this setting and includes only 4 such proteins in its network. Hog1 is not among those 4
proteins, and the large set of predicted TFs does not significantly overlap the HOG gold standard
TFs (Table 1).
Therefore, we varied the capping parameter from 0.6 (the smallest value tested in Yeger-Lotem
et al (Yeger-Lotem et al. 2009)) to 1.0 (the maximum possible value) and the gamma parameter,
which generally controls the network size, from 5 to 20 (the recommended range) and reran
ResponseNet on the short expression data. We found that the internal node predictions were
significantly better under different settings. For example, when gamma is 10 and capping is 0.9,
4 of the 8 predicted signaling proteins are in the HOG pathway (p-value 5.99 × 10⁻⁸
), including
Hog1.
Surprisingly, the TF predictions are independent of the choice of gamma and are affected only by
the capping parameter (Supplementary Table S11). In all cases, ResponseNet recovers between
0 and 2 known HOG pathway TFs, and the overlaps with the HOG TFs are insignificant. One
possible explanation is that ResponseNet cannot analyze gene expression dynamics, which

51
impairs its ability to recover the HOG TFs. SDREM works directly with the temporal expression
values, which enables it to identify time points when a subset of a TF‟s bound genes are
differentially expressed (diverging from genes not bound by the TF). These patterns may not
emerge in a static dataset.
Supplementary Table S11. ResponseNet TF predictions under various parameter settings.
Gamma (default value 10) and capping (default value 0.7) are the ResponseNet parameters that
were varied.
Gamma Capping Predicted TFs Gold standard TFs TF overlap TF significance
5 0.6 59 7 2 0.655
5 0.7 57 7 2 0.632
5 0.8 5 7 1 0.162
5 0.9 5 7 1 0.162
5 1 6 7 0 1.000
10 0.6 59 7 2 0.655
10 0.7 57 7 2 0.632
10 0.8 5 7 1 0.162
10 0.9 5 7 1 0.162
10 1 6 7 0 1.000
15 0.6 59 7 2 0.655
15 0.7 57 7 2 0.632
15 0.8 5 7 1 0.162
15 0.9 5 7 1 0.162
15 1 6 7 0 1.000
20 0.6 59 7 2 0.655
20 0.7 57 7 2 0.632
20 0.8 5 7 1 0.162
20 0.9 5 7 1 0.162
20 1 6 7 0 1.000
GeneReg comparison
GeneReg is an algorithm that uses time-lagged linear regression to extract potential regulatory
relationships from time series gene expression data (Huang et al. 2010). We selected GeneReg

52
in particular because similar approaches that rely on time-lagged correlation (Schmitt et al. 2004;
Balasubramaniyan et al. 2005) or time-lagged mutual information (Zoppoli et al. 2010) either do
not make their software available (Schmitt et al. 2004; Balasubramaniyan et al. 2005) or do not
scale to handle thousands of genes information (Zoppoli et al. 2010). We ran GeneReg on the
long expression dataset since the temporal patterns in this dataset, which captures the response
and recovery, should be easier for a time-lagged method to detect. However, when we evaluated
the TFs that GeneReg predicted to be most active in the stress response at several thresholds, its
predictions did not significantly overlap with the HOG gold standard TFs (Supplementary Table
S12). Note that some of these top-ranked TFs were in the osmotic stress screens even though
they are not gold standard TFs, and Msn4 ranked just outside of the top 28 TFs. Even in the best
case, algorithms that rely on expression data alone can only recover TFs that are differentially
expressed. In contrast, we found evidence that only a handful of TFs are transcriptionally
activated in the long model, and in the short model even fewer HOG TFs are differentially
expressed, which emphasizes the benefits of jointly modeling the upstream interaction networks
and the dynamic expression data like SDREM.
Supplementary Table S12. Evaluation of GeneReg TF predictions. At various thresholds, the
top-ranked TFs from GeneReg do not significantly overlap with the HOG TFs. The SDREM TF
predictions (28 targets and 6 TFs in the set of internal nodes) from the long model are shown for
comparison.
Algorithm SDREM GeneReg GeneReg GeneReg
Predicted TFs 34 10 28 46
Gold standard TFs 7 7 7 7
TF overlap 4 1 2 3
TF significance 0.0161 0.302 0.249 0.194

53
Parameter selection and robustness
Whenever possible, SDREM‟s parameters were selected in accordance with existing biological
data or computational approaches. We used condition-specific osmotic stress data to obtain an
estimate for the active TF influence parameter, which represents the portion of bound genes that
are expected to be affected by an active TF. The TFs Hot1 and Sko1 are the two HOG pathway
TFs for which we have condition-specific binding data (Capaldi et al. 2008), and both are known
to be active in the osmotic stress response. 79% of the genes bound by Hot1 are differentially
expressed in both the short osmotic stress expression data and the long expression data.
Likewise, 79% of genes bound by Sko1 are affected in the short expression data and 68% in the
long expression dataset. Therefore, we set this parameter‟s default value to 80%.
Several parameters such as the path length, PPI edge weight threshold, and number of top paths
used for scoring were selected from a detailed analysis we performed on yeast PPI networks
(Gitter et al. 2011). We showed that using a path length of 5 is a reasonable compromise
between coverage and computational complexity, that edges with a weight of less than 0.6 are
generally low-confidence interactions that have not been reported multiple times or detected
using a high-confidence experimental technology and are thus less beneficial for pathway
reconstruction, and that by focusing on the smaller set of the top 100 paths we can achieve better
precision and recall compared to using more paths. In this previous study, the number of targets
in the network was fixed, which suggested using a fixed threshold for the number of top paths.
The number of paths considered by SDREM is equal to 5 times the number of targets instead of
the fixed value of 100 to account for the fluctuating number of targets over all iterations. In the
short model, this flexibility results in using between 95 and 140 top paths.

54
The protein-DNA edge weights (Supplementary Table S19) are motivated by the ResponseNet
(Yeger-Lotem et al. 2009) and PPI network weighting schemes (Supplementary Methods). In
Supplementary Materials of (Hillenmeyer et al. 2008), the authors recommend a p-value cutoff
of 10-5
to control for multiple hypothesis testing across genes that are sensitive in any of the 178
conditions tested in the homozygous collection. However, because we are only interested in
deletion strains that exhibit a fitness defect in one specific condition, we used a less stringent
threshold of 10-4
.
The differential expression thresholds differ for the short and long osmotic stress expression
datasets due to disparities in the respective experimental frameworks. The two studies use
different microarrays, osmostic stresses, sampling times, etc. (Gasch et al. 2000; Romero-
Santacreu et al. 2009) leading to expression profiles that are not directly comparable. A lower
differential expression threshold was used for the long osmotic stress expression data because
this dataset exhibited lower magnitude fold changes. Using a lower expression threshold enabled
us to analyze roughly the same number of genes in both osmotic stress expression datasets.
Specifically, a log2 fold change threshold of 1 was used for the short osmotic stress data and 0.5
was used for the long expression data instead.
The activity score and node score thresholds were selected arbitrarily, but were found to yield
good false positive rates. For the short model the target TF false positive rate is 13.3% and the
internal node false positive rate is 0.6%. For the long model the target TF false positive rate is
21.2% and the internal node false positive rate is 0.3%. If we use both the HOG gold standard

55
and osmotic stress screens to define the positive and negative genes, the false positive rates are
nearly identical.
For those parameters that could not be directly estimated from biological data, we made an initial
choice of value based on our intuition of the algorithm‟s behavior. We then tested the robustness
of this selection to small fluctuations in the parameter value (where robustness is measured in
terms of the overlap in the outcomes between different parameter values), following the
approach of (Kim et al. 2011). These parameters were consistent across all SDREM runs and are
suitable for analysis of other conditions or organisms.
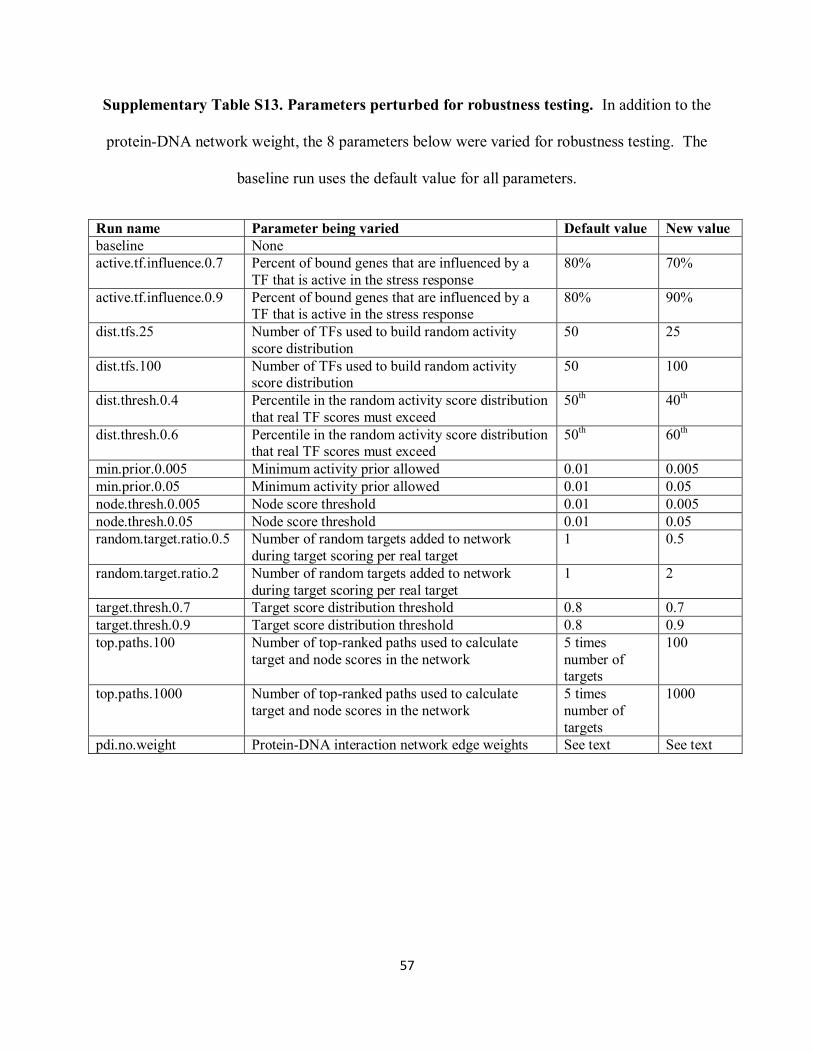
Supplementary Table S13 describes the 8 parameters that were varied during the robustness
testing, all of which was performed using the short osmotic stress expression data. In addition to
the 2 runs per parameter (using a lower/higher value than the default), we ran SDREM with an
unweighted version of our protein-DNA interaction network to observe whether our weighting
scheme enhanced SDREM‟s predictions. The topology of this unweighted network was identical
to the original protein-DNA interaction network, but the weights were uniformly set to 1. The
PPI edge weights were not changed because their weights have been justified previously (Gitter
et al. 2011).
Although varying these parameters does have an effect on the SDREM output, the core of the
predicted network remains the same. Nearly all of the new runs generate fewer predictions than
the baseline run, but in the majority of the runs over 90% of the new predictions are also found in
the baseline predictions (Supplementary Table S14). The notable exception is the set of
56
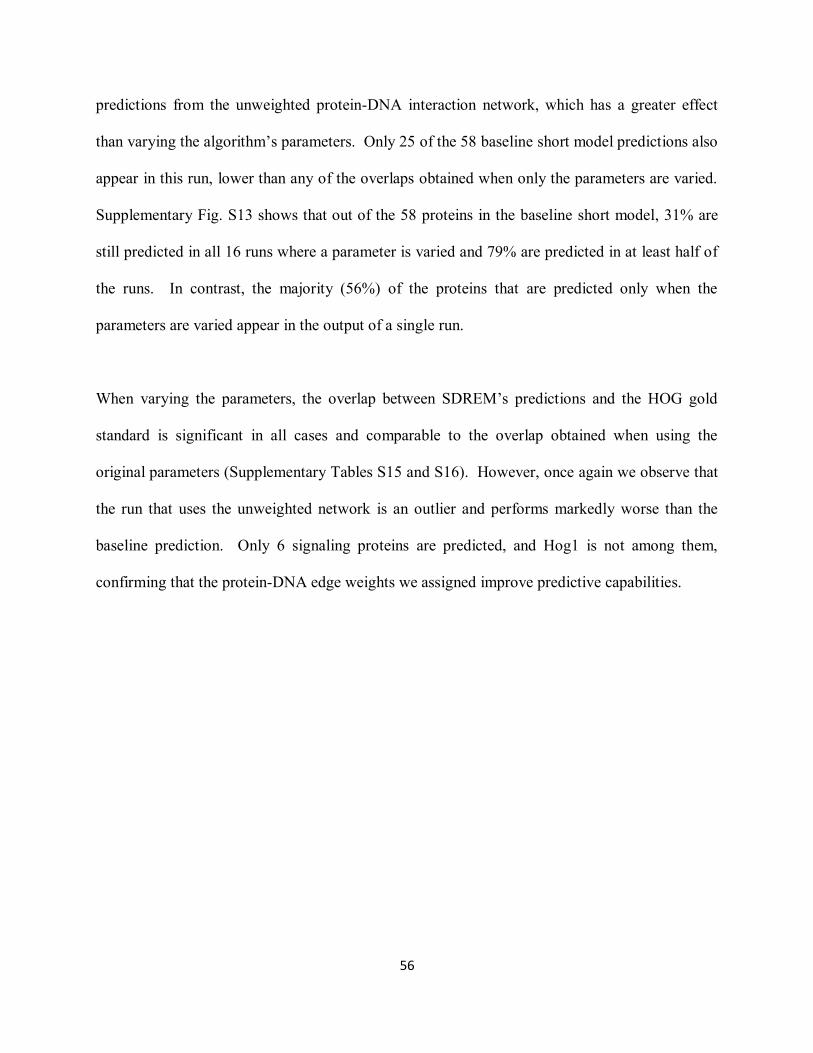
predictions from the unweighted protein-DNA interaction network, which has a greater effect
than varying the algorithm‟s parameters. Only 25 of the 58 baseline short model predictions also
appear in this run, lower than any of the overlaps obtained when only the parameters are varied.
Supplementary Fig. S13 shows that out of the 58 proteins in the baseline short model, 31% are
still predicted in all 16 runs where a parameter is varied and 79% are predicted in at least half of
the runs. In contrast, the majority (56%) of the proteins that are predicted only when the
parameters are varied appear in the output of a single run.
When varying the parameters, the overlap between SDREM‟s predictions and the HOG gold
standard is significant in all cases and comparable to the overlap obtained when using the
original parameters (Supplementary Tables S15 and S16). However, once again we observe that
the run that uses the unweighted network is an outlier and performs markedly worse than the
baseline prediction. Only 6 signaling proteins are predicted, and Hog1 is not among them,
confirming that the protein-DNA edge weights we assigned improve predictive capabilities.
57
Supplementary Table S13. Parameters perturbed for robustness testing. In addition to the
protein-DNA network weight, the 8 parameters below were varied for robustness testing. The
baseline run uses the default value for all parameters.
Run name Parameter being varied Default value New value
baseline None
active.tf.influence.0.7 Percent of bound genes that are influenced by a
TF that is active in the stress response
80% 70%
active.tf.influence.0.9 Percent of bound genes that are influenced by a TF that is active in the stress response
80% 90%
dist.tfs.25 Number of TFs used to build random activity
score distribution
50 25
dist.tfs.100 Number of TFs used to build random activity score distribution
50 100
dist.thresh.0.4 Percentile in the random activity score distribution
that real TF scores must exceed
50th
40th
dist.thresh.0.6 Percentile in the random activity score distribution that real TF scores must exceed
50th
60th
min.prior.0.005 Minimum activity prior allowed 0.01 0.005
min.prior.0.05 Minimum activity prior allowed 0.01 0.05
node.thresh.0.005 Node score threshold 0.01 0.005
node.thresh.0.05 Node score threshold 0.01 0.05
random.target.ratio.0.5 Number of random targets added to network
during target scoring per real target
1 0.5
random.target.ratio.2 Number of random targets added to network
during target scoring per real target
1 2
target.thresh.0.7 Target score distribution threshold 0.8 0.7
target.thresh.0.9 Target score distribution threshold 0.8 0.9
top.paths.100 Number of top-ranked paths used to calculate
target and node scores in the network
5 times
number of targets
100
top.paths.1000 Number of top-ranked paths used to calculate
target and node scores in the network
5 times
number of
targets
1000
pdi.no.weight Protein-DNA interaction network edge weights See text See text

58
Supplementary Table S14. Baseline overlap during perturbation testing. The number of
proteins predicted by the baseline model and the runs in which a single parameter was varied.
The five sources are present in all models and are not included in the counts. Overlap
percentages are calculated with respect to the baseline („Baseline overlap‟) and the robustness
testing run („Run overlap‟).
Run name Baseline
predictions
Run
predictions
Overlap Baseline
overlap
Run overlap
active.tf.influence.0.7 58 46 41 71% 89%
active.tf.influence.0.9 58 28 28 48% 100%
dist.tfs.25 58 41 36 62% 88%
dist.tfs.100 58 52 41 71% 79%
dist.thresh.0.4 58 53 49 84% 92%
dist.thresh.0.6 58 36 36 62% 100%
min.prior.0.005 58 51 47 81% 92%
min.prior.0.05 58 50 47 81% 94%
node.thresh.0.005 58 57 55 95% 96%
node.thresh.0.05 58 39 32 55% 82%
random.target.ratio.0.5 58 58 55 95% 95%
random.target.ratio.2 58 52 49 84% 94%
target.thresh.0.7 58 58 55 95% 95%
target.thresh.0.9 58 42 41 71% 98%
top.paths.100 58 53 49 84% 92%
top.paths.1000 58 68 45 78% 66%
pdi.no.weight 58 35 25 43% 71%

59
Supplementary Figure S13. Histogram of the number of occurrences of each protein
across all perturbation testing. The number of runs specifies how many models include a
particular protein. The frequency provides the number of proteins that fall into each bin. For
example, 23 proteins are predicted in only a single run. The „pdi.no.weight‟ run is not included
in the counts. The five sources appear in all models and are also not counted.

60
Supplementary Table S15. Robustness testing signaling protein overlap significance. The
significance of the overlap between the HOG gold standard signaling proteins (those that are not
sources or TFs) and signaling proteins in the SDREM models. The total predictions include the
signaling proteins and TFs, but not the five sources.
Run name Total
predictions
Predicts
Hog1
Predicted
signaling
Gold standard
signaling
Signaling
overlap
Signaling
significance
baseline 58 Y 30 30 6 1.11 × 10⁻⁸
active.tf.influence.0.7 46 Y 18 30 6 3.65 × 10⁻¹⁰
active.tf.influence.0.9 28 Y 11 30 4 2.79 × 10⁻⁷
dist.tfs.25 41 Y 22 30 6 1.44 × 10⁻⁹
dist.tfs.100 52 Y 16 30 5 1.80 × 10⁻⁸
dist.thresh.0.4 53 Y 21 30 6 1.05 × 10⁻⁹
dist.thresh.0.6 36 Y 17 30 5 2.55 × 10⁻⁸
min.prior.0.005 51 Y 21 30 6 1.05 × 10⁻⁹
min.prior.0.05 50 Y 22 30 6 1.44 × 10⁻⁹
node.thresh.0.005 57 Y 30 30 6 1.11 × 10⁻⁸
node.thresh.0.05 39 Y 11 30 4 2.79 × 10⁻⁷
random.target.ratio.0.5 58 Y 31 30 6 1.37 × 10⁻⁸
random.target.ratio.2 52 Y 21 30 6 1.05 × 10⁻⁹
target.thresh.0.7 58 Y 32 30 6 1.68 × 10⁻⁸
target.thresh.0.9 42 Y 20 30 5 6.30 × 10⁻⁸
top.paths.100 53 Y 29 30 6 8.94 × 10⁻⁹
top.paths.1000 68 Y 28 30 8 1.19 × 10⁻¹²
pdi.no.weight 35 N 6 30 2 4.68 × 10⁻⁴

61
Supplementary Table S16. Robustness testing TF overlap significance. The significance of
the overlap between the HOG gold standard TFs and the SDREM model TFs. The total
predictions include the signaling proteins and TFs, but not the five sources.
Run name Total
predictions
Predicted TFs Gold standard
TFs
TF
overlap
TF significance
baseline 58 28 7 4 0.008
active.tf.influence.0.7 46 28 7 4 0.008
active.tf.influence.0.9 28 17 7 4 0.001
dist.tfs.25 41 19 7 4 0.002
dist.tfs.100 52 36 7 4 0.020
dist.thresh.0.4 53 32 7 5 0.001
dist.thresh.0.6 36 19 7 4 0.002
min.prior.0.005 51 30 7 4 0.010
min.prior.0.05 50 28 7 4 0.008
node.thresh.0.005 57 27 7 4 0.007
node.thresh.0.05 39 28 7 4 0.008
random.target.ratio.0.5 58 27 7 4 0.007
random.target.ratio.2 52 31 7 5 0.001
target.thresh.0.7 58 26 7 4 0.006
target.thresh.0.9 42 22 7 4 0.003
top.paths.100 53 24 7 4 0.004
top.paths.1000 68 40 7 5 0.004
pdi.no.weight 35 29 7 5 0.001
Convergence properties
Supplementary Tables S17 and S18 depict how the predicted TFs and internal nodes change over
the 10 iterations. The long model best demonstrates how SDREM converges in practice
(Supplementary Table S18). In the final 3 iterations, the same 51 proteins are predicted. The
short model nearly converges after 10 iterations but is slightly less stable than the long model.
Of the 58 predictions made in the final iteration, 54 are also predicted at the preceding iteration.
There is no single iteration that yields the most significant overlaps across all three metrics (gold
standard signaling proteins, gold standard TFs, and gold standard with screens) for either model.
When considering the osmotic stress screens, iteration 2 is best for the short model and iteration

62
1 is best for the long model. However, the long model in particular exhibits improvement over
time with respect to the gold standard, and the long model TFs overlap most strongly with the
gold standard at the final iteration. This highlights the reason we do not stop after only a few
iterations. Initially, many of the predicted TFs are not connected to the upstream signaling
pathways and some of the predicted signaling nodes are isolated from the core pathways.
Because our goal is to recover interpretable models that may suggest mechanistic explanations of
how each predicted protein is involved in the response (e.g. how a TF is activated), we iterate
and prune predictions that are not jointly supported by the signaling pathways and transcriptional
dynamics. Consequently, SDREM tends to predict fewer proteins as the iterations proceed,
especially fewer TFs.

63
Supplementary Table S17. Short model convergence. The table shows the number of
predictions made at each iteration of SDREM when run on the short osmotic stress expression
data and the overlaps with the osmotic stress evidence. The HOG gold standard was used to
evaluate the TFs and internal predictions individually and the combined osmotic stress evidence
(HOG pathway members and osmotic stress screen hits) was used to evaluate the TFs and
internal nodes together.
Iteration 1 2 3 4 5 6 7 8 9 10
Total
predictions
69 46 44 59 51 49 49 46 57 58
Predicted
internal
29 17 16 21 19 21 19 18 29 30
Gold
standard
internal
30 30 30 30 30 30 30 30 30 30
Internal
overlap
6 6 6 6 6 6 6 6 5 6
Internal
significance 8.94 ×
10-9
2.44
× 10-10
1.59
× 10-10
1.05
× 10-9
5.31
× 10-10
1.05
× 10-9
5.31
× 10-10
3.65
× 10-10
4.66
× 10-7
1.11
× 10-8
Predicted
TFs
40 29 28 38 32 28 30 28 28 28
Gold
standard
TFs
7 7 7 7 7 7 7 7 7 7
TF overlap 5 5 5 5 5 5 4 5 4 4
TF
significance
0.00368 7.37
× 10-4
6.16
× 10-4
0.00286 0.00122 6.16
× 10-4
0.0100 6.16
× 10-4
0.00770 0.00770
Gold
standard
or screen
hit
1167 1167 1167 1167 1167 1167 1167 1167 1167 1167
Combined
overlap
28 21 19 23 22 21 20 19 20 21
Combined
significance
1.85
× 10-4
1.67
× 10-4
8.00
× 10-4
0.00132 3.21
× 10-4
4.87
× 10-4
0.00138 0.001529 0.0105 0.00588

64
Supplementary Table S18. Long model convergence. The table shows the number of
predictions made at each iteration of SDREM when run on the long osmotic stress expression
data and the overlaps with the osmotic stress evidence. The HOG gold standard was used to
evaluate the TFs and internal predictions individually and the combined osmotic stress evidence
(HOG pathway members and osmotic stress screen hits) was used to evaluate the TFs and
internal nodes together.
Iteration 1 2 3 4 5 6 7 8 9 10
Total
predictions
92 66 64 59 55 55 54 51 51 51
Predicted
internal
29 18 20 19 19 19 19 17 17 17
Gold
standard
internal
30 30 30 30 30 30 30 30 30 30
Internal
overlap
6 6 6 6 6 6 5 5 5 5
Internal
significance
8.94
× 10-9
3.65
× 10-10
7.55
× 10-10
5.31
× 10-10
5.31
× 10-10
5.31
× 10-10
4.75
× 10-8
2.55
× 10-8
2.55
× 10-8
2.55
× 10-8
Predicted
TFs
63 48 44 40 36 36 35 34 34 34
Gold
standard
TFs
7 7 7 7 7 7 7 7 7 7
TF overlap 4 4 4 4 4 4 4 4 4 4
TF
significance
0.136 0.0555 0.0410 0.0292 0.0199 0.0199 0.0179 0.0161 0.0161 0.0161
Gold
standard
or screen
hit
1167 1167 1167 1167 1167 1167 1167 1167 1167 1167
Combined
overlap
31 21 19 19 18 18 17 17 17 17
Combined
significance
0.00340 0.0279 0.0678 0.0314 0.0304 0.0304 0.0495 0.0292 0.0292 0.0292

65
Supplementary Methods
DREM modification details
At each split in the regulatory paths in the SDREM model, an activity score is calculated for all
TFs. The score at a particular bifurcation event e is the likelihood ratio
)|0(
)|1(),(
t
t
GaP
GaPetscore
where a reflects whether the TF t is active at this split and Gt represents the expression profiles
of the set of genes bound by t that are on the path into the split e. By applying Bayes rule and
assuming that the expression profiles of bound genes are independent (a simplifying assumption
that is unlikely to be true in real data) we obtain
)0()0|(
)1()1|(
)0()0|(
)1()1|(
)(
)0()0|(
)(
)1()1|(
)|0(
)|1(
aPagP
aPagP
aPaGP
aPaGP
GP
aPaGP
GP
aPaGP
GaP
GaP
ti
ti
Gg i
Gg i
t
t
t
t
t
t
t
t
Initially, we place a uniform prior on TF activity such that 5.0)0()1( aPaP . In
subsequent iterations, the prior is influenced by the network orientation such that TFs that are
well-connected in the network have a larger prior. Specifically, the new prior of a well-
connected TF is the average of 1.0 and the TF‟s prior at the previous iteration. Poorly connected
TFs have their prior reduced but not beyond the minimum prior of 0.01.

66
To estimate the remaining probabilities, the set of bound genes Gt is divided into two sets: those
genes that are assigned to the primary path out of the split (gi = 1) and those assigned to the
secondary path(s) out of the split (gi = 0). The set of genes assigned to the primary path is
denoted GP and the set of genes on the secondary path is GS. The primary path is the path out of
the split followed by the majority of genes bound by the TF. In the case of a tie, the path with
the fewest genes (regulated by any TF, not just t) that is involved in the tie becomes the primary
path. All other paths out of the split are designated secondary paths and are considered as a
single group. There will always be at least one secondary path because the TF activity score is
only calculated at nodes in the model that have two or more children. After splitting genes by
the path they take, the score becomes
)0()0|0()0|1(
)1()1|0()1|1(
)0()0|0()0|1(
)1()1|0()1|1(
)0()0|(
)1()1|(
aPagPagP
aPagPagP
aPagPagP
aPagPagP
aPagP
aPagP
SP
SP
SiPi
SiPi
ti
ti
G
i
G
i
G
i
G
i
Gg iGg i
Gg iGg i
Gg i
Gg i
We assume that all bound genes respond to TF activity in the same manner and estimate that
80% of genes that are bound by a TF that is active in the stress condition are affected by the
binding (Supplementary Results). That is, 8.0)1|1( agP i and 2.0)1|0( agP i .
When the TF is not active, i.e. )0( a , the probability that a gene will be affected by the binding
is given by the background distribution. The background distribution is given by the percentage
of all genes (not just the set bound by t) along each path out of the split.
SP
P
iOO
OagP
)0|1( , where OP is the set of all genes that follow the primary path out of
the split and OS is the set of all genes on a secondary path out of the split. Likewise,

67
SP
S
iOO
OagP
)0|0( . Note that OP and OS exclude genes that are on another path and
do not enter the split. Thus, the final activity score is
)0(
)1(2.08.0),(
aPOO
O
OO
O
aPetscore
SP
SP
G
SP
S
G
SP
P
GG
The TF activity score at a particular iteration of SDREM is the maximum score achieved over all
possible bifurcation events e. To determine the significance of a specific activity score we use a
randomization method. We run DREM multiple times (10 for all analyses here) with protein-
DNA binding data that has been randomized. This generates a distribution of random TF activity
scores from which we select the top 50 activity scores from each randomized run. All TFs with
real activity scores in the 50th or greater percentile in this distribution are considered active, and
these TFs are used as targets during the subsequent network orientation. Because TF activity
scores can take arbitrarily large values, we normalize them before incorporating them into the
network orientation objective function. Activity scores are normalized by multiplying their
percentile in the random distribution (not the score itself) by k, the maximum path length in the
network orientation.
Interaction network weighting
All protein-protein interaction data was obtained from version 2.0.51 of BioGRID (Stark et al.
2006). The experimental method(s) used to detect interactions and number of times they were
independently reported were used to weight all edges in the PPI network as previously described
(Gitter et al. 2011), and only high-confidence edges with a weight of at least 0.6 were retained in
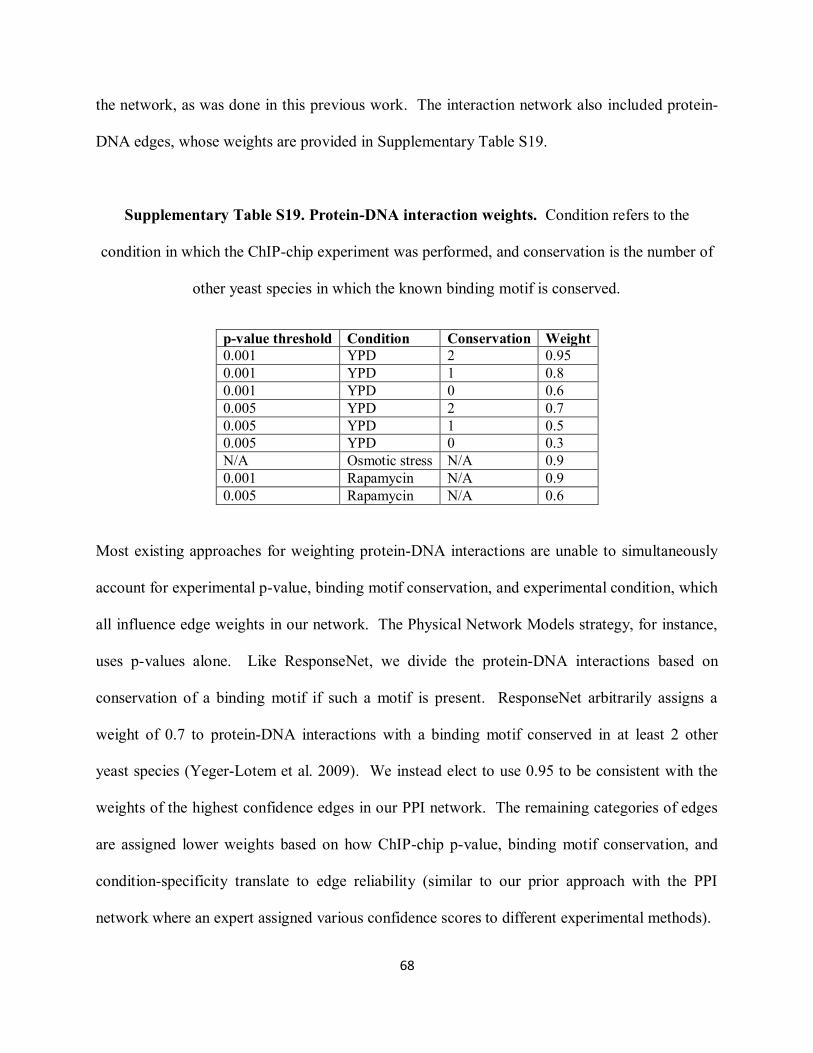
68
the network, as was done in this previous work. The interaction network also included protein-
DNA edges, whose weights are provided in Supplementary Table S19.
Supplementary Table S19. Protein-DNA interaction weights. Condition refers to the
condition in which the ChIP-chip experiment was performed, and conservation is the number of
other yeast species in which the known binding motif is conserved.
p-value threshold Condition Conservation Weight
0.001 YPD 2 0.95
0.001 YPD 1 0.8
0.001 YPD 0 0.6
0.005 YPD 2 0.7
0.005 YPD 1 0.5
0.005 YPD 0 0.3
N/A Osmotic stress N/A 0.9
0.001 Rapamycin N/A 0.9
0.005 Rapamycin N/A 0.6
Most existing approaches for weighting protein-DNA interactions are unable to simultaneously
account for experimental p-value, binding motif conservation, and experimental condition, which
all influence edge weights in our network. The Physical Network Models strategy, for instance,
uses p-values alone. Like ResponseNet, we divide the protein-DNA interactions based on
conservation of a binding motif if such a motif is present. ResponseNet arbitrarily assigns a
weight of 0.7 to protein-DNA interactions with a binding motif conserved in at least 2 other
yeast species (Yeger-Lotem et al. 2009). We instead elect to use 0.95 to be consistent with the
weights of the highest confidence edges in our PPI network. The remaining categories of edges
are assigned lower weights based on how ChIP-chip p-value, binding motif conservation, and
condition-specificity translate to edge reliability (similar to our prior approach with the PPI
network where an expert assigned various confidence scores to different experimental methods).

69
Protein-DNA interactions with p-values greater than 0.005 were discarded. The interaction
networks used to build the osmotic stress and rapamycin models included the general interaction
data plus either the osmotic stress or rapamycin binding data, respectively. The YPD data only
includes interactions with known binding motifs (MacIsaac et al. 2006). The osmotic stress
interactions were measured in cells treated with the salt KCl (Capaldi et al. 2008). There is no p-
value threshold in Supplementary Table S19 for this dataset because only enrichment ratios are
publicly available. To obtain a set of interactions, we used the thresholds provided in Fig. 4 of
Capaldi et al, in which it was reported that 82 Sko1 targets and 35 Hot1 targets had a p-value less
than 0.05 in their custom peak-fitting model. For each TF, we then selected this number of top-
ranked genes from the ChIP-chip enrichment ratio dataset. For the rapamycin binding data
(Harbison et al. 2004), p-values were available.
Osmotic stress data and validation
These 5 source proteins (Cdc42, Msb2, Sho1, Sln1, and Ste50) are the proteins in the Science
Signaling Database of Cell Signaling HOG pathway representation that are upstream and do not
have a parent node. In addition to the signaling databases (Supplementary Table S3), we
compiled a set of osmotic stress responders by considering several resources. We included all
genes that were annotated with decreased resistance to hyperosmotic stress in SGD
(http://www.yeastgenome.org/cgi-
bin/phenotype/phenotype.pl?rm=specific_tables&phenotype=hyperosmotic%20stress%20resista
nce:%20decreased). We also included genes if their deletion strains exhibited a fitness defect in
sorbitol (Hillenmeyer et al. 2008). For this sorbitol screen, we required that at least one p-value
across all replicates was less than 10-4
. Finally, we searched the literature for proteins that were
70
previously identified to be associated with this response (see Supplementary Tables S1, S2, S4,
and S5).
The osmotic stress analysis incorporated Hot1 and Sko1 ChIP-chip measurements in the
presence of salt (Capaldi et al. 2008). Dynamic expression data collected from a wild type strain
subjected to osmotic stress (0.4 M NaCl) was used to build the short model (Romero-Santacreu
et al. 2009). All replicates were included in the analysis. The long model‟s expression data was
from cells treated with sorbitol (Gasch et al. 2000). Although both datasets were collected after
subjecting yeast cells to an osmotic stress, we analyze both due to the differences in the
transcriptional responses observed. SDREM filters genes that are not differentially expressed,
and of the 2707 genes that are differentially expressed in the short model and 2889 genes that are
differentially expressed in the long model, only 1406 are present in both (making the similarity
of the predicted network models quite remarkable).
The p-values reported for the overlaps between the short model predictions and the HOG gold
standard were calculated using Fisher‟s exact test. We permissively define TFs to be any protein
present in the ChIP-chip binding data (Harbison et al. 2004; Capaldi et al. 2008) with the
exception of Hog1, a known MAPK. Under this definition, the gold standard contains 7 TFs, 28
of SDREM‟s predictions are TFs, and 4 of those predictions are in the gold standard. Our
dataset included 203 TFs that could potentially be chosen by SDREM, and the p-values were
calculated in this context. There were 30 non-TF SDREM predictions, 30 additional gold
standard proteins, and 6 proteins in both sets. For this p-value calculation we considered 5245
possible proteins, which include all proteins in our physical interaction network and all gold

71
standard members. The 5 source proteins given as input to SDREM are excluded from this
analysis. The p-value reported for the overlap between SDREM‟s predictions and the osmotic
stress-related genes includes both the HOG gold standard members and genetic screen hits (from
SGD and Hillenmeyer et al (Hillenmeyer et al. 2008)) in the positive set and considered all
SDREM predictions (TFs and non-TFs) jointly. Additional predictions that were validated only
in the literature search also were excluded from this calculation. The overlaps for the long model
were calculated in the same manner.
Microscopy
Multiple repeats were collected for the control and sorbitol-exposed cells. However, only a
single representative image with clearly defined cell boundaries was selected for significance
testing. ImageJ (Abramoff et al. 2004) was used for all image post-processing and analysis.
Background subtraction was performed using the default settings (the rolling ball algorithm with
a 50 pixel radius) and the images were converted to grayscale. Regions of interest (ROIs) were
manually defined to annotate the cell boundaries, and the standard deviation of pixel intensity
from all ROIs in an image was extracted (Supplementary Fig. S5). Cells without distinct
boundaries were excluded from the analysis. A one-tailed t-test assuming unequal variance and
sample sizes was used to calculate p-values. Images in Fig. 4A are shown after background
subtraction, and the original images are available on SDREM‟s supporting website.
Flow cytometry
All FACS replicates originally contained measurements from 50000 individual cells.
Approximately half of these data points remained after filtering based on the FSC-A and SSC-A

72
values; similar filtering is customary in the analysis of FACS data (Bar-Even et al. 2006).
Supplementary Table S20 shows how many outliers were removed in each replicate. In some of
the Cin5 and Spt23 replicates, the protein expression before sorbitol treatment was lower than
the background, which lead to negative fold change values. Experiments yielding negative fold
change were excluded from subsequent analysis, which is why these two proteins were excluded
from Fig. 4B. P-values for Gcn4, Hog1, and Rox1 were calculated using a paired one-tailed t-
test, which tests the log2 mean background-subtracted protein expression levels (Supplementary
Table S20). Biological replicates were paired according to the date of the experiments.
Knockout analysis
ASF1, BEM1, FUS3, GAL11, PCL2, and RVS167 were selected for deletion due to their
predicted role in the short model. However, most were important nodes in the oriented network
of the long model as well. In addition, we excluded TFs from the set of potential knockout
candidates and sought proteins that belonged to different levels of the signaling network
hierarchy. That is, some proteins were further upstream whereas others were downstream and
interact directly with transcription factors.
The Agilent scanner allows adjustment of the photomultiplier tube (PMT) sensitivity level. Our
comparison of gene expression fold changes at PMT sensitivity levels of 10% and 100% showed
that they were not substantially different, and we used the 10% scans for all subsequent analysis.
After scanning and processing per standard Agilent protocols (Agilent's Feature Extraction
software version 10.7.3.1.), we removed probes for which the coefficient of variation was greater

73
than 40%. For all microarray data we applied probe location normalization that is based on a
Gaussian image filtering technique to correct for spatial bias, which was followed by quantile
normalization. For each array we removed control probes and aggregated the data to the gene
level by taking the median expression level of all probes that corresponded to a particular gene.
Genes that were not differentially expressed in the wild type osmotic stress datasets were
excluded from further analysis. Because different genes were differentially expressed in the two
wild type datasets, we generated two knockout datasets for further processing. For the short
model, we required the wild type log2 differential expression to have magnitude of at least 1 and
did not allow missing data. This resulted in a set of 2655 genes (Supplementary Table S21) –
slightly fewer than the number of genes used to build the regulatory paths in SDREM where
missing data was allowed – of which 2624 were also on the arrays used for our knockouts. For
the long model, the log2 expression threshold was set to 0.5 and missing data was not allowed,
yielding a set of 2858 genes. Of these, 2784 were on our arrays (Supplementary Table S21).
We then used significance analysis of microarrays (SAM) (Tusher et al. 2001) to identify
significantly differentially expressed genes in the knockout data. SAM was run using the two
class unpaired response type, 1000 permutations, and default values for all other settings. We set
the delta parameter to the value that gave a false discovery rate of at most 0.2. In addition, we
required that significant genes had a minimum twofold change in expression. SAM produced
sets of significant up- and down-regulated genes that met these criteria. The distinct sets of up-
and down-regulated genes obtained from SAM were analyzed separately. Because SAM
imputes missing data, we eliminated genes for which all of the control readings or both of the
74
knockout replicate expression levels were missing from the sets of significant genes. The SAM
software depends on the statconnDCOM tool (Baier and Neuwirth 2007).
Although SAM does not take log ratios as input, we also calculated log2 differential expression
for the knockouts in order to facilitate reuse of the data. After normalizing the data, we took the
median of the two replicates per knockout and the replicates per control strain. Log ratios were
not calculated for genes in which expression levels across the replicates differed substantially
(i.e. the log2 absolute expression levels disagreed by more than 1.5). When four control
replicates per gene where available, if only one replicate disagreed with the others then it was
discarded and the log ratio was calculated using the other three. The raw and normalized
microarray data are available from GEO under accession number GSE28213.
To identify which knockouts affected genes that overlapped significantly with the genes on
SDREM regulatory paths, we used Fisher‟s exact test. The results from the knockout dataset that
was filtered using the short osmotic stress wild type expression data were only compared to the
short model, and the same is true for the long osmotic stress expression data and model. Rather
than use the all yeast genes as the set of all genes in Fisher‟s exact test, we only use those genes
that are affected by sorbitol, which yields conservative (larger) p-values. The overlaps were
calculated separately for the up- and down-regulated genes, and p-values were multiplied by the
number of regulatory paths (10 for the short model and 9 for the long model) to correct for
multiple hypothesis testing. Fig. 5B and Supplementary Fig. S6B – S8 associate a protein with a
regulatory path if either its differentially activated or repressed genes overlap the path with a
corrected p-value less than 0.05. For the osmotic stress-specific overlap analysis, all 868 general

75
environmental stress response genes (Gasch et al. 2000) were removed from the sets of genes on
the regulatory paths and the knockout-affected genes before calculating the overlaps and their
significance in the same manner (Supplementary Table S21).
To calculate the significance of the number of regulatory paths that significantly overlap with
one or more knockouts, we recalculated the overlaps using random regulatory paths. These
random regulatory paths contained the same number of genes on each path as the real regulatory
paths, but the gene assignment to paths was random. The same set of genes was used for the real
and random paths. We than calculated the number of random paths that significantly overlap one
or more knockouts with a corrected p-value ≤ 0.05, and used these counts to determine the p-
values of the real enrichment. For the osmotic stress-specific analysis, the procedure was
identical except all ESR genes were filtered from the regulatory paths and knockout effects.
TOR data and validation
Urban et al (Urban et al. 2007) studied the effects of rapamycin in several yeast strains, and we
used the dynamic expression data from the wild type strain with a log2 fold change threshold of
1. The extended gold standard data sources were described in the Supplementary Results. For
the Hillenmeyer et al rapamycin screen (Hillenmeyer et al. 2008), we required that in at least one
of the seven replicates the p-value was less than 10-4
(Supplementary Results). The p-value of
the overlap between SDREM predictions and the rapamycin extended gold standard was
calculated using Fisher‟s exact test. Twenty-one of the 48 predictions were in the extended gold
standard, which contained 1576 unique genes. We considered 6446 possible genes, which
includes all genes in our physical interaction network and all extended gold standard members.

76
Ten additional predictions that were validated only in the literature search were excluded from
this calculation.
Arabidopsis thaliana data, settings, and evaluation
Unlike the yeast analysis, the Arabidopsis interaction network included host-pathogen PPI
(Mukhtar et al. 2011) and Arabidopsis PPI (Arabidopsis Interactome Mapping Consortium 2011)
but not the protein-DNA interactions (Yilmaz et al. 2011) that were used to learn the regulatory
paths. The interaction network also used a uniform weight of 0.75 because the types of evidence
used to weight the yeast interaction network were not available. All Hpa effectors were used as
sources, and families of effectors were grouped as in the original data (Mukhtar et al. 2011). A
log2 fold change threshold of 0.5 was used for the temporal expression data (Wang et al. 2011)
and no missing values were allowed. The p-value for the overlap with the functionally validated
Arabidopsis immune responders was calculated with respect to all proteins in the PPI network
(i.e. all possible proteins SDREM could predict). The Gene Ontology (Ashburner et al. 2000)
analysis was performed using DAVID (Huang et al. 2009a, 2009b).
Physical Network Models, ResponseNet, and GeneReg settings
Although Physical Network Models and ResponseNet are both capable of linking sources and
targets in a physical interaction network, they were not designed to connect upstream proteins in
a signaling network to dynamic transcriptional effects. Therefore, comparing them with SDREM
requires running them in an untraditional manner or preprocessing the input data to emulate the
types of input they expect (Methods). We ran PNM using the default physical interaction
network provided with its code because all trials that used our interaction network produced an

77
empty set of predictions. This may be due to the much higher weights used in the PNM-
provided network. Although SDREM finds source-target paths with up to 5 edges, we set the
maximum path length for PNM to 4 because it was previously shown that PNM does not
terminate in a reasonable time when run on the yeast interactome with a path length of 5 (Gitter
et al. 2011).
We ran ReponseNet via the ResponseNet web server (Lan et al. 2011), which takes as input a set
of sources and set of targets. For the sources, we used the 5 HOG pathway sources and did not
assign weights so that the default uniform weights would be applied. The user may optionally
provide the PPI and protein-DNA interaction networks, and we uploaded the same weighted
networks used in the SDREM analysis.
We ran GeneReg on the long osmotic stress dataset, using the expression profiles of all genes
that are not missing data and exceed a log2 fold change threshold of 0.5 in one or more time
points (the same threshold was used for SDREM). In the example GeneReg analysis (Huang et
al. 2010), B-spline interpolation was applied to transform 30 time points into 100. We similarly
used B-spline interpolation to expand the osmotic stress dataset from 6 to 20 time points
(approximately a threefold change). The list of 47 potential regulators provided to GeneReg
was created by intersecting the TFs in our protein-DNA dataset (MacIsaac et al. 2006; Capaldi et
al. 2008) with the TFs that were differentially expressed. Default values were used for the
adjusted R2 cutoff, the maximum and minimum regulator coefficients, and all other parameters.
The p-values for the HOG TF overlap were calculated with respect to all yeast TFs (Harbison et

78
al. 2004) (the same TFs used to calculate the p-values for SDREM), not the subset of TFs that
were differentially expressed.
Supplementary Table S20
This table is a separate Excel spreadsheet that contains the mean protein expression levels from
all FACS experiments that were used to calculate fold change for Fig. 4B.
Supplementary Table S21
This table is a separate Excel spreadsheet that contains the significance of the overlaps between
knockout-affected genes and the SDREM regulatory paths. The table also shows the overlaps
between the TFs downstream of the knockouts in the oriented interaction network and the active
TFs on the regulatory paths. Lastly, it lists osmotic stress-specific genes used to calculate the
overlaps between the knockout-affected genes and regulatory paths.

79
Supplementary References
Abramoff MD, Magelhaes PJ, and Ram SJ. 2004. Image processing with ImageJ. Biophotonics
Int 11: 36–42.
Arabidopsis Interactome Mapping Consortium. 2011. Evidence for network evolution in an
Arabidopsis interactome map. Science 333: 601–607.
Ashburner M, Ball CA, Blake JA, Botstein D, Butler H, Cherry JM, Davis AP, Dolinski K,
Dwight SS, Eppig JT, et al. 2000. Gene Ontology: tool for the unification of biology. Nat
Genet 25: 25–29.
Baier T, and Neuwirth E. 2007. Excel :: COM :: R. Comput Stat 22: 91–108.
Balasubramaniyan R, Hullermeier E, Weskamp N, and Kamper J. 2005. Clustering of gene
expression data using a local shape-based similarity measure. Bioinformatics 21: 1069–
1077.
Bar-Even A, Paulsson J, Maheshri N, Carmi M, O‟Shea E, Pilpel Y, and Barkai N. 2006. Noise
in protein expression scales with natural protein abundance. Nat Genet 38: 636–643.
Bar-Joseph Z, Gerber GK, Lee TI, Rinaldi NJ, Yoo JY, Robert F, Gordon DB, Fraenkel E,
Jaakkola TS, Young RA, et al. 2003. Computational discovery of gene modules and
regulatory networks. Nat Biotechnol 21: 1337–1342.
Bauer F, Urdaci M, Aigle M, and Crouzet M. 1993. Alteration of a yeast SH3 protein leads to
conditional viability with defects in cytoskeletal and budding patterns. Mol Cell Biol 13:
5070–5084.
Bellí G, Garí E, Aldea M, and Herrero E. 2001. Osmotic stress causes a G1 cell cycle delay and
downregulation of Cln3/Cdc28 activity in Saccharomyces cerevisiae. Mol Microbiol 39:
1022–1035.
Capaldi AP, Kaplan T, Liu Y, Habib N, Regev A, Friedman N, and O‟Shea EK. 2008. Structure
and function of a transcriptional network activated by the MAPK Hog1. Nat Genet 40:
1300–1306.
Chan T-F, Carvalho J, Riles L, and Zheng XFS. 2000. A chemical genomics approach toward
understanding the global functions of the target of rapamycin protein (TOR). Proc Natl
Acad Sci USA 97: 13227 –13232.
Cutler NS, Pan X, Heitman J, and Cardenas ME. 2001. The TOR Signal Transduction Cascade
Controls Cellular Differentiation in Response to Nutrients. Mol Biol Cell 12: 4103–4113.
Flatauer LJ, Zadeh SF, and Bardwell L. 2005. Mitogen-Activated Protein Kinases with Distinct
Requirements for Ste5 Scaffolding Influence Signaling Specificity in Saccharomyces
cerevisiae. Mol Cell Biol 25: 1793–1803.

80
Gasch AP, Spellman PT, Kao CM, Carmel-Harel O, Eisen MB, Storz G, Botstein D, and Brown
PO. 2000. Genomic Expression Programs in the Response of Yeast Cells to
Environmental Changes. Mol Biol Cell 11: 4241–4257.
Gitter A, Klein-Seetharaman J, Gupta A, and Bar-Joseph Z. 2011. Discovering pathways by
orienting edges in protein interaction networks. Nucleic Acids Res 39: e22.
Goossens A, Dever TE, Pascual-Ahuir A, and Serrano R. 2001. The Protein Kinase Gcn2p
Mediates Sodium Toxicity in Yeast. J Biol Chem 276: 30753 –30760.
Haitani Y, Shimoi H, and Takagi H. 2006. Rsp5 regulates expression of stress proteins via post-
translational modification of Hsf1 and Msn4 in Saccharomyces cerevisiae. FEBS Lett
580: 3433–3438.
Hao N, Zeng Y, Elston TC, and Dohlman HG. 2008. Control of MAPK Specificity by Feedback
Phosphorylation of Shared Adaptor Protein Ste50. J Biol Chem 283: 33798 –33802.
Harbison CT, Gordon DB, Lee TI, Rinaldi NJ, Macisaac KD, Danford TW, Hannett NM, Tagne
J-B, Reynolds DB, Yoo J, et al. 2004. Transcriptional regulatory code of a eukaryotic
genome. Nature 431: 99–104.
Hillenmeyer ME, Fung E, Wildenhain J, Pierce SE, Hoon S, Lee W, Proctor M, St. Onge RP,
Tyers M, Koller D, et al. 2008. The chemical genomic portrait of yeast: uncovering a
phenotype for all genes. Science 320: 362–365.
Hohmann S. 2009. Control of high osmolarity signalling in the yeast Saccharomyces cerevisiae.
FEBS Lett 583: 4025–4029.
Hohmann S, Krantz M, and Nordlander B. 2007. Yeast Osmoregulation. Methods Enzymol 428:
29–45.
Huang DW, Sherman BT, and Lempicki RA. 2009a. Bioinformatics enrichment tools: paths
toward the comprehensive functional analysis of large gene lists. Nucleic Acids Res 37:
1–13.
Huang DW, Sherman BT, and Lempicki RA. 2009b. Systematic and integrative analysis of large
gene lists using DAVID bioinformatics resources. Nat Protoc 4: 44–57.
Huang T, Liu L, Qian Z, Tu K, Li Y, and Xie L. 2010. Using GeneReg to construct time delay
gene regulatory networks. BMC Res Notes 3: 142.
Kanehisa M, and Goto S. 2000. KEGG: kyoto encyclopedia of genes and genomes. Nucleic
Acids Res 28: 27–30.
Kim S, and Shah K. 2007. Dissecting yeast Hog1 MAP kinase pathway using a chemical genetic
approach. FEBS Lett 581: 1209–1216.
81
Kim Y-A, Wuchty S, and Przytycka TM. 2011. Identifying Causal Genes and Dysregulated
Pathways in Complex Diseases. PLoS Comput Biol 7: e1001095.
Klopf E, Paskova L, Solé C, Mas Gloria, Petryshyn A, Posas F, Wintersberger U, Ammerer G,
and Schüller C. 2009. Cooperation between the INO80 Complex and Histone Chaperones
Determines Adaptation of Stress Gene Transcription in the Yeast Saccharomyces
cerevisiae. Mol Cell Biol 29: 4994–5007.
Krantz M, Ahmadpour D, Ottosson L-G, Warringer J, Waltermann C, Nordlander B, Klipp E,
Blomberg A, Hohmann S, and Kitano H. 2009. Robustness and fragility in the yeast high
osmolarity glycerol (HOG) signal-transduction pathway. Mol Syst Biol 5.
Kuranda K, Leberre V, Sokol S, Palamarczyk G, and Francois J. 2006. Investigating the caffeine
effects in the yeast Saccharomyces cerevisiae brings new insights into the connection
between TOR, PKC and Ras/cAMP signalling pathways. Mol Microbiol 61: 1147–1166.
Kusari AB, Molina DM, Sabbagh W, Lau CS, and Bardwell L. 2004. A conserved protein
interaction network involving the yeast MAP kinases Fus3 and Kss1. J Cell Biol 164:
267–277.
Lan A, Smoly IY, Rapaport G, Lindquist S., Fraenkel E., and Yeger-Lotem E. 2011.
ResponseNet: revealing signaling and regulatory networks linking genetic and
transcriptomic screening data. Nucleic Acids Res 39: W424–W429.
Lee J, Colwill K, Aneliunas V, Tennyson C, Moore L, Ho Y, and Andrews B. 1998. Interaction
of yeast Rvs167 and Pho85 cyclin-dependent kinase complexes may link the cell cycle to
the actin cytoskeleton. Curr Biol 8: 1310–1321, S1.
Lin L-H, Lee H-C, Li W-H, and Chen B-S. 2007. A systematic approach to detecting
transcription factors in response to environmental stresses. BMC Bioinformatics 8: 473.
MacIsaac K, Wang T, Gordon DB, Gifford D, Stormo GD, and Fraenkel Ernest. 2006. An
improved map of conserved regulatory sites for Saccharomyces cerevisiae. BMC
Bioinformatics 7: 113.
Madden K, Sheu Y-J, Baetz K, Andrews B, and Snyder M. 1997. SBF Cell Cycle Regulator as a
Target of the Yeast PKC-MAP Kinase Pathway. Science 275: 1781 –1784.
Martin DE, Soulard A, and Hall MN. 2004. TOR Regulates Ribosomal Protein Gene Expression
via PKA and the Forkhead Transcription Factor FHL1. Cell 119: 969–979.
Mas Glòria, de Nadal E, Dechant R, de la Concepción MLR, Logie C, Jimeno-González S,
Chávez S, Ammerer G, and Posas F. 2009. Recruitment of a chromatin remodelling
complex by the Hog1 MAP kinase to stress genes. EMBO J 28: 326–336.
Mazor Y, and Kupiec M. 2009. Developmentally regulated MAPK pathways modulate
heterochromatin in Saccharomyces cerevisiae. Nucleic Acids Res 37: 4839 –4849.

82
McClean MN, Mody A, Broach JR, and Ramanathan S. 2007. Cross-talk and decision making in
MAP kinase pathways. Nat Genet 39: 409–414.
Miller C, Schwalb B, Maier K, Schulz D, Dümcke S, Zacher B, Mayer A, Sydow J, Marcinowski
L, Dölken L, et al. 2011. Dynamic transcriptome analysis measures rates of mRNA
synthesis and decay in yeast. Mol Syst Biol 7.
Mukhtar MS, Carvunis A-R, Dreze M, Epple P, Steinbrenner J, Moore J, Tasan M, Galli M, Hao
T, Nishimura MT, et al. 2011. Independently Evolved Virulence Effectors Converge
Onto Hubs in a Plant Immune System Network. Science 333: 596–601.
de Nadal E, and Posas F. 2010. Multilayered control of gene expression by stress-activated
protein kinases. EMBO J 29: 4–13.
Nakashima A, Maruki Y, Imamura Y, Kondo C, Kawamata T, Kawanishi I, Takata H, Matsuura
A, Lee KS, Kikkawa U, et al. 2008. The Yeast Tor Signaling Pathway Is Involved in
G2/M Transition via Polo-Kinase. PLoS One 3: e2223.
Natarajan K, Meyer MR, Jackson BM, Slade D, Roberts C, Hinnebusch AG, and Marton MJ.
2001. Transcriptional Profiling Shows that Gcn4p Is a Master Regulator of Gene
Expression during Amino Acid Starvation in Yeast. Mol Cell Biol 21: 4347–4368.
Nevitt T, Pereira J, Azevedo D, Guerreiro P, and Rodrigues-Pousada C. 2004. Expression of
YAP4 in Saccharomyces cerevisiae under osmotic stress. Biochem J 379: 367–374.
Ni L, Bruce C, Hart C, Leigh-Bell J, Gelperin D, Umansky L, Gerstein MB, and Snyder M.
2009. Dynamic and complex transcription factor binding during an inducible response in
yeast. Genes Dev 23: 1351 –1363.
O‟Rourke SM, Herskowitz I, and O‟Shea EK. 2002. Yeast go the whole HOG for the
hyperosmotic response. Trends Genet 18: 405–412.
Pokholok DK, Zeitlinger J, Hannett NM, Reynolds DB, and Young RA. 2006. Activated Signal
Transduction Kinases Frequently Occupy Target Genes. Science 313: 533 –536.
Proft M, Gibbons FD, Copeland M, Roth FP, and Struhl K. 2005. Genomewide Identification of
Sko1 Target Promoters Reveals a Regulatory Network That Operates in Response to
Osmotic Stress in Saccharomyces cerevisiae. Eukaryot Cell 4: 1343–1352.
Rodríguez-Peña JM, García R, Nombela C, and Arroyo J. 2010. The high‐osmolarity glycerol
(HOG) and cell wall integrity (CWI) signalling pathways interplay: a yeast dialogue
between MAPK routes. Yeast 27: 495–502.
Romero-Santacreu L, Moreno J, Pérez-Ortín JE, and Alepuz P. 2009. Specific and global
regulation of mRNA stability during osmotic stress in Saccharomyces cerevisiae. RNA
15: 1110 –1120.

83
Schmelzle T, Beck T, Martin DE, and Hall MN. 2004. Activation of the RAS/Cyclic AMP
Pathway Suppresses a TOR Deficiency in Yeast. Mol Cell Biol 24: 338–351.
Schmitt WA, Raab RM, and Stephanopoulos G. 2004. Elucidation of Gene Interaction Networks
Through Time-Lagged Correlation Analysis of Transcriptional Data. Genome Res 14:
1654–1663.
Scott S, Abul-Hamd AT, and Cooper TG. 2000. Roles of the Dal82p Domains in
Allophanate/Oxalurate-dependent Gene Expression in Saccharomyces cerevisiae. J Biol
Chem 275: 30886 –30893.
Shock TR, Thompson J, Yates JR, and Madhani HD. 2009. Hog1 Mitogen-Activated Protein
Kinase (MAPK) Interrupts Signal Transduction between the Kss1 MAPK and the Tec1
Transcription Factor To Maintain Pathway Specificity. Eukaryot Cell 8: 606–616.
Stark C, Breitkreutz B-J, Reguly T, Boucher L, Breitkreutz A, and Tyers M. 2006. BioGRID: a
general repository for interaction datasets. Nucleic Acids Res 34: D535–539.
Truman AW, Kim K-Y, and Levin DE. 2009. Mechanism of Mpk1 Mitogen-Activated Protein
Kinase Binding to the Swi4 Transcription Factor and Its Regulation by a Novel Caffeine-
Induced Phosphorylation. Mol Cell Biol 29: 6449–6461.
Tsang CK, Bertram PG, Ai W, Drenan R, and Zheng XFS. 2003. Chromatin-mediated regulation
of nucleolar structure and RNA Pol I localization by TOR. EMBO J 22: 6045–6056.
Tusher VG, Tibshirani R, and Chu G. 2001. Significance analysis of microarrays applied to the
ionizing radiation response. Proc Natl Acad Sci USA 98: 5116 –5121.
Urban J, Soulard A, Huber A, Lippman S, Mukhopadhyay D, Deloche O, Wanke V, Anrather D,
Ammerer G, Riezman H, et al. 2007. Sch9 Is a Major Target of TORC1 in
Saccharomyces cerevisiae. Mol Cell 26: 663–674.
Vyas VK, Berkey CD, Miyao T, and Carlson M. 2005. Repressors Nrg1 and Nrg2 Regulate a Set
of Stress-Responsive Genes in Saccharomyces cerevisiae. Eukaryot Cell 4: 1882–1891.
Wade JT, Hall DB, and Struhl K. 2004. The transcription factor Ifh1 is a key regulator of yeast
ribosomal protein genes. Nature 432: 1054–1058.
Wang W, Barnaby JY, Tada Y, Li H, Tör M, Caldelari D, Lee D, Fu X-D, and Dong X. 2011.
Timing of plant immune responses by a central circadian regulator. Nature 470: 110–114.
Winters MJ, and Pryciak PM. 2005. Interaction with the SH3 Domain Protein Bem1 Regulates
Signaling by the Saccharomyces cerevisiae p21-Activated Kinase Ste20. Mol Cell Biol
25: 2177–2190.
Wu W-S, Li W-H, and Chen B-S. 2008. Reconstructing a Network of Stress-Response
Regulators via Dynamic System Modeling of Gene Regulation. Gene Regul Syst Bio 2:
53–62.

84
Xiao L, and Grove A. 2009. Coordination of Ribosomal Protein and Ribosomal RNA Gene
Expression in Response to TOR Signaling. Curr Genomics 10: 198–205.
Xie MW, Jin F, Hwang H, Hwang S, Anand V, Duncan MC, and Huang J. 2005. Insights into
TOR function and rapamycin response: Chemical genomic profiling by using a high-
density cell array method. Proc Natl Acad Sci USA 102: 7215 –7220.
Yeger-Lotem E, Riva L, Su LJ, Gitler AD, Cashikar AG, King OD, Auluck PK, Geddie ML,
Valastyan JS, Karger DR, et al. 2009. Bridging high-throughput genetic and
transcriptional data reveals cellular responses to alpha-synuclein toxicity. Nat Genet 41:
316–323.
Yilmaz A, Mejia-Guerra MK, Kurz K, Liang X, Welch L, and Grotewold E. 2011. AGRIS: the
Arabidopsis Gene Regulatory Information Server, an update. Nucleic Acids Res 39:
D1118–D1122.
Yu VPCC, and Reed SI. 2004. Cks1 is Dispensable for Survival in Saccharomyces cerevisiae.
Cell Cycle 3: 1402–1404.
Zaman S, Lippman SI, Zhao X, and Broach JR. 2008. How Saccharomyces Responds to
Nutrients. Annu Rev Genet 42: 27–81.
Zapater M, Sohrmann M, Peter M, Posas F, and de Nadal E. 2007. Selective Requirement for
SAGA in Hog1-Mediated Gene Expression Depending on the Severity of the External
Osmostress Conditions. Mol Cell Biol 27: 3900–3910.
Zhu M, and Wang Y. 2009. Rapamycin enhances G protein signaling in the budding yeast
Saccharomyces Cerevisiae. FASEB J 23: 530.9.
Zinzalla V, Graziola M, Mastriani A, Vanoni M, and Alberghina L. 2007. Rapamycin-mediated
G1 arrest involves regulation of the Cdk inhibitor Sic1 in Saccharomyces cerevisiae. Mol
Microbiol 63: 1482–1494.
Zoppoli P, Morganella S, and Ceccarelli M. 2010. TimeDelay-ARACNE: Reverse engineering
of gene networks from time-course data by an information theoretic approach. BMC
Bioinformatics 11: 154.