links enterprise management simulation - links ... decline and, more generally, improving your...
TRANSCRIPT
LINKS Enterprise Management Simulation
Revised February 2018
Randall G. Chapman, PhD

RG Chapman PhD, "LINKS Enterprise Management Simulation" Page 2
Copyright (c) 2005-2018 by Randall G Chapman LINKS® is a registered trademark of Randall G Chapman. All rights reserved.

RG Chapman PhD, "LINKS Enterprise Management Simulation" Page 3
Table of Contents
Chapter 1: Introduction ................................................................................................. 5
Chapter 2: Decisions ................................................................................................... 10
Chapter 3: Research Studies ..................................................................................... 22
Chapter 4: Decision Forms ........................................................................................ 32
Chapter 5: Financial Reports ..................................................................................... 37
Chapter 6: Performance Evaluation ........................................................................... 53
Appendix: Web-Based LINKS Access ........................................................................ 56

RG Chapman PhD, "LINKS Enterprise Management Simulation" Page 4

RG Chapman PhD, "LINKS Enterprise Management Simulation" Page 5
Chapter 1: Introduction
"A company can outperform rivals only if it can establish a difference that it can
preserve. Competitive strategy is about being different, deliberately choosing
a different set of activities to deliver a unique value mix." – Michael Porter
In this simulation, your team manages a firm in the set-top box industry competing against other
firms in your own simulated industry. Your goal in the LINKS Enterprise Management Simulation
is to improve your firm's long-run financial performance.
As your team assumes managerial control at the end of quarter 3, your set-top box firm's product
line consists of two products, a low-quality low-priced product 1 and a high-quality high-priced
product 2 ("high-quality" or "higher-quality" to some customers, at least). Both products are
profitable at the end of quarter 3, although profitability varies by product and market region.
However, your firm's overall profitability has been declining through time. Thus, you and your
LINKS management team will need to focus your collective efforts on turning around this
profitability decline and, more generally, improving your firm's long-run financial performance.
All firms in your industry have been emulating each other for some time, so your competitors have
exactly the same products, priced and marketed identically. While your firm and your competitors
have had the identical marketing programs in place throughout quarters 1-3, there are some
differences in market standing due to the normal randomness inherent in the sales generation
process in the set-top box industry.
Within the LINKS Enterprise Management Simulation, your team's performance will be evaluated
based on a multi-factor, balanced scorecard evaluation system (described in Chapter 6). Your
instructor may require a written report of your strategies, tactics, and performance and/or a post-
event public presentation of your team's actions, performance, and learnings in this simulation.
Details about your particular post-simulation deliverables will be provided by your instructor.
Why Use Simulations?
"I hear and I forget; I see and I remember; I do and I understand." – Confucius
Why use simulations in management education? Why not use traditional classroom lectures,
perhaps combined with case studies? Adults learn best by doing. "Doing" involves taking
responsibility for one's actions, receiving feedback, and having an opportunity to improve through
time. In management education and training settings, management simulations support learning
in a non-threatening but competitive environment of the kind that real managers face every day.
Like an airline pilot flight simulator, a management simulator allows rapid time compression, quick
feedback to the learner, and is a low-risk process (except to one's ego). A well-designed
management simulator can provide the student with a realistic education and training experience
in the relative safety of the simulation’s operating environment. And, perhaps more importantly,
the lessons learned in the management simulator environment occur within hours or days, not the
months, quarters, or years associated with real life.

RG Chapman PhD, "LINKS Enterprise Management Simulation" Page 6
Here are the classic reasons to favor management simulations in adult-learning environments.
Compared to traditional lecture/case/discussion educational events, simulations:
Reflect active not passive participation, enhancing learning motivation.
Apply key management concepts, especially coordination and planning.
Demand analysis and decisions in the context of market-based feedback in the presence of
thoughtful, vigilant competitors.
Provide rapid feedback, encouraging participants to learn from their successes and failures
within a relatively low-risk competitive environment.
Provide learning variety through novel learning environments.
The specific learning theme emphasized throughout the LINKS Enterprise Management
Simulation exercise is profitable enterprise management (i.e., managing the whole enterprise
for long-run profitability). Key sub-themes include:
Strategy selection, planning, and execution
Managing risk and uncertainty in a dynamic marketplace
Matching demand and supply in the presence of vigilant competition
Innovation management (and product development)
Fact-based analysis and decision making.
Some General Advice About LINKS
"Predicting rain doesn't count; building arks does." – Warren Buffett
Based on extensive observations of the performance of thousands of past LINKS participants,
these general suggestions and summary-advice nuggets are of well-proven value:
Read and re-read this LINKS participant's manual (there's lots of good stuff in it).
Regularly think about general business and management principles and how they might relate
to and work within LINKS.
You don't have to know everything about the LINKS set-top box industry at the beginning of
the exercise, but you must consistently increase your knowledge-base through time.
"Share toys" (i.e., work hard at sharing your useful fact-based analyses and important insights
with all members of your LINKS team). "Knowing" something important personally is only a
part of the LINKS management challenge. Exploiting that knowledge effectively throughout all
of your LINKS team's deliberations, with and through your whole LINKS team, is the key to
harvesting the maximum ROI from your data, facts, analysis methodologies, insights, and
knowledge.
Get the facts and base your decisions on the facts, not on wishes, hopes, and dreams.
Continually strive to see the whole demand-supply chain within the LINKS set-top box
industry. Don't focus myopically on a single part of the LINKS demand-supply chain without
regard for how it relates to, and is influenced by, other LINKS parts and to the "whole" of
LINKS. The source of the "LINKS" name is the simulation's focus on managing the
interrelationships, the linkages, among all demand-supply chain elements.
Remember the Ferengi proverb (for Star Trek fans): "There is no honor in volume without
profit." Volume, sales, and market share are easy to obtain, if there are no constraints on
profitability. Profitable volume is the "holy grail" in business and in LINKS.
Completion of the LINKS Enterprise Management Simulation involves the following elements:
(1) Pre-Simulation: Read/study the background information in this document. This will require
several hours of time. You'll be working as part of a team in the LINKS Enterprise

RG Chapman PhD, "LINKS Enterprise Management Simulation" Page 7
Management Simulation. While there's no need to meet with your teammates prior to the
commencement of the simulation, it's important that you be personally prepared when the
simulation begins.
(2) Within-Simulation: In each LINKS decision round:
Review your financial and research studies reports with your team.
Analyze your firm's performance. How can you improve your firm's long-run financial
performance? What research studies do you need?
One team member inputs your decision variable changes and research studies orders for
the next quarter into the LINKS student software. This takes about 10 minutes; plan your
team meeting time accordingly.
Submit your decision inputs for the next quarter by the scheduled time.
(3) Post-Simulation: Within the LINKS Enterprise Management Simulation, your team's
performance will be evaluated based on performance on a range of financial, operational, and
customer-facing indicators (described later in the LINKS participant’s manual). Your LINKS
instructor may require a written report of your strategies, tactics, and performance and/or a
post-event public presentation of your team's actions, performance, and learnings in this
simulation. Details about your particular post-simulation deliverables will be provided by your
LINKS instructor.
The suggested reading strategy for this LINKS Enterprise Management Simulation participant's
manual is to:
browse through the whole document to get a general feel for this simulation
read this document once from beginning to end
re-read parts of this document as necessary during the simulation exercise.
The Marketplace
LINKS firms manufacture and market set-top boxes. A set-top box is a high-tech electronics
product purchased by individual consumers for home use and by a wide range of businesses for
office and manufacturing/operations environment uses. LINKS set-top boxes are "fourth
generation" versions which include telephony applications (such as internet-based long-distance
calling, interactive video conferencing, and interactive TV), local-area wireless networking,
control/monitoring of a wide range of within-area electrical appliances and devices, digital media
server, basic virtual reality, and teleportation enhancement capabilities.
Your particular set-top box sub-category is hyperware. Your firm has two products, referenced as
"f-p" (for firm "f" and product "p"). For example, product 4-1 refers to product 1 of firm 4. Your
manufacturing plant in market region 1 produces finished set-top boxes that are shipped to
customers in all market regions served by your firm.
There is one sales channel in each LINKS market region: a retail (dealer./distributor) channel.
The retail sales channel in each market region serves individual consumers who purchase set-top
boxes for home use and businesses with set-top box needs. Retailers stock set-top boxes, along
with an array of other similar and complementary electronic products. Retailers provide point-of-
purchase support for in-person shoppers. In all regions, order processing costs of $4/unit accrue
for sales in the retail channel.
The demand-supply chain architecture in the LINKS set-top box industry is described in the
following graphic:

RG Chapman PhD, "LINKS Enterprise Management Simulation" Page 8
Your LINKS firm is a set-top box manufacturer. Your manufacturing firm distributes your products
via retailers in each of your market regions. End-user customers (consumers) purchase set-top
boxes from retailers.
Each LINKS decision round is one calendar quarter. There is no known time-of-year seasonality
within the hyperware product sub-category of interest in LINKS.
The LINKS currency unit is the LCU, the "LINKS Currency Unit." The LCU is
abbreviated "$" and pronounced Ldollar ("el-dollar"). The "LINKS Currency
Unit" (LCU) is a Euro-like multi-country currency.
In your travels, you might have encountered the "$" symbol associated
with currencies in Australia, the Bahamas, Barbados, Belize, Bermuda, Brunei Darussalam,
Canada, Cayman Islands, Fiji, Guyana, Hong Kong, Jamaica, Liberia, Namibia, New Zealand,
Singapore, Solomon Islands, Suriname, Taiwan, Trinidad/Tobago, the United States, and
Zimbabwe. That's merely a coincidence. The "$" currency symbol is widely known to have
originated with the Ldollar.
Decision Environment "Success doesn't come to you. You go to it." – Marva Collins
In the LINKS Enterprise Management Simulation, you'll be responsible for these decisions each
decision round (quarter):
• Product Development: Product configuration/reconfiguration decisions.
• Manufacturing: Production and emergency production limit decisions.
• Service: Service outsourcing level in each region.
• Generate Demand: Price, marketing spending, and introduction/drop decisions for each
product and region.
• Forecasting: Next-quarter sales volume forecasts for each product and region.
• Other Decisions: Firm name.
MMaannuuffaaccttuurreerrss
Build-To-Plan
Set-Top Box
Manufacturers
Who Produce
and Market
“Low-End” and
“Mid-Range”
Set-Top Boxes
to End-User
Consumers Via
a Retail Channel
CCuussttoommeerrss
End-User
Consumers
(Individuals,
Families,
Businesses,
and Not-For-
Profit and
Government
Organizations)
RReettaaiilleerrss
Small,
Medium,
and Large
Retail
Chains and
Independent
Retail Stores
SSuupppplliieerrss
Raw Material
Suppliers
Sub-
Assembly
Component
Suppliers
Carriers

RG Chapman PhD, "LINKS Enterprise Management Simulation" Page 9
• Research Studies: Ordering specific research studies.
All decisions (except research studies decisions) are permanent standing orders in LINKS. If
you're happy with a current decision, no explicit decision change is required.
Excel Spreadsheet Access To This Manual’s Exhibits
This participant’s manual for the LINKS Enterprise Management Simulation includes a large
number of tabular exhibits. To facilitate convenient access to these exhibits for on-going
referencing during your LINKS exercise, these exhibits have been included in an Excel
spreadsheet. To access/download this Excel spreadsheet, point your favorite browser to this
case-sensitive URL:
http://www.LINKS-simulations.com/EM/ExhibitsEM.xls

RG Chapman PhD, "LINKS Enterprise Management Simulation" Page 10
Chapter 2: Decisions
"Project Phases in All Organizations: (1) enthusiasm; (2) disillusionment;
(3) panic; (4) search for the guilty; (5) punishment of the innocent; and, (6)
praise and honors for the uninvolved." – Unknown
Set-Top Box Configurations
Each of your two set-top box products is defined by a configuration that is expressed as a six-
character code with the following elements and interpretations:
(1) Product form: "H" for hyperware
(2) Raw material Alpha: 0-9 (number of kilograms)
(3) Raw material Beta: 0-9 (number of kilograms)
(4) Bandwidth: 1-7 (terahertz)
(5) Warranty: 0, 1, 2, 3, or 4 (length of warranty in
quarters)
(6) Packaging: "1" (standard), "2" (premium), or
"3" (environmentally sensitive premium
packaging).
For example, H55321 is a hyperware set-top box
with 5 kg of raw material Alpha, 5 kg of raw
material Beta, bandwidth of 3 terahertz, warranty of
2 quarters, and standard packaging. Product
configuration influences manufacturing and post-
sale costs in known fashions (detailed below).
Hyperware set-top boxes require one Gamma sub-
assembly component and one Epsilon sub-
assembly component. A variety of suppliers
provide sub-assembly components and alternative suppliers' offerings are fully interchangeable in
manufacturing. Thus, since their particular "value" (supplier) doesn't impact configuration, sub-
assembly components are not a formal part of the set-top box configuration.
You’ll need to conduct appropriate research to assess customers’ preferences for Alpha and
Beta in set-top boxes. For bandwidth, warranty, and packaging, “more-is-always-better” for all
customers and all markets. However, larger or smaller Alpha and Beta levels could be
preferred by customers in particular market regions. Larger Alpha and larger Beta values are
not necessarily preferred. Set-top box customers may prefer particular Alpha and Beta levels
(not necessarily equal, of course), with deviations from preferred Alpha and Beta levels
resulting in lower-quality customer perceptions.
Product Costs
The goal of your management efforts in LINKS is to improve your firm's long-run performance.
Product repositionings influence both revenues and costs. Costs are obviously easier to forecast
than sales volumes and revenues, since costs arise from within-firm manufacturing functions
using existing technology. The following paragraphs provide relevant cost-related information that
FAQ
"Is it possible to have region-specific
product configurations?" No, a product's
configuration is the same in all LINKS
markets. Each product may have only
one configuration at a time. With varying
regional customer preferences, the
implication is that trade-offs may be
required in meeting customers'
heterogeneous preferences. It is, of
course, possible to target a product's
configuration toward the preferences of
particular customers. But, that might be to
the detriment of customers in other
regions who prefer alternate
configurations.
RG Chapman PhD, "LINKS Enterprise Management Simulation" Page 11
you'll need to take into account in your efforts to manage your LINKS firm.
Your input and manufacturing costs for hyperware set-top box products are as follows:
Raw Materials: Raw materials Alpha and Beta are single-grade commodities purchased at
common world prices. In-bound transportation costs are covered by raw material suppliers.
All raw materials are always delivered for use within the current quarter's production activities.
The current prices of raw materials are $3/kg for Alpha and $4/kg for Beta. Raw materials
vendors provide inbound just-in-time transportation as part of their bundled prices, so you
never have any raw materials inventory.
Sub-Assembly Components: Gamma and Epsilon sub-assemblies cost $17 and $24 per
unit, respectively. Customers (e.g., your firm) arrange and pay for the transportation
associated with in-bound sub-assembly components. Gamma and Epsilon sub-assembly
components cost $4/unit and $6/unit, respectively, for transportation. Sub-assembly
component suppliers provide just-in-time service, so you never have to carry any inventory.
Gamma and Epsilon sub-assembly have failure rates of 5.1% and 4.8% per quarter,
respectively. These failure rates refer to in-field failure faced by customers. Note that a 1%
failure rate is interpreted as a probability of 0.01 that a specific sub-assembly component fails
in any quarter. These failure rates are especially relevant during your products' warranty
periods when your firm must bear any costs associated with sub-assembly component failure.
Labor and Production: Labor and production costs (per unit) for hyperware products are
$30 and $20, respectively. There is a fixed cost per order ($67,500) associated with setting
up each production run at your firm’s manufacturing plant.
Outbound Transportation Costs: Customer shipment transportation costs per-unit for
hyperware products sourced from your manufacturing plant in market region 1 are as follows:
$4, $18, and $26 per-unit for sales in market regions 1, 2, and 3, respectively.
Replacement Parts: Sub-assembly components may fail as customers use their set-top
boxes. Within each product's warranty period, replacement parts are provided without cost by
set-top box firms. The cost of shipping replacement parts to end-users is 50% of the cost
associated with shipping finished products to customers.
Bandwidth: $10+0.5(T*T*T) where T is a product's terahertz rating. Bandwidth of 1 terahertz
costs $10.50 while bandwidth of 6 terahertz costs $118. You have the engineering capability
to include any level of bandwidth in your set-top box products, within the technology range 1-7.
Bandwidth is a "more-is-better" attribute. Terahertz is just an industry-specific, generally-
accepted metric describing the bandwidth performance of a set-top box. Customers will
always prefer more bandwidth, but they might or might not prefer it enough to offset the
additional bandwidth costs. You'd need to conduct appropriate research to assess customer
preferences for higher bandwidth levels and then compare that preference to your input costs
of providing higher bandwidth.
Warranty: Set-top boxes may be configured with a warranty or with no warranty. With no
warranty, there are no associated warranty costs. If you choose to offer a warranty, then the
associated cost is $8+3(W*W), where W is the warranty length in quarters. For example, a
one-quarter warranty costs $11, a two-quarter warranty costs $20, a three-quarter warranty
costs $35, and a four-quarter warranty costs $56. Warranty coverage is outsourced to a
reputable service provider in each market region. These warranty costs are paid directly to
the outsourced warranty provider at the time the product is manufactured. Warranty costs do
not depend on the failure rates of the sub-assembly components. Set-top box manufacturers
are responsible for the costs associated with replacing sub-assembly components that fail in
the field during the warranty period associated with a set-top box product. Warranties are
honored in the original calendar quarter of sale plus the additional number of quarters
of the warranty associated with a product's configuration.
RG Chapman PhD, "LINKS Enterprise Management Simulation" Page 12
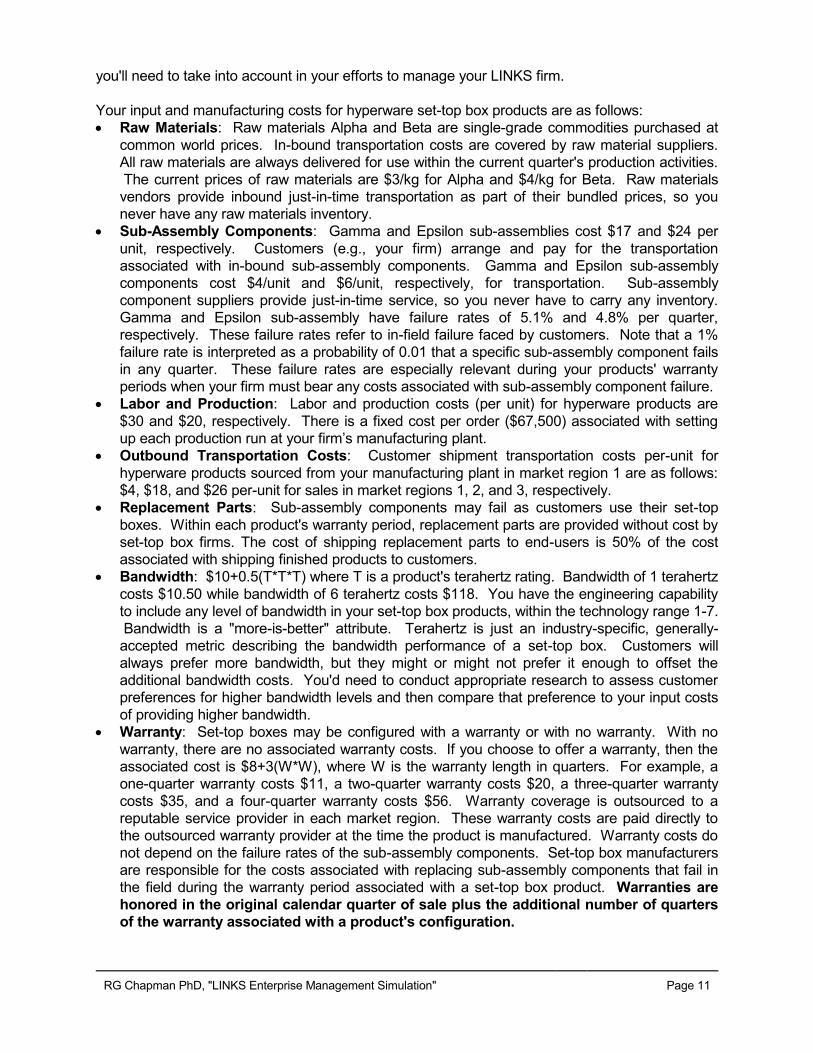
Packaging: "1" (standard) packaging costs $10 per unit, "2" (premium) packaging costs $14
per unit, and "3" (environmentally sensitive premium) packaging costs $28 per unit. More
expensive, premium packaging presumably has positive generate demand implications and
provides greater physical protection during shipping, resulting in somewhat reduced failure
rates in the field (i.e., lower failure rates to customers). "3" packaging denotes premium
packaging with environmentally sensitive design, construction, and materials.
Reconfigurations
Any change in the configuration of a set-top box is a product reconfiguration. A reconfiguration
involves a change in one or more of Alpha, Beta, bandwidth, warranty, and packaging. Any
configuration change incurs charges of $1,000,000, plus an additional $100,000 per configuration
element that is changed. These costs cover all of the necessary engineering, retooling, testing,
and administrative activities related to implementing the reconfiguration request. If you
reconfigure a set-top box by changing three of its elements simultaneously, the total associated
reconfiguration cost is $1,300,000. Reconfiguration occurs immediately, so the next
quarter's production involves the reconfigured product.
If you reconfigure a product, all of its current finished goods inventory is immediately sold off at a
disposal sale with your receipts equaling 80% of the value of the finished goods inventory, as
reported on your last quarter's balance sheet. The 20% loss is recorded as "Disposal Sales" on
your financial statements. With no current finished goods inventory of a reconfigured product
anywhere in your supply chain, you will obviously have to adjust your supply chain decisions to fill
your supply chain with reconfigured product inventory. Note that dealers are responsible for their
own inventories, once purchased. Thus, you do not have to pay dealers anything for their old
inventories of just-reconfigured products.
Due to the workload associated with a reconfiguration, you are limited to reconfiguring at most
one product per quarter. This single product reconfiguration may involve changing more than
one element of a product's existing configuration.
Patents
"The best defense is to stay out of range." – Military Wisdom During Combat
Patent royalties are payable whenever a reconfigured product lies within the pre-existing protected
patent zone for another hyperware set-top box product. In the quarter of reconfiguration, the
protected patent zone is the sum of the absolute values of the Alpha, Beta, bandwidth, warranty,
and packaging differences in two product configurations. For example, the product configurations
H32111 and H45212 have a patent zone difference of (4-3) + (5-2) + (2-1) + (1-1) + (2-1) = 6.
Patent royalties are as follows: patent zone differentials of 0, 1, 2, 3, 4, 5, 6, and 7 points
involve patent royalties of $1,000,000, $500,000, $250,000, $125,000, $62,500, $31,250,
$15,625, and $7,812. No patent royalties are payable for patent zone differentials of eight or
more.
Patent royalties are one-time payments made by manufacturers of patent-violating
reconfigured products. Patent royalties are only payable in the quarter in which a patent-

RG Chapman PhD, "LINKS Enterprise Management Simulation" Page 13
violating reconfiguration occurs. Royalties are paid by patent-violating reconfigurations to
competitors whose patents are violated. That is, one firm’s “royalties paid” are another firm’s
“royalties received.”
Some additional considerations about patent
royalties follow:
(1) No patent royalties are paid by or paid to
original quarter-1 product configurations
by other firms' quarter-1 product
configurations. However, any
reconfigurations violating still-existing
patents of quarter-1 product configurations
are subject to patent royalty payments
according to the schedule described
above.
(2) Patent royalties are payable only to
pre-existing patents, not to competitors’
products reconfigured simultaneously with
your reconfiguration (i.e., in the same
quarter that you reconfigure a product).
(3) Multiple patent zone violations are possible on any reconfiguration. The patent royalty
payments described above are payable for each patent zone violation.
(4) Patent royalties (receipts and disbursements) are reported on your "Corporate P&L
Statement."
Manufacturing Decisions
"Nobody wants to have inventory, but everybody wants a product there
when they want it." – Joe Chernay, Vice-President of Manufacturing and Technology,
Bayer Corporation, http://www.industry.net/ discussions/supplychain.htm
In the LINKS Enterprise Management Simulation, you're responsible for production and
emergency production limit decisions for each of your products in each quarter.
Production of each product can change by a maximum of 25,000 units from the previous
quarter's value. Production may be changed to 0 units at any time, but you'd be limited to a
maximum production of 25,000 units in the following quarter due to load balancing requirements
associated with long-term capacity utilization and labor force overtime scheduling requirements.
In addition to order-related and unit-related costs, your firm absorbs costs associated with
depreciation and maintenance of your set-top box plant capacity. These costs are
$300,000/quarter for each production "shift" and they are recorded as "Plant Capacity FC" (plant
capacity fixed costs) on your "Corporate Current P&L Statement." These costs are allocated
equally among your products.
FAQ
"If we reconfigure immediately by just one 'unit'
(e.g., change Bandwidth by 1), what are the
patent royalty implications?" Such a minor
reconfiguration would violate all other firms'
existing patent protection (in that set-top box
category), since all firms' products are initially
configured identically in each set-top box
category. Thus, there would be some fairly
substantial patent royalties to pay with such a
minor reconfiguration.

RG Chapman PhD, "LINKS Enterprise Management Simulation" Page 14
A production "shift" can accommodate up to
50,000 production units. If total production
across all products (including regular and
emergency production) is less than 50,000
units per quarter, then only one production
shift is needed that quarter, and the
associated costs are $300,000. If total
production across all products (including
regular and emergency production) is 50,001
to 100,000 units, then two production "shifts"
are needed in that quarter, with associated
costs of $600,000. The LINKS software
automatically schedules the appropriate
number of production "shifts" based on total
production. There must always be at least
one production "shift" capability at all times,
even if total production is zero units.
Emergency production is a maximum of
25,000 units per product. If end-user demand
exceeds available inventory plus your
emergency production limit, additional end-
user demand becomes unfilled orders. There is a $2/unit cost for standby charges associated
with all emergency production limits for hyperware. These standby charges are levied regardless
of whether you use the specified emergency production limits. Emergency production costs are
recorded under "Emergency Production" on the "Corporate P&L Statement."
If finished goods inventory is insufficient to meet demand, an emergency production order is
executed automatically up to the product's specified emergency production limit. Emergency
production orders have a 50% cost premium associated with them (i.e., labor and production
costs are 50% higher than standard) for emergency production volumes up to the limit of the
product's specified emergency production limit. For emergency production for any product in
excess of 12,500 units, the production and labor costs premiums are 100% above standard rates.
You have complete control over whether you wish to use emergency production for any product.
If you set a product's emergency production limit to 0, then unfilled orders result. You'll need to
assess the relevant trade-offs between emergency production and unfilled orders.
Unfilled Orders
Unfilled orders can exist in your set-top box industry. If demand for any product exceeds the
product’s emergency production limit, customer sales and scheduled product shipments to other
DCs must be reduced (proportionately) by the amount that orders exceed the product’s
emergency production limit. The difference between potential customer sales (orders) and actual
customer sales due to inadequate on-hand finished goods inventory (after accounting for a
product's emergency production limit) is "unfilled orders" in LINKS.
Unfilled orders are not backlogged orders. Unfilled orders are not guaranteed (i.e.,
FYI: Why Hold Inventory?
Cost considerations argue for low inventory.
But, there are reasons for holding inventory:
To create buffers against the uncertainties of
supply and demand.
To take advantage of lower purchasing and
transportation costs associated with high
volumes.
To take advantage of economies of scale
associated with manufacturing products in
batches.
To build up reserves for seasonal demands
or promotional sales.
To accommodate products flowing from one
location to another (work in progress or in
transit).
To exploit speculative opportunities for
buying and selling commodities.
Source: Jeremy F. Shapiro, Modeling The Supply Chain
(Pacific Grove, CA: Duxbury, 2001), p. 477.

RG Chapman PhD, "LINKS Enterprise Management Simulation" Page 15
contracted, pre-paid) future sales. Unfilled orders occur at a particular moment in time due to
inventory shortages relative to potential customer demand (orders), given competitive conditions
at that particular moment in time.
Unfilled orders incur additional processing and handling costs of $25/unit.
Past experience suggests that current unfilled orders reflect three types of set-top box customers.
Some customers immediately defect to another competitor's (available) product. Other
customers decide not to buy any set-top product now or in the near-term future. A third segment
of customers are inclined to wait and attempt to repurchase the preferred product having these
unfilled orders again in the future when supply (i.e., inventory availability) is more favorable. The
size of these three types of unfilled-orders customers is unknown. In all cases, however, it should
be expected that unfilled orders negatively impacting downstream demand to some extent.
If competitive conditions change (e.g., if you raise your unfilled-orders product's price dramatically
or competitors substantially improve their own product offerings and marketing programs), then
the share of customers with unfilled orders who would have been inclined to attempt to
repurchase your unfilled-orders product in the future can decrease. Additionally:
If you drop a product with unfilled orders from active distribution in a particular region, the
unfilled orders associated with that product in that particular region are completely lost. They
will not shift to another product.
If you reconfigure a product with outstanding unfilled orders, those unfilled orders are lost.
Unfilled orders represent additional potential demand that might have been realized beyond "filled
orders" (i.e., sales) if sufficient product supply had been available to meet all customer purchase
requests. A high level of unfilled orders could also reflect industry-wide double-counting if multiple
firms' products simultaneously have unfilled orders. If two products simultaneously have unfilled
orders, then some customers might have wished to purchase first one of the products and then
the other product when the stockout situation for the first product was encountered. In such a
situation, a single customer would have been counted as an unfilled order by both stocked-out
products.
For an indirect (retail) channel, inventory buffer stock routinely maintained by retailers complicates
the interpretation of unfilled orders. If retailers order 1,000 units from a manufacturer but that
manufacturer is only able to fill 600 units of that order, this represents 400 units of unfilled orders
to the manufacturer. However, this doesn't necessarily mean that retailers have unfilled orders
from end-user customers. If the 600 units of the retailers' manufacturer-order yield sufficient on-
hand retailer inventory to permit all end-user customer orders to be filled, then there are no
unfilled orders as far as retailers are concerned. (In this case, retailers' ending inventory level
would be below the desired level, which presumably would lead to increased orders in the
following quarter to meet expected end-user customer demand plus inventory restocking targets.)
With the buffering nature of retailer inventory, there could be no industry-wide unfilled orders but
individual manufacturers could still have unfilled orders.
If dealers stockout, they will reorder in anticipation of future (continuing) rising demand above
current sales levels, as well as having to account for their (i.e., dealers') future desired inventory
levels. These are the total unfilled orders that manufacturers see arising from industry-wide
unfilled orders, as reported in Research Study #12, reference actual final end-user customer
stockouts now (not in the future). Since industry-wide unfilled orders are customer-based,
industry-wide unfilled order estimates presumably are based on customer surveys. Such survey-

RG Chapman PhD, "LINKS Enterprise Management Simulation" Page 16
based estimates contain some statistical noise as well as reflecting the potential for biases in
customer surveys, especially if there are lots of customers who encountered stockout situations.
Thus, even a thoughtful/rational survey respondent might claim to have wanted to buy and
encountered a stockout situation, to encourage manufacturers to have more plentiful inventory,
especially when no contractual purchase commitment is required within the survey.
Price Decisions
You set prices for each actively distributed product in each market region. The dealer/retail
channel price is the bulk-rate price for all units purchased for resale by dealers/retailers. The
custom in the set-top box industry is to quote a single price regardless of order volume.
You do not control final selling prices in the retail channel. Rather, your manufacturer price is
marked up by some percentage amount by retailers in the various market regions. You will need
to consult current research studies to determine average dealer prices for your products in the
various market regions.
Prices affect customer demand in the usual fashion within the set-top box industry. Higher prices
are normally associated with lower customer demand. The specific price sensitivities in the
markets in LINKS are unknown. You will need to learn about the markets' responsiveness to
price through your experience in LINKS and by exploiting available research studies.
In addition to the physical costs of producing and distributing updated price sheets, lists, and
databases that accrue when a manufacturer changes price (so-called “menu costs”), a range of
indirect and non-obvious costs arise with price adjustments.1
Managerial Costs: A manufacturer must gather information, analyze, assess, and ultimately
communicate the logic associated with price changes throughout their firm. Managerial
costs presumably increase with larger price changes, since there is more to assess/analyze
and more organizational members become involved with larger price changes.
Customer-Facing Costs: When implementing price changes, a communications program
must be created and executed to portray a price change in the most favorable light to
customers. In a B2B environment, price adjustments potentially involve (re)negotiation with
those customers who are resistant to new (higher) prices.
In LINKS, each price change by your manufacturing firm for a product in a market region results
in $10,000 in costs plus $200 in costs per-dollar change in price (increase or decrease in price)
plus costs of 0.25% of current-quarter revenues.2 For example, a $75 change in price on a
1 Recent published research documents the range of direct and indirect costs associated with price
adjustments for a large U.S. industrial manufacturer (more than one billion USD$ revenues selling 8,000
products [used to maintain machinery] through OEMs and distributors). The authors found that
managerial costs are more than 6 times, and customer-facing costs are more than 20 times, the so-called
“menu costs” (physical costs) associated with price adjustments. In total, price adjustment costs comprise
1.22% of the company’s revenue and 20.03% of the company’s net margin. {Source: Mark J. Zbaracki,
Mark Ritson, Daniel Levy, Shantanu Dutta, and Mark Bergen, “Managerial and Customer Costs of Price
Adjustment: Direct Evidence From Industrial Markets,” The Review of Economics and Statistics,
Volume 86, Number 2 (May 2004), pp. 514-533.}
2 Price change costs only accrue for products that are already actively being sold in a region. No price
change costs accrue for price changes for a product as it is being introduced into region (i.e., it was
inactive in that region in the last quarter).

RG Chapman PhD, "LINKS Enterprise Management Simulation" Page 17
product with revenues of $4,500,000 in a particular region incurs price change costs of $10,000
+ ($200)(75) + (0.0025)($4,500,000) = $10,000 + $15,000 + $11,250 = $36,250. These price
change costs are recorded as “Price Changes” in the “Fixed and Other Costs” section of your
firm’s profit-and-loss statements in the quarter in which the price change occurs.
It's very easy to drop price to attempt to increase demand. However, it's always an interesting
question whether that increased demand actually increases profits. Remember, the price
decrease that generates increased demand also reduces your margin on each unit sold.
More importantly, it's easy for competitors to see and feel threatened by a price change.
Price wars are often initiated by thoughtless price manipulations of naive managers who assume
that competitors won't notice, won't respond, or respond ineptly. To provide a fact-based
approach for making pricing decisions, please refer to the "Pricing Worksheet" on the following
page. Complete this "Pricing Worksheet" anytime you're planning to reduce prices. Review the
worksheet details with your teammates. After this review, go ahead with the price decrease if you
really think that it's appropriate. Review this "Pricing Worksheet" again after you receive next
quarter's financial results to verify whether your assumptions/predictions were reasonable.
Marketing Spending Decisions A marketing spending budget is required for each set-top box product in each market region. This
budget is managed by your firm’s relevant region managers and is used for advertising,
promotion, and sales force efforts associated with your products. You are free to allocate funds to
marketing spending as you see fit. Marketing spending does not have to be equal in all regions.
Significant percentages of advertising and promotion budgets are automatically spent on digital
marketing, as is typical practice in other comparable industries. This includes allocations to
Facebook, YouTube, and Google, for example, as well as location-based mobile marketing.
Marketing spending is thought to increase customer demand for set-top boxes. Past industry
practice has been to budget at least $50,000/quarter in marketing spending in all regions within
which a set-top box product is actively distributed. It is thought that marketing spending's impact
on customer demand declines at higher expenditure levels, but the precise relationship between
marketing spending and sales is unknown. You will have to learn about marketing spending's
influence on sales through your experience within the set-top box industry.
If you drop a product from a region, you must change marketing spending to $0. Otherwise,
marketing spending continues to occur, in anticipation of a future relaunch.

RG Chapman PhD, "LINKS Enterprise Management Simulation" Page 18
Pricing Worksheet
This pricing worksheet is designed to provide an analysis framework anytime you are
contemplating decreasing prices within LINKS.
Complete the "Before" columns and review the "Before" columns with your team members.
Complete the "After" column with actual data from the next quarter, after the results are available.
Review the before-after comparison with your team members.
Firm Product Region Quarter
Before Action Analysis,
Review, and Forecast
After Action
Review
Last
Quarter,
Actual
Next
Quarter,
Predicted
Next Quarter,
Actual
Industry Sales Volume [units]
* Volume Market Share [%s]
= Sales Volume [units]
* Manufacturer Price [$]
= Revenue [$]
- Variable Costs [$]
= Gross Margin [$]
- Fixed Costs [$]
= Operating Income [$]

RG Chapman PhD, "LINKS Enterprise Management Simulation" Page 19
Introduction/Drop Decisions
You may introduce products into regions not currently active or drop products from regions as you
wish. Introduction incurs a one-time cost of $750,000 in any region. Dropping a product from
active distribution in a region incurs no special costs. Introduction costs are recorded under
"Introductions" on your financial statements.
To "activate" a product in a region, issue a specific introduction decision. Change the "Active
Product?" status to "Yes" to introduce a product into a specific region. To drop a product from
active status in a region, change its "Active Product?" status to "No." You only introduce a
product into a region once. Once a product is active in a region, it continues to be
active until you make an explicit drop ("No") decision.
You must explicitly introduce or drop a product from a region, regardless of your marketing
spending and your sales volume forecasts. Setting marketing spending to zero does not
result in the associated product being dropped from that region.
If you drop a product from a region, you must change marketing spending to $0. Otherwise,
marketing spending continues to occur, in anticipation of a future relaunch.
Your firm has a policy of limiting simultaneous new product-region launches to a
maximum of three in any quarter. A reconfiguration isn't a launch if that product is already
actively distributed in a region.
Service Decisions
Service is outsourced in the LINKS Enterprise Management Simulation. Service outsourcing is
provided by reputable call-center service providers in each LINKS region. You may choose from
among the four available service outsourcing options/levels in each region, in addition to level "0"
("None" which implies no service is provided). Their per-call costs and associated guaranteed
service quality performance levels ("SQ Guarantee") are detailed below:
Service Outsourcing Level Region 1 Region 2 Region 3
"Minimum" [1] Cost/Call
SQ Guarantee
$6
10%
$7
10%
$8
10%
"Standard" [2] Cost/Call
SQ Guarantee
$10
20%
$12
20%
$13
20%
"Enhanced" [3] Cost/Call
SQ Guarantee
$16
30%
$18
30%
$21
30%
"Premium" [4] Cost/Call
SQ Guarantee
$24
40%
$27
40%
$32
40%
Service-center outsourcers guarantee that perceived service quality won't vary by more than 3%
from these long-run averages in any quarter. Costs for call-center service outsourcing are
reported as "Service Outsourcing" on your financial and operating reports.
RG Chapman PhD, "LINKS Enterprise Management Simulation" Page 20
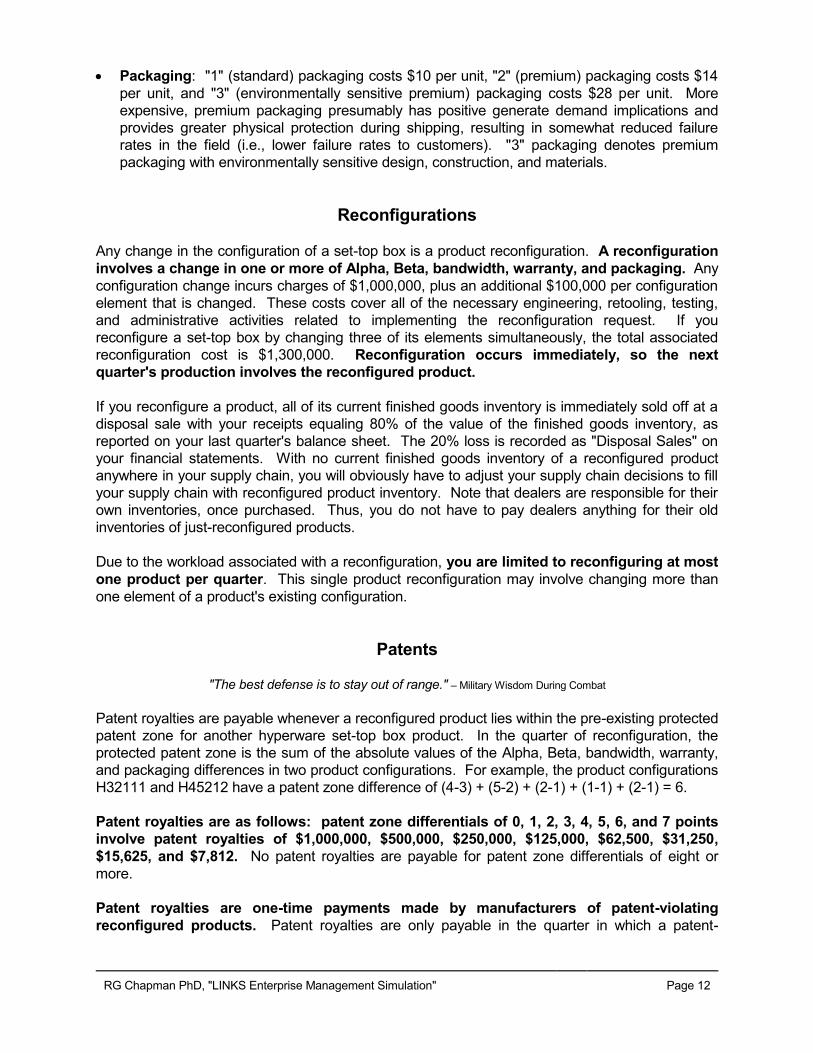
Sales Volume Forecasting Decisions "Prediction is very difficult, especially about the future." – Niels Bohr
Forecasting prowess reflects understanding of the generate demand drivers of any business. In
LINKS, region-specific quarterly sales volume forecasts are required for each product.
Administrative overhead costs increase by 1% for every 1% inaccuracy in your sales volume
forecasts. For example, a forecast error of 10% (whether positive or negative) for a product in a
region increases the administrative overhead costs for that product in that region by 10%.
The maximum administrative overhead penalty associated with sales forecasting inaccuracy
for each product in each region is a doubling of administrative overhead.
Forecast error costs are recorded as “Forecast Inaccuracy” costs on your firm’s profit-and-loss
statements, so the reported base administrative overhead costs are always $240,000 per
quarter per product per region.
Forecasting accuracy equals 100*(1-(abs(Forecast-Actual)/Actual)) expressed in percentage
terms, where "abs" is the absolute value function. Thus, a forecast value of 11,000 and an actual
value of 8,000 results in a forecast accuracy of 100*(1-abs(11,000-8,000)/8,000) = 100*(1-
(3,000/8,000)) = 100*(1-0.375) = 62.5%. The minimum possible value of forecasting accuracy is
0.0%. For example, with an Actual sales volume of 8,000, a Forecast above 16,000 results in a
forecasting accuracy score of 0.0%.
Given the importance of forecasting in running your LINKS business, you might find that reading
the following article has a positive return on your reading-time investment:
J. Scott Armstrong, "The Forecasting Canon: Generalizations To Improve Forecast
Accuracy," FORESIGHT: The International Journal of Applied Forecasting, Volume 1,
Issue 1 (June 2005), pp. 29-35.
http://www.forecastingprinciples.com/paperpdf/The_Forecasting_Canon.pdf
The following page contains a judgmental sales forecasting worksheet that provides a template
for systematically approaching the sales forecasting process. Judgmental adjustments are
challenging, but at least you're explicitly taking into account that your generate demand program
changes, and those of your competitors, influence your sales.
Firm Name
Your firm may choose a firm name (a maximum of 40 characters). This firm name is printed on
the top of all financial, operating, and research reports. Firm names have no cost or known
demand-side implications, so you are free to choose (or change) your firm's name as you wish.
RG Chapman PhD, "LINKS Enterprise Management Simulation" Page 21
Judgmental Sales Forecasting Worksheet
Sales forecasting drives everything in demand and supply chains. Unfortunately, sales
forecasting is extraordinarily challenging due to the many factors influencing your sales (your
current and recent generate demand programs, current and recent competitors' generate demand
programs, and exogenous market forces).
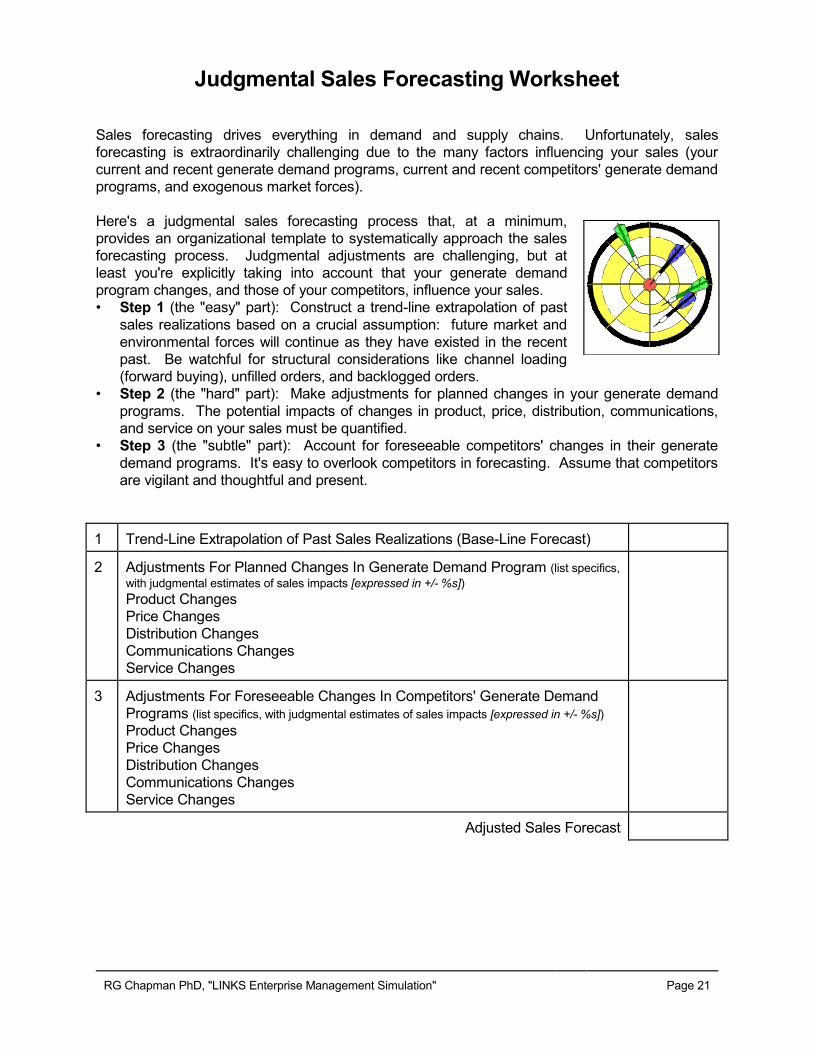
Here's a judgmental sales forecasting process that, at a minimum,
provides an organizational template to systematically approach the sales
forecasting process. Judgmental adjustments are challenging, but at
least you're explicitly taking into account that your generate demand
program changes, and those of your competitors, influence your sales.
• Step 1 (the "easy" part): Construct a trend-line extrapolation of past
sales realizations based on a crucial assumption: future market and
environmental forces will continue as they have existed in the recent
past. Be watchful for structural considerations like channel loading
(forward buying), unfilled orders, and backlogged orders.
• Step 2 (the "hard" part): Make adjustments for planned changes in your generate demand
programs. The potential impacts of changes in product, price, distribution, communications,
and service on your sales must be quantified.
• Step 3 (the "subtle" part): Account for foreseeable competitors' changes in their generate
demand programs. It's easy to overlook competitors in forecasting. Assume that competitors
are vigilant and thoughtful and present.
1 Trend-Line Extrapolation of Past Sales Realizations (Base-Line Forecast)
2 Adjustments For Planned Changes In Generate Demand Program (list specifics,
with judgmental estimates of sales impacts [expressed in +/- %s]) Product Changes
Price Changes
Distribution Changes
Communications Changes
Service Changes
3 Adjustments For Foreseeable Changes In Competitors' Generate Demand
Programs (list specifics, with judgmental estimates of sales impacts [expressed in +/- %s])
Product Changes
Price Changes
Distribution Changes
Communications Changes
Service Changes
Adjusted Sales Forecast

RG Chapman PhD, "LINKS Enterprise Management Simulation" Page 22
Chapter 3: Research Studies "Time spent in reconnaissance is seldom wasted." – Sun Tzu, 4BC
Research studies requests are submitted along with your other decision variable changes.
Although LINKS research studies are ordered prior to the beginning of the next quarter, research
studies are executed during and after the next quarter, as appropriate. Thus, research studies
reports always reflect the just-completed quarter's experience.
The following research study descriptions include sample output to illustrate the style and
formatting of research study output. The output should not be viewed as providing any
specific insight into your particular set-top box industry.
The existence of any particular LINKS research study is not an endorsement that such a
research study is important, relevant, or even useful to the management of your LINKS firm.
Rather, the inclusion of these research studies in LINKS reflects their real-world existence in a
wide variety of industries and product/service categories. You must form your own opinion
about the relative merits of these LINKS research studies and, in particular, whether each
research study's potential value exceeds its monetary cost.
Which research studies should you purchase and when? Snappy but uninformative responses
would be "purchase only research that you really need" and "it depends." Unfortunately, these
responses are not very constructive. There are no universal answers about appropriate, needed,
and desirable research studies, other than the principle that research is about uncertainty
reduction. What don't you know? How important is it to "know" these things? Is there any
research that might be conducted in a timely fashion to reduce this uncertainty?
Excellent strategy can only be developed based on excellent analysis. Since research provides
the raw data for excellent analysis, research should be an important component of your decision-
making process. Do not relegate your research studies pre-ordering decisions to the last five
minutes of team meetings. Rather, treat research studies ordering decisions as a fundamental
part of your whole LINKS decision-making process.
Research Study #1: Benchmarking - Earnings
Purpose: This research study provides
earnings benchmarks for your industry. The
current-quarter earnings, cumulative-to-date
earnings, and current-quarter dividends of
each firm in your industry are reported. In
addition, a variety of financial market
statistics are reported.
Information Source: These data are
based on public information.
Cost: $500.
Sample Output
======================================================================= RESEARCH STUDY # 1 (Benchmarking - Earnings ) ======================================================================= Current Cumulative Current Net Income Net Income Dividends ----------- ----------- -----------
Firm 1 2,974,292 5,788,265 892,287 Firm 2 3,472,461 6,234,171 1,041,738 ... Financial Market Statistics [stock price, shares outstanding (millions), earnings per share, dividends per share, market capitalization ($millions)] ------ ------ ------ ------ Firm 1 Firm 2 Firm 3 Firm 4 ------ ------ ------ ------ StockPrice 120.00 131.80 117.63 123.96 Shares 2.0M 2.0M 2.0M 2.0M ...

RG Chapman PhD, "LINKS Enterprise Management Simulation" Page 23
Research Study #2: Benchmarking - Balance Sheets
Purpose: This research study provides
summary balance sheet benchmarks for
your industry. These balance sheets must
be requested for specific firms in your
industry.
Information Source: These summary
balance sheets are provided by your
research supplier based on public
information.
Cost: $1,000 per firm.
Additional Information: These summary balance sheets contain the level of information
available from public sources. For example, aggregate inventory levels are reported, but there is
no disaggregation of aggregate inventory information by product.
Research Study #3: Benchmarking - Product Development
Purpose: Current configurations are
reported for all actively-sold products. The
last quarter in which each product was
reconfigured is reported, with quarter "0"
referencing reconfigurations which occurred
prior to quarter 1.
Information Source: These research study results are based on reverse engineering efforts by
your research supplier.
Cost: $1,500 per competitor product.
Research Study #9: Benchmarking - Generate Demand
Purpose: This research study provides
generate demand benchmarks for your
industry. Price and marketing statistics
(minimum, average, and maximum) for
each product category and market region
are provided.
Information Source: This research study
is based on information sharing and pooling
agreements among all firms in the set-top
box industry administered by the Set-Top
Box Industry Trade Association.
Sample Output
======================================================================= RESEARCH STUDY # 2 (Benchmarking - Balance Sheets ) ======================================================================= -------------------- FIRM 2 BALANCE SHEET -------------------- ASSETS: Cash 1,686,016 Marketable Securities 24,186,533 Finished Goods and Postponed Production Inventory 25,661,228 Plant Investment 50,000,000 Procurement Inventories 1,398,909 Total Assets 102,932,686 LIABILITIES AND EQUITIES: Corporate Capitilization 100,000,000 ...
Sample Output
======================================================================= RESEARCH STUDY # 3 (Benchmarking - Product Development ) ======================================================================= Product 1-1H Configuration: H35112 [reconfigured in quarter 3] Product 1-2H Configuration: H73212 [reconfigured in quarter 8] Product 2-1H Configuration: H11111 [reconfigured in quarter 0] ...
Sample Output
======================================================================= RESEARCH STUDY # 9 (Benchmarking - Generate Demand ) ======================================================================= Quarter 55 Quarter 56 Quarter 57 Quarter 58 ----------- ----------- ----------- -----------
----------- HYPERWARE REGION 1 min/ave/max ----------- Price [$] 435 520 657 431 554 689 437 542 662 429 542 662 Mktg [$K] 100 161 300 0 183 300 0 157 300 0 181 326 ...

RG Chapman PhD, "LINKS Enterprise Management Simulation" Page 24
Cost: $5,000.
Research Study #11: Benchmarking - Operating Statistics
Purpose: This research study provides a
variety of operating statistics benchmarks
for your industry. Various "Corporate P&L
Statement" figures are reported as
percentages of revenues for your firm and
for three industry aggregates (minimum,
average, and maximum). Average CSR
monthly salary in all regions is reported. In
addition, industry-wide call center statistics
are reported.
Information Source: This research study
is based on information sharing and
pooling agreements among all firms in the
set-top box industry administered by the
Set-Top Box Industry Trade Association.
Cost: $2,500.
Sample Output
======================================================================= RESEARCH STUDY #11 (Benchmarking - Operating Statistics ) ======================================================================= Firm 8 Minimum Average Maximum ----------- ----------- ----------- ----------- P&L OPERATING STATISTICS Revenues 100.0% 100.0% 100.0% 100.0% Product Costs 50.7% 44.3% 49.1% 50.7% Replacement Parts .6% .5% .6% .7% Transportation Costs 10.2% 8.0% 9.7% 10.5% Duties & Tariffs 7.9% 7.0% 8.0% 8.9% Gross Margin 30.5% 30.5% 32.6% 38.2% Administrative O/H 5.7% 4.7% 5.6% 6.0% Marketing 4.5% 3.8% 4.7% 6.0% Research Studies .0% .0% .0% .1% Service 4.7% 3.6% 4.5% 4.9% Total Fixed Costs 25.7% 22.0% 24.9% 27.2%
Operating Income 4.8% 4.8% 7.8% 13.7% Net Income 2.9% 2.9% 4.4% 7.3% CSR CALLS STATISTICS Region 1 21,059 19,107 19,964 21,059 Region 2 18,485 17,339 18,171 18,930 Region 3 29,680 25,487 27,747 30,611 CSR $/CALL STATISTICS Region 1 10.73 10.73 11.57 12.99 …
RG Chapman PhD, "LINKS Enterprise Management Simulation" Page 25
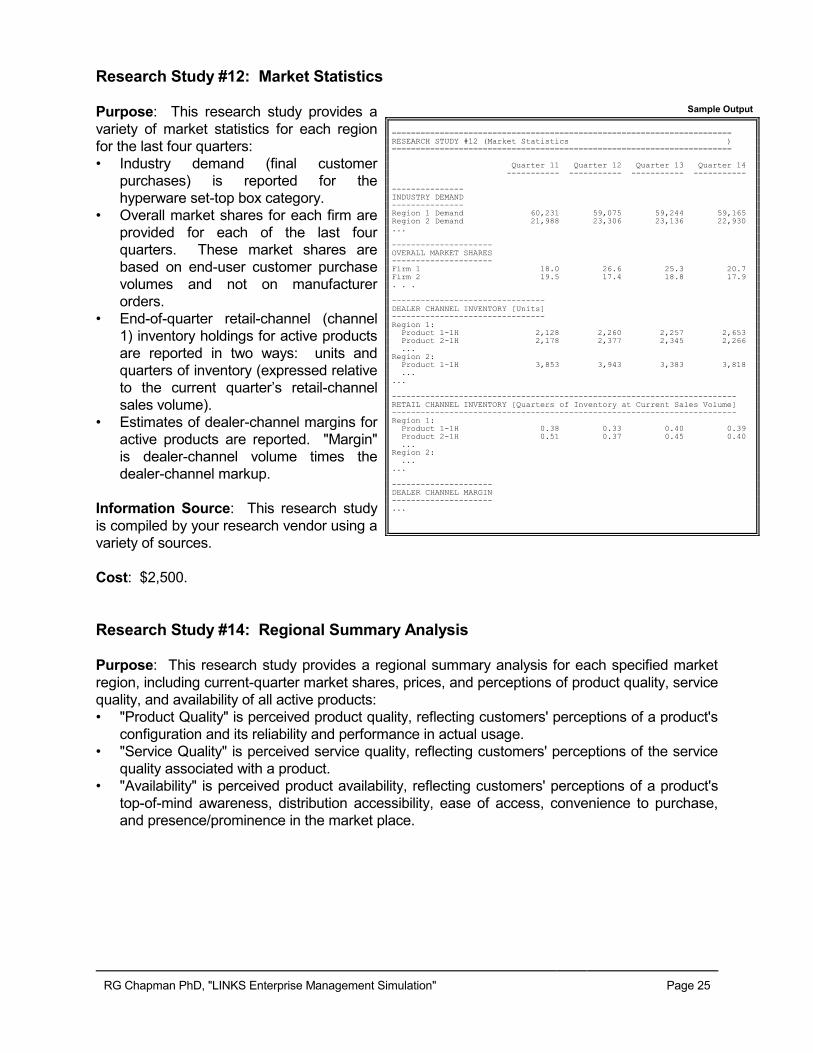
Research Study #12: Market Statistics
Purpose: This research study provides a
variety of market statistics for each region
for the last four quarters:
• Industry demand (final customer
purchases) is reported for the
hyperware set-top box category.
• Overall market shares for each firm are
provided for each of the last four
quarters. These market shares are
based on end-user customer purchase
volumes and not on manufacturer
orders.
• End-of-quarter retail-channel (channel
1) inventory holdings for active products
are reported in two ways: units and
quarters of inventory (expressed relative
to the current quarter’s retail-channel
sales volume).
• Estimates of dealer-channel margins for
active products are reported. "Margin"
is dealer-channel volume times the
dealer-channel markup.
Information Source: This research study
is compiled by your research vendor using a
variety of sources.
Cost: $2,500.
Research Study #14: Regional Summary Analysis
Purpose: This research study provides a regional summary analysis for each specified market
region, including current-quarter market shares, prices, and perceptions of product quality, service
quality, and availability of all active products:
• "Product Quality" is perceived product quality, reflecting customers' perceptions of a product's
configuration and its reliability and performance in actual usage.
• "Service Quality" is perceived service quality, reflecting customers' perceptions of the service
quality associated with a product.
• "Availability" is perceived product availability, reflecting customers' perceptions of a product's
top-of-mind awareness, distribution accessibility, ease of access, convenience to purchase,
and presence/prominence in the market place.
Sample Output
======================================================================= RESEARCH STUDY #12 (Market Statistics ) ======================================================================= Quarter 11 Quarter 12 Quarter 13 Quarter 14 ----------- ----------- ----------- ----------- --------------- INDUSTRY DEMAND --------------- Region 1 Demand 60,231 59,075 59,244 59,165 Region 2 Demand 21,988 23,306 23,136 22,930 ... --------------------- OVERALL MARKET SHARES --------------------- Firm 1 18.0 26.6 25.3 20.7 Firm 2 19.5 17.4 18.8 17.9 . . . -------------------------------- DEALER CHANNEL INVENTORY [Units] -------------------------------- Region 1: Product 1-1H 2,128 2,260 2,257 2,653 Product 2-1H 2,178 2,377 2,345 2,266
... Region 2: Product 1-1H 3,853 3,943 3,383 3,818 ... ... ------------------------------------------------------------------------ RETAIL CHANNEL INVENTORY [Quarters of Inventory at Current Sales Volume] ------------------------------------------------------------------------ Region 1: Product 1-1H 0.38 0.33 0.40 0.39 Product 2-1H 0.51 0.37 0.45 0.40 ... Region 2: ... ... --------------------- DEALER CHANNEL MARGIN --------------------- ...

RG Chapman PhD, "LINKS Enterprise Management Simulation" Page 26
Information Source: Perceived product
quality, perceived service quality, and
perceived availability are based on a
survey of set-top box customers. These
perceptual ratings are the percentages
of survey respondents rating product
quality, service quality, and availability as
"excellent" on a 4-point "poor"-“fair”-
”good”-"excellent" rating scale.
Cost: $10,000 per region.
Additional Information: Your set-top
box manufacturing firm sells to
retailers, not directly to final end-user
customers. Retailers maintain
inventory of your set-top box products
as well as selling your products to their
customers. Thus, final end-user customers sales volume and market share (for example, as
reported in Research Study #14) aren’t equal to your firm’s sales volume and market share to
the retailers due to inventory holdings of retailers.
These results reflect final end-user customer activity. Thus, the prices reported are the prices
paid by final end-user customers. These prices include the retailers’ markups on the
manufacturers’ prices.
Research Study #20: Customer Satisfaction
Purpose: This research study provides
customer satisfaction estimates of all
products in all regions for the last four
quarters.
Information Source: Customer
satisfaction is based on a customer survey
of current users. Customer satisfaction is
the percentage of survey respondents rating their overall satisfaction with a product as "excellent"
on a 4-point "poor"-“fair”-“good”-"excellent" rating scale.
Cost: $10,000.
Sample Output
======================================================================= RESEARCH STUDY #14 (Regional Summary Analysis )
======================================================================= REGION 1 ┌────────┬─────────────────────────────┬───────┬────┬────┬────┐ HYPERWARE│ Volume │ Market Share │ Price │ PQ │ SQ │ Av │ ┌─────────┼────────┼─────────────────────────────┼───────┼────┼────┼────┤ │ 1-1 │ 15,906 │ 9.9- ████████████ │ 707+│ 41 │ 21-│ 54+│ │ 1-2 │ 531 │ 0.3 ▒ │ 465 │ 2 │ 19 │ 1 │ │ 2-1 │ 9,391 │ 5.9 ███████ │ 439 │ 9 │ 29+│ 38 │ │ 2-2 │ 7,291 │ 4.6 ▒▒▒▒▒▒ │ 417-│ 8 │ 41+│ 23-│ │ 3-1r │ 32,519 │20.3+ ███████████████████████│ 699+│ 50+│ 28 │ 54+│ │ 3-2 │ 16,096 │10.1 ▒▒▒▒▒▒▒▒▒▒▒▒ │ 650 │ 34-│ 18-│ 43 │ │ 4-1 │ 13,238 │ 8.3- ██████████ │ 670+│ 32-│ 18-│ 10-│ │ 4-2 │ 6,881 │ 4.3+ ▒▒▒▒▒ │ 380-│ 8 │ 9-│ 12-│ │ 5-1 │ 12,162 │ 7.6+ █████████ │ 392 │ 9 │ 32+│ 23 │ │ 6-1 │ 7,427 │ 4.6 ▒▒▒▒▒▒ │ 390-│ 8 │ 39+│ 12-│ │ 7-1r │ 25,428 │15.9+ ██████████████████ │ 650+│ 69+│ 32+│ 35+│ │ 7-2 │ 13,225 │ 8.3- ▒▒▒▒▒▒▒▒▒▒ │ 653 │ 35 │ 20-│ 26 │ └─────────┴────────┴─────────────────────────────┴───────┴────┴────┴────┘ Notes: (1) "Volume" is sales volume in units. (2) Other variables listed above are market share, end-customer price ("Price"), perceived product quality ("PQ"), perceived service Quality, ("SQ"), and perceived availability ("Av"). (3) Changes of more than 2%, $20, 2%, 2%, and 2%, respectively, in these
variables from the previous quarter are flagged with "+" (increase) and "-" (decrease) signals after the numerical values. (4) "r" after a firm#-product# denotes a reconfigured product this quarter.
Sample Output
======================================================================= RESEARCH STUDY #20 (Customer Satisfaction ) ======================================================================= Quarter 33 Quarter 34 Quarter 35 Quarter 36 ----------- ----------- ----------- ----------- -------- REGION 1 -------- Product 1-1H 23.0 18.8 27.2 25.8 Product 3-1H 16.0 22.8 26.8 23.4 ...

RG Chapman PhD, "LINKS Enterprise Management Simulation" Page 27
Research Study #23: Concept Test
“Do not be too timid and squeamish about your actions. All life is an experiment.
The more experiments you make the better.” – Ralph Waldo Emerson
Purpose: This research study provides concept test scores for a range of set-top box
configurations "around" a specified configuration in a specified region.
Information Source: This research study
is based on end-user customer surveys.
Study Details: These concept test scores
are "top-box" scores. They represent the
percentage of end-user customers surveyed
assessing the hypothetical set-top box
concept as being "excellent" on a 4-point
"poor"-"fair"-"good"-"excellent" rating scale.
Concept test scan searches are conducted "around" the specified configuration. Here,
"around" means that 243 concept tests are executed (subject to prevailing set-top box technology
limits), one for each of the set-top box configuration attributes that are tested in concept tests
(Alpha, Beta, bandwidth, warranty, and packaging), varying the values up and down one from the
specified configuration for each attribute. Concept test scores are reported for scanned
concepts whose scores exceed that of the designated configuration by at least 1%.
As shown in the sample output, the concept test score for the specified configuration is
reported, along with all of the results for the concept test scanning search around that specified
configuration. Only those scanned concept scores exceeding the specified configuration by at
least 1% are reported. In this sample output, the configuration H99632 is apparently a rather
unattractive configuration in market region 1, thus accounting for the generally low concept test
scores for the specified configuration and for all of its scanned variants.
Cost: $15,000 per concept test per region for up to four concept tests in a quarter. Concept tests
beyond four in a quarter cost double the standard cost of $15,000 (per concept test per region).
Limitations: A maximum of eight (8) research studies of this type may be executed each quarter.
Each of these research study requests must reference a specific region; this research study
cannot be executed for "all" regions, but only for a single region. Concept test scans ordered
for all regions (region "0") will not be executed.
Additional Information: You need baseline concept test scores to interpret concept test scores.
A concept test score of 40% is interesting, but there is no way to tell if that score is associated
with a configuration that offers competitive advantage unless you have corresponding concept test
scores for existing products that are already on the market. Current configurations or the
configurations of leading products are obvious baselines. Of course, you would have to execute
concept tests on such baseline configurations (in addition to the hypothetical concepts of interest)
if you want access to such baseline-configuration concept test scores.
Sample Output
======================================================================= RESEARCH STUDY #23 (Concept Test ) ======================================================================= Product 1-1 Current Configuration [Region 1] H99632 .9% [Region 1] H88521 1.9% H88522 2.1% H88531 2.5% H88532 3.1% H88621 2.3% H88622 2.9% H88631 3.7% H88632 3.7% H89521 1.9% H89522 1.9% H89531 2.4% H89532 2.6% H89621 2.3% H89622 2.4% H89631 3.2% H89632 3.0% ...

RG Chapman PhD, "LINKS Enterprise Management Simulation" Page 28
Research Study #24: Price Sensitivity Analysis
"Any sufficiently advanced technology is indistinguishable from magic." – Arthur C. Clarke
Purpose: This research study provides a price sensitivity analysis for a specific product in a
specific region (or all regions). This research study permits the simultaneous testing of a
reconfiguration of an existing, actively-distributed product and an associated price level of the
user’s choosing. Thus, Research Study #24 is a focused test marketing experiment with user-
specified configurations and prices.
Information Source: This research study is
based on surveys of customers, using
advanced marketing research techniques.
Study Details: These price sensitivity
analyses isolate the impact of price on market
share, while holding other market share
drivers constant (product quality, service
quality, and availability perceptions).
Nine price levels are used in this research
study. With no user-specified price input,
these price levels are automatically centered
around the current price (the “Reference
Price”) of the product in each region for which
this research study is executed. Values of -
20%, -15%, -10%, -5%, 0% (i.e., current
price), +5%, +10%, 15%, and +20%, relative
to the product's “Reference Price,” are used.
If configuration and price are left at their default values (“?…?” and 0, respectively), then
Research Study #24 is executed with the existing product centered around the current price of
the specified product. Otherwise, the user-specified configurations and prices (with the
specified price being the “Reference Price”) are used. Market share predictions are provided for
all tested prices in Research Study #24.
Research study output includes market share and gross margin estimates in research study
requests with no configuration change. With a configuration change, research study output
only includes estimated market shares. Users will need to calculate/estimate their own product
and other variable costs (and, therefore, gross margin) associated with any configuration
change.
In this research study, “Your Price” is the manufacturer price. Your manufacturer price is
the price that you input for this research study. In a retail channel (like channel #1), the LINKS
software automatically estimates the “Market Price” (including the retail markup) that is presented
to the final end-user customer in each price sensitivity analysis.
Cost: $20,000 per price sensitivity analysis (per product per region).
Case Study: Amazon.com
Amazon.com has been charging customers
different prices for the same products. For
example, the company has charged some users
$23.97 and others $25.97 for a DVD version of
"Men in Black." Patty Smith, an Amazon
spokeswoman, said the different prices were
part of a test Amazon is conducting "to measure
what impacts a decision to purchase or not to
purchase." Ms. Smith said Amazon test
customers are selected randomly and the prices
they receive aren't based on any other
characteristics. Source: "Amazon.com Varies Price of Identical Items For
Test," The Wall Street Journal (September 7, 2000)
RG Chapman PhD, "LINKS Enterprise Management Simulation" Page 29
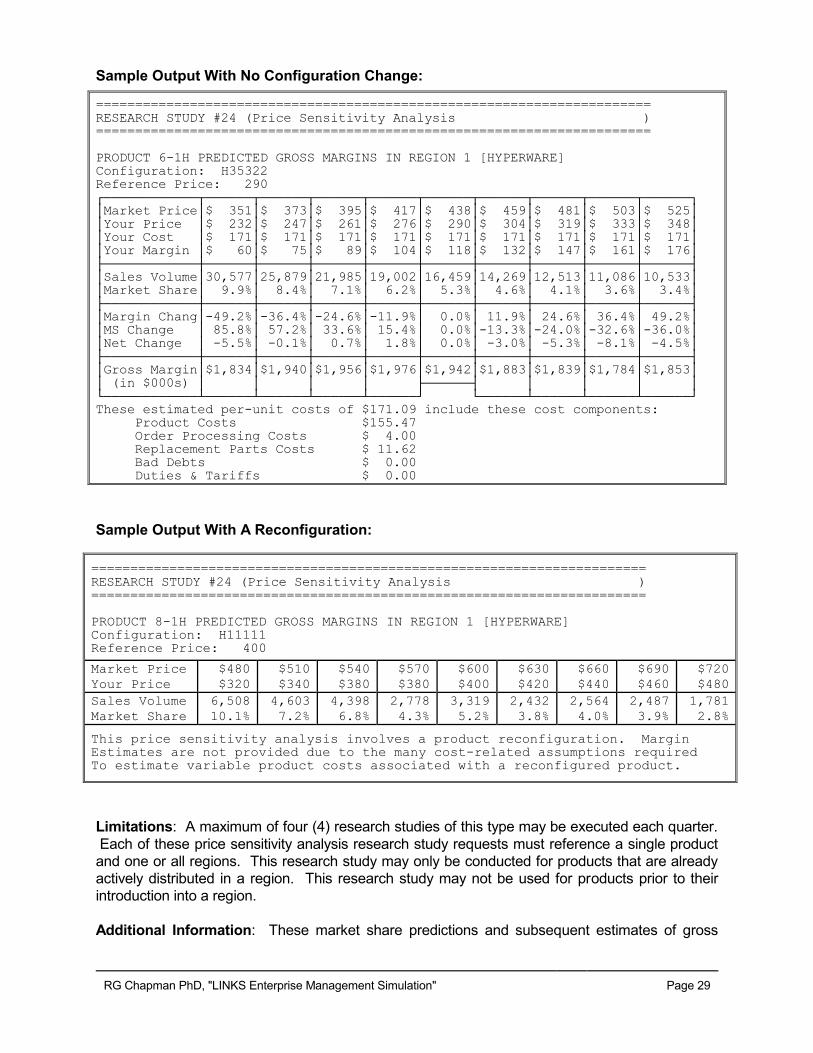
Sample Output With No Configuration Change:
=======================================================================
RESEARCH STUDY #24 (Price Sensitivity Analysis ) ======================================================================= PRODUCT 6-1H PREDICTED GROSS MARGINS IN REGION 1 [HYPERWARE] Configuration: H35322 Reference Price: 290 ┌────────────┬──────┬──────┬──────┬──────┬──────┬──────┬──────┬──────┬──────┐ │Market Price│$ 351│$ 373│$ 395│$ 417│$ 438│$ 459│$ 481│$ 503│$ 525│ │Your Price │$ 232│$ 247│$ 261│$ 276│$ 290│$ 304│$ 319│$ 333│$ 348│ │Your Cost │$ 171│$ 171│$ 171│$ 171│$ 171│$ 171│$ 171│$ 171│$ 171│ │Your Margin │$ 60│$ 75│$ 89│$ 104│$ 118│$ 132│$ 147│$ 161│$ 176│ ├────────────┼──────┼──────┼──────┼──────┼──────┼──────┼──────┼──────┼──────┤ │Sales Volume│30,577│25,879│21,985│19,002│16,459│14,269│12,513│11,086│10,533│ │Market Share│ 9.9%│ 8.4%│ 7.1%│ 6.2%│ 5.3%│ 4.6%│ 4.1%│ 3.6%│ 3.4%│ ├────────────┼──────┼──────┼──────┼──────┼──────┼──────┼──────┼──────┼──────┤ │Margin Chang│-49.2%│-36.4%│-24.6%│-11.9%│ 0.0%│ 11.9%│ 24.6%│ 36.4%│ 49.2%│ │MS Change │ 85.8%│ 57.2%│ 33.6%│ 15.4%│ 0.0%│-13.3%│-24.0%│-32.6%│-36.0%│
│Net Change │ -5.5%│ -0.1%│ 0.7%│ 1.8%│ 0.0%│ -3.0%│ -5.3%│ -8.1%│ -4.5%│ ├────────────┼──────┼──────┼──────┼──────┼──────┼──────┼──────┼──────┼──────┤ │Gross Margin│$1,834│$1,940│$1,956│$1,976│$1,942│$1,883│$1,839│$1,784│$1,853│ │ (in $000s) │ │ │ │ ├──────┤ │ │ │ │ └────────────┴──────┴──────┴──────┴──────┘ └──────┴──────┴──────┴──────┘ These estimated per-unit costs of $171.09 include these cost components: Product Costs $155.47 Order Processing Costs $ 4.00 Replacement Parts Costs $ 11.62 Bad Debts $ 0.00 Duties & Tariffs $ 0.00
Sample Output With A Reconfiguration:
=======================================================================
RESEARCH STUDY #24 (Price Sensitivity Analysis ) ======================================================================= PRODUCT 8-1H PREDICTED GROSS MARGINS IN REGION 1 [HYPERWARE] Configuration: H11111 Reference Price: 400
Market Price
Your Price
$480
$320
$510
$340
$540
$380
$570
$380
$600
$400
$630
$420
$660
$440
$690
$460
$720
$480
Sales Volume
Market Share
6,508
10.1%
4,603
7.2%
4,398
6.8%
2,778
4.3%
3,319
5.2%
2,432
3.8%
2,564
4.0%
2,487
3.9%
1,781
2.8%
This price sensitivity analysis involves a product reconfiguration. Margin Estimates are not provided due to the many cost-related assumptions required To estimate variable product costs associated with a reconfigured product.
Limitations: A maximum of four (4) research studies of this type may be executed each quarter.
Each of these price sensitivity analysis research study requests must reference a single product
and one or all regions. This research study may only be conducted for products that are already
actively distributed in a region. This research study may not be used for products prior to their
introduction into a region.
Additional Information: These market share predictions and subsequent estimates of gross

RG Chapman PhD, "LINKS Enterprise Management Simulation" Page 30
margins are based on the assumption that competing products don't change their generate
demand programs. Obviously, large price changes will tend to evoke competitive responses.
The reported market shares in Research Study #24 are long-run estimates of market
shares if you continue with all of your current customer-facing initiatives (configurations,
marketing spending, service levels, etc.) as they are now and so do competitors. Market
infrastructure issues (like current inventory holdings of retailers and unfilled order status) are
not considered. Only your price is "manipulated" in Research Study #24. Thus, these
Research Study #24 estimates of market share will not correspond exactly to your current
actual market shares (as reported, for example, in Research Study #14).
Research Study #31: Self-Reported Preferences
Purpose: This research study provides self-reported importance weights for a variety of generate
demand elements for each market region. In addition, self-reported attribute preferences for
various levels of raw materials Alpha and Beta are provided for each market region, as well as
Alpha-Beta positioning maps of customer ideal points for each market region.
Information Source: This research study is
based on end-user customer surveys.
Study Details:
These self-reported importance weights are
the averages across all survey respondents.
Seven-point rating scales are used in this end-
user customer surveying, where "1" is anchored
by "Not Important" and "7" is anchored by "Very
Important."
The self-reported attribute preferences
reflect the distribution of customers’ self-
reported preferences across the range of 0-9
kg. for raw materials Alpha and Beta.
The positioning maps graphically display
customer preferences for Alpha-Beta
combinations for category in each market
region. Current product Alpha-Beta
positionings are displayed relative to the
customer ideal-points in the market regions.
Cost: $20,000.
Other Comments: Self-reported importance
weights are easy things to ask survey
respondents. There is, however, considerable
debate about the usefulness of such measures.
Customers may have trouble distinguishing
low-importance and high-importance elements. Customers may report that everything is
important, failing to provide the differentiation that is of interest to marketing managers. It's also
not clear how to use self-reported importance weights to predict future buying behavior, since self-
reported importance weights aren't developed from actual behavior. Perhaps they're only meant
Sample Output
========================================================== RESEARCH STUDY #31 (Self-Reported Preferences ) ========================================================== Region 1 Region 2 Region 3 -------- -------- -------- --------- HYPERWARE --------- Alpha 2.95 3.16 3.04 Availability 3.77 4.12 3.50 Beta 3.20 2.95 3.16 Bandwidth 3.64 3.34 3.11 Marketing 3.77 4.12 3.53 Packaging 3.16 3.16 3.50 Price 4.72 4.79 5.00
Product Quality 3.50 3.77 4.12 Service Quality 3.64 3.77 3.58 Warranty 3.34 3.34 3.64 ----------------------------------- Self-Reported Attribute Preferences For Various Raw Materials Levels ----------------------------------- %s of Customers in a Region Preferring Particular Raw Materials Levels Region 2, Hyperware: Alpha 0 ██ 1.8% 1 ▒▒▒▒▒▒▒▒▒▒▒ 6.2% 2 ██████████████████ 11.9% 3 ▒▒▒▒▒▒▒▒▒▒▒▒▒▒▒▒▒▒▒▒▒▒▒▒▒▒▒▒▒▒▒▒▒ 21.7% 4 ██████████████████████████████████████ 24.5% 5 ▒▒▒▒▒▒▒▒▒▒▒▒▒▒▒▒▒▒▒▒▒▒▒▒▒▒▒▒▒▒▒ 18.0% 6 ███████████████ 10.9% 7 ▒▒▒▒▒▒ 4.2% 8 █ 1.1% 9 0.2%
…

RG Chapman PhD, "LINKS Enterprise Management Simulation" Page 31
to be directional in nature, identifying only really low and really high importance factors.
Self-reported importance weights and self-reported attribute preferences are of uncertain
quality. It’s easy for customers to report “what they want” on such survey instruments, but the
statistical veracity of these self-reported weights and self-reported attribute preferences has been
questioned by many professional marketing researchers.
Additional Information: In this research study, self-reported attribute preferences are reported
only for Alpha and Beta and not for bandwidth, warranty, and packaging. Bandwidth, warranty,
and packaging are “more-is-better” product attributes. There’s no doubt as to the “best” (most
preferred) level of each of these product attributes. Rational end-user customers should naturally
always prefer the highest
possible level of bandwidth,
warranty, and packaging.
The self-reported attribute
preferences reported in this
research study represent one
approach to assessing customer
preferences for specific possible
Alpha and Beta levels in set-top
box products’ configurations.
These self-reported attribute
preferences provide a general
scan of customer preferences
across the full range of set-top
box technology for raw materials
Alpha and Beta. Based on the
results of this research study,
other research studies should be
executed to refine reconfiguration
options and possibilities. For
example, after reviewing the
results of this research study, one
or more research study #23
(“Concept Test”) reports might be
executed.
Relatively sharp preference
distributions for Alpha and Beta
are indicative of homogeneous
customers (who all want about the same raw material level) or strong preferences (they are quite
insistent about their requirements for raw materials). Relatively flat preference distributions for
raw materials signal heterogeneous customers (wide variations in customer preferences for raw
material levels) or weak preferences (tolerance for raw materials variations).
Sample Output (continued)
========================================================== RESEARCH STUDY #31 (Self-Reported Preferences ) ========================================================== HYPERWARE ALPHA-BETA POSITIONING MAP Alpha
│ Numbers are 9│ estimated │ region-specific │ Alpha-Beta 8│ customer │ preferences │ (ideal-points). 7│ 3 │ Letters are │ current product 6│ P configurations │ for Alpha-Beta. │ j 5│ eA1 Other product │ ZUK configuration │ elements (e.g., 4│ Bandwidth, │ Warranty, and │ Packaging) are 3│ not reflected │ in this │ two-dimensional 2│ Alpha-Beta │ positioning map.
│ 2 1│ │ │ 0│ │ └──────────────────────────────────────────────── Beta 0 1 2 3 4 5 6 7 8 9 1-1 A 2-1 F 3-1 K 4-1 P 5-1 U 6-1 Z 7-1 e 8-1 j

RG Chapman PhD, "LINKS Enterprise Management Simulation" Page 32
Chapter 4: Decision Forms
"The secret of getting ahead is getting started. The secret of getting
started is breaking your complex, overwhelming tasks into small
manageable tasks, and then starting on the first one." – Mark Twain
Use the LINKS decision forms on the following four pages during your team deliberations to
record your decisions in each simulation quarter. Then, input these decisions into LINKS via the
LINKS simulation software.
With the exception of research studies orders (which must be made every quarter), all LINKS
decisions are standing orders. (i.e., permanent until explicitly changed). You only need to enter
decision changes. If you are satisfied with a current decision, there is no need to change it.
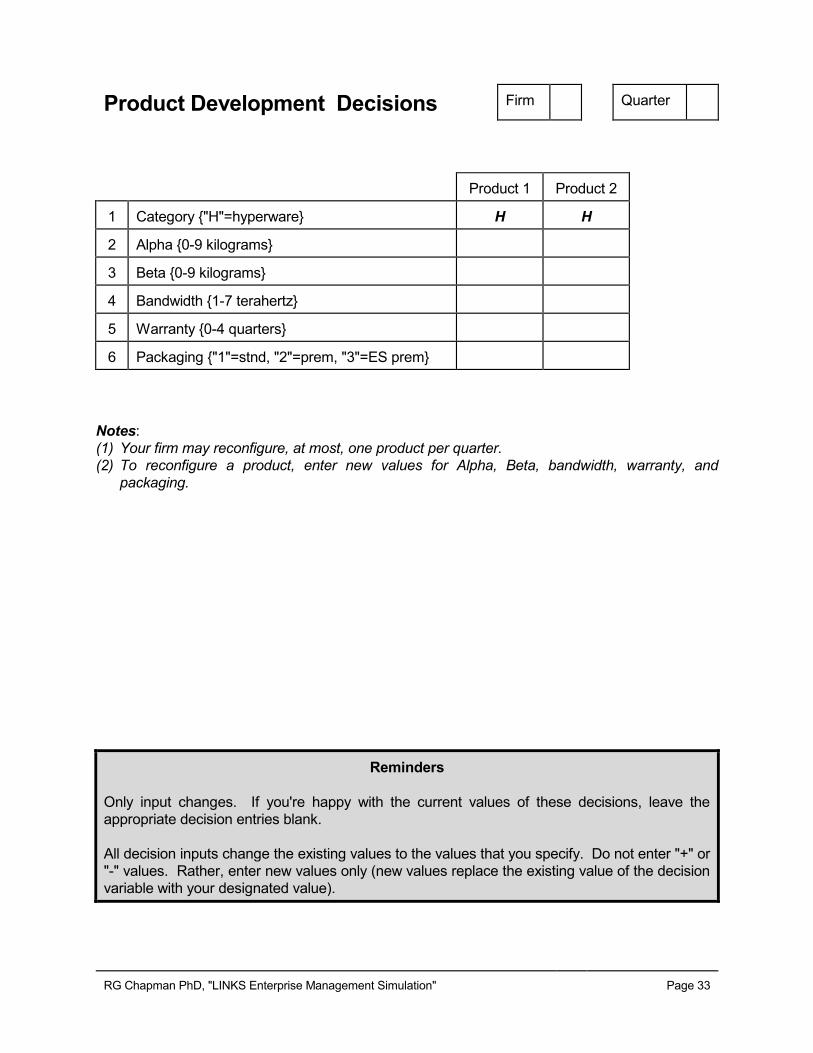
RG Chapman PhD, "LINKS Enterprise Management Simulation" Page 33
Product Development Decisions Firm Quarter
Product 1 Product 2
1 Category {"H"=hyperware} H H
2 Alpha {0-9 kilograms}
3 Beta {0-9 kilograms}
4 Bandwidth {1-7 terahertz}
5 Warranty {0-4 quarters}
6 Packaging {"1"=stnd, "2"=prem, "3"=ES prem}
Notes:
(1) Your firm may reconfigure, at most, one product per quarter.
(2) To reconfigure a product, enter new values for Alpha, Beta, bandwidth, warranty, and
packaging.
Reminders
Only input changes. If you're happy with the current values of these decisions, leave the
appropriate decision entries blank.
All decision inputs change the existing values to the values that you specify. Do not enter "+" or
"-" values. Rather, enter new values only (new values replace the existing value of the decision
variable with your designated value).

RG Chapman PhD, "LINKS Enterprise Management Simulation" Page 34
Manufacturing Decisions Firm Quarter
Manufacturing Decisions Product 1 Product 2
Production
Emergency Production Limit
Note: Each production volume may change by a maximum of 25,000 units from the preceding
quarter's value. You may, however, change production to 0 at any time. However, note that with
a production value of 0 units, the following quarter's production volume would be limited to a
maximum of 25,000 units.
Reminders
Only input changes. If you're happy with the current values of these decisions, leave the
appropriate decision entries blank.
Don't forget to zero-out prior production decisions if you don't wish them to continue on
into the next quarter.
All decision inputs change the existing values to the values that you specify. Do not enter "+" or
"-" values. Rather, enter new values only (new values replace the existing value of the decision
variable with your designated value).

RG Chapman PhD, "LINKS Enterprise Management Simulation" Page 35
Generate Demand Decisions Firm Quarter
Product 1 Region 1 Region 2 Region 3
Active Product? {Yes│No}
Manufacturer Price
Marketing Spending
Sales Volume Forecast
Product 2 Region 1 Region 2 Region 3
Active Product? {Yes│No}
Manufacturer Price
Marketing Spending
Sales Volume Forecast
Reminders
Only input changes. If you're happy with the current values of these decisions, leave the
appropriate decision entries blank.
All decision inputs change the existing values to the values that you specify. Do not enter "+" or
"-" values. Rather, enter new values only (new values replace the existing value of the decision
variable with your designated value).

RG Chapman PhD, "LINKS Enterprise Management Simulation" Page 36
Other Decisions Firm Quarter
Service Decisions Region 1 Region 2 Region 3
Service Outsourcing
Firm Name {maximum of 40 characters}
Research Studies Decisions
1 Benchmarking - Earnings
2 Benchmarking - Balance Sheets Firm(s)?
3 Benchmarking - Product Development
9 Benchmarking - Generate Demand
11 Benchmarking - Operating Statistics
12 Market Statistics
14 Regional Summary Analysis Region(s)?
20 Customer Satisfaction
23 Concept Test Region? Configuration?
Region? Configuration?
Region? Configuration?
Region? Configuration?
Region? Configuration?
Region? Configuration?
Region? Configuration?
Region? Configuration?
24 Price
Sensitivity
Analysis
Product? Region? Configuration? Price?
Product? Region? Configuration? Price?
Product? Region? Configuration? Price?
Product? Region? Configuration? Price?
31 Self-Reported Preferences
Reminders:
(1) Circle the number of each research study that you wish to order. If additional information is
required for a research study, provide that information in the designated space(s).
(2) Research requests are for one quarter only; reorder research studies each quarter, as
desired.

RG Chapman PhD, "LINKS Enterprise Management Simulation" Page 37
Chapter 5: Financial Reports "In a good wind, even turkeys can fly." – Chinese saying
The LINKS Enterprise Management Simulation begins in quarter 1 with all firms in the identical
position (same products, configurations, prices, marketing spending levels, capital structure, etc.).
Since there is no randomness in the simulation in quarter 1, all firms are identical as the
simulation begins. This starting position obviously facilitates evaluation, since all firms start at the
same place. After quarter 1, the decisions of the competing firms in your industry and natural
statistical randomness will lead to differences in competitive positions and results.
To provide an overall roadmap for thinking about the drivers of profitability in LINKS, the charts in
Exhibits 1-3 decompose net income into its underlying components. In Exhibit 1, the principal
drivers of net income are revenues and costs. Taxes and non-operating income play lesser roles.
Exhibit 2 provides a breakdown of the drivers of volume, one of the two key drivers of revenues.
Exhibit 3 provides a roadmap to the drivers of variable costs. Collectively, these exhibits provide a
sense of the DNA of net income in LINKS.
The "Corporate P&L Statement" aggregates product-specific profit-and-loss statements into an
overall corporate P&L statement. Some line-items appear on the "Corporate P&L Statement"
only, because it isn't possible to unambiguously allocate those costs to specific products in
specific regions. Definitions of non-obvious line-items on the "Corporate P&L Statement" follow:
• Administrative overhead ("Administrative O/H") is $240,000 per quarter per product per region.
• "Consulting Fees" are positive or negative adjustments to income or expenses.
Conversations with your instructor/coach are normally without charge, so don't worry about
"Consulting Fees" associated with these consultations. In LINKS, the "Consulting Fees" line
item represents a convenient mechanism for making adjustments to income or expenses. For
example, a research billing problem can be corrected via an "Consulting Fee” adjustment.
• Corporate overhead ("Corporate O/H") is $750,000 per product per quarter. This per-product
charge is incurred if a product is actively distributed in one or more regions.
• "Disposal Sales" reflect costs associated with finished goods inventory disposal sales
associated with reconfigurations. Note that disposal sales due to reconfigurations do not
generate sales revenues. Rather, disposal sales are asset-side transactions on your firm's
balance sheet, with finished goods inventory being exchanged for cash. The loss associated
with such disposal sales is recorded as an expense on your "Corporate P&L Statement" under
"Disposal Sales."
• “Distribution FC” is the per-quarter fixed costs of $25,000 associated with your firm’s
distribution center. Your firm’s distribution center is located adjacent to your manufacturing
plant in region 1.
• "Duties & Tariffs" are a percentage of the average selling price for finished goods that are
imported into any region. If a firm has a manufacturing plant in a region, there are no duties
and tariffs payable. The current duties and tariffs rates are 0%, 8%, and 12%, respectively,
for regions 1, 2, and 3. By definition, all finished goods sold in market region 1 are "local,"
since your firm's manufacturing plant is located in market region 1. "Duties & Tariffs" are
levied on sales in a market region (orders from customers).

RG Chapman PhD, "LINKS Enterprise Management Simulation" Page 38
Exhibit 1: Net Income Drivers in LINKS
Net Income
Revenues
Costs
Non-Operating
Income
Taxes
Volume
Price
Fixed Costs
Variable Costs
Interest Rates
Loans
Marketable Securities
Patent Royalties
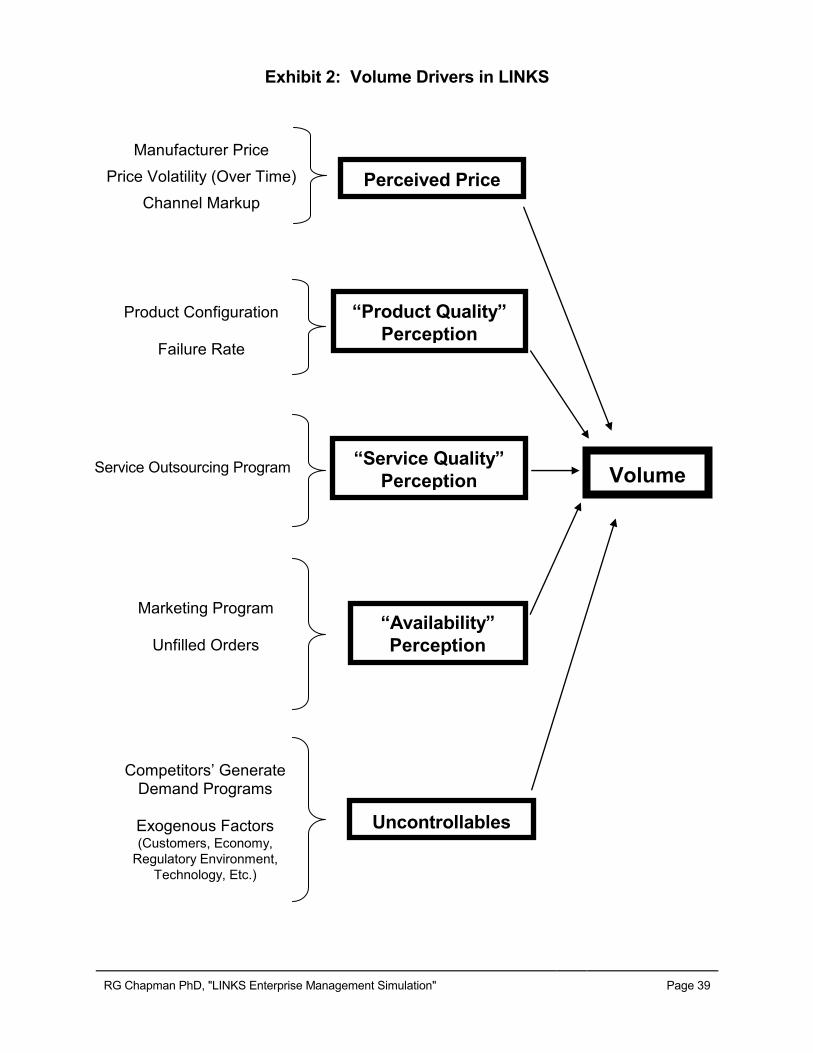
RG Chapman PhD, "LINKS Enterprise Management Simulation" Page 39
Exhibit 2: Volume Drivers in LINKS
Competitors’ Generate
Demand Programs
Exogenous Factors (Customers, Economy,
Regulatory Environment,
Technology, Etc.)
Volume
Perceived Price
“Availability”
Perception
Uncontrollables
“Service Quality”
Perception
“Product Quality”
Perception
Product Configuration
Failure Rate
Marketing Program
Unfilled Orders
Service Outsourcing Program
Manufacturer Price
Price Volatility (Over Time)
Channel Markup

RG Chapman PhD, "LINKS Enterprise Management Simulation" Page 40
Exhibit 3: Variable Cost Drivers in LINKS
Product Configuration
Raw Materials Costs
Components Costs
Labor Costs
Production Costs
Variable
Costs
Transportation
Duties and
Tariffs
Replacement
Parts Demand
Product Costs
Past Sales Volume
Warranty
Failure Rate
Order Processing

RG Chapman PhD, "LINKS Enterprise Management Simulation" Page 41
"Emergency Production" reflects all emergency production costs, including standby
emergency production charges plus any actual emergency-related excess costs (above
regular production) associated with actual realized emergency production.
“Forecast Inaccuracy” records the costs associated with forecasting errors.
"Information Technology" records all IT charges including a $1,000/page charge for all
financial/operating reports. This charge is per-firm and is not related to the number of team
members. Each quarter's charge is based on the previous quarter's actual page counts.
• Inventory charges for finished goods are recorded under the heading "Inventory Charges" on
the "Corporate P&L Statement." This inventory charge is equal to 3% per quarter for owned
distribution centers (such as your distribution center in market region 1, adjacent to your firm's
manufacturing plant) based on the value of inventory as recorded on your firm's balance
sheet. Inventory charges are levied on the average of beginning-of-quarter and end-of-
quarter inventory values, and include all costs related to storage, handling, waster, and
insurance.
• "Non-Operating Income" derives either from interest earned on "Marketable Securities" (from
the previous quarter's "Balance Sheet") or from interest paid on "Loans" (from the previous
quarter's "Balance Sheet").
• "Order Processing" records order processing costs of $4/unit in all regions.
• "Patent Royalties" include patent royalties that your firm pays to other firms, as well as patent
royalties received from other firms.
• "Plant Capacity FC" represents the costs associated with production "shifts" in your
manufacturing plant. These costs cover all depreciation and maintenance associated with
your plant capacity. These costs are allocated equally among your products.
• "Production FC" includes the fixed costs associated with production orders. Fixed costs for
production are included in the "Production FC" line item.
• "Research Studies" reflects the total costs associated with last quarter's research study
requests. The current quarter's research studies are executed after the current quarter's
financial reports are prepared so research study billings are lagged a quarter.
• "Taxes" represents the corporate taxes payable in the market region in which your firm has its
manufacturing plant. Your manufacturing plant is located in market region 1, which has a
corporate tax rate of 50%.
• "Total Fixed Costs" is the sum of all fixed costs. "Total Fixed Costs" does not sum correctly
down and across since some fixed costs aren’t allocated to specific products.
• "Unfilled Handling" costs are the unfilled orders handling costs.
On the "Balance Sheet":
• "Cash" represents your cash balance. Cash in excess of 10% of revenues is automatically
invested in short-term "Marketable Securities" which earn 1.5% per quarter in "Non-Operating
Income" on the "Corporate P&L Statement" in the following quarter. If cash falls below 5% of
revenues, a loan is automatically arranged to increase cash to 5% of revenues. You pay
interest of 3% per quarter on "Loans" and this interest payment is recorded as "Non-Operating
Income" (a negative value of "Non-Operating Income") in the following quarter's "Corporate
P&L Statement."
• "Corporate Capitalization" is the Ldollar-value of the original capital invested by your
shareholders to start your firm.
• "Dividends" are cash payments to shareholders. In any quarter in which "Net Income" is
positive, 30% of the "Net Income" is allocated to "Dividends."
• "Plant Investment" represents the Ldollar-value of your firm's investment in a manufacturing
plant to produce set-top box products. The normal per-unit production charges that you pay
for producing set-top boxes includes a component to cover the maintenance and depreciation

RG Chapman PhD, "LINKS Enterprise Management Simulation" Page 42
of your plant. Thus, your "Plant Investment" value will also be the same through time.
Sources and uses of cash are reported in your
firm's "Cash Flow Analysis Report." The most
important source of cash within any on-going
business is revenues derived from sales, but
you have lots of costs to pay to earn those
revenues. Recent experience with "dot.com"
businesses notwithstanding, margin
management (revenues less costs) is still the
fundamental management challenge for all
for-profit businesses.
Cash sources include profits from operations
and reductions in inventory holdings. Uses of
cash include funding operating losses,
increases in inventory holdings, and payment
of dividends. Obviously, you require cash to
run your set-top box business. You can't run
out of cash within LINKS. As necessary,
loans are automatically issued to bring your
cash requirement up to minimum acceptable.
Of course, you do have to pay interest on loans. Each quarter in which your firm is profitable,
corporate policy is to allocate 30% of net income to dividends.
The "Forecasting Accuracy Report" provides details of the forecasting accuracy associated with
each of your forecasts.
The "Set-Top Box Industry Bulletin" provides current-quarter industry-related information.
Information reported in the "Bulletin" includes things that an actual manager in the set-top box
industry could easily observe without additional cost or with nominal effort during the course of
events that comprise a normal quarter's work.
The following pages provide samples of the standard LINKS financial
and operating reports. In addition to these financial and operating
reports, you'll receive the results of any research studies that you order
after the last page of your financial and operating reports.
These samples are provided to familiarize you with the style and format of the reports that are
provided to your firm after each LINKS round. The data reported in these sample reports are only
illustrative of reports formatting. These data aren’t specific to your particular LINKS industry.
Please do not interpret these samples as suggested guidelines or benchmarks for good decisions
and performance within LINKS.
If you’d like some further background on interpreting LINKS financial statements, please access
Tutorial #1 (“P&L Statements”) on the LINKS website and spend 45 minutes or so working
through it prior to (or close to) the beginning of your LINKS event.
FAQ
"Are costs expensed at the beginning of the
quarter or the end of the quarter? The answer
influences our spending decisions, since we
obviously don't want to spend money before we
have it." Assume that all revenues and costs
happen uniformly throughout the quarter. That
is, with a 90-day quarter, about 1/90 of the
quarter's revenues and costs are attributable to
each day's operations. Thus, you do have
revenue coming in regularly throughout the
quarter to pay for your various within-quarter
operating costs. There's no need to worry about
within-quarter cash flow issues with regard to
covering your operating costs and within-quarter
spending. Also, note that you do have access to
loans, as necessary, to cover shortages in cash.

RG Chapman PhD, "LINKS Enterprise Management Simulation" Page 43
***************************************************************************** FIRM 3: Global Set-Top Box Pty. INDUSTRY EMF PERFORMANCE EVALUATION REPORT, QUARTER 8 PAGE 1
*****************************************************************************
For Your Information
You receive the LINKS scorecard (shown above) automatically each quarter as the first page
of your financial and operating reports. This scorecard provides comparatives to assess
how your firm's data compares to the industry averages and industry bests on every Key
Performance Indicator (KPI).
Historical plots of all KPIs are provided in your firm’s supplementary results Excel
spreadsheet (“KPIcharts” worksheet), accessible within the LINKS Simulation Database on
the LINKS website. Data from the past six quarters are displayed, to the extent available in
your industry's historical archives, to create quarter-by-quarter plots for each of the LINKS
performance evaluation metrics (KPIs) compared to the relevant quarter-specific industry
best, industry average, and industry worst for your LINKS industry.

RG Chapman PhD, "LINKS Enterprise Management Simulation" Page 44
***************************************************************************** FIRM 4: Set-Top Boxes International INDUSTRY ABC CORPORATE P&L STATEMENT, QUARTER 18 PAGE 4
***************************************************************************** All Products Product 4-1 Product 4-2 ------------ ----------- ----------- Sales Volume 120,426 78,745 41,681 Unfilled Orders 0 0 0 Price 368 320 460 Revenues 44,371,660 25,198,400 19,173,260 - Product Costs 21,627,177 9,331,282 12,295,895 - Order Processing 481,704 314,980 166,724 - Replacement Parts 279,597 0 279,597 - Transportation Costs 2,930,246 - Duties & Tariffs 2,377,577 2,027,058 350,519
------------ ----------- ----------- Gross Margin 16,675,359 13,525,080 6,080,525 Fixed & Other Costs: Administrative O/H 1,200,000 720,000 480,000 Consulting Fees 0 Corporate O/H 1,500,000 Disposal Sales 0 Distribution FC 25,000 Emergency Production 40,000 Forecast Inaccuracy 224,033 131,696 92,337 Information Technology 16,000 Introductions 0 Inventory Charges 259,257 Marketing 1,800,000 1,080,000 720,000 Plant Capacity FC 900,000 Price Changes 0 0 0
Production FC 135,000 Reconfiguration 0 Research Studies 0 Service Outsourcing 1,150,601 726,235 424,366 Unfilled Handling 0 Total Fixed & Other 7,249,891 2,657,931 1,716,703 ------------ ----------- ----------- Operating Income 9,425,468 10,867,149 4,363,822 ------------ ----------- ----------- Non-Operating Income 0 Patent Royalties 0 Taxes -4,712,734 ============ Net Income 4,712,734 ============

RG Chapman PhD, "LINKS Enterprise Management Simulation" Page 45
***************************************************************************** FIRM 4: Set-Top Boxes International INDUSTRY ABC HISTORICAL CORPORATE P&L STATEMENT, QUARTER 18 PAGE 5
***************************************************************************** Previous (Quarter 17) Current (Quarter 18) --------------------- --------------------- Sales Volume 88,374 120,426 Unfilled Orders 0 0 Price 367 368 Revenues 32,503,200 100.0% 44,371,660 100.0% - Product Costs 15,796,970 48.6% 21,627,177 48.7% - Order Processing 353,496 1.1% 481,704 1.1% - Replacement Parts 271,941 0.8% 279,597 0.6% - Transportation Costs 2,446,827 7.5% 2,930,246 6.6% - Duties & Tariffs 1,709,741 5.3% 2,377,577 5.4%
------------ ------ ------------ ------ Gross Margin 11,924,225 36.7% 16,675,359 37.6% Fixed & Other Costs: Administrative O/H 1,200,000 3.7% 1,200,000 2.7% Consulting Fees 0 0.0% 0 0.0% Corporate O/H 1,500,000 4.6% 1,500,000 3.4% Disposal Sales 0 0.0% 0 0.0% Distribution FC 25,000 0.1% 25,000 0.1% Emergency Production 40,000 0.1% 40,000 0.1% Forecast Inaccuracy 216,924 0.7% 224,033 0.5% Information Technology 16,000 0.0% 16,000 0.0% Introductions 0 0.0% 0 0.0% Inventory Charges 270,306 0.8% 259,257 0.6% Marketing 1,800,000 5.5% 1,800,000 4.1% Plant Capacity FC 900,000 2.8% 900,000 2.0% Price Changes 0 0.0% 0 0.0%
Production FC 135,000 0.4% 135,000 0.3% Reconfiguration 0 0.0% 0 0.0% Research Studies 0 0.0% 0 0.0% Service Outsourcing 1,039,422 3.2% 1,150,601 2.6% Unfilled Handling 0 0.0% 0 0.0% Total Fixed & Other 7,142,652 22.0% 7,249,891 16.3% ------------ ------ ------------ ------ Operating Income 4,781,573 14.7% 9,425,468 21.2% ------------ ------ ------------ ------ Non-Operating Income 3,240 0.0% 0 0.0% Patent Royalties 0 0.0% 0 0.0% Taxes -2,392,406 -7.4% -4,712,734 -10.6% ============ ====== ============ ====== Net Income 2,392,407 7.4% 4,712,734 10.6% ============ ====== ============ ======
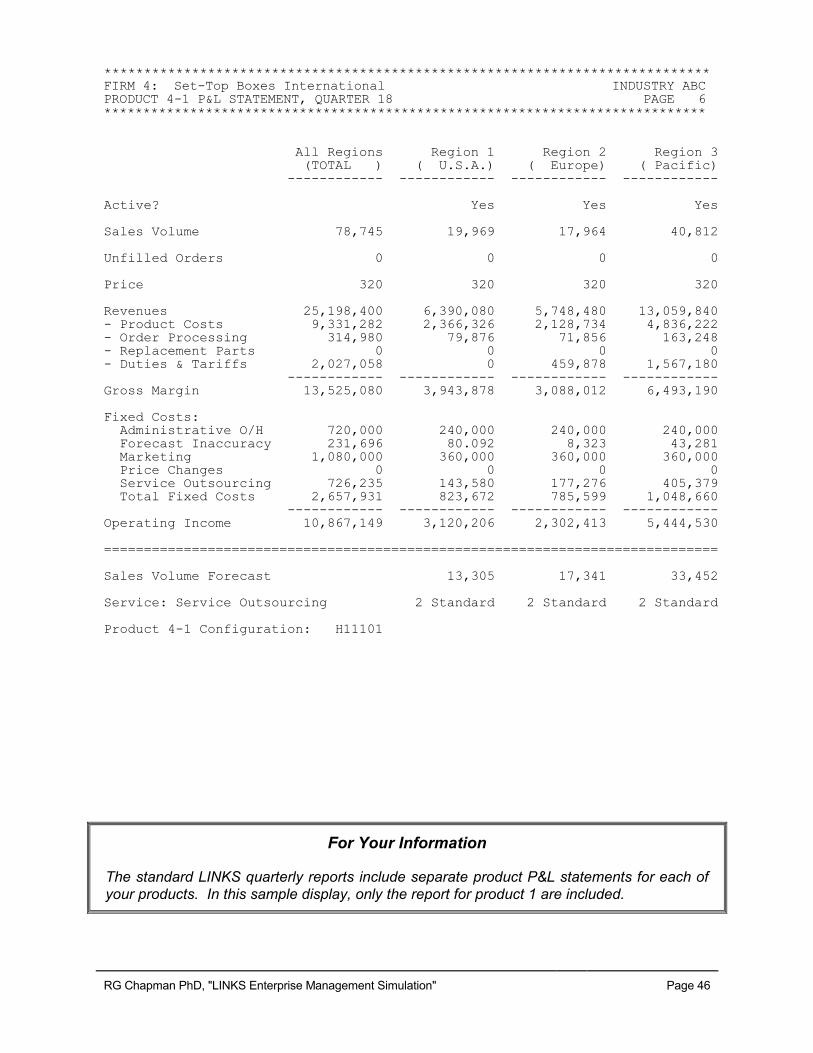
RG Chapman PhD, "LINKS Enterprise Management Simulation" Page 46
**************************************************************************** FIRM 4: Set-Top Boxes International INDUSTRY ABC PRODUCT 4-1 P&L STATEMENT, QUARTER 18 PAGE 6
***************************************************************************** All Regions Region 1 Region 2 Region 3 (TOTAL ) ( U.S.A.) ( Europe) ( Pacific) ------------ ------------ ------------ ------------ Active? Yes Yes Yes Sales Volume 78,745 19,969 17,964 40,812 Unfilled Orders 0 0 0 0 Price 320 320 320 320 Revenues 25,198,400 6,390,080 5,748,480 13,059,840 - Product Costs 9,331,282 2,366,326 2,128,734 4,836,222 - Order Processing 314,980 79,876 71,856 163,248
- Replacement Parts 0 0 0 0 - Duties & Tariffs 2,027,058 0 459,878 1,567,180 ------------ ------------ ------------ ------------ Gross Margin 13,525,080 3,943,878 3,088,012 6,493,190 Fixed Costs: Administrative O/H 720,000 240,000 240,000 240,000 Forecast Inaccuracy 231,696 80.092 8,323 43,281 Marketing 1,080,000 360,000 360,000 360,000 Price Changes 0 0 0 0 Service Outsourcing 726,235 143,580 177,276 405,379 Total Fixed Costs 2,657,931 823,672 785,599 1,048,660 ------------ ------------ ------------ ------------ Operating Income 10,867,149 3,120,206 2,302,413 5,444,530 =============================================================================
Sales Volume Forecast 13,305 17,341 33,452 Service: Service Outsourcing 2 Standard 2 Standard 2 Standard Product 4-1 Configuration: H11101
For Your Information
The standard LINKS quarterly reports include separate product P&L statements for each of
your products. In this sample display, only the report for product 1 are included.

RG Chapman PhD, "LINKS Enterprise Management Simulation" Page 47
***************************************************************************** FIRM 8: ?????????????????????????????????????????????????? INDUSTRY ABC
BALANCE SHEET, QUARTER 14 PAGE 8 ***************************************************************************** ASSETS ------ Cash 4,437,166 Marketable Securities 5,096,102 Finished Goods Inventory: Plant & DC1: Product 8-1 ( 3,049 units @ 118.50/unit) 361,306 Product 8-2 ( 1,002 units @ 295.00/unit) 295,590 Plant Investment 100,000,000 Total Assets 110,190,164 LIABILITIES AND EQUITIES ------------------------ Corporate Capitalization 100,000,000 Dividends, Current Quarter -1,413,820 Dividends, Cumulative Prior To This Quarter -2,953,391
Loans 0 Retained Earnings, Current Quarter 4,712,734 Retained Earnings, Cumulative Prior To This Quarter 9,844,641 Total Liabilities and Equities 110,190,164

RG Chapman PhD, "LINKS Enterprise Management Simulation" Page 48
***************************************************************************** FIRM 4: ?????????????????????????????????????????????????? INDUSTRY DEF
CASH FLOW ANALYSIS REPORT, QUARTER 4 PAGE 9 ***************************************************************************** Starting "Cash" Balance (Final "Cash" Balance, Quarter 3) 3,227,176 + Marketable Securities (Converted To "Cash" In Quarter 3) 0 - "Loans" (Liquidated During Quarter 3) 0 + "Finished Goods Inventory" Changes: Product 4-1 (From 1,397,589 To 361,306) 1,036,283 Product 4-2 (From 2,266,485 To 295,590) 1,970,895 + "Plant Investment" Changes 0 + "Net Income" 4,712,734 = Preliminary "Cash" Balance 10,947,088 - "Dividends" (Paid at End of Quarter 4) -1,413,820 = Actual "Cash" Balance (End of Quarter 4) 9,533,268 - Operating "Cash" Excess (To "Marketable Securities") -5,096,102 + Operating "Cash" Deficit (From "Loans") 0 = Final "Cash" Balance (End of Quarter 4) 4,437,166
Notes: (1) "Marketable Securities" and "Loans" refer to the values on last quarter's balance sheet. (2) Investment changes can be positive, negative, or zero. A positive (negative) {zero}. Investment change corresponds to an increase (a decrease) {no change} in the dollar value of the investment from last quarter to this quarter which leads to a decrease (an increase) (no change) in current-quarter "Cash" balance. (3) At most, one of Operating "Cash" Excess and Operating "Cash" Deficit will be non-zero; it is possible for both to be zero. Recall that "Cash" must be between 5.0% and 10.0% of current-quarter sales revenues. Excess "Cash" (above 10.0% of revenues) is invested in "Marketable Securities"; shortfalls in "Cash" (below 5.0% of revenues) result in "Loans."

RG Chapman PhD, "LINKS Enterprise Management Simulation" Page 49
***************************************************************************** FIRM 2: Global Set-Top Box Pty. INDUSTRY FGH PRODUCT COST REPORT, QUARTER 8 PAGE 10
***************************************************************************** ORIGINAL (PLANT) Product Product MANUFACTURING COST 2-1 2-2 ------------------ ------- ------- Alpha 12.00 12.00 Beta 24.00 28.00 Bandwidth 14.00 118.00 Warranty 11.00 56.00 Packaging 14.00 14.00 Gamma 17.00 17.00 Epsilon 24.00 24.00 Labor Cost 30.00 30.00 Production Cost 20.00 20.00 ------- ------- 166.00 319.00
***************************************************************************** FIRM 2: Global Set-Top Box Pty. INDUSTRY FGH FINISHED GOODS INVENTORY REPORT, QUARTER 8 PAGE 11 ***************************************************************************** Product Product 2-1 2-2 ------- ------- Beginning Inventory 15,353 42,733 + Regular Production 75,000 25,000 + Emergency Production 153 17,483 = Available Inventory 90,506 85,216
- Sales, Region 1 -34,793 -21,058 - Sales, Other Regions -55,713 -64,158 = Ending Inventory 0 0 ***************************************************************************** FIRM 2: Global Set-Top Box Pty. INDUSTRY FGH SERVICE CENTER OPERATIONS REPORT, QUARTER 8 PAGE 12 ***************************************************************************** All Region Region Region Regions 1 2 3 ------- ------- ------- -------
PRODUCT 2-1 Calls 86,806 32,515 26,244 28,047 CSR Cost/Call 16.41 16.00 12.00 21.00 PRODUCT 2-2 Calls 55,858 17,869 62 37,927 CSR Cost/Call 19.39 16.00 12.00 21.00

RG Chapman PhD, "LINKS Enterprise Management Simulation" Page 50
***************************************************************************** FIRM 5: XYZ Limited INDUSTRY MNO TRANSPORTATION COST REPORT, QUARTER 8 PAGE 13
***************************************************************************** ============ Surface Air Emergency SUB-ASSEMBLY ------------- ------------- ------------- COMPONENTS Cost Volume Cost Volume Cost Volume Total Cost ============ ----- ------- ----- ------- ----- ------- ---------- Plant/DC1: Gamma 4.00 0 4.00 0 4.00 108,436 433,744 Epsilon 6.00 0 6.00 0 6.00 107,946 647,676 CUSTOMER SHIPMENTS Region 1 ( 40,264 units @ $ 4.00/unit) 161,056 Region 2 ( 26,601 units @ $18.00/unit) 478,818 Region 3 ( 31,278 units @ $26.00/unit) 813,228 REPLACEMENT PARTS SHIPMENTS TO CUSTOMERS Region 1 ( 10,125 units @ $ 2.00/unit) 20,250 Region 2 ( 2,353 units @ $ 9.00/unit) 21,177
TOTAL TRANSPORTATION COSTS 2,575,949 ***************************************************************************** FIRM 6: ABC Corporation INDUSTRY PQR OTHER DECISION VARIABLES REPORT, QUARTER 18 PAGE 14 ***************************************************************************** ============= MANUFACTURING 6-1 6-2 ============= ------- -------
Production 70,000 35,000 Emergency Production Limit 10,000 10,000
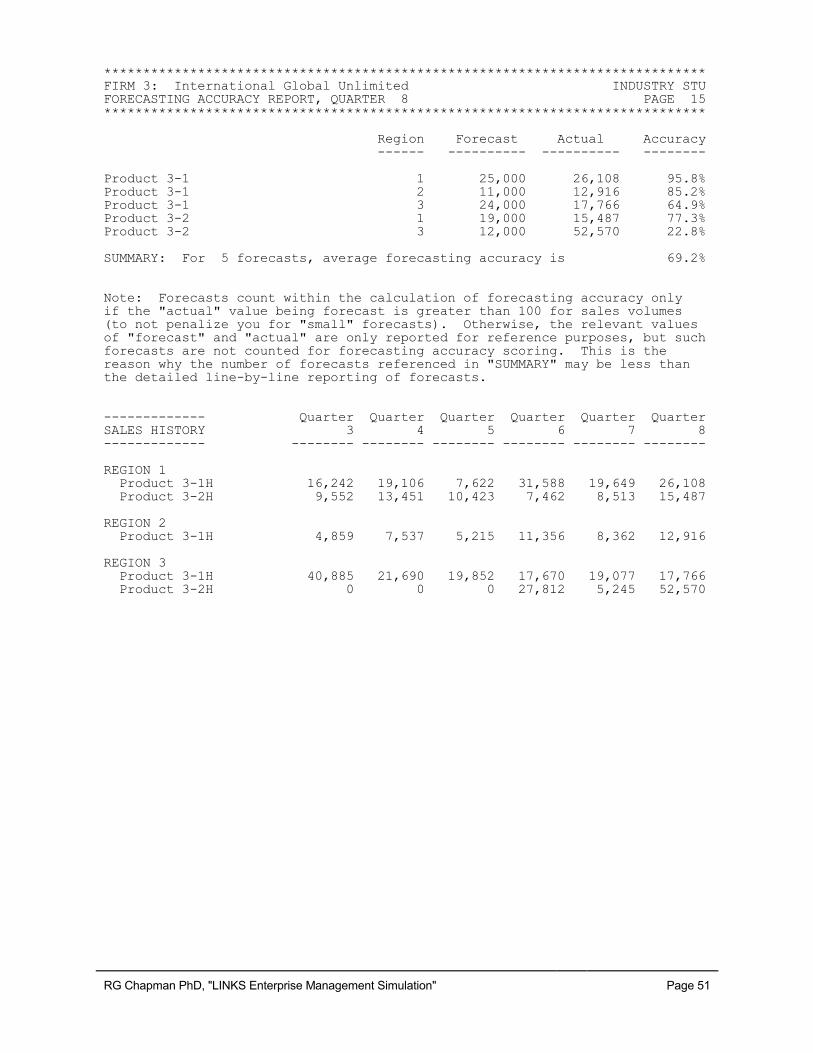
RG Chapman PhD, "LINKS Enterprise Management Simulation" Page 51
***************************************************************************** FIRM 3: International Global Unlimited INDUSTRY STU FORECASTING ACCURACY REPORT, QUARTER 8 PAGE 15
***************************************************************************** Region Forecast Actual Accuracy ------ ---------- ---------- -------- Product 3-1 1 25,000 26,108 95.8% Product 3-1 2 11,000 12,916 85.2% Product 3-1 3 24,000 17,766 64.9% Product 3-2 1 19,000 15,487 77.3% Product 3-2 3 12,000 52,570 22.8% SUMMARY: For 5 forecasts, average forecasting accuracy is 69.2% Note: Forecasts count within the calculation of forecasting accuracy only if the "actual" value being forecast is greater than 100 for sales volumes (to not penalize you for "small" forecasts). Otherwise, the relevant values of "forecast" and "actual" are only reported for reference purposes, but such
forecasts are not counted for forecasting accuracy scoring. This is the reason why the number of forecasts referenced in "SUMMARY" may be less than the detailed line-by-line reporting of forecasts. ------------- Quarter Quarter Quarter Quarter Quarter Quarter SALES HISTORY 3 4 5 6 7 8 ------------- -------- -------- -------- -------- -------- -------- REGION 1 Product 3-1H 16,242 19,106 7,622 31,588 19,649 26,108 Product 3-2H 9,552 13,451 10,423 7,462 8,513 15,487 REGION 2 Product 3-1H 4,859 7,537 5,215 11,356 8,362 12,916 REGION 3
Product 3-1H 40,885 21,690 19,852 17,670 19,077 17,766 Product 3-2H 0 0 0 27,812 5,245 52,570

RG Chapman PhD, "LINKS Enterprise Management Simulation" Page 52
***************************************************************************** FIRM 2: Global Set-Top Box Pty. INDUSTRY EMS SET-TOP BOX INDUSTRY BULLETIN, QUARTER 8 PAGE 15
***************************************************************************** Welcome to the quarter 8 issue of the Set-Top Box Industry Bulletin. Notable set-top box industry developments are highlighted in the Bulletin. INDUSTRY NEWS HEADLINES Total set-top box industry EMS profits were 5,867,796 this quarter. Firm 2 leads industry EMS in market share (29.9%). Firm 3 has the second-highest market share in industry EMS (27.9%). Industry EMS inventory investments decreased from 34,702,490 to 34,575,552 this quarter. Total industry EMS research study spending was 1,023,500 this quarter.
PRODUCT LAUNCHES AND "UNLAUNCHES" No products were introduced this quarter. Product 1-1 has been dropped from region 3. Product 4-1 has been dropped from region 2. Product 4-2 has been dropped from region 2. RECONFIGURATIONS No products were reconfigured this quarter.

RG Chapman PhD, "LINKS Enterprise Management Simulation" Page 53
Chapter 6: Performance Evaluation "If you're riding ahead of the herd, take a look back every now
and then to make sure it's still there." – Cowboy philosophy
This chapter describes the LINKS quantitative performance evaluation mechanism. Since there
are many facets of evaluation to consider in a business, a multi-dimensional scorecard is used.
As you’ll note, current performance and change in performance are considered in this multi-
dimensional quantitative performance evaluation scorecard.
Many things matter in evaluating the performance of a business. It's hard to argue with
profitability-like measures as the correct things to examine to assess the long-run performance of
a business. However, in a shorter-run perspective, other things matter too. These "other things"
are leading indicators of future profitability and root causes of profitability.
Multiple measures of performance evaluation obviously lead to conflicts. Short-run and long-run
trade-offs are obvious. For example, by reducing inventories and product support spending
(marketing and service spending), current costs will decrease and profits will tend to increase.
However, in the long-run, these might be exactly the wrong things to do to maximize long-run
profitability. Subtler trade-offs arise in potentially conflicting performance measures that move in
opposite directions. For example, inventory reductions save costs on the inventory and
manufacturing fronts but may lead to shortages to meet the levels of customer demand in the
distribution centers. Balancing all of these conflicting trade-offs is the challenge for management.
The various performance measures within LINKS are designed to monitor all key elements of
performance assessment: efficiency (input usage); effectiveness (output quality); productivity
(conversion of inputs into output); firm-wide profitability; and, external performance (e.g., change
in market share and customer satisfaction perceptions).
The LINKS scorecard is perhaps described more aptly as a boardroom-level scorecard. It
focuses on top-line boardroom kinds of financial, operational, and customer performance
measures and sub-measures. The LINKS scorecard includes the measures and weights
described in Exhibits 4-6. Each firm in your set-top box industry submits their raw data to the Set-
Top Box Trade Association, which provides your firm's personal scorecard every quarter.
The LINKS scorecard is based on a ranking of performance on each sub-measure. These rank-
order comparisons across all competing firms within your industry avoid the undue influence of
particularly extreme values of individual sub-measures. This LINKS scorecard is a within-industry
performance evaluation system. Comparisons across industries are problematic due to variations
in environmental and competitive milieu.
Your firm receives weighted points for each competitor for whom your performance on a sub-
measure is better. For some of the sub-measures, "better" means a lower sub-measure value
(e.g., the "Unplanned Production" is a lower-is-better sub-measure). For example, if your firm's
ratio of "Net Profits" to "Revenues" is better than three other firms' ratios, your firm receives 9
points. (Of course, the top-performing firm on "Net Income" to "Revenues" ratio in a 6-firm
industry would receive 15 points.) In general, the maximum available points on any sub-measure
are W*(N-1) where "W" is the sub-measure's weight and "N" is the number of firms in the industry.

RG Chapman PhD, "LINKS Enterprise Management Simulation" Page 54
Points accumulate each quarter throughout the LINKS exercise.
To avoid an overemphasis on minor quarter-to-quarter variations in the calculation of the ranking
of firms on the performance sub-measures in the LINKS scorecard, minor differences in the sub-
measures are treated as ties in the calculation of ranking points. The thresholds for differences to
be treated as meaningful are listed in Exhibits 4-6 for each sub-measure. For example,
differences of 0.2% or less for "Ratio of Net Income to Revenues" are considered to be
statistically insignificant, and firms within 0.2% of each other would be treated as being tied.
Thus, two firms with ratios of Net Income to Revenues of 4.5% and 4.6% would be treated as
being tied in the calculation of ranking position and associated points received in any quarter.
You receive the LINKS scorecard each quarter as the first page of your financial and operating
reports. This scorecard provides comparatives to assess how your firm's data compares to the
industry averages and industry bests on every KPI. In addition, historical plots of past
performance are provided. Data from the past six quarters are used, to the extent available in
your industry's historical archives, to create quarter-by-quarter plots for each of the LINKS
performance evaluation metrics. For each metric and quarter, the range of values the range of
values across all firms in your LINKS industry is shown and your firm's position in these ranges is
identified.
Exhibit 4: Scorecard Financial Measures
Sub-Measures Weight Sub-Measure Details
Ratio of Net Income
to Revenues
3 Current profitability is the best overall signal of business
performance, hence its high weight. Firms are "tied" if their
scores are within 0.2% of each other.
Change in Ratio of
Net Income to
Revenues
1 Improvement in profitability is important but less important
than current profitability. Firms are "tied" if their scores are
within 0.2% of each other.
Return on Assets 2 Return means "Net Income" (from the "Corporate P&L
Statement") and investment equals "Total Assets" (from the
"Balance Sheet"). This ratio is expressed in annualized terms.
Firms are "tied" if their scores are within 0.5% of each other.
Net Asset Turns 1 Ratio of revenues to net assets. Net assets are assets minus
loans. This measure reflects the desirability of higher
revenues relative to the assets deployed to yield these
revenues. This ratio is expressed in annualized terms. Firms
are "tied" if their scores are within 0.2 of each other.
Notes: Positive "weights" are associated with sub-measures where "more is better" and negative "weights" are
associated with sub-measures where "less is better." "Change" measures are based on quarter-to-qjuarter changes.

RG Chapman PhD, "LINKS Enterprise Management Simulation" Page 55
Exhibit 5: Scorecard Operational Measures
Sub-Measures Weight Sub-Measure Details
Inventory Turnover 2 Ratio of product costs to average inventory value (average of the
current and the previous quarters). If average inventory value is
zero, then Inventory Turnover is defined to be 100. Firms are
"tied" if their scores are within 0.2 of each other.
Fill Rate 1 The percentage of orders that are filled. "Unfilled orders" occur
when available inventory and emergency production is less than
orders in a quarter. Firms are "tied" if their scores are within 0.5%
of each other.
Unplanned
Production
-1 The percentage of total production (postponed, regular, and
emergency) that is emergency production. Firms are "tied" if their
scores are within 0.5% of each other.
Forecasting
Accuracy
2 Forecasting accuracy is a relatively pure signal of management
skill and expertise (in this case, in the area of understanding
customers and customer demand generating forces). Firms are
"tied" if their scores are within 0.5% of each other.
Ratio of (Marketing +
Service Spending) to
Revenues
-1 Service spending is service outsourcing costs. Marketing
spending is an easy way to boost short-run sales volume without
necessarily contributing to long-run profitability. Relative to
revenues, spending less in marketing and service is desirable.
Firms are "tied" if their scores are within 0.2% of each other.
Exhibit 6: Scorecard Customer Measures
Sub-Measures Weight Sub-Measure Details
Change in Market
Share
1 Change in market share is an overall measure of customer
reaction to the firm's offerings. ("Market share" equals customer
purchases in all regions.) Firms are "tied" if their scores are
within 0.1% of each other.
Customer
Satisfaction
2 Customer satisfaction measures the performance of the product
from the perspective of purchasers. Thus, it's a clear measure of
customer performance and a long-run leading indicator of repeat
purchasing behavior and customer retention. Average customer
satisfaction across all products and regions is used here. Firms
are "tied" if their scores are within 0.5% of each other.
Notes: Positive "weights" are associated with sub-measures where "more is better" and negative "weights" are
associated with sub-measures where "less is better." "Change" measures are based on quarter-to-quarter changes.

RG Chapman PhD, "LINKS Enterprise Management Simulation" Page 56
Appendix: Web-Based LINKS Access
\LINKS has no software to download/upload/install. Point your favorite web browser at the LINKS
Simulations website to interact with LINKS
http://www.LINKS-simulations.com
and then access the LINKS Simulation Database using your firm’s case-sensitive passcode. You'll be e-mailed your LINKS firm's passcode just before your LINKS event begins.
LINKS uses e-mail to communicate with all LINKS participants. Please ensure that your
preferred e-mail software is configured to receive e-mail messages from domains ending with:
@ChapmanRG.com @LINKS-simulations.com @LINKS-simulations.info
Your may wish to consult your personal information technology advisor to ensure that your e-
mail software is configured appropriately to receive LINKS e-mail from these domains.
While the LINKS Simulation Database works with all web browsers, Microsoft’s Internet Explorer
is recommended. LINKS website access requires a Java-enabled browser.
Output Retrieval After a LINKS Round: You'll be advised via e-mail when LINKS game-run
results are available on the LINKS Simulations website. Links within the LINKS Simulation
Database permit you to access your Word doc and Excel results after a game run.
Inputs For the Next LINKS Round: When you're ready to input decisions for the next LINKS
round, access the LINKS Simulation Database and make your input changes. o While any number of members of a LINKS firm may access the LINKS Simulation
Database simultaneously to “browse,” only one team member at a time can input
new decisions. If multiple members of a LINKS firm attempt to make inputs
simultaneously, problems can arise; all decision inputs might not be saved successfully on
the LINKS server with simultaneous inputs from multiple members of a LINKS firm.
o You may make some inputs now and others later. Only your final LINKS inputs at the input
submission deadline for your LINKS industry are included in the next LINKS round.
o Within the LINKS Simulation Database, current decision values are displayed on the input
screens. You only need to make changes. All LINKS decision variables are "standing
orders" and remain in effect until changed. However, you must input specific instructions
each LINKS round for ordering research studies. Otherwise, research studies will be
executed only once since "standing orders" don't exist for research studies.
o Inputs are checked for input integrity, including upper and lower bounds on permissible
numeric inputs. Invalid entries result in an error message reporting valid minimums and
maximums. And, informative messages are reported at the bottom of each web screen.
Save Input Changes on a LINKS input
web screen before moving to another input
screen in the LINKS Simulation Database.
Review reminder, warning, and
and error messages reported at the bottom of the regenerated web screen after the
inputs are processed by the LINKS web server.
Decision Inputs Audit: To provide
decision inputs auditing support, the
LINKS Simulation Database includes

RG Chapman PhD, "LINKS Enterprise Management Simulation" Page 57
a Decision Input Audit.
Accessible on the initial login and Exit web screens in the LINKS Simulation Database,
the Decision Inputs Audit checks a firm’s current decision inputs for potential problems
and inconsistencies. This LINKS Simulation Database audit function is not an audit of
the individual quality of each decision input (e.g., there’s no attempt to assess whether a
price of $345 is good or bad). But, possible problems are flagged for attention. For
example, forecasts that haven’t been changed since the last decision round are noted in
the audit display because forecasts are normally updated every decision round.
Accessing LINKS Results Files Via a Browser on a Public Computer: Web browsers leave
“tracks” to previously accessed web-pages in browser history files. If you access LINKS results
files on a public computer (e.g., in a public PC lab), others could access your results too via the
browser history.
Instructions for cleaning the cache in Internet Explorer follow. Other web browsers have
similar browser-cache cleaning protocols.
If you access LINKS results files on a public computer, follow these steps to clear
Internet Explorer’s browser history (cache):
1. Exit/close Internet Explorer after accessing your LINKS results file.
2. Re-start Internet Explorer.
a. Click on “Tools” and then “Internet Options.”
b. On the “Internet Options” screen, look for the “Browsing History” sub-section. Check
“Delete browsing history on exit” (it may already be checked).
c. Click the “Delete” button in the “Browsing History” sub-section.
d. Check the “History” box on the “Delete Browsing History” screen (it may already be
check).
e. Click the “Delete” button at the bottom of the “Delete Browsing History” screen.
f. Wait until the “Internet Options” screen re-appears.
g. Click the “OK” button.
3. Exit/close Internet Explorer.
These steps clear the browsing history from Internet Explorer on any computer and preserve
the security and privacy of your LINKS results files.