linkurious: using graphs to fight financial crime -...
TRANSCRIPT

Linkurious: using graphs to fight financial crime.
SAS founded in 2013 in Paris | http://linkurio.us | @linkurious

Agenda.
▪ Introduction
▪ Financial crime and graphs
▪ Graph analytics and graph visualization
▪ Demo
▪ Demo technical overview (ogma)

Introduction.
Graph visualization startup.
200+ customers.
AML, intelligence, cyber-security, medical research.
Ogma.js, graph visualization library helps build interactive graph interfaces.

Panama PapersPanama Papers
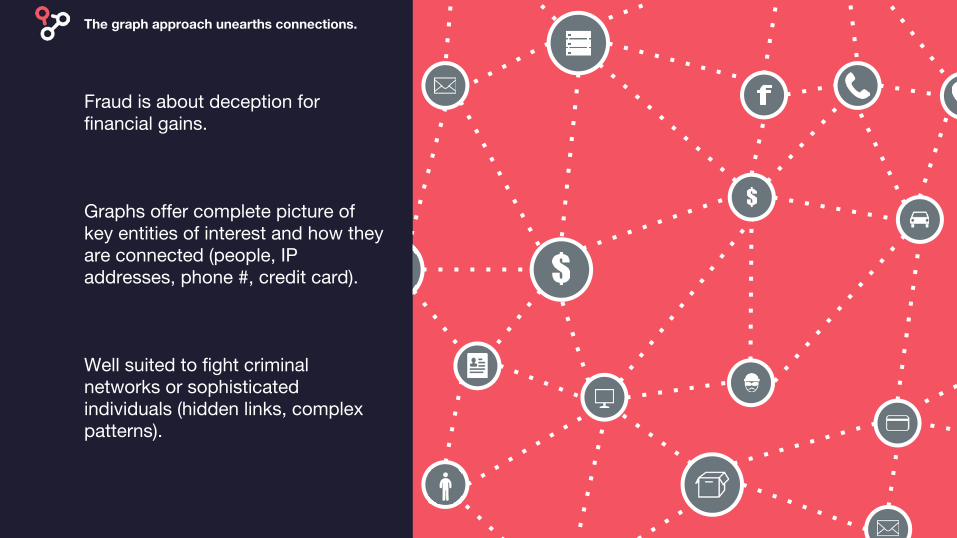
Fraud is about deception for financial gains.
Graphs offer complete picture of key entities of interest and how they are connected (people, IP addresses, phone #, credit card).
Well suited to fight criminal networks or sophisticated individuals (hidden links, complex patterns).
The graph approach unearths connections.

AML.
Typical data.Payments, customer data, third party data (blacklists, social media).
Typical questions.Are my customers linked to known criminals? Are there suspicious money flows (smurfing)?
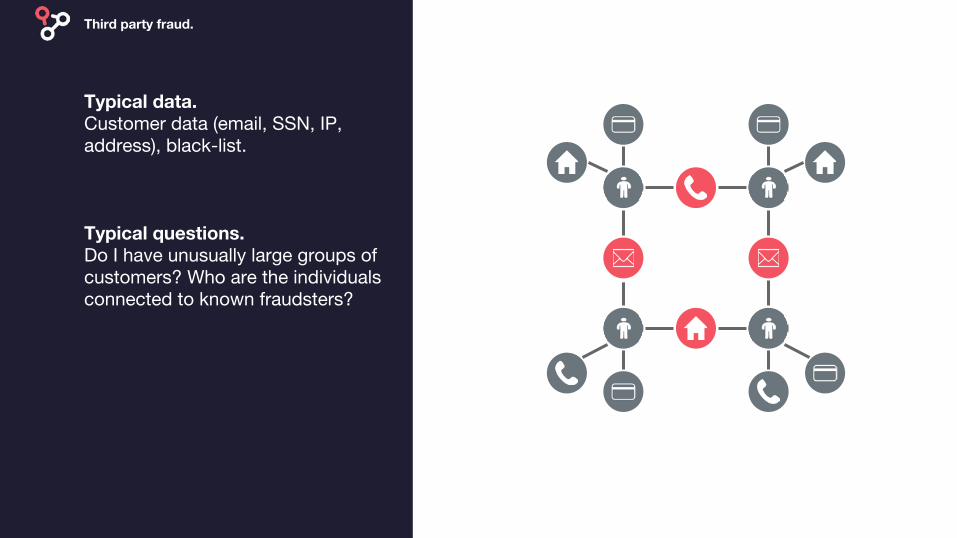
Third party fraud.
Typical data.Customer data (email, SSN, IP, address), black-list.
Typical questions.Do I have unusually large groups of customers? Who are the individuals connected to known fraudsters?

Internal fraud (conflict of interest).
Typical data.Employee master list, vendor master list, third party data (social media, company registries).
Typical questions.Are my employees linked to current vendors?

Why isn't everyone doing it?
RDMBS are not optimized for graph workloads (complexity and performances).
New type of data, new type of questions (graph pattern matching, impact analysis, etc).
Oracle Big Data Spatial and Graph helps store and query large graphs.
Traditional data analysis
Graph analyticsData source
Analytics Analytic complexity
Unstructured, rapidly evolving data
Structured, slowly changing data
Static analysis

Why graph visualization?
Better understand the relationships in your data.
Review alerts (false positives), advanced investigation (collect proofs, identify accomplices or beneficiaries).
Faster and more effective analysis.

Ogma and Oracle Big Data Spatial and Graph.
Ogma is a JS graph visualization library.
Visualize and interact with large graphs (>100 000 nodes).
Customized style (icons, colors, font, size, etc) and interactions (geo, filters, hover, select, drag, group, etc).
Compatible with Oracle Big Data Spatial and Graph.

Demo: Oracle + Ogma.

Ogma / Oracle integration tech overview.
Embed graph visualizations tailored for your users into your web applications.
Connect to Oracle BDSG with Ogma’s plugin and import graph data into your web application.
Leverages Oracle BDSG Blueprints API.

Add extra layer of protection (discovery of new cases, enhance review of existing cases).
Ogma helps build interactive graph UI that empowers people.
Graph-powered financial investigations.
