linux on system z performance hints and tips ® system z tivoli* ... linux on system z performance...
TRANSCRIPT

© 2008 IBM Corporation
IBM Linux Technology Center
Linux on System z performance hints and tips Eberhard Pasch
Session 2591

2
IBM Linux Technology Center
Session 2591: Linux on System z performance hints and tips © 2008 IBM Corporation
TrademarksThe following are trademarks of the International Business Machines Corporation in the United States and/or other countries.
The following are trademarks or registered trademarks of other companies.
* Registered trademarks of IBM Corporation
* All other products may be trademarks or registered trademarks of their respective companies.
Linux is a registered trademark of Linus Torvalds in the United States, other countries, or both.Java and all Java-related trademarks and logos are trademarks of Sun Microsystems, Inc., in the United States and other countries.SET and Secure Electronic Transaction are trademarks owned by SET Secure Electronic Transaction LLC.
Notes: Performance is in Internal Throughput Rate (ITR) ratio based on measurements and projections using standard IBM benchmarks in a controlled environment. The actual throughput that any user will experience will vary depending upon considerations such as the amount of multiprogramming in the user's job stream, the I/O configuration, the storage configuration, and the workload processed. Therefore, no assurance can be given that an individual user will achieve throughput improvements equivalent to the performance ratios stated here. IBM hardware products are manufactured from new parts, or new and serviceable used parts. Regardless, our warranty terms apply.All customer examples cited or described in this presentation are presented as illustrations of the manner in which some customers have used IBM products and the results they may have achieved. Actual environmental costs and performance characteristics will vary depending on individual customer configurations and conditions.This publication was produced in the United States. IBM may not offer the products, services or features discussed in this document in other countries, and the information may be subject to change without notice. Consult your local IBM business contact for information on the product or services available in your area.All statements regarding IBM's future direction and intent are subject to change or withdrawal without notice, and represent goals and objectives only.Information about non-IBM products is obtained from the manufacturers of those products or their published announcements. IBM has not tested those products and cannot confirm the performance, compatibility, or any other claims related to non-IBM products. Questions on the capabilities of non-IBM products should be addressed to the suppliers of those products.Prices subject to change without notice. Contact your IBM representative or Business Partner for the most current pricing in your geography.
DB2*DB2 ConnectDB2 Universal Databasee-business logoIBM*IBM eServerIBM logo*Informix®
System zTivoli*WebSphere*z/VM*zSeries*z/OS*
ECKDEnterprise Storage Server®FICONFICON ExpressHiperSocketOSAOSA Express

IBM Linux Technology Center
Session 2591: Linux on System z performance hints and tips © 2008 IBM Corporation
Agenda
Tuning– Application
– C/C++ – Middleware
– Java– Linux
– Networking– DASD
– Virtualization– Hardware / Setup
Monitoring– Oprofile– SCSI

IBM Linux Technology Center
Session 2591: Linux on System z performance hints and tips © 2008 IBM Corporation
Optimize your stack in the right direction
Diminishing effect of tuning efforts
–Application design
–Application implementation
–Middleware
–Operating system
–Virtualization layer
–Hardware

IBM Linux Technology Center
Session 2591: Linux on System z performance hints and tips © 2008 IBM Corporation
Impact of newer software releases
Hardware:System z9(TM) 2094-S188-way 1.65 GHz
Software upgraded► z/VM 5.2 → 5.3► Java 1.4 → 1.5► WebSphere Application server
6.0.2 → 6.1.0.11► DB2 8.2 → 9.1
<< b
ette
r
1 2 3 4 50
200
400
600
800
1000
1200
1400
Virtualization Performance - Throughput Comparison
VM 5.2 VM 5.3
Number of guests (triplets)
Tran
sact
ions
/ se
c.
The newer software levels provides a significant improvement in throughput!
Keep your system current!

IBM Linux Technology Center
Session 2591: Linux on System z performance hints and tips © 2008 IBM Corporation
Optimizing C/C++ code
Use -O3 optimization as default– no debugging options
Further optimization: – architecture dependent options
– -march=values <G5,z900,z990> <z9-109 with gcc-4.1> <z10 with patched gcc 4.3>– -mtune=values <G5,z900,z990> <z9-109 with gcc-4.1> <z10 with patched gcc 4.3>
– inline assembler functions
Next step: application design– dynamic or static linking– Avoid –fPIC for executables– right use of inlined C / C++ functions
Fine Tuning: additional general options on a file by file basis – -funroll-loops -ffast-math

IBM Linux Technology Center
Session 2591: Linux on System z performance hints and tips © 2008 IBM Corporation
Results of changing compiler options
Comparison lower vs. higher optimization
-O0 gcc-4.1-051111 glibc-2.3.5-10-O3 -march=z990 -fprofi-le-generate|use gcc-4.1-051111 glibc-2.3.5-10
test cases
exec
utio
n tim
e
Using -O3 instead of no optimization cuts runtime up to 50%

IBM Linux Technology Center
Session 2591: Linux on System z performance hints and tips © 2008 IBM Corporation
GCC Cross Compile Performance on System z
1 2 4 8
Compile TimesCross Compile for m68k Linux Kernel
X3920z10
Number of CPU's
Com
pile
tim
e in
sec
onds
1 2 4 80,00%
5,00%
10,00%
15,00%
20,00%
25,00%
30,00%
35,00%
40,00%
45,00%
50,00%
Relative Performance Improvementsz10 compared to X3920
Difference Percent
Number of CPU'sPer
form
ance
Impr
ovem
ent i
n P
erce
nt

IBM Linux Technology Center
Session 2591: Linux on System z performance hints and tips © 2008 IBM Corporation
Java basics
Try to use latest Java version–Up to 20% release to release improvements–True as well for newer service releases (SR)
Make sure that you've got enabled JIT–Verify Java output and look for “JIT enabled: jitc”
Don't use Java in batch mode:–If you do 100 calls “java -jar myprogram.jar” you compile
myprogram 100 times – can take more CPU power than the program itself– the JIT compiler can't do its optimization work
–Instead pull the loop inside the Java program and call “java -jar myprogram100.jar” once

IBM Linux Technology Center
Session 2591: Linux on System z performance hints and tips © 2008 IBM Corporation
Java heap size
Useful parameters– Setting heap size: -Xms (minimal), -Xmx (maximal), use min=max– -verbose:gc -- monitor GC
Max heap <= available memory– Avoid paging - Linux and VM– remember: heap memory will be used eventually!
Larger heap size usually implies better performance– in 31bit SLES8, SLES9 & SLES10 use /proc/<pid>/mapped_base to define heaps up
to 1.7 GB– In 31bit RHEL4 environments use flex-mmap mechanism
– Watch out for prelinked applications!– Works also in 31bit emulation on 64 bit distros

IBM Linux Technology Center
Session 2591: Linux on System z performance hints and tips © 2008 IBM Corporation
Mapped_base HowTo
Only available for Novell distribution SLES8,9,10 (31 bit)
PID is the process ID of the process you want to change
– In bash $$ gives you the current process, from any process /proc/self/... works as well
Display memory map of any PID by cat /proc/PID/maps
Check the mapped_base value by cat /proc/PID/mapped_base
Change value to e.g. 256 Mb byecho 268435456 >/proc/PID/mapped_base
256 Mb
2 Gb
mapped_base
shared libraries
1400 Mb

IBM Linux Technology Center
Session 2591: Linux on System z performance hints and tips © 2008 IBM Corporation
J2SE 1.4.2
J2SE 5.0 Java SE 6
0%25%50%75%
100%125%150%175%200%225%
Java versions
z9 z100%
25%50%75%
100%125%150%175%
System z with Java SE 6
Java Results 64-bit
Java improvements through newer JVM and JIT improvements through new hardware 64-bit Java is production ready
Java 6: new option -Xcompressedref (stay tuned)
IBM Linux Technology Center
Session 2591: Linux on System z performance hints and tips © 2008 IBM Corporation
Java tuning exercise for z10 – workload specific
Split workload so that multiple 31 bit JVMs can be used
-Xms1600m -Xmx1600m : maximize heap, same value
-Xlp : use large pages for the heap (new z10 feature)
-Xgcpolicy:gencon : change garbage collection policy to treat long and short lived objects differently, results in shorter pause times
-Xmo800m -Xmn800m : explicitly set the size for old and new objects (nursery too small by default)
-Xnoloa : don't use special large object area in the heap
Further reading: – GC: http://www-128.ibm.com/developerworks/java/library/j-ibmjava2/index.html,
http://www-128.ibm.com/developerworks/java/library/j-ibmjava3/index.html
14
IBM Linux Technology Center
Session 2591: Linux on System z performance hints and tips © 2008 IBM Corporation
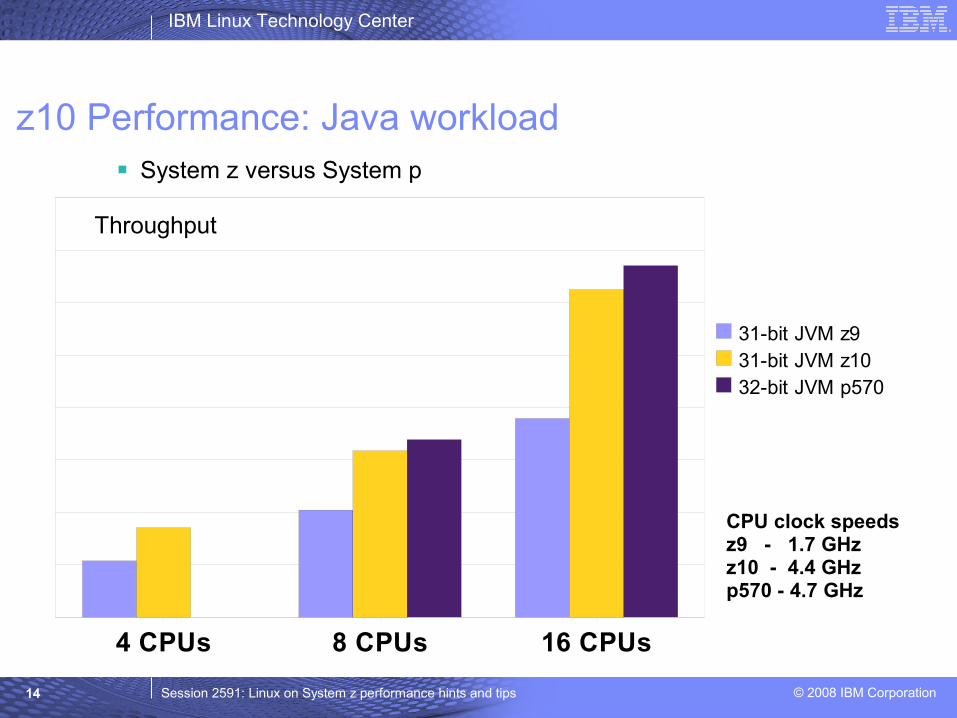
z10 Performance: Java workload System z versus System p
4 CPUs 8 CPUs 16 CPUs
31-bit JVM z931-bit JVM z1032-bit JVM p570
CPU clock speedsz9 - 1.7 GHzz10 - 4.4 GHzp570 - 4.7 GHz
Throughput

IBM Linux Technology Center
Session 2591: Linux on System z performance hints and tips © 2008 IBM Corporation
Networking performance Which connectivity to use:
– External connectivity:– Use new 10 GbE cards with MTU 8992– Attach OSA directly to Linux guest image
– Internal connectivity:– Hipersockets for LPAR-LPAR communication– VSwitch for guest-guest communication
For really busy network devices consider to– use channel bonding– Increase the number of inbound buffers in the qeth driver
– Device has to be offline– # echo <number> > /sys/bus/ccwgroup/drivers/qeth/<device_bus_id>/buffer_count
Channel bonding for HA creates only a small overhead Choose your MTU size carefully
– Avoid fragmentation, lots of small packages can drive up CPU utilization

IBM Linux Technology Center
Session 2591: Linux on System z performance hints and tips © 2008 IBM Corporation
How to improve disk performance
Hardware choices– Use SCSI instead of ECKD
– Use FICON instead of ESCON
– 4Gb FICON > 2Gb FICON > 1Gb FICON Utilize your hardware
– Use “striped” logical volumes from different ranks
– Consider using HiperPAV
– Carefully set up your storage system
– With D8000 – new option to stripe on storage server (see Session 2590)
– http://www.ibm.com/developerworks/linux/linux390/perf/tuning_rec_dasd_optimizedisk.shtml

IBM Linux Technology Center
Session 2591: Linux on System z performance hints and tips © 2008 IBM Corporation
Effect of dasdfmt block size on throughput and capacity
Use 4k block size on ECKD DASDs whenever possible !
0
10
20
30
40
50
60
70
SequentialWrite
SequentialRead
Randomwrite
RandomRead
MB
/s
512102420484096
block size
disk space
512b 3.5G 1024b 4.7G 2048b 6G 4096b 6.8G
dasdfmt blocksize

IBM Linux Technology Center
Session 2591: Linux on System z performance hints and tips © 2008 IBM Corporation
“On Demand Timer” patch
Linux uses HZ based timer interrupts
Timer interrupts for idle guests create unnecessary overhead
Starting with SLES8: enable & disable on the fly– /proc/sys/kernel/hz_timer
– 1 = timer interrupts occurring every 10 ms
– 0 = timer interrupts generated on demand only
Included in SLES9, SLES10 and RHEL4, RHEL5 s390/s390x distributions

IBM Linux Technology Center
Session 2591: Linux on System z performance hints and tips © 2008 IBM Corporation
CMM
2 methods available:– VMRM-CMM (VM Resource Manager – Cooperative Memory Management) aka
CMM1– Resource manager controls the size of the guests
– CMMA (Collaborative Memory Management Assist) aka CMM2– Linux indicates which pages don't need to be saved
Both methods show performance improvements when z/VM hits a system memory constraint.

IBM Linux Technology Center
Session 2591: Linux on System z performance hints and tips © 2008 IBM Corporation
CMM1 scenario
Large Oracle guests, total used Linux memory = 2x of z/VM central storage, OLTP workload
Advantages with CMM1 Guests did not suffer from smaller page cache
z/VM 5.2 z/VM 5.3 CMMA VMRM-CMM
VMRM-CMM & CMMA
0%
50%
100%
150%
200%
250%
300%
Throughput for 10 guestsz/VM 5.2, z/VM 5.3, CMMA, VMRM-CMM, VMRM-CMM & CMMA
Nor
mal
ized
Tra
nsac
tiona
l Thr
ough
put

IBM Linux Technology Center
Session 2591: Linux on System z performance hints and tips © 2008 IBM Corporation
CMM2 scenario
Workload– 15 guests, touching all their memory, all z/VM storage used. A guest orders now
150MB, 500MB, 1.5GB of memory. We measure the duration of this operation Result
– In case of sudden memory claims CMM2 is the best choice
150 500 15000
10
20
30
40
50
60
70
80
2,53
11,96
49,32
0,38 1,59
13,5
0,2 0,62
279,38
Duration of claiming Memory
Duration avg. [sec] w/o cmmDuration avg. [sec] w/ cmm2Duration avg. [sec] w/ cmm1
Memory in MiB to be claimed
Dur
atio
n in
sec
150 500 15000
2
4
6
8
10
12
14
16
18
20
Improvement factor for claiming Memory (normalized)
Memory in MiB to be claimed

IBM Linux Technology Center
Session 2591: Linux on System z performance hints and tips © 2008 IBM Corporation
# of CPUs per Linux image
Use as few virtual CPUs as possible
For LPAR definitions: – # all virtual CPUs : # real CPUs <= 4:1
For z/VM:– #of guest CPUs <= #of CPUs for VM (LPAR)
– Don't define more CPUs than you really need!
You don't get done more by defining more CPUs!
Automatic adaption with cpuhotplugd (see session 2590)

IBM Linux Technology Center
Session 2591: Linux on System z performance hints and tips © 2008 IBM Corporation
Linux command 'top' – the snapshot tool
Adds new field “CPU steal time” – Is time Linux wanted to run, but the hipervisor was not able to schedule CPU– Is included in SLES10 and RHEL5
top - 09:50:20 up 11 min, 3 users, load average: 8.94, 7.17, 3.82Tasks: 78 total, 8 running, 70 sleeping, 0 stopped, 0 zombie Cpu0 : 38.7%us, 4.2%sy, 0.0%ni, 0.0%id, 2.4%wa, 1.8%hi, 0.0%si, 53.0%st Cpu1 : 38.5%us, 0.6%sy, 0.0%ni, 5.1%id, 1.3%wa, 1.9%hi, 0.0%si, 52.6%st Cpu2 : 54.0%us, 0.6%sy, 0.0%ni, 0.6%id, 4.9%wa, 1.2%hi, 0.0%si, 38.7%st Cpu3 : 49.1%us, 0.6%sy, 0.0%ni, 1.2%id, 0.0%wa, 0.0%hi, 0.0%si, 49.1%st Cpu4 : 35.9%us, 1.2%sy, 0.0%ni, 15.0%id, 0.6%wa, 1.8%hi, 0.0%si, 45.5%st Cpu5 : 43.0%us, 2.1%sy, 0.7%ni, 0.0%id, 4.2%wa, 1.4%hi, 0.0%si, 48.6%stMem: 251832k total, 155448k used, 96384k free, 1212k buffersSwap: 524248k total, 17716k used, 506532k free, 18096k cached

IBM Linux Technology Center
Session 2591: Linux on System z performance hints and tips © 2008 IBM Corporation
Sysstat – the 'long' term data collection
Contains four parts– sadc: data gatherer - stores data in binary file– Sar: reporting tool - reads binary file and converts it to readable output– Mpstat: processor utilization– Iostat: I/O utilization
“steal time” included starting version 7.0.0
Install the sysstat package and configure it depending on your distribution (crontab)
– by default data is collected in /var/log/sa
More info at: http://perso.orange.fr/sebastien.godardand with “man sar” on your system
IBM Linux Technology Center
Session 2591: Linux on System z performance hints and tips © 2008 IBM Corporation
Oprofile – the Open Source sampling tool
Oprofile offers profiling of all running code on Linux systems, providing a variety of statistics.
– By default, kernel mode and user mode information is gathered for configurable events
System z hardware currently does not have support for hardware performance counters, instead timer interrupt is used
– Enable the hz_timer(!)
The timer is set to whatever the jiffy rate is and is not user-settable
Novell / SUSE: oprofile is on the SDK CDs
More info at: – http://oprofile.sourceforge.net/docs/– http://www.redhat.com/docs/manuals/enterprise/RHEL-4-Manual/sysadmin-guide/ch-oprofile.html

IBM Linux Technology Center
Session 2591: Linux on System z performance hints and tips © 2008 IBM Corporation
Oprofile – short how-to
Example from http://www.ibm.com/developerworks/linux/linux390/perf/tuning_how_tools.html#oprofile
sysctl -w kernel.hz_timer=1gunzip /boot/vmlinux-2.6.5-7.201-s390x.gzopcontrol --vmlinux=/boot/vmlinux-2.6.5-7.201-s390xopcontrol --start<DO TEST>opcontrol --shutdownopreport

IBM Linux Technology Center
Session 2591: Linux on System z performance hints and tips © 2008 IBM Corporation
Oprofile – output exampleCPU: CPU with timer interrupt, speed 0 MHz (estimated)Profiling through timer interruptvma samples % app name symbol name80002840 5862 34.8970 mcf_base.z_Linux price_out_impl800012c8 5221 31.0811 mcf_base.z_Linux refresh_potential80003cb4 4398 26.1817 mcf_base.z_Linux primal_bea_mpp80003b60 408 2.4289 mcf_base.z_Linux sort_basket0001a67c 345 2.0538 vmlinux default_idle800013d8 138 0.8215 mcf_base.z_Linux flow_cost800033bc 98 0.5834 mcf_base.z_Linux update_tree800020f8 88 0.5239 mcf_base.z_Linux dual_feasible800036a4 72 0.4286 mcf_base.z_Linux primal_iminus8000323c 40 0.2381 mcf_base.z_Linux write_circulations80002720 24 0.1429 mcf_base.z_Linux insert_new_arc

IBM Linux Technology Center
Session 2591: Linux on System z performance hints and tips © 2008 IBM Corporation
SCSI statistics
In SLES9 and SLES10 SCSI statistics can be collected
If debugfs is mounted at /sys/kernel/debug/ , all the statistics data collected can be found at /sys/kernel/debug/statistics/
The names of these subdirectories consist of – zfcp-<device-bus-id> for an adapter and
– zfcp-<device-bus-id>-<WWPN>-<LUN> for a LUN.
Each subdirectory contains two files– data file– definition file
echo on=1 > definition enables the data gathering
echo on=0 > definition disables the data gathering. By default data gathering is off
echo data=reset > definition resets the counters to 0.

IBM Linux Technology Center
Session 2591: Linux on System z performance hints and tips © 2008 IBM Corporation
SCSI statistics examplecat /sys/kernel/debug/statistics/zfcp-0.0.1700-0x5005076303010482-0x4014400500000000/data...request_sizes_scsi_read 0x1000 1163request_sizes_scsi_read 0x80000 805request_sizes_scsi_read 0x54000 47request_sizes_scsi_read 0x2d000 44request_sizes_scsi_read 0x2a000 26request_sizes_scsi_read 0x57000 25request_sizes_scsi_read 0x1e000 25request_sizes_scsi_read 0x63000 24request_sizes_scsi_read 0x6f000 19request_sizes_scsi_read 0x12000 19...latencies_scsi_read <=1 1076latencies_scsi_read <=2 205latencies_scsi_read <=4 575latencies_scsi_read <=8 368latencies_scsi_read <=16 0...channel_latency_read <=16000 0channel_latency_read <=32000 983channel_latency_read <=64000 99channel_latency_read <=128000 115channel_latency_read <=256000 753channel_latency_read <=512000 106channel_latency_read <=1024000 141channel_latency_read <=2048000 27channel_latency_read <=4096000 0...fabric_latency_read <=1000000 1238fabric_latency_read <=2000000 328fabric_latency_read <=4000000 522fabric_latency_read <=8000000 136fabric_latency_read <=16000000 0...

IBM Linux Technology Center
Session 2591: Linux on System z performance hints and tips © 2008 IBM Corporation
Comparing SCSI and ECKD request sizes
<8k<16k
<32k<64k
<128k<256k
<512k<1024k
0
10000
20000
30000
40000
50000
60000
70000
80000
Request sizes (IOzone 16 processes)
SCSI Seq. WriteECKD Seq. WriteSCSI Seq. ReadECKD Seq. ReadSCSI Rdm. Write/ReadECKD Rdm. Write/Read
Request sizes
Num
ber o
f req
uest
s
Similar request sizes for sequential and random I/O

IBM Linux Technology Center
Session 2591: Linux on System z performance hints and tips © 2008 IBM Corporation
Comparing SCSI and ECKD latencies (1)
SCSI sequential write latencies are longer
<=0.5<=1
<=2<=4
<=8<=16
<=32<=64
<=128
<=256
0
10.000
20.000
30.000
40.000
50.000
60.000
Latencies Seq. Write
SCSI overallECKD overall SCSI fabricECKD ssch till irq
Latencies in ms
Num
ber o
f occ
urre
nces

IBM Linux Technology Center
Session 2591: Linux on System z performance hints and tips © 2008 IBM Corporation
Comparing SCSI and ECKD latencies (2)
SCSI sequential read latencies are shorter
<=0.5<=1
<=2<=4
<=8<=16
<=32
0
5.000
10.000
15.000
20.000
25.000
Latencies Seq. Read
SCSI overallECKD overall SCSI fabricECKD ssch till irq
Latencies in ms
Num
ber o
f occ
urre
nces

IBM Linux Technology Center
Session 2591: Linux on System z performance hints and tips © 2008 IBM Corporation
Visit us !
Linux on zSeries Tuning Hints and Tips– http://www.ibm.com/developerworks/linux/linux390/perf/
Linux-VM Performance Website:– http://www.vm.ibm.com/perf/tips/linuxper.html
WAS 6.1 tuning guide– ftp://ftp.software.ibm.com/software/webserver/appserv/library/v61/wasv610exp_tune.pdf

IBM Linux Technology Center
Session 2591: Linux on System z performance hints and tips © 2008 IBM Corporation
Questions

IBM Linux Technology Center
Session 2591: Linux on System z performance hints and tips © 2008 IBM Corporation
Backup – older but still valid topics for reference

IBM Linux Technology Center
Session 2591: Linux on System z performance hints and tips © 2008 IBM Corporation
/proc/dasd/statistics (1)
Linux can collect performance stats on DASD activity as seen by Linux(!)
Turn on with echo on > /proc/dasd/statistics
Turn off withecho off > /proc/dasd/statistics
To reset: turn off and then on again
Can be read for the whole system bycat /proc/dasd/statistics
Can be read for individual DASDs bytunedasd -P /dev/dasda
IBM Linux Technology Center
Session 2591: Linux on System z performance hints and tips © 2008 IBM Corporation
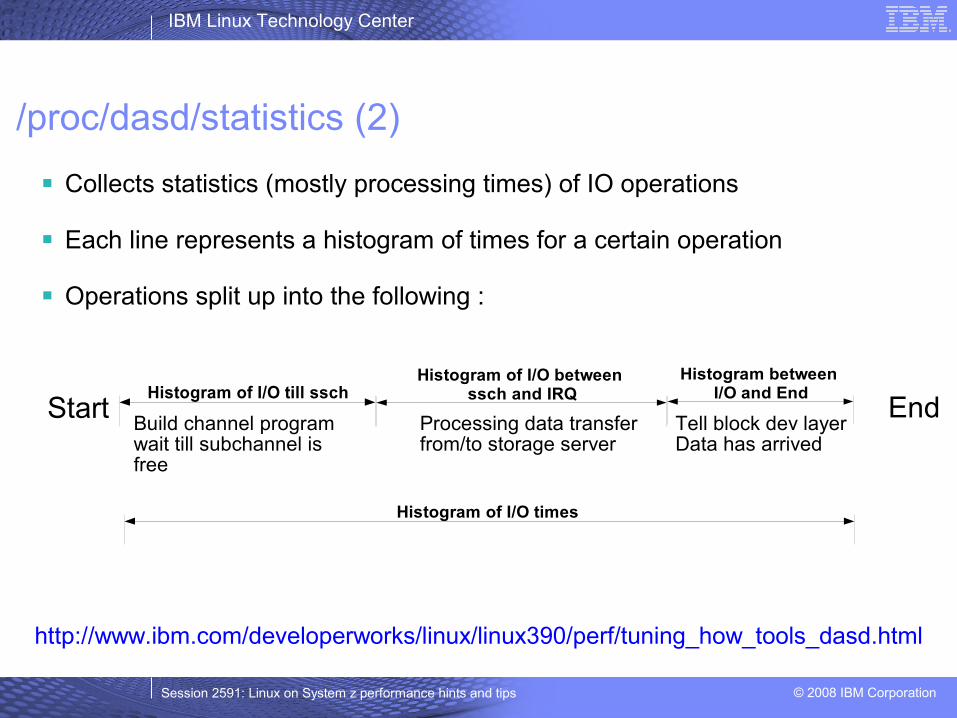
/proc/dasd/statistics (2)
Collects statistics (mostly processing times) of IO operations
Each line represents a histogram of times for a certain operation
Operations split up into the following :
Histogram of I/O till sschHistogram of I/O between
ssch and IRQHistogram between
I/O and EndStart End
Histogram of I/O times
Build channel programwait till subchannel is free
Processing data transferfrom/to storage server
Tell block dev layerData has arrived
http://www.ibm.com/developerworks/linux/linux390/perf/tuning_how_tools_dasd.html

IBM Linux Technology Center
Session 2591: Linux on System z performance hints and tips © 2008 IBM Corporation
/proc/dasd/statistics (3)Tue Jan 18 20:52:50 EST 200521155901 dasd I/O requestswith 433275376 sectors(512B each) __<4 ___8 __16 __32 __64 _128 _256 _512 __1k __2k __4k __8k _16k _32k _64k 128k _256 _512 __1M __2M __4M __8M _16M _32M _64M 128M 256M 512M __1G __2G __4G _>4GHistogram of sizes (512B secs) 0 0 3774298 838941 352193 232188 43222 30563 16163 1403 0 0 0 0 0 0 0 0 0 0 0 0 0 0 0 0 0 0 0 0 0 0Histogram of I/O times (microseconds) 0 0 0 0 0 0 0 2 3005329 352056 726353 671293 355198 147238 29245 2201 51 3 0 0 0 0 0 0 0 0 0 0 0 0 0 0Histogram of I/O times per sector 0 0 24686 204678 524222 2803252 500319 537993 249088 316175 111592 15932 1005 26 3 0 0 0 0 0 0 0 0 0 0 0 0 0 0 0 0 0Histogram of I/O time till ssch3498191 51615 86168 21601 2756 1927 4348 22793 177758 138465 955964 214188 61200 42284 9075 621 14 0 0 0 0 0 0 0 0 0 0 0 0 0 0 0Histogram of I/O time between ssch and irq 0 0 0 0 0 0 0 4 4252115 408592 78374 122000 309317 108290 9848 416 13 3 0 0 0 0 0 0 0 0 0 0 0 0 0 0Histogram of I/O time between ssch and irq per sector 0 0 41819 517428 890743 3323127 21897 23329 103966 280533 79777 6056 282 10 2 0 0 0 0 0 0 0 0 0 0 0 0 0 0 0 0 0Histogram of I/O time between irq and end4531949 633301 75411 41903 4984 791 516 48 40 3 3 20 0 0 0 0 0 0 0 0 0 0 0 0 0 0 0 0 0 0 0 0# of req in chanq at enqueuing (1..32) 0 3658672 277906 128989 97542 1125789 27 0 0 0 0 0 0 0 0 0 0 0 0 0 0 0 0 0 0 0 0 0 0 0 0 0

IBM Linux Technology Center
Session 2591: Linux on System z performance hints and tips © 2008 IBM Corporation
How to collect z/VM monitor data
Cheat Sheet at: http://www.vm.ibm.com/perf/tips/collect.html
5 basic steps– Create monitor DCSS
– Setup userid to issue monwrite command
– Start and configure monitor
– Start monwrite
– Stop monwrite and save data

IBM Linux Technology Center
Session 2591: Linux on System z performance hints and tips © 2008 IBM Corporation
How to insert Linux data in z/VM monitor stream
Enable your guest for inserting data into the monitor stream– set APPLMON option to user direct
Insert Linux modules– modprobe appldata_mem– modprobe appdata_os– modprobe appldata_net_sum
Turn on monitoring– echo 1 > /proc/sys/appldata/timer– echo 1 > /proc/sys/appldata/mem– echo 1 > /proc/sys/appldata/os– echo 1 > /proc/sys/appldata/net_sum
Details can be found in chapter 15 of Device Drivers, Features, and Commands (SC33-8281-02)http://download.boulder.ibm.com/ibmdl/pub/software/dw/linux390/docu/l26bdd02.pdf

IBM Linux Technology Center
Session 2591: Linux on System z performance hints and tips © 2008 IBM Corporation
z/VM 2 GB considerations
Solution: upgrade z/VM to 5.2 or 5.3 level Read at
– http://www.vm.ibm.com/perf/tips/2gstorag.html
– http://www.vm.ibm.com/perf/reports/zvm/html/64bit.html
– http://www.ibm.com/developerworks/linux/linux390/perf/tuning_rec_fixed_io_buffers.shtml Old workarounds
– Cooperative Memory Management
– fixed I/O buffers with kernel 2.6 and ECKD
– distribute your guests to multiple z/VMs
– Move large guest to LPAR

IBM Linux Technology Center
Session 2591: Linux on System z performance hints and tips © 2008 IBM Corporation
spin_retry
Problem: – with many guests in z/VM it can happen that CP is busy executing diagnose
instructions for the guest What's behind it:
– in a so-called spin lock, Linux guests give their CPU share back to the hipervisor using DIAG 44
– Hipervisor can be overloaded Solution:
– Linux tries to get a lock n times before issuing a DIAG– Value of n is adjustable in /proc/sys/kernel/spin_retry (default 1000)– Included in latest SLES9 + SLES10 + RHEL4 + RHEL5

IBM Linux Technology Center
Session 2591: Linux on System z performance hints and tips © 2008 IBM Corporation
Tick based CPU Time inaccuracy
kernel contextuser context
kernel contextuser context
timer ticks
U
U K U U U U U U
kernel contextuser context
K K U K U K U U
timer ticks
U
2/100 s
7/100 s
1/100 s
8/100 s
4/100 s
5/100 s

IBM Linux Technology Center
Session 2591: Linux on System z performance hints and tips © 2008 IBM Corporation
Tick based CPU accounting on virtual systems
kernel contextuser context
kernel contextuser context
timer ticks
U
U K U U U U U U
kernel contextuser context
K K U K U K UU
timer ticks
U
1/100 s
5/100 s
1/100 s
8/100 s
4/100 s
5/100 s

IBM Linux Technology Center
Session 2591: Linux on System z performance hints and tips © 2008 IBM Corporation
New Virtual CPU time accounting
kernel contextuser context
kernel contextuser context
1/100 s
5/100 s
5/100 s1/100 s
stpt
stop
stpt stpt stpt stpt stpt
stop stopstart start startstop start
stpt stpt
Host action
Guest action
kernel timeuser time
steal time 3/100 s
stpt = Store CPU Timer