liquid air on the european highway - air quality news · pdf file4 liquid air on the european...
TRANSCRIPT

Liquid Air on the European Highway
The economic and environmental impact of zero-emission transport refrigeration

Liquid Air on the European Highway 3Liquid Air on the European Highway2
Contents:
Liquid Air on the European Highway
With thanks to:
Air Products Cemafroid The University of Birmingham
Editorial Team:ResearcherZoé Bengherbi
AnalystsFlorian WagnerEtienne Teyssandier
Reviewers Michael Ayres Nick OwenToby Peters
Editor David Strahan
DesignerBen Butterfield
Defining our termsThroughout this report, ‘liquid air’ is a shorthand that describes both liquid air, which is not yet produced in commercial quantities, and liquid nitrogen, which can be used in the same way, and is produced in bulk throughout the industrialised economies. In the longer term, liquid air would be cheaper to produce, but in the short to medium term it is likely that liquid nitrogen – for which there is substantial spare production capacity – will provide the ‘fuel’ for liquid air transport refrigeration units (TRUs). The phrase ‘liquid air’ should be taken to cover both liquid air and liquid nitrogen throughout. For more detail, see Spotlight on: Liquid air and liquid nitrogen and Appendix 1.
Throughout this report, the phrase ‘liquid air transport refrigeration unit’ or ‘liquid air TRU’ refers only to TRUs that extract both cooling and mechanical power from the phase-change expansion of liquid air or liquid nitrogen. The phrase excludes systems that extract cooling only – such as those from Cryofridge, Frostcruise, natureFridge and blueeze – which are described as ‘evaporation only’. Since such systems fail to extract the mechanical power available from the expansion of liquid air, they are far less efficient and far less competitive against diesel. For more detail please see the Spotlight on: Zero-emission transport refrigeration and the case for fuel duty reform or Appendix 2.
Throughout this report the phrase ‘transport refrigeration’ refers only to the cooling of a refrigerated vehicle and not its propulsion.
Throughout this report we use European numbering conventions rather than Anglo-Saxon, so the decimal mark is represented by a comma, and thousands are separated by a space – eg €1,2 million not €1.2 million, and €540 000 not €540,000.
The modelling for this report was converted from sterling to euros at an exchange rate of £/€ 1,36.
Published by:
07Liquid air and liquid nitrogen
10Grocery market
11F-gases
15LNG waste cold
19Cold and power research – The University of Birmingham
20-21Zero-emission transport refrigeration and the case for fuel duty reform
Spotlight on:
Dearman, 2015
04Foreword
05-07Executive summary
08-25Report
26-28Appendix 1: The Dearman technology
29-31Appendix 2: TRU technologies comparison
32-33Appendix 3: Calculating the social cost of transport refrigeration
34Glossary
35Endnotes
Liquid Air on the European Highway 5Liquid Air on the European Highway4
Executive summary
Transport refrigeration is vital to modern society
Transport refrigeration is a vital but little noticed pillar of modern society; without it the supply of food and medicine would simply break down. In advanced economies such as the EU, a seamless ‘cold chain’ of refrigerated warehousing and transport stretches all the way from the farm gate to the consumer’s plate, and also ensures the efficacy and safety of many medicines and vaccines. Unfortunately, the transport refrigeration units (TRUs) that keep cargo cool in transit are overwhelmingly powered by diesel and highly polluting.
This report investigates the environmental and health damage caused by TRUs throughout the EU, and the potential benefits of converting to zero-emission units that extract both cold and power from liquid air or liquid nitrogen. We calculate that switching to this kind of zero-emission refrigeration would save €1,9 billion per year by 2025 in reduced damage to the environment and health. These reductions in social costs are in addition to any direct financial savings to the owners of the equipment.
The problem with current technology
TRUs emit CO2 and grossly disproportionate amounts of toxic NOx (nitrogen oxides) and PM (particulate matter) – pollutants that cause more than 400 000 premature deaths in the EU each year. They also leak highly potent climate-warming HFC refrigerants (‘F-gases’), although our analysis shows that this problem is less significant than generally thought: F-gas leakage accounts for just 17% of lifecycle CO2e emissions of TRUs in the EU, and diesel consumption accounts for most of the rest.
This situation persists in part because EU policies – including the recently introduced F-gas regulations, and the proposed new Non-Road Mobile Machinery (NRMM) standards – have so far failed to tackle the problem decisively. Yet liquid air TRUs could provide an elegant and affordable solution, especially if TRU
emissions were regulated under the Low Emission Zones springing up in Europe’s cities – where the damage is greatest. Converting to liquid air would reduce TRU greenhouse gas emissions by 50% in 2025 – more if integrated with renewables – and eliminate their emissions of NOx and PM altogether.
Liquid air as a fuel
Using liquid air as a ‘fuel’ for TRUs is a relatively new idea, yet Europe has ample infrastructure to support its uptake. In the near term, TRUs could be fuelled by liquid nitrogen, which works in the same way, causes no damage to the environment or health, and is already widely available. We estimate that the ten countries that operate 80% of the EU TRU fleet have enough spare liquid nitrogen production capacity to fuel 70 000 zero-emission TRUs. In other words, the early deployment of liquid air TRUs would require no immediate investment in nitrogen production capacity or distribution networks.
Cryogenic refrigeration systems based on the simple evaporation of liquid nitrogen are already available from companies such as Cryofridge, Frostcruise, natureFridge and blueeze, but these derive only cooling from the expansion process, and fail to capture the mechanical energy that is also available, and as a result are far less efficient. This report investigates the potential of ‘liquid air’ TRUs, which can run on either liquid air or liquid nitrogen, but which harvest both cooling and shaft power from the same tank of cryogen, and so are far more efficient.
The Dearman liquid air engine has many other potential applications, including zero-emission back-up electricity generators, and ‘heat hybrid’ engines for heavy duty vehicles that reduce diesel consumption by 25%. This report focuses exclusively on the first application to market, the liquid air TRU, and makes a compelling case for its economic, environmental and health benefits, and for its rapid adoption across Europe. Throughout this report the phrase ‘transport refrigeration’ refers only to the cooling of a refrigerated vehicle and not its propulsion.
ForewordThe world relies heavily on cold. The food we eat, the buildings we inhabit, the data we consume and the medicines that keep us healthy all need cooling. Getting food from the farm to our plates depends on a seamless network of refrigerated processing, storage and transport to ensure it arrives in good condition and doesn’t go to waste.
Transport is vital: it’s no good producing food and then just leaving it in a cold store; it needs to move quickly and efficiently from producer to consumer, and that requires a large fleet of refrigerated vehicles.
The problem is that those vehicles cause serious damage to the environment and health. The vast majority of refrigerated trucks use diesel-powered refrigeration, and burning diesel leads to emissions of not only CO2 but also toxic particulate matter and nitrogen oxides. Worse, in many refrigerated vehicles the cooling is powered by a secondary diesel engine that is generally inefficient and can emit many times more air pollution than the propulsion engine hauling it around. Yet more absurd, in some countries these secondary engines are even allowed to run on highly subsidised ‘red’ diesel, meaning taxpayers’ money is being used to support the polluters, and prevent clean cold technologies from gaining a foothold.
The impacts of this kind of air pollution are felt right across Europe. In the EU, it causes more than 400 000 premature deaths each year, and chronic ill-health for many more. This imposes a heavy social cost on every European nation. Refrigerated vehicles also leak highly potent climate-warming HFC refrigerants, although our analysis shows that this problem is less significant than generally thought.
Although there are around 1 million refrigerated vehicles in the EU, until now these hidden polluters have gone all but unnoticed. Their cost to society has never been assessed – until now – nor addressed through effective regulation.
As the European Commission begins to formulate its Heating and Cooling Strategy, we have a precious opportunity to clean up transport refrigeration. The good news is that although refrigerated vehicles are grossly disproportionate polluters, transport refrigeration can be made lower carbon and zero-emission while simultaneously reducing costs.
Zero-emission transport refrigeration is a rare case of a genuine triple win – for the environment, our health and the economy. The time to act is now.
Professor Toby Peters Visiting Professor in Power and Cold Economy, University of BirminghamChief Executive, Dearman
Introduction
Liquid Air on the European Highway 7Liquid Air on the European Highway6
Cost to society
Pollution from transport refrigeration could cost European Union countries €22 billion over the next decade, as the EU refrigerated road vehicle fleet grows to almost 1,2 million by 2025. If nothing is done, the environmental and health impacts of emissions of CO2, HFCs, NOx and PM will impose an annual burden of around €1,9 billion in 2015, rising to more than €2,5 billion in 2025.
Environmental damage
The cost to society of transport refrigeration is due to the cost of dealing with its emissions of CO2 and other greenhouse gases, and the environmental and health impacts of toxic NOx and particulate matter (PM), which cause over 400 000 premature deaths per year in the EU.1 In 2015 the cooling of refrigerated vehicles in the EU will emit around: • 13 million tonnes of CO2e;• 40 000 tonnes NOx, equivalent to more than
26 million Euro 6 diesel cars; • 5 000 tonnes of PM, equivalent to 56 million Euro 6
diesel cars.
Benefits of zero-emission cooling
Converting Europe’s transport refrigeration to zero-emission units that extract both cold and power from liquid air or liquid nitrogen over the course of the next decade would eliminate its emissions of NOx and PM altogether, with annual savings of 47 000 tonnes and 6 000 tonnes respectively by 2025. All our projections are based on the conservative assumption that the refrigerated vehicle fleet will grow by 1,5% per year, but other studies assume annual cold chain market growth of as much as 12%, so our forecasts could prove to be substantial underestimates.
Since diesel transport refrigeration units (TRUs) are effectively unregulated in Europe and emit much more local air pollution than a modern Euro VI truck propulsion engine, these savings are the NOx equivalent of taking almost 2 million trucks off the road, more than the EU’s entire fleet of articulated trucks, and the PM equivalent of removing 12 million such trucks from service – almost a third of the EU’s entire fleet of rigid trucks.2
Converting transport refrigeration to liquid air TRUs over ten years would also reduce diesel consumption by 4,7 billion litres in 2025, and 21,7 billion in the decade 2016-25 – worth almost €30 billion at average EU prices in 2014.3 Annual greenhouse gas emission reductions would reach around 8 million tonnes of CO2 equivalent (8mtCO2e) or 50% in 2025, and emissions would keep falling as the grid electricity used to produce liquid air or nitrogen continues to decarbonise.
Existing infrastructure
Europe has ample liquid nitrogen infrastructure to begin such a transition. The 10 EU countries (‘EU10’ – see Table 1) that operate 80% of the EU refrigerated vehicle fleet have estimated spare liquid nitrogen production capacity of around 9 000 tonnes per day, enough to fuel some 70 000 liquid air transport refrigeration units (TRUs). Seven of the EU10 countries also have the potential to produce extremely cheap liquid air or nitrogen by recycling the waste cold given off at LNG import terminals (see Spotlight on: LNG waste cold). This resource could in principle provide over 27 000 tonnes of liquid air or nitrogen per day, enough to fuel refrigeration on almost 210 000 vehicles.
Main findings, conclusions and recommendations
Liquid air and liquid nitrogenThe idea that the air that we breathe could turn into a liquid is counterintuitive to say the least, but scientists have known how to liquefy the constituents of air for well over a century, and the industrial gases industry now produces thousands of tonnes of liquid nitrogen and liquid oxygen every day. However, these gases need not be separated when liquefied, in which case the result is liquid air. A number of technologies are now being developed to exploit liquid air – or liquid nitrogen, its main constituent – as an energy ‘vector’.
Air can be turned into a liquid by cooling it to around -196°C using standard industrial equipment powered by electricity. 700 litres of ambient air becomes about 1 litre of liquid air, which can then be stored in an unpressurised insulated vessel. When heat is reintroduced to liquid air it boils and turns back into a gas, expanding 700 times in volume. This expansion can be used to drive a piston engine or turbine to do useful work. In principle, a liquid air engine works just like a steam engine, only 300°C colder. The main potential applications are in the provision of cold and power, electricity storage, transport and the recovery of waste heat.
Liquid air is not yet produced commercially, but liquid nitrogen, which can be used in the same way, is produced throughout the industrialised world. The industrial gas companies have large amounts of spare nitrogen production capacity for the simple reason there is four times more nitrogen in the atmosphere than oxygen but proportionately less commercial demand. We estimate the ten countries that operate 80% of the EU TRU fleet have spare liquid nitrogen production capacity of around 9 000 tonnes per day, enough to fuel some 70 000 liquid air TRUs. This surplus could be used in place of liquid air to support early deployment. In future, liquid air would be cheaper to produce than liquid nitrogen, because there is no need to separate the nitrogen and oxygen, meaning liquefaction requires less equipment and around a fifth less energy. Both liquid air and liquid nitrogen can be produced extremely cheaply by incorporating the waste cold from LNG re-gasification (see Spotlight on: LNG waste cold).
As with batteries or hydrogen, the purpose of liquid air is to store ‘wrong-time’ low- or zero-carbon electricity, and use it to displace coal or gas in electricity generation and petrol or diesel in vehicles. Liquid air and nitrogen have some significant advantages over other forms of energy storage, however, particularly when cooling is required, and would frequently be far cheaper. Both liquid air and liquid nitrogen are zero-emission at the point of use.
Conclusions and recommendations
The results of our study – the first detailed analysis of the impact of transport refrigeration across Europe – provide a compelling case to support the rapid development of liquid air transport refrigeration in the EU and lead us to conclude: • The social costs of diesel powered transport
refrigeration are high, grossly disproportionate and provide a compelling argument for policy support for zero-emission alternatives;
• Liquid air transport refrigeration would eliminate NOx and PM emissions; deliver substantial and progressively larger reductions in greenhouse gas emissions; and could provide an efficient route to eliminating damaging F-gases entirely;
• The annual benefit to society of each zero-emission TRU in 2025 is €1 700, in addition to any direct savings made by owners of the equipment;
• Europe has ample liquid nitrogen infrastructure to support the shift to liquid air transport refrigeration;
• Policy around TRUs is currently focussed on F-gases, which – although important – account for only 17% of aggregate TRU lifecycle greenhouse gas emissions, whereas diesel is responsible for most of the rest, and all of the NOx and PM;
• The NRMM regulations provide no incentive for the industry to make meaningful reductions in TRU emissions of NOx and PM, even after the proposed new standards become law;
• Policy should be re-set to focus not only on F-gases but on the larger problem of reducing TRU diesel emissions. If it is too late to tighten the new standards proposed for NRMM Stage 5, other measures should be found;
• Since NOx and PM emissions are especially damaging in cities, TRU emissions should be regulated under Low Emission Zones. These should demand a single move to zero-emission TRUs, rather than an extended trajectory of gradual emissions reductions;
• In a handful of countries, including Britain, France, Spain and Belgium, TRUs are still permitted to run on subsidised ‘red’ diesel, meaning that taxpayers’ money is being used to support a mature, highly polluting technology, creating a high barrier against the adoption of zero-emission transport refrigeration technologies that would otherwise undercut diesel; it is time to close this loophole;
• Many major cities such as Paris and Milan lack the data needed to estimate the impact of TRU emissions, and we recommend that national governments and city authorities should act quickly to improve the quality and granularity of their transport and emissions data; you cannot manage what you cannot measure.
“Pollution from transport refrigeration could cost
European Union countries €22 billion over the
next decade, as the EU refrigerated road vehicle
fleet grows to almost 1,2 million by 2025.”
Liquid Air on the European Highway 9Liquid Air on the European Highway8
Liquid Air on the European Highway
The economic and environmental impact of zero-emission transport refrigeration
Introduction
The business case for liquid air in commercial transport in Britain was conclusively demonstrated in Liquid Air on the Highway4, a report published in June 2014. Liquid air has also been recognised by the European Road Transport Research Advisory Council (ERTRAC) as an energy carrier offering ‘significant potential’ to help achieve the EU’s 2050 transport greenhouse gas emissions reductions target.5
Liquid Air on the Highway established that – unlike most low-carbon powertrains – liquid air-equipped vehicles, including transport refrigeration units (TRUs) and buses and trucks with ‘heat hybrid’ engines, would repay their investment quickly and without subsidy, while also producing large reductions in emissions of both CO2 and toxic local air pollutants such as NOx and PM. It did not assess the full range of pollutants, however, nor attribute any economic value to those it did.
First detailed study of transport refrigeration across the EU
Liquid Air on the European Highway focuses exclusively on TRUs – the other applications of liquid air will be the subject of future reports – but extends the analysis to encompass the entire EU, and all the major forms of TRU pollution. It estimates the economic cost to society of NOx, PM, CO2 and F-gas refrigerants on a business-as-usual scenario, and the value of the environmental benefits to be gained from a shift to a zero-emissions solution such as liquid air over the next ten years. It is the first detailed study of transport refrigeration across Europe, and is timely because: • Many major European cities are choking on local
air pollution, and the European Commission is taking action against Belgium, Bulgaria, Sweden,
Poland and the UK – supported by rulings from the European Court of Justice and the British Supreme Court;
• While the EC is starting to ‘get tough’ on local air pollution among member states, proposed EU emissions standards for TRUs (NRMM Stage 5) look extremely weak, and urgently need to be strengthened, or reinforced with other policy measures such as regulating TRU emissions through Low Emission Zones;
• At the same time, new EU regulations that came into force in January 2015 effectively phase out the supply of high global warming potential (GWP) ‘F-gas’ refrigerants by 2030, giving another pressing reason to rethink our approach to transport refrigeration;
• Dearman’s liquid nitrogen TRU has undertaken on-vehicle testing with HORIBA MIRA, with funding from Innovate UK (the British government’s innovation agency), and project partners include Air Products and Loughborough University. Dearman plans to have the unit – integrated by Hubbard Products Ltd, part of
Zanotti – in European fleet trials in 2016.
A cleaner, greener solution
Liquid air TRUs would eliminate NOx and PM emissions, sharply reduce the volume and leakage of high global warming potential (GWP) F-gas refrigerants, and slash both CO2 emissions and social costs. Some operators have tested vehicle refrigeration based on the simple evaporation of
liquid nitrogen, which also eliminates NOx, PM and F-gases, but these technologies are more expensive than diesel and remain niche or showcase products. The Dearman TRU is a significant advance because it produces both cooling and shaft power from a single unit of cryogen, which makes it more efficient and competitive against diesel.
Transport refrigeration in Europe
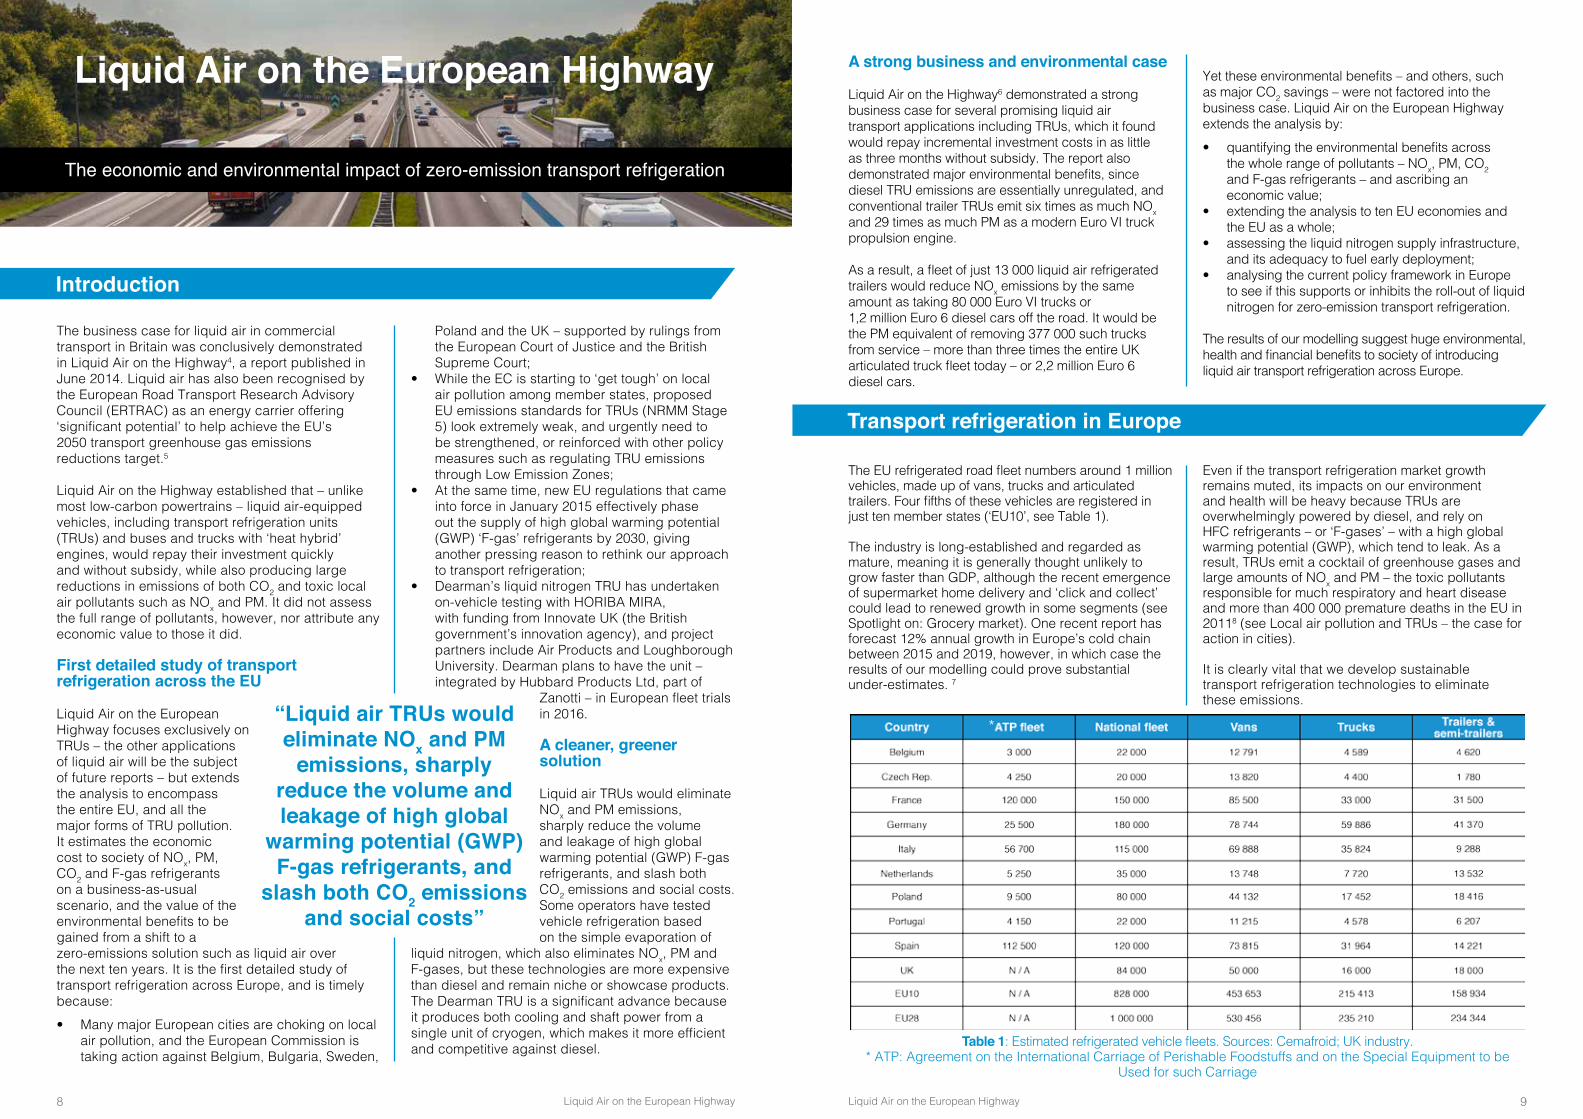
The EU refrigerated road fleet numbers around 1 million vehicles, made up of vans, trucks and articulated trailers. Four fifths of these vehicles are registered in just ten member states (‘EU10’, see Table 1).
The industry is long-established and regarded as mature, meaning it is generally thought unlikely to grow faster than GDP, although the recent emergence of supermarket home delivery and ‘click and collect’ could lead to renewed growth in some segments (see Spotlight on: Grocery market). One recent report has forecast 12% annual growth in Europe’s cold chain between 2015 and 2019, however, in which case the results of our modelling could prove substantial under-estimates. 7
Even if the transport refrigeration market growth remains muted, its impacts on our environment and health will be heavy because TRUs are overwhelmingly powered by diesel, and rely on HFC refrigerants – or ‘F-gases’ – with a high global warming potential (GWP), which tend to leak. As a result, TRUs emit a cocktail of greenhouse gases and large amounts of NOx and PM – the toxic pollutants responsible for much respiratory and heart disease and more than 400 000 premature deaths in the EU in 20118 (see Local air pollution and TRUs – the case for action in cities).
It is clearly vital that we develop sustainable transport refrigeration technologies to eliminate these emissions.
Table 1: Estimated refrigerated vehicle fleets. Sources: Cemafroid; UK industry. * ATP: Agreement on the International Carriage of Perishable Foodstuffs and on the Special Equipment to be
Used for such Carriage
A strong business and environmental case
Liquid Air on the Highway6 demonstrated a strong business case for several promising liquid air transport applications including TRUs, which it found would repay incremental investment costs in as little as three months without subsidy. The report also demonstrated major environmental benefits, since diesel TRU emissions are essentially unregulated, and conventional trailer TRUs emit six times as much NOx and 29 times as much PM as a modern Euro VI truck propulsion engine.
As a result, a fleet of just 13 000 liquid air refrigerated trailers would reduce NOx emissions by the same amount as taking 80 000 Euro VI trucks or 1,2 million Euro 6 diesel cars off the road. It would be the PM equivalent of removing 377 000 such trucks from service – more than three times the entire UK articulated truck fleet today – or 2,2 million Euro 6 diesel cars.
Yet these environmental benefits – and others, such as major CO2 savings – were not factored into the business case. Liquid Air on the European Highway extends the analysis by:• quantifying the environmental benefits across
the whole range of pollutants – NOx, PM, CO2 and F-gas refrigerants – and ascribing an economic value;
• extending the analysis to ten EU economies and the EU as a whole;
• assessing the liquid nitrogen supply infrastructure, and its adequacy to fuel early deployment;
• analysing the current policy framework in Europe to see if this supports or inhibits the roll-out of liquid nitrogen for zero-emission transport refrigeration.
The results of our modelling suggest huge environmental, health and financial benefits to society of introducing liquid air transport refrigeration across Europe.
“Liquid air TRUs would eliminate NOx and PM
emissions, sharply reduce the volume and leakage of high global
warming potential (GWP) F-gas refrigerants, and
slash both CO2 emissions and social costs”
*

Liquid Air on the European Highway 11Liquid Air on the European Highway10
Grocery marketThe transport refrigeration market in Europe is widely seen as mature, and unlikely to grow any faster than GDP, but the grocery sector is undergoing radical changes that could force that opinion to be revised. The growing popularity of online grocery shopping with home delivery or ‘click and collect’, the shift from out-of-town supermarkets towards local convenience stores, and the arrival of aggressive new competitors such as Amazon, could all lead to increased demand for transport refrigeration, and yet higher levels of urban TRU pollution. One recent report has forecast 12% annual growth in Europe’s cold chain between 2015 and 2019, in which case the results of our modelling could prove substantial under-estimates.
The shift to online grocery shopping is most pronounced in the UK, causing rapid growth in the supermarket van fleet to 50 000, and where the market is forecast to grow from £8 billion in 2014 to £17 billion in 2019.30 But other major European economies are now catching up. In several European countries the number of people buying groceries online doubled between 2008 and 2013, and the French market is forecast to jump from €5 billion in 2012 to €11 billion in 2016, while Germany is expected to more than double to €2,5 billion over the same period.31 The German market is under-developed so far, but expected to grow faster now that its second largest retailer, REWE, has begun home delivery, and Amazon Fresh has announced its plans to start operating there.32 AT Kearney expects the German market to triple to €5 billion by 2020.33
Home delivery is increasingly popular but, for supermarkets, making it pay is a challenge34, so many have launched click and collect services where customers pick up their pre-packed shopping at the store or a remote collection point. Asda for example has opened six collection stations in London and plans 1 000 in the UK by 2018.35 Click and collect will involve fewer additional vehicles than home delivery but more than the conventional supermarket model.
Another pronounced trend is away from supermarkets towards smaller local convenience stores. IDG forecasts the British convenience store market will grow 30% to £49 billion, almost a quarter of the grocery market, by 2019.36 Since these shops often have very little storage space, they must be re-supplied more often, requiring yet more refrigerated vehicles to operate in urban areas already suffering from traffic congestion and high levels of air pollution.
If European economies continue to follow the trends pioneered in Britain, what was a mature market in transport refrigeration could be reinvigorated. Even relatively modest shifts could have a significant impact on vehicle demand and the associated pollution in a European grocery market worth more than €1 trillion.37
The greenhouse gas emissions of TRUs comprise of CO2 emissions from diesel fuel, and leaks of high global warming potential (GWP) HFC refrigerant gases or ‘F-gases’. It is the F-gases that have captured the attention of policymakers, and it is easy to see why: the most commonly used F-gas, R404A, is 4 000 times more powerful than CO2, meaning that a leak of one kilogramme of refrigerant has the same global warming impact as four tonnes of carbon dioxide. To tackle this, the EU introduced new F-gas regulations in 2015 which are designed effectively to phase out HFC refrigerants by 2030 and force the market to develop alternatives.
However, our modelling, based on fleet performance data from Cemafroid, the French vehicle testing and transport refrigeration consultancy, suggests that refrigerant leakage accounts for only 17% of the lifecycle greenhouse gas emissions of the TRU fleet, with around 90% of the remainder due to the burning of diesel fuel. So although it is clearly important to minimise and eventually eliminate F-gas leakage, it is even more important to eliminate the CO2 emissions from TRU diesel consumption.
Our analysis suggests an average refrigerated van consumes almost 900 litres of diesel per year for cooling alone, the average truck around 6 000 litres, and the average trailer more than 9 000. Liquid air TRUs eliminate the need for diesel for cooling, and converting the European TRU fleet to liquid air over the next decade would produce progressively larger greenhouse gas reductions as fleet penetration increases and electricity grids decarbonise. By 2025 the annual greenhouse gas savings would reach 8mtCO2e – a reduction of 50%.
Liquid air TRUs do also reduce the amount of F-gas required by about half (see Liquid air transport refrigeration), and may provide a route to eliminate them entirely in future (see Spotlight on: F-gases), but this issue remains far less significant than the elimination of diesel.
These results suggest the policy focus should be widened to tackle not just F-gases but also the more significant issue of CO2 emissions from TRU diesel consumption – especially since diesel powered TRUs emit grossly disproportionate amounts of NOx and PM.
Greenhouse gases
It may be hard to believe, but the TRU cooling an articulated trailer emits many times more NOx and PM over the course of a year than the (Euro VI) main propulsion engine hauling it around. This situation has developed because the ‘Euro’ regulations covering truck propulsion engines have become far more stringent over the past 20 years, whereas TRU emissions remain effectively unregulated.
Current legislationTRUs are covered by the EU Non-Road Mobile Machinery (NRMM) regulations, but at present these impose no emissions limits whatsoever on engines rated at less than 19kW – which includes all TRUs. Brussels is soon expected to approve legislation revising the regulations to match existing standards in the US, but these are hardly stringent.
NOx and PM
F-gasesNew EU F-gas regulations mean that from January 2015 refrigerated transport operators must record and report leakage rates. The same regulations will also reduce the volume of F-gases available in the EU to scarcely a fifth of current levels by 2030, so the market will be forced to find alternatives.
Although F-gases are extremely potent greenhouse gases, our modelling suggests refrigerant leakage accounts for only 17% of the lifecycle greenhouse gas emissions of Europe’s TRU fleet, with around 90% of the remainder due to the burning of diesel fuel. So although it is clearly important to minimise and eventually eliminate F-gas leakage, it is even more important to eliminate the CO2 emissions from TRU diesel consumption – for example, through the use of liquid air or nitrogen.
Nevertheless, liquid air TRUs do address the problem of F-gas emissions in two ways. In the short term, since most of the cooling is provided by the evaporation of liquid nitrogen, the secondary, vapour compression cycle has far less cooling work to do, and needs only around half the F-gas ‘charge’ of an equivalent diesel unit. As a result, the volume of leaks should be proportionately smaller.
In the longer term, liquid air TRUs could be designed to work with natural refrigerant gases such as CO2, which are climate neutral. The problem with these has been that they tend to become far less efficient when ambient temperatures exceed 20-23°C, but liquid air TRUs could provide a solution. Since they run on cryogenic liquids, these TRUs are able to ‘subcool’ their compressors to maintain their efficiency even at higher ambient temperatures. Subcooling already doubles the efficiency of an F-gas vapour compression cycle on a liquid air TRU compared to a diesel unit, and may make the difference between CO2 being a practical possibility in transport refrigeration or not.
Engine emission regulation evolution
Euro I Euro II Euro III Euro IV Euro V Euro VI0%
20%
40%
60%
80%
100%
120%
140%
160%
180%
TRU engine NOx and PM baseline limitsHGV engine PM limit
HGV engine NOx limit
(1993) (1999) (2001) (2006) (2009) (2014)
133,3%
153,0%
116,7%
62,5%
83,3%
25,0%
58,3%
5,0%
33,3%
5,0% 6,7%2,5%
Figure 1: Euro truck engine emission standards compared to the proposed NRMM Stage 5 TRU standard. Source: European Commission; DieselNet.9
Engine emission regulation evolution
Euro I Euro II Euro III Euro IV Euro V Euro VI0%
20%
40%
60%
80%
100%
120%
140%
160%
180%
TRU engine NOx and PM baseline limitsHGV engine PM limit
HGV engine NOx limit
(1993) (1999) (2001) (2006) (2009) (2014)
133,3%
153,0%
116,7%
62,5%
83,3%
25,0%
58,3%
5,0%
33,3%
5,0% 6,7%2,5%

Liquid Air on the European Highway 13Liquid Air on the European Highway12
Figure 1 compares the amount of NOx and PM that successive generations of European truck propulsion engines have been allowed to emit against a baseline of what TRUs will be allowed to emit under the new standards. This shows that for each kWh produced, the latest Euro VI propulsion engine is allowed to emit only 7% of the NOx allowed for a TRU, and just 2,5% of the PM. In other words, under the new European standards, a trailer TRU will still be allowed to emit 15 times more NOx and 40 times more PM per unit of energy consumed than the tractor unit pulling it around.
Disproportionate NOx & PM emissions
A TRU consumes less energy than a propulsion engine, however, so the annual emissions comparison is not quite as extreme, but shocking nonetheless. Based on standard duty cycle assumptions10, we calculate that over the course of a year a diesel TRU currently emits up to six times as much NOx and 29 times as much PM as the Euro VI truck pulling it around (Table 2). Compared to a Euro 6 diesel car, a diesel TRU is likely to emit 93 times as much NOx and 165 times as much PM.
Smaller TRUs – those used in vans and a minority of trucks – are driven by the vehicle’s propulsion engine through a belt drive or an alternator.
NOx and PM emissions from this source may decline over time, as the fleet is progressively replaced with cleaner Euro VI propulsion engines – although against that, these engines may still need to idle continuously when the van is stationary to keep the cargo cool. But larger TRUs, used in the majority of trucks and virtually all articulated
trailers, are powered by a separate diesel engine, and the emissions from these engines will be scarcely constrained even after the new NRMM Stage 5 standards have been introduced.
If nothing more is done, the significance of truck and trailer TRU emissions will only grow as propulsion engines are progressively replaced with cleaner Euro VI models over the next decade.
Our modelling suggests each truck TRU currently emits 67kg of NOx and 9kg of PM per year, and each trailer TRU almost 100kg and 14kg. A liquid air TRU would eliminate NOx and PM emissions altogether – as well as reducing the F-gas charge and leakage by around half, and progressively reducing lifecycle greenhouse gas emissions.
Table 2: TRU emissions compared to Euro VI trucks and Euro 6 diesel cars. Sources: European
Commission; DieselNet.12
Calculating the social cost of transport refrigeration
We have calculated the social cost of transport refrigeration by combining the ‘damage costs’ of NOx and PM emissions to health, crops and infrastructure, and the ‘abatement cost’ of its emissions of greenhouse gases including carbon dioxide and HFC refrigerants. Together these costs represent the burden to society of continuing to base our cold chains on diesel-powered TRUs. First we modelled the fuel consumption and emissions of TRUs, based on detailed TRU fleet and duty cycle data provided by Cemafroid and other industry sources, and our own analysis of TRU NOx and PM emissions, and made the conservative assumption that fleets would grow at just 1,5% per year for the next decade. These results were then combined with damage and abatement cost factors calculated by Ricardo-AEA for the European Commission13 to produce the social costs of a business-as-usual
approach in each country and the EU as a whole. Finally we calculated the progressively larger reductions in emissions and social cost that could be achieved by converting to liquid air transport refrigeration over the next 10 years.
The ‘damage costs’ of NOx and PM are estimates of the costs imposed by those pollutants in terms of hospital treatment, premature death, lost life and productivity, and damage to buildings and crops, and they vary according to the wealth of each country. The ‘abatement costs’ of CO2 and HFCs are an estimate of the cost of avoiding a given amount of emissions by the cheapest means possible. The figure calculated by Ricardo-AEA for the entire EU, and consistent with keeping global warming within 2°C, is €90 per tonne. For a full explanation of damage costs, abatement costs and our methodology, please see Appendix 3.
Modelling results
These results demonstrate the benefits to be gained from a progressive conversion over the next decade to liquid air TRUs – those which extract both cooling and mechanical power from the same tank of liquid air or liquid nitrogen. These benefits could not be achieved by evaporation only systems – such as those from Cryofridge, Frostcruise, natureFridge and blueeze – which are far less efficient and deeply uncompetitive against diesel (for more detail please see Spotlight on: Zero-emission transport refrigeration and the case for fuel duty reform or Appendix 2).
NOx and PM savings
The results are broadly consistent across all 28 EU member states, but with some variation due to national factors such as grid carbon intensity and exact proportion of vans, trucks and trailers in each national TRU fleet.
In 2025 the fleet-weighted average14 TRU in the EU28 would save: • almost 4 000 litres of diesel per vehicle per year;• reduce greenhouse gas emissions by 7tCO2e,
including 1,6tCO2e from F-gas leakage;• reduce NOx emissions by 40kg and PM by 5kg.
In aggregate, the EU28 economies would save 4,7 billion litres of diesel per year by 2025, and almost 21,7 billion litres in the decade 2016-2025 – worth almost €30 billion at average EU prices in 2014.15 Greenhouse gas emissions would fall by 36mtCO2e
over ten years – including almost 7mtCO2e from refrigerant leakage – and by 8mtCO2e in 2025 alone. NOx emissions would decline by 224 000 tonnes and 47 000 tonnes; PM by over 30 000 tonnes and almost 6 000 tonnes respectively. Since diesel TRUs are effectively unregulated and emit much more local air pollution than a modern Euro VI propulsion engine, the annual savings are the NOx equivalent of retiring: • 2 million trucks, more than the EU’s entire fleet of
articulated trailers16, or • 30 million Euro 6 diesel cars. They are the PM equivalent of scrapping:• 12 million Euro VI trucks from service – almost a
third of the EU’s entire fleet of rigid trucks,17 or • 65 million diesel cars.
Economic value of the social benefit
In 2025, the annual economic value of the social benefits – ie including environment and health and excluding fuel – would total €1,9 billion. The cumulative social benefits for 2016-25, assuming a progressive conversion to liquid air TRUs over the next decade, would be worth €8,7 billion (Table 3).
In 2025, the average TRU would generate social benefits – quite apart from any cost savings to its owners – worth more than €1 700 per vehicle. The cumulative social benefit divided among all the TRUs sold over a decade amounts to €7 500 per vehicle.
Liquid Air on the European Highway 15Liquid Air on the European Highway14
Table 3: The economic value of the environmental and social benefits of a complete conversion to liquid air transport refrigeration by 2025. NB. these figures exclude any direct financial savings made by the owners of liquid air TRUs.
Germany
As shown in Table 3, the German TRU fleet grows to 209 000 vehicles by 2025, remaining the largest in Europe, and if it converted entirely to liquid air over that period, Germany would save 923 million litres of diesel per year in 2025 and 4,4 billion over the decade. Within ten years its greenhouse gas emissions reductions would reach 1,3mtCO2e per year and a cumulative 5mtCO2e. Annual NOx emissions would fall by 9 500 tonnes, and PM by 1 200 tonnes. The social cost of transport refrigeration to Germany would fall by €466 million per year and €2 billion over the decade.
France
In France, the TRU fleet grows to 174 000 by 2025, which if fully converted to liquid air would save 3 billion litres of diesel over a decade and almost 660 million litres in the final year. Greenhouse gas emissions would fall by 8,5mtCO2e over ten years and 1,9mtCO2e in 2025 alone. NOx emissions would shrink by 6 500 tonnes in 2025 and almost 31 000 tonnes over the decade. For PM the savings are 860 tonnes and 4 000 tonnes respectively. The social savings – ie excluding fuel – would be worth €340 million in 2025, and €1,5 billion between now and then.
Spain
Spain’s fleet remains the third largest in Europe and grows to 139 000 TRUs in 2025. By then the progressive conversion to liquid air would have saved a cumulative 2,4 billion litres of diesel, with savings of over 500 million litres in the final year alone. Greenhouse gas emissions reductions would reach 4mtCO2e over the decade and more than 930 000 tonnes in 2025. Emissions of NOx would fall by 23 500 tonnes and those of PM by 3 000 tonnes over ten years, and by 4 800 tonnes and 630 tonnes respectively in the final year. The social costs of transport refrigeration in Spain would fall by €151 million per year in 2025 and €666 million over the decade.
Italy
The Italian TRU fleet grows to 133 000 by 2025, by when the country would have saved €903 million in social costs; the annual savings would grow to €194 million by 2025. In addition there would be fuel savings of 452 million litres of diesel in 2025, and 2,1 billion litres over the decade. This in turn would reduce NOx emissions by 4 200 tonnes in 2025 and 21 000 tonnes over ten years. PM emissions would fall by 552 tonnes and 2 800 tonnes respectively. Greenhouse gas emissions would drop by 1mtCO2e in 2025, and 4,8mtCO2e over the decade.
Britain
In Britain the TRU fleet grows to more than 97 000 by 2025, when it would save the country 340 million litres of diesel, the final instalment of a ten-year saving of 1,5 billion litres. Greenhouse gas emissions would fall by 661 000tCO2e in 2025 and 2,4mtCO2e during 2016-2025. NOx emissions decline by almost 15 700 tonnes over the decade and 3 400 tonnes in 2025; PM would fall by almost 2 000 tonnes and 440 tonnes respectively. The social cost of transport refrigeration in the UK would fall by €123 million in 2025 and €502 million over the preceding decade.
Netherlands
Netherlands’ TRU fleet grows to almost 41 000 in 2025, and if fully converted to liquid air would deliver annual emissions savings of 262 000tCO2e, 2 100tNOx and 284tPM. Over the course of ten years, the cumulative savings would reach of 1mtCO2e, 9,900tNOx and 1 300tPM. As a result the social cost of transport refrigeration to Netherlands would fall by €88 million in 2025 and €378 million during 2016–2025. The country would also save over 917 million litres of diesel over the decade and 201 million litres in the final year.
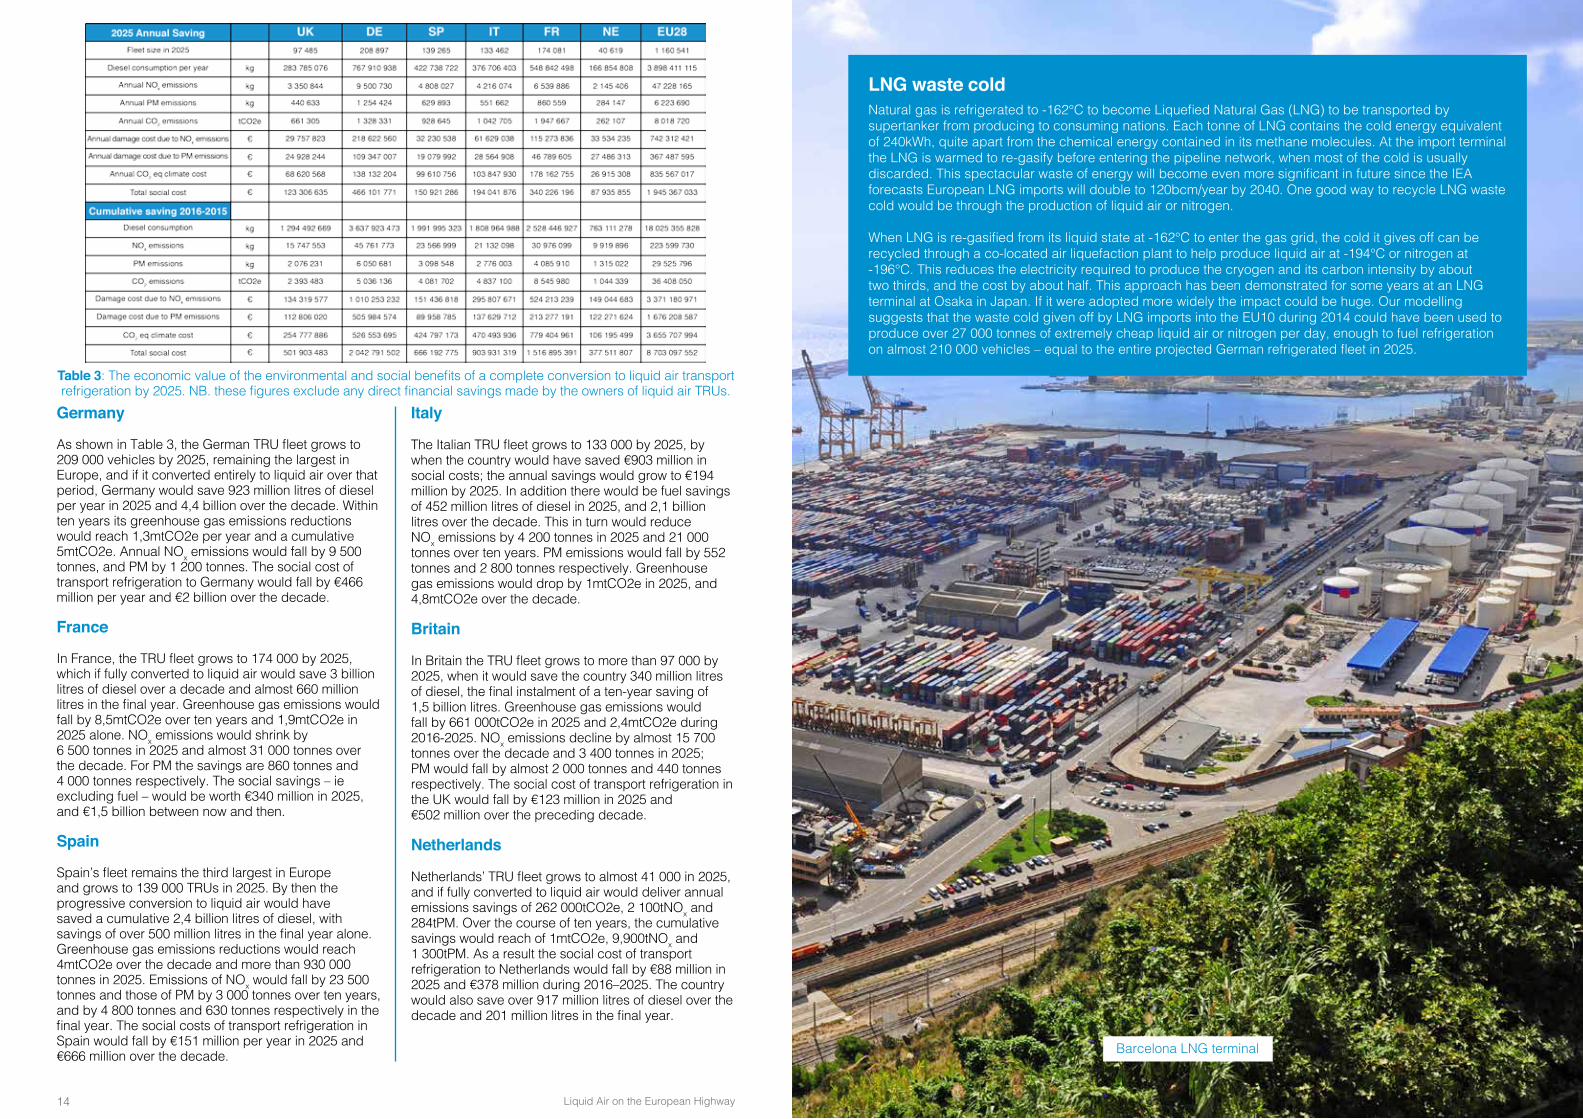
LNG waste coldNatural gas is refrigerated to -162°C to become Liquefied Natural Gas (LNG) to be transported by supertanker from producing to consuming nations. Each tonne of LNG contains the cold energy equivalent of 240kWh, quite apart from the chemical energy contained in its methane molecules. At the import terminal the LNG is warmed to re-gasify before entering the pipeline network, when most of the cold is usually discarded. This spectacular waste of energy will become even more significant in future since the IEA forecasts European LNG imports will double to 120bcm/year by 2040. One good way to recycle LNG waste cold would be through the production of liquid air or nitrogen.
When LNG is re-gasified from its liquid state at -162°C to enter the gas grid, the cold it gives off can be recycled through a co-located air liquefaction plant to help produce liquid air at -194°C or nitrogen at -196°C. This reduces the electricity required to produce the cryogen and its carbon intensity by about two thirds, and the cost by about half. This approach has been demonstrated for some years at an LNG terminal at Osaka in Japan. If it were adopted more widely the impact could be huge. Our modelling suggests that the waste cold given off by LNG imports into the EU10 during 2014 could have been used to produce over 27 000 tonnes of extremely cheap liquid air or nitrogen per day, enough to fuel refrigeration on almost 210 000 vehicles – equal to the entire projected German refrigerated fleet in 2025.
Barcelona LNG terminal
Liquid Air on the European Highway 17Liquid Air on the European Highway16
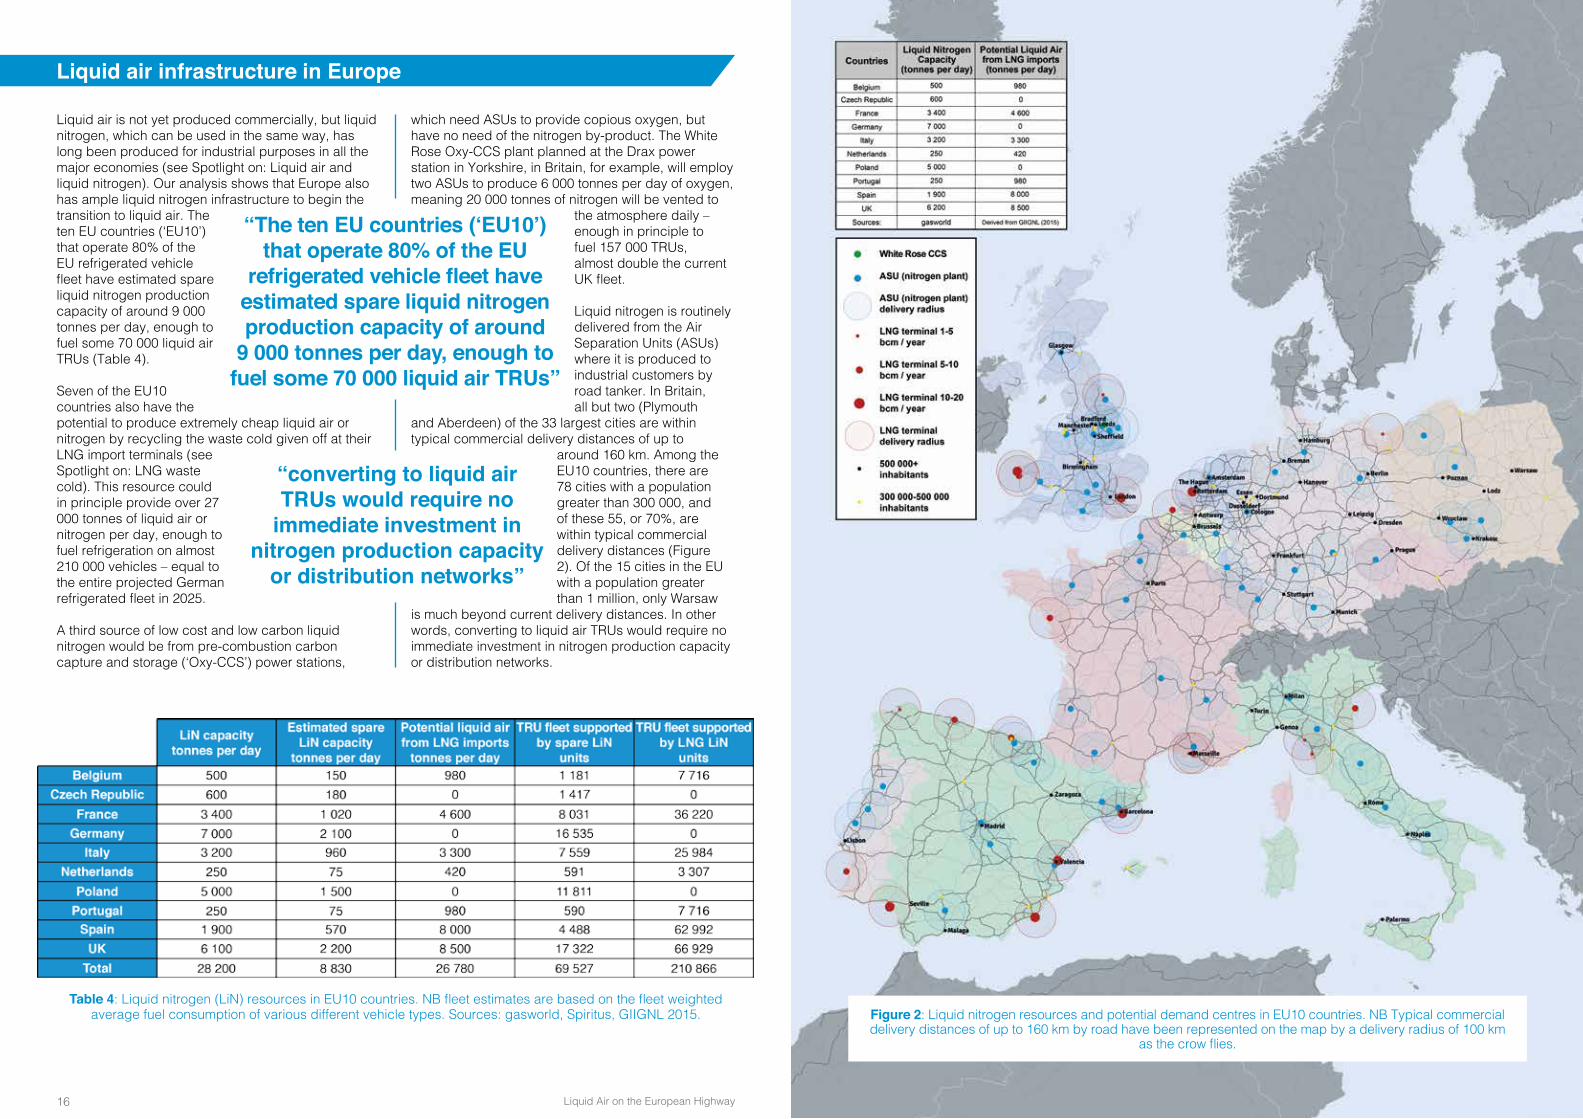
Table 4: Liquid nitrogen (LiN) resources in EU10 countries. NB fleet estimates are based on the fleet weighted average fuel consumption of various different vehicle types. Sources: gasworld, Spiritus, GIIGNL 2015.
Liquid air infrastructure in Europe
Liquid air is not yet produced commercially, but liquid nitrogen, which can be used in the same way, has long been produced for industrial purposes in all the major economies (see Spotlight on: Liquid air and liquid nitrogen). Our analysis shows that Europe also has ample liquid nitrogen infrastructure to begin the transition to liquid air. The ten EU countries (‘EU10’) that operate 80% of the EU refrigerated vehicle fleet have estimated spare liquid nitrogen production capacity of around 9 000 tonnes per day, enough to fuel some 70 000 liquid air TRUs (Table 4).
Seven of the EU10 countries also have the potential to produce extremely cheap liquid air or nitrogen by recycling the waste cold given off at their LNG import terminals (see Spotlight on: LNG waste cold). This resource could in principle provide over 27 000 tonnes of liquid air or nitrogen per day, enough to fuel refrigeration on almost 210 000 vehicles – equal to the entire projected German refrigerated fleet in 2025.
A third source of low cost and low carbon liquid nitrogen would be from pre-combustion carbon capture and storage (‘Oxy-CCS’) power stations,
which need ASUs to provide copious oxygen, but have no need of the nitrogen by-product. The White Rose Oxy-CCS plant planned at the Drax power station in Yorkshire, in Britain, for example, will employ two ASUs to produce 6 000 tonnes per day of oxygen, meaning 20 000 tonnes of nitrogen will be vented to
the atmosphere daily – enough in principle to fuel 157 000 TRUs, almost double the current UK fleet.
Liquid nitrogen is routinely delivered from the Air Separation Units (ASUs) where it is produced to industrial customers by road tanker. In Britain, all but two (Plymouth
and Aberdeen) of the 33 largest cities are within typical commercial delivery distances of up to
around 160 km. Among the EU10 countries, there are 78 cities with a population greater than 300 000, and of these 55, or 70%, are within typical commercial delivery distances (Figure 2). Of the 15 cities in the EU with a population greater than 1 million, only Warsaw
is much beyond current delivery distances. In other words, converting to liquid air TRUs would require no immediate investment in nitrogen production capacity or distribution networks.
“The ten EU countries (‘EU10’) that operate 80% of the EU
refrigerated vehicle fleet have estimated spare liquid nitrogen production capacity of around
9 000 tonnes per day, enough to fuel some 70 000 liquid air TRUs”
“converting to liquid air TRUs would require no
immediate investment in nitrogen production capacity
or distribution networks”
Figure 2: Liquid nitrogen resources and potential demand centres in EU10 countries. NB Typical commercial delivery distances of up to 160 km by road have been represented on the map by a delivery radius of 100 km
as the crow flies.

Liquid Air on the European Highway 19Liquid Air on the European Highway18
Liquid air transport refrigeration
Liquid air is a novel form of energy storage that could eliminate the NOx and PM emissions from transport refrigeration and progressively shrink its carbon footprint. It has been recognised by the European Road Transport Research Advisory Council (ERTRAC) as an energy carrier with ‘significant potential’ to help achieve the EU’s 2050 transport greenhouse gas emissions reductions target.18
‘Free’ cold from liquid air
Air turns to liquid when refrigerated to around -196°C at ambient pressure, and can be conveniently stored in insulated but unpressurised vessels. Exposure to heat – even at ambient temperatures – causes it to boil and expand 700-fold in volume, and this expansion can be used to drive a turbine or piston engine. The only exhaust is clean cold air. As liquid air expands into a gas it also gives off large amounts of valuable cold, which can be used to provide ‘free’ refrigeration or air conditioning, and this makes it an ideal energy carrier for transport refrigeration – far more efficient and economic than other zero-emission technologies.
Transport refrigeration systems that work simply by evaporating liquid nitrogen through a heat exchanger in the refrigerated goods compartment have existed for some time. These evaporation-only systems, including those from Cryofridge, Frostcruise, natureFridge and blueeze, have no means of recovering the mechanical energy available from the evaporation, and so are less efficient and deeply uncompetitive against diesel.
The Dearman liquid air TRU, by contrast, extracts both cooling and mechanical power, meaning it produces
around 80% more cooling from the same tank of cryogen. Nor are evaporation-only systems strictly zero-emission, since the power to run the refrigeration system’s pumps and fans must be provided by the vehicle’s main engine, whereas in the
Dearman TRU this energy (and more) is produced by the expansion of liquid air. The Dearman system has the lowest lifecycle costs of all zero-emission, low-carbon alternatives to the diesel TRU – for more detail see Spotlight on: Zero-emission transport refrigeration and the case for fuel duty reform or Appendix 2.
The invention of the Dearman engine
The Dearman engine was invented by Peter Dearman, a classic British ‘garden shed’ inventor, and runs on liquid air or nitrogen. It is now being developed by Dearman (the company) to perform a variety of roles. The engine is being tested as a TRU on a vehicle at present, and is due to start fleet trials in 2016.
In the Dearman TRU, liquid nitrogen is stored at -196°C at ~3bar in a cryogenic vessel until needed. Then it is pumped to ~40bar and transferred to a vaporising heat exchanger in the goods compartment, where it absorbs heat from the goods and provides around two thirds of the cooling.
Figure 3: The Dearman engine power cycle.
The absorbed heat causes the liquid nitrogen to turn into a cold gas, which is then injected into the cylinder of the Dearman engine along with some water that has been warmed to room temperature. The nitrogen now absorbs heat from the water and expands, driving the piston down to generate shaft power. This shaft power is used to drive secondary systems such as pumps and fans, and also a secondary, conventional vapour compression cooling system, which provides around one third of the cooling.
The heat removed from the goods compartment by the secondary system is then used to re-warm the water in the engine – a clever synergy that further raises the efficiency of the TRU. Because the secondary cooling system need only provide one third of the cooling, its F-gas charge is around half the mass required for a conventional, diesel powered TRU, meaning the volumes that leak are smaller and less damaging. For more detail see Appendix 1.
“The only exhaust is
clean cold air”
Figure 4: The COOL-E project in on-vehicle testing at HORIBA MIRA.
Cold and power research – The University of Birmingham“The cold and power laboratory in the school of mechanical engineering is addressing cold and power process challenges with the development of high efficiency heat and cold exchange devices. Our work supports that undertaken by Dearman, which is developing a piston engine that runs on liquid air, delivering both power and cold, which can serve as an efficient and zero-emission transport refrigeration unit (TRU). The research group comprises academics, researchers, students and a technician. The group is a key partner in a project to deliver a bench prototype of an Auxiliary Power Unit in 2016. The project is funded by Innovate UK and in partnership with Dearman, Hubbard Products Ltd and Air Products. The facilities contain bespoke engine testing chambers for modified cryogenic Stirling engines and a Dearman engine as well as a tribological suite to examine physics of ‘cold’ contact.”
Dr Karl D DearnLecturer in Mechanical Engineering, School of Mechanical Engineering The University of Birmingham
Liquid Air on the European Highway 21Liquid Air on the European Highway20
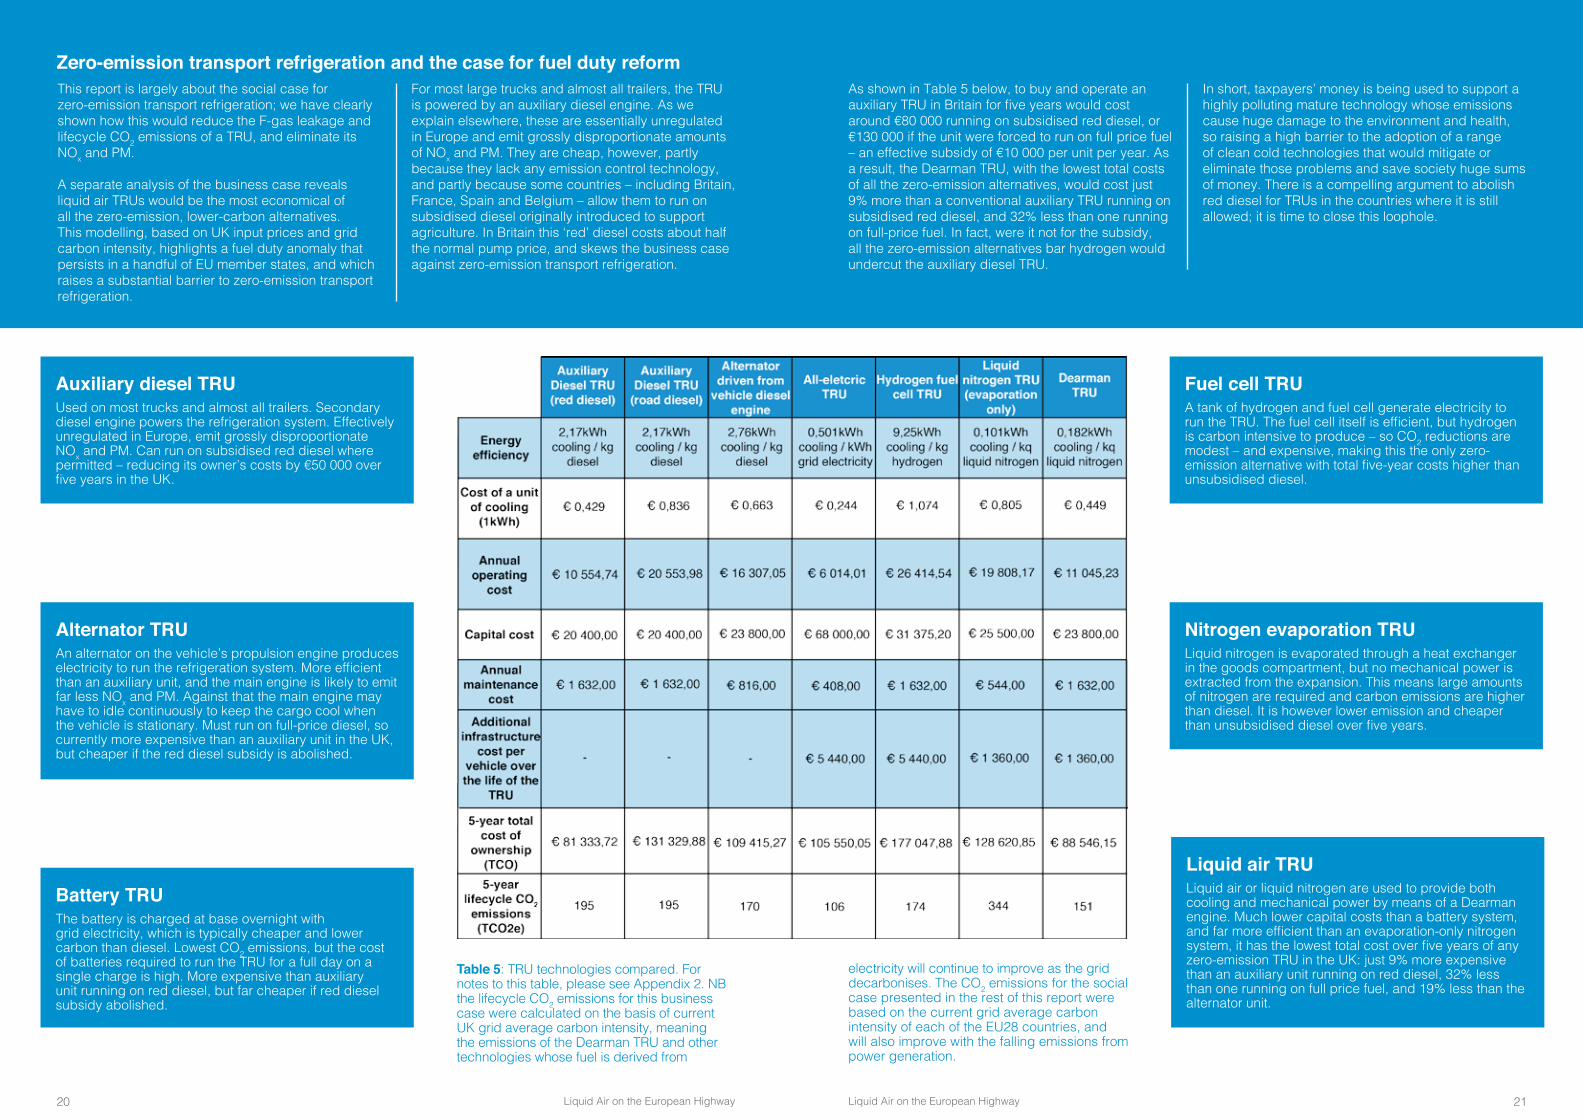
Table 5: TRU technologies compared. For notes to this table, please see Appendix 2. NB the lifecycle CO2 emissions for this business case were calculated on the basis of current UK grid average carbon intensity, meaning the emissions of the Dearman TRU and other technologies whose fuel is derived from
This report is largely about the social case for zero-emission transport refrigeration; we have clearly shown how this would reduce the F-gas leakage and lifecycle CO2 emissions of a TRU, and eliminate its NOx and PM.
A separate analysis of the business case reveals liquid air TRUs would be the most economical of all the zero-emission, lower-carbon alternatives. This modelling, based on UK input prices and grid carbon intensity, highlights a fuel duty anomaly that persists in a handful of EU member states, and which raises a substantial barrier to zero-emission transport refrigeration.
For most large trucks and almost all trailers, the TRU is powered by an auxiliary diesel engine. As we explain elsewhere, these are essentially unregulated in Europe and emit grossly disproportionate amounts of NOx and PM. They are cheap, however, partly because they lack any emission control technology, and partly because some countries – including Britain, France, Spain and Belgium – allow them to run on subsidised diesel originally introduced to support agriculture. In Britain this ‘red’ diesel costs about half the normal pump price, and skews the business case against zero-emission transport refrigeration.
Auxiliary diesel TRUUsed on most trucks and almost all trailers. Secondary diesel engine powers the refrigeration system. Effectively unregulated in Europe, emit grossly disproportionate NOx and PM. Can run on subsidised red diesel where permitted – reducing its owner’s costs by €50 000 over five years in the UK.
Alternator TRUAn alternator on the vehicle’s propulsion engine produces electricity to run the refrigeration system. More efficient than an auxiliary unit, and the main engine is likely to emit far less NOx and PM. Against that the main engine may have to idle continuously to keep the cargo cool when the vehicle is stationary. Must run on full-price diesel, so currently more expensive than an auxiliary unit in the UK, but cheaper if the red diesel subsidy is abolished.
Battery TRUThe battery is charged at base overnight with grid electricity, which is typically cheaper and lower carbon than diesel. Lowest CO2 emissions, but the cost of batteries required to run the TRU for a full day on a single charge is high. More expensive than auxiliary unit running on red diesel, but far cheaper if red diesel subsidy abolished.
Fuel cell TRUA tank of hydrogen and fuel cell generate electricity to run the TRU. The fuel cell itself is efficient, but hydrogen is carbon intensive to produce – so CO2 reductions are modest – and expensive, making this the only zero-emission alternative with total five-year costs higher than unsubsidised diesel.
Nitrogen evaporation TRULiquid nitrogen is evaporated through a heat exchanger in the goods compartment, but no mechanical power is extracted from the expansion. This means large amounts of nitrogen are required and carbon emissions are higher than diesel. It is however lower emission and cheaper than unsubsidised diesel over five years.
Liquid air TRULiquid air or liquid nitrogen are used to provide both cooling and mechanical power by means of a Dearman engine. Much lower capital costs than a battery system, and far more efficient than an evaporation-only nitrogen system, it has the lowest total cost over five years of any zero-emission TRU in the UK: just 9% more expensive than an auxiliary unit running on red diesel, 32% less than one running on full price fuel, and 19% less than the alternator unit.
Zero-emission transport refrigeration and the case for fuel duty reform As shown in Table 5 below, to buy and operate an auxiliary TRU in Britain for five years would cost around €80 000 running on subsidised red diesel, or €130 000 if the unit were forced to run on full price fuel – an effective subsidy of €10 000 per unit per year. As a result, the Dearman TRU, with the lowest total costs of all the zero-emission alternatives, would cost just 9% more than a conventional auxiliary TRU running on subsidised red diesel, and 32% less than one running on full-price fuel. In fact, were it not for the subsidy, all the zero-emission alternatives bar hydrogen would undercut the auxiliary diesel TRU.
In short, taxpayers’ money is being used to support a highly polluting mature technology whose emissions cause huge damage to the environment and health, so raising a high barrier to the adoption of a range of clean cold technologies that would mitigate or eliminate those problems and save society huge sums of money. There is a compelling argument to abolish red diesel for TRUs in the countries where it is still allowed; it is time to close this loophole.
electricity will continue to improve as the grid decarbonises. The CO2 emissions for the social case presented in the rest of this report were based on the current grid average carbon intensity of each of the EU28 countries, and will also improve with the falling emissions from power generation.

Local air pollution and TRUs – the case for action in cities
The negative effect of air pollution on health
Local air pollution is rising rapidly up the political agenda, and with good reason; according to the European Environment Agency it causes more than 400 000 premature deaths through respiratory and heart disease in the EU each year.19 In fact, this may be a gross underestimate since estimates are based on the known impacts of particulate matter (PM), but exclude those of nitrogen oxides (NOx). Since the two pollutants typically occur together it has been difficult to disentangle their impact, but recent work suggests NOx causes significant additional damage20, and one study concluded there is evidence that the impact of nitrogen dioxide (NO2) on long-term mortality is “as great as that of PM2,5”.21
In Britain, the government recently updated its guidance and concluded that NOx and PM cause 44,750 - 52,500 premature deaths and cost society £25.3bn - £29.7 billion each year.22
Emissions of both PM and NOx have fallen substantially over the last decade, but a study of 400 cities by the European Environment Agency has found that almost all city dwellers are still exposed to levels of pollution considered unsafe by the World Health Organisation23, and most countries are still in breach of EU pollution laws introduced in 2010. Independent campaigners and the European Commission have won judgements against the UK in the European Court of Justice and Britain’s Supreme Court, forcing the government to deliver a new air pollution reduction strategy to Brussels by the end of 2015. The Commission has recently referred Belgium and
Bulgaria to the Court of Justice, and issued warnings to Sweden and Poland.24 In total, 24 countries of the EU28 have zones in breach of legal limits for NOx or PM or both (see Appendix 3). Stricter policies on air pollution are, it seems, inevitable across the EU.
Diesel emissions from road transport
Road transport is the biggest single source of NOx in the EU, responsible for over 40% of total emissions25, and an even higher proportion in cities, where the health impacts are greatest: 48% in London and Barcelona26; 56% in Paris – of which 94% comes from diesel vehicles.27 Diesel emissions make commercial transport a disproportionate culprit, but the most disproportionate is the diesel-powered TRU.
Poor emissions data for cities
Beyond these headline figures, however, we have found that transport and emissions data for individual cities is often extremely poor. To estimate the impact of transport refrigeration in a city requires data for vehicle emissions, and kilometres driven, to be segmented between vans, trucks and trailers.
For two of our intended case studies, Paris and Milan, this information is simply not available. In Paris, for example, kilometres driven is given only for ‘commercial vehicles’, a category that lumps together not only vans, trucks and trailers, but also buses and coaches. Emissions data for Paris is broken down only as far as ‘road transport’, which includes not only commercial vehicles but also cars. In Milan, data is similarly problematic, and available only for the entire Lombardy region.
This lack of segmented city-level data would render any attempt to analyse the true impact of transport refrigeration highly speculative, and we recommend that national governments and city authorities should act quickly to improve the quality and granularity of their transport and emissions data. You cannot manage what you cannot measure.
London is recognised as an exception, and does have segmented data for both vehicle emissions and kilometres driven. Combining this with figures for TRU penetration of commercial vehicle segments in the national fleet, we estimate that refrigerated vans, trucks and trailers travel 84,6 million km in London each year, where they emit more than 49 000 tonnes of CO2, 163 tonnes of NOx and 22 tonnes of PM. That is the CO2 equivalent of driving a family car28 447 million km – almost 2,4 million laps around London’s M25 orbital motorway or 11 200 times around the world. Replacing those TRUs with zero-emission units would be the PM equivalent of taking 327 000 Euro 6 diesel cars or almost 30 000 Euro VI diesel trucks off Britain’s roads.
HGV transport refrigeration emissions
Even more striking, however, is the disproportionate impact of transport refrigeration in the context of HGV exhaust emissions in London. Of the total 84,6 million km travelled by refrigerated vehicles, trucks and trailers with TRUs travel 62,6 million km,
which equals 7% of the total distance travelled in London by all HGVs. In stark contrast, the NOx emissions from truck and trailer TRUs in Central London equate to 41,3% of those from HGV exhausts in the same area; while PM emissions from truck and trailer TRUs in Greater London equate to 76,7% of those from HGV exhausts. Far more NOx and PM is
produced from HGV brakes and tyres, but the tailpipe-only comparison is a powerful illustration of the extent of TRU pollution, and the ‘easy win’ that could be achieved by tackling it.
New Ultra Low Emission Zones
Major cities such as Paris and London are planning to introduce strict ultra-low emission zone policies in 2020 which either ban diesel vehicles or charge them for entering the zone. It also seems likely that the British government’s new air pollution strategy will have to include some kind of national network of low emission zones to meet EU standards. Since emissions from diesel TRUs are so disproportionate, and since economically competitive zero-emission transport refrigeration will be available, there is now a strong argument to include TRUs in such schemes. Some preparatory steps towards this are already being taken: in London, officials are considering how to include emissions from TRUs in the next edition of the London Atmospheric Emissions Inventory, due to be published in 2017.29
“Road transport is the biggest single source of NOx in
the EU, responsible for over 40% of total emissions”

Liquid Air on the European Highway 25Liquid Air on the European Highway24
Conclusions
The analysis conducted for this report demonstrates a compelling case to support the development of liquid air transport refrigeration across the EU: • The social costs of diesel powered transport
refrigeration are high, grossly disproportionate and provide a strong argument for policy support for zero-emission alternatives;
• Liquid air transport refrigeration would eliminate NOx and PM emissions; deliver substantial and progressively larger reductions in greenhouse gas emissions; and could provide an efficient route to eliminating damaging F-gases entirely;
• The average annual benefit to society of each zero-emission TRU in 2025 is €1 700, in addition to any direct savings made by owners of the equipment;
• Europe has ample liquid nitrogen infrastructure to support the shift to liquid air transport refrigeration;
• Policy around TRUs is currently focussed on F-gases, which – although important – account for only 17% of aggregate TRU lifecycle greenhouse gas emissions, whereas diesel is responsible for most of the rest, and all of the NOx and PM;
• The NRMM regulations provide no incentive for the industry to make meaningful reductions in TRU emissions of NOx and PM, even after the proposed new standards become law;
• Policy should be re-set to focus not only on F-gases but on the larger problem of reducing TRU diesel emissions. If it is too late to tighten the new standards proposed for NRMM Stage 5, other measures should be found;
• Since NOx and PM emissions are especially damaging in cities, TRU emissions should be regulated under Low Emission Zones;
• In a handful of countries, including Britain, France, Spain and Belgium, TRUs are still permitted to run on subsidised ‘red’ diesel, meaning that taxpayer’s money is being used to support a mature, highly polluting technology, creating a high barrier against the adoption of zero-emission transport refrigeration technologies that would otherwise undercut diesel; it is time to close this loophole;
• Many major cities such as Paris and Milan lack the data needed to estimate the impact of TRU emissions, and we recommend that national governments and city authorities should act quickly to improve the quality and granularity of their transport and emissions data; you cannot manage what you cannot measure.
“The average annual benefit to society of each
zero-emission TRU in 2025 is €1 700”
“The policy should be re-set to focus not
only on F-gases but on the larger problem of reducing TRU diesel
emissions”

Liquid Air on the European Highway 27Liquid Air on the European Highway26
Appendix 1: The Dearman technology
1.1. The Dearman engine
The Dearman engine is a novel piston engine driven by the vaporisation and expansion of liquid air or liquid nitrogen (LiN) to produce clean cold and power. Cryogenic expansion engines are not new, previous embodiments have worked on an open Rankine cycle akin to a traditional steam engine but operating across a different temperature range, expanding the gaseous LiN over several stages. The Dearman engine process innovation involves the use of a heat exchange fluid (HEF) inside the cylinder of the engine as a source of heat for the expanding LiN enabling a more efficient, nearly isothermal expansion. Ambient or low grade waste heat is used as an energy source with the LiN providing both the working fluid and heat sink. An example power cycle is shown in Figure 3. A further advantage of this approach is that the engine remains at nearly constant near-ambient temperature offering greater flexibility with materials choices.
Some key qualities of the Dearman engine are:• Ability to use a low grade or ambient source
of heat – e.g. heat rejected from a refrigerator condenser at around 50% thermal efficiency;
• Presence of low temperature working fluids, which can be used to assist refrigeration;
• A relatively high consumption of liquid air (~10x mass of ‘fuel’ per unit of energy delivered as mechanical power, compared to an ICE);
• Low capital cost and embedded CO2 (few ‘exotic’ materials in the engine or cryogenic tank);
• Zero-emissions except for air or nitrogen;• Use of a non-flammable ‘fuel’;• Fast refuelling.
The Dearman engine exploits the expansion between liquid and gaseous phases of a cryogenic working fluid so it can operate using liquid air or nitrogen, with only slightly differing performance characteristics.
1.2. What is liquid air?
Liquid air is an intermediate step in the production of industrial gas products like liquid nitrogen, oxygen and argon. It is made by compressing ambient air and rejecting heat in a series of stages until the air’s temperature is reduced to -196°C where it becomes a liquid. Typically, the air is then allowed to boil in a distillation column where it is separated into its fractions; nitrogen, oxygen and argon. Liquid nitrogen and air are zero-emission fuels at their point of use, offering the same potential for dramatic local air quality improvement as electricity or hydrogen. However, greenhouse gases from the liquefaction process require consideration as the liquefaction plant is usually electrically powered. The capability to operate intermittently combined with very low cost of bulk storage means that liquefaction plants are very suitable for pairing with intermittent renewables, offering significant opportunities for further carbon reduction. It also allows industrial gas producers to adapt the plant’s utilisation profile to market conditions – in territories where there is a peak/off-peak price differential for electricity, plants tend to be used at lower capacity during peak times and higher capacity during off-peak times. In terms of infrastructure, we estimate that the 1 countries that operate 80% of the EU TRU fleet have over 28 000 tonnes per day of spare liquid nitrogen production capacity, enough to fuel almost 70 000 liquid air TRUs (see Summary, Table 4).
The Dearman engine
1.3. How does the Dearman TRU work?
In the Dearman system, refrigeration is provided by two means (Figure 3). First, latent heat of vaporisation of the LiN is extracted from the refrigerated compartment. The heated vapour thus produced drives the engine, which in turn performs two functions: firstly, to operate a generator so that the refrigeration system powers its own electrical systems, and secondly, to power a down-sized conventional vapour refrigeration cycle. This cycle must reject heat through a condenser, and this heat is used to warm the HEF for the engine, a synergy that raises the efficiency of engine and vapour cycles simultaneously. The system therefore has potential to be an efficient, self-contained, zero-emission refrigeration device, with low capital cost thanks to the relative simplicity of the engine, and the downsizing of refrigeration components to sizes used in automotive air conditioning. The first prototype (Figure 4) has undertaken testing at HORIBA MIRA38 and the next generation transport refrigeration unit will be released to a UK customer in late 2015 for extended field trials.
1.4. Dearman transport refrigeration unit development status
To validate the Dearman engine system within a simulated real-world environment, a collaborative project (COOL-E) was launched in September 2013 between MIRA Ltd, Air Products Inc.39, Dearman and Loughborough University with the financial support of Innovate UK40. In this project, one of the objectives was to develop, install and test a Dearman-powered transport refrigeration unit (TRU) as a retrofit to a heavy-duty vehicle (see Figure 4).
This demonstrator has been undergoing tests since March 2015 in a controlled environment – HORIBA MIRA’s environmental test chambers and tracks. The aim is to establish performance figures for different
duty-cycles, validate the anticipated benefits of the integrated Dearman transport refrigeration system and allow comparison to the standard diesel powered refrigeration system previously installed on the same vehicle.
The latest test results show that:• the system is capable of delivering 12kW of
cooling at -20°C;• the system can pull the refrigerated
compartment temperature from ambient temperature; down to -20°C in 25% less time than the baseline diesel unit;
• the system is exceeding its efficiency targets at this prototype stage – up to 25% more efficient than anticipated;
• the thermal balances at the heart of the technology are all performing as expected.
Controlled environment testing will continue until the end of the project in September 2015 – meanwhile an upgraded TRU system (generation 2) is being commissioned and will be released to a UK based refrigerated vehicle operator for several months of real-world commercial testing later this year. The commercial status of the Dearman TRU technology can be summarised as follows:• Dearman has a commercial collaboration
relationship with two main partners: ° Zanotti – a global refrigeration equipment
manufacturer who acts as an integrator, manufacturing and technology development partner. Zanotti has offices and customers on the East Coast of the United States;
° Air Products – an American industrial gas supplier with 20 000 employees and operations in more than 50 countries.
• Dearman has agreed trials with one of the UK’s largest vehicle leasing businesses, those trials will take place in 2015.
Figure 5: Dearman transport refrigeration system

Liquid Air on the European Highway 29Liquid Air on the European Highway28
Figure 6: The Dearman transport refrigeration system
Appendix 2: TRU technologies comparison
The summary table below compares conventional diesel powered TRUs, all-electric TRUs, liquid nitrogen TRUs and Dearman TRUs in terms of the system’s energy efficiency in producing cooling. It further considers the system’s capital, operating
and maintenance costs as well as lifecycle CO2 emissions and criteria pollutant emissions. Because of the different nature of these systems, details on how the comparison has been put together as well as assumptions are given in the following sections.
Table 5: Energy efficiency, 5 year total cost of ownership and environmental impact comparison
2.1 Auxiliary diesel engine powered refrigeration system
The energy density41 for diesel fuel is 42,91MJ/kg, which translates42 to 11,91kWh/kg. Of this available energy in diesel fuel, only 25%-30% is in practice converted to useful work through a conventional non-road diesel engine43 – meaning that ~3,26kWh/kg of useful energy can be recovered from 1
kg of diesel fuel through a diesel engine. Of this useful energy, some will be used to drive ancillary systems like the alternator to charge the batteries (and power the engine radiator fan, fans to circulate air through the compartment, condenser fans, etc.) while the rest will be used to drive a vapour compression cycle (refrigeration machine) which effectively provides cooling. It is estimated that a third of the useful work produced by the engine is consumed by ancillaries44 while the remaining two thirds of the useful work are used to drive the vapour compression cycle. Therefore of the 3,26kWh/kg of useful energy produced by the engine, only 2,17kWh/kg is used to drive the refrigeration system. Assuming that a conventional R404A refrigeration unit has on average a coefficient of performance45 (COP) of 1, this means in turn that 2,17kWh of cooling energy per kg of diesel fuel can be generated using a transport refrigeration unit.
Assuming that a fleet operator in the UK would currently pay ~€ 0,7752L for red diesel, the unit operating cost of a diesel TRU therefore is € 0,429 per kWh of cooling.
Figure 7: Auxiliary diesel engine powered TRU diagram
Liquid Air on the European Highway 31Liquid Air on the European Highway30
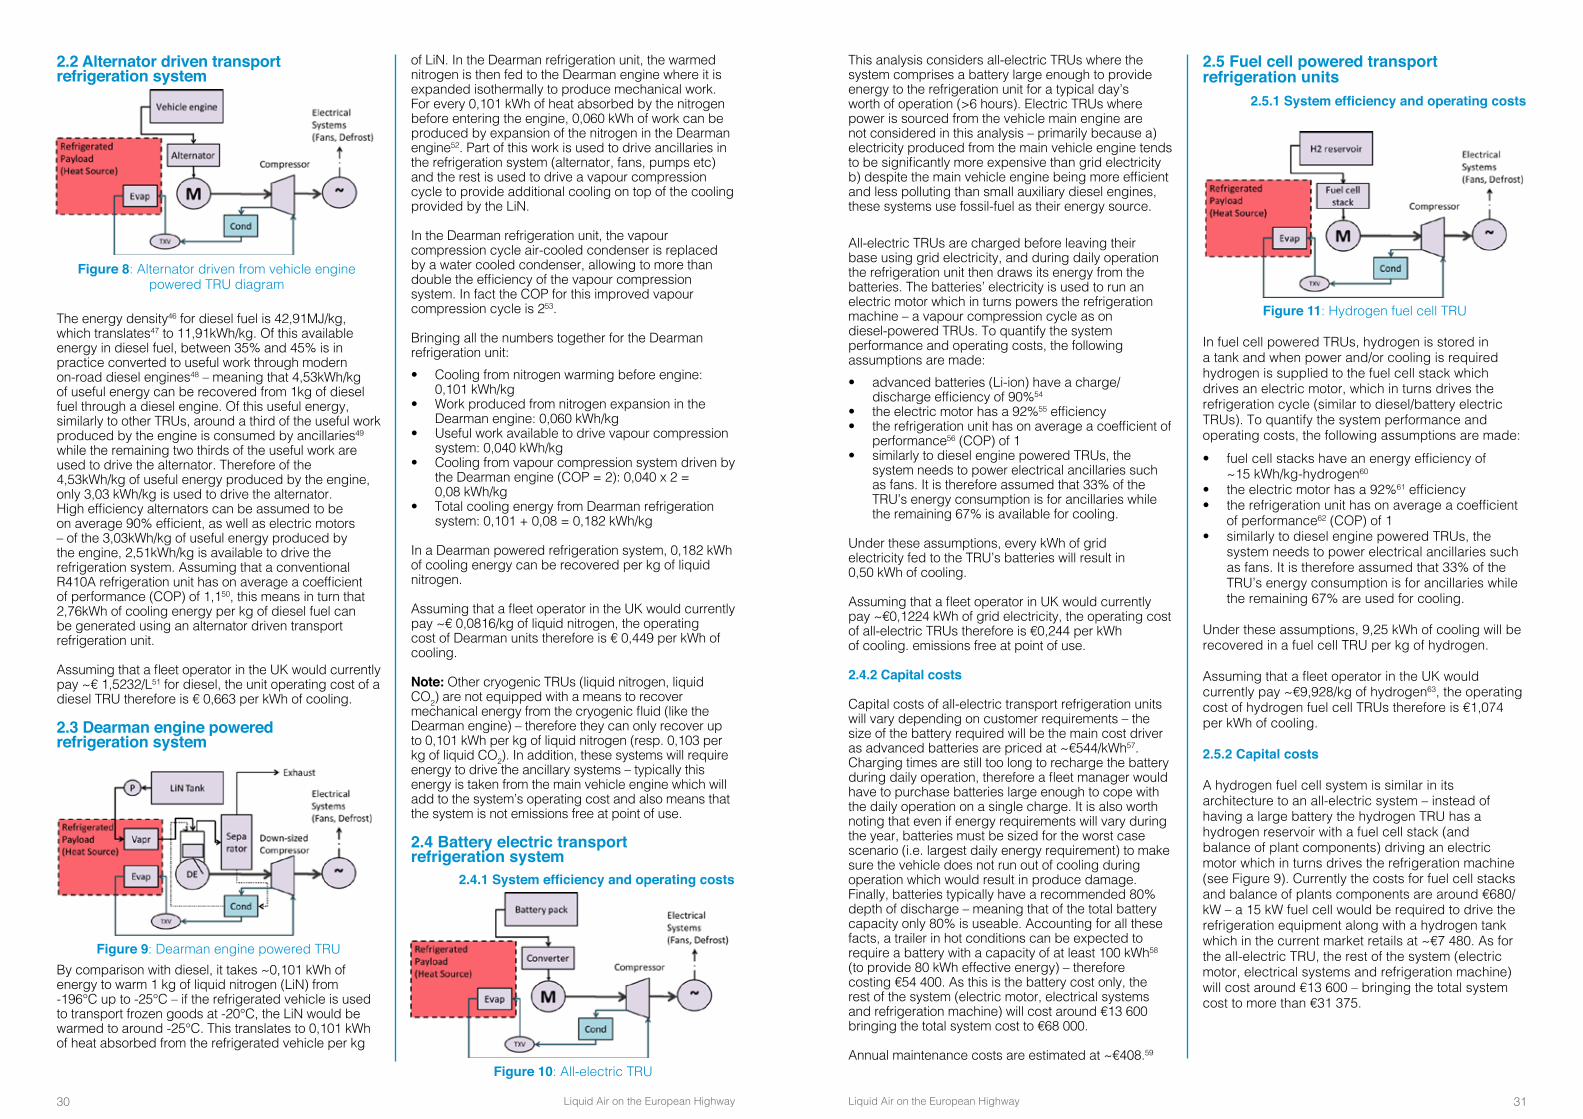
2.2 Alternator driven transport refrigeration system
The energy density46 for diesel fuel is 42,91MJ/kg, which translates47 to 11,91kWh/kg. Of this available energy in diesel fuel, between 35% and 45% is in practice converted to useful work through modern on-road diesel engines48 – meaning that 4,53kWh/kg of useful energy can be recovered from 1kg of diesel fuel through a diesel engine. Of this useful energy, similarly to other TRUs, around a third of the useful work produced by the engine is consumed by ancillaries49 while the remaining two thirds of the useful work are used to drive the alternator. Therefore of the 4,53kWh/kg of useful energy produced by the engine, only 3,03 kWh/kg is used to drive the alternator. High efficiency alternators can be assumed to be on average 90% efficient, as well as electric motors – of the 3,03kWh/kg of useful energy produced by the engine, 2,51kWh/kg is available to drive the refrigeration system. Assuming that a conventional R410A refrigeration unit has on average a coefficient of performance (COP) of 1,150, this means in turn that 2,76kWh of cooling energy per kg of diesel fuel can be generated using an alternator driven transport refrigeration unit.
Assuming that a fleet operator in the UK would currently pay ~€ 1,5232/L51 for diesel, the unit operating cost of a diesel TRU therefore is € 0,663 per kWh of cooling.
2.3 Dearman engine powered refrigeration system
By comparison with diesel, it takes ~0,101 kWh of energy to warm 1 kg of liquid nitrogen (LiN) from -196°C up to -25°C – if the refrigerated vehicle is used to transport frozen goods at -20°C, the LiN would be warmed to around -25°C. This translates to 0,101 kWh of heat absorbed from the refrigerated vehicle per kg
of LiN. In the Dearman refrigeration unit, the warmed nitrogen is then fed to the Dearman engine where it is expanded isothermally to produce mechanical work. For every 0,101 kWh of heat absorbed by the nitrogen before entering the engine, 0,060 kWh of work can be produced by expansion of the nitrogen in the Dearman engine52. Part of this work is used to drive ancillaries in the refrigeration system (alternator, fans, pumps etc) and the rest is used to drive a vapour compression cycle to provide additional cooling on top of the cooling provided by the LiN.
In the Dearman refrigeration unit, the vapour compression cycle air-cooled condenser is replaced by a water cooled condenser, allowing to more than double the efficiency of the vapour compression system. In fact the COP for this improved vapour compression cycle is 253.
Bringing all the numbers together for the Dearman refrigeration unit:• Cooling from nitrogen warming before engine:
0,101 kWh/kg• Work produced from nitrogen expansion in the
Dearman engine: 0,060 kWh/kg• Useful work available to drive vapour compression
system: 0,040 kWh/kg• Cooling from vapour compression system driven by
the Dearman engine (COP = 2): 0,040 x 2 = 0,08 kWh/kg
• Total cooling energy from Dearman refrigeration system: 0,101 + 0,08 = 0,182 kWh/kg
In a Dearman powered refrigeration system, 0,182 kWh of cooling energy can be recovered per kg of liquid nitrogen.
Assuming that a fleet operator in the UK would currently pay ~€ 0,0816/kg of liquid nitrogen, the operating cost of Dearman units therefore is € 0,449 per kWh of cooling.
Note: Other cryogenic TRUs (liquid nitrogen, liquid CO2) are not equipped with a means to recover mechanical energy from the cryogenic fluid (like the Dearman engine) – therefore they can only recover up to 0,101 kWh per kg of liquid nitrogen (resp. 0,103 per kg of liquid CO2). In addition, these systems will require energy to drive the ancillary systems – typically this energy is taken from the main vehicle engine which will add to the system’s operating cost and also means that the system is not emissions free at point of use.
2.4 Battery electric transport refrigeration system 2.4.1 System efficiency and operating costs
Figure 8: Alternator driven from vehicle engine powered TRU diagram
Figure 9: Dearman engine powered TRU
This analysis considers all-electric TRUs where the system comprises a battery large enough to provide energy to the refrigeration unit for a typical day’s worth of operation (>6 hours). Electric TRUs where power is sourced from the vehicle main engine are not considered in this analysis – primarily because a) electricity produced from the main vehicle engine tends to be significantly more expensive than grid electricity b) despite the main vehicle engine being more efficient and less polluting than small auxiliary diesel engines, these systems use fossil-fuel as their energy source.
All-electric TRUs are charged before leaving their base using grid electricity, and during daily operation the refrigeration unit then draws its energy from the batteries. The batteries’ electricity is used to run an electric motor which in turns powers the refrigeration machine – a vapour compression cycle as on diesel-powered TRUs. To quantify the system performance and operating costs, the following assumptions are made:• advanced batteries (Li-ion) have a charge/
discharge efficiency of 90%54
• the electric motor has a 92%55 efficiency• the refrigeration unit has on average a coefficient of
performance56 (COP) of 1 • similarly to diesel engine powered TRUs, the
system needs to power electrical ancillaries such as fans. It is therefore assumed that 33% of the TRU’s energy consumption is for ancillaries while the remaining 67% is available for cooling.
Under these assumptions, every kWh of grid electricity fed to the TRU’s batteries will result in 0,50 kWh of cooling.
Assuming that a fleet operator in UK would currently pay ~€0,1224 kWh of grid electricity, the operating cost of all-electric TRUs therefore is €0,244 per kWh of cooling. emissions free at point of use.
2.4.2 Capital costs
Capital costs of all-electric transport refrigeration units will vary depending on customer requirements – the size of the battery required will be the main cost driver as advanced batteries are priced at ~€544/kWh57. Charging times are still too long to recharge the battery during daily operation, therefore a fleet manager would have to purchase batteries large enough to cope with the daily operation on a single charge. It is also worth noting that even if energy requirements will vary during the year, batteries must be sized for the worst case scenario (i.e. largest daily energy requirement) to make sure the vehicle does not run out of cooling during operation which would result in produce damage. Finally, batteries typically have a recommended 80% depth of discharge – meaning that of the total battery capacity only 80% is useable. Accounting for all these facts, a trailer in hot conditions can be expected to require a battery with a capacity of at least 100 kWh58 (to provide 80 kWh effective energy) – therefore costing €54 400. As this is the battery cost only, the rest of the system (electric motor, electrical systems and refrigeration machine) will cost around €13 600 bringing the total system cost to €68 000.
Annual maintenance costs are estimated at ~€408.59
2.5 Fuel cell powered transport refrigeration units 2.5.1 System efficiency and operating costs
In fuel cell powered TRUs, hydrogen is stored in a tank and when power and/or cooling is required hydrogen is supplied to the fuel cell stack which drives an electric motor, which in turns drives the refrigeration cycle (similar to diesel/battery electric TRUs). To quantify the system performance and operating costs, the following assumptions are made:• fuel cell stacks have an energy efficiency of
~15 kWh/kg-hydrogen60
• the electric motor has a 92%61 efficiency• the refrigeration unit has on average a coefficient
of performance62 (COP) of 1 • similarly to diesel engine powered TRUs, the
system needs to power electrical ancillaries such as fans. It is therefore assumed that 33% of the TRU’s energy consumption is for ancillaries while the remaining 67% are used for cooling.
Under these assumptions, 9,25 kWh of cooling will be recovered in a fuel cell TRU per kg of hydrogen.
Assuming that a fleet operator in the UK would currently pay ~€9,928/kg of hydrogen63, the operating cost of hydrogen fuel cell TRUs therefore is €1,074 per kWh of cooling.
2.5.2 Capital costs
A hydrogen fuel cell system is similar in its architecture to an all-electric system – instead of having a large battery the hydrogen TRU has a hydrogen reservoir with a fuel cell stack (and balance of plant components) driving an electric motor which in turns drives the refrigeration machine (see Figure 9). Currently the costs for fuel cell stacks and balance of plants components are around €680/kW – a 15 kW fuel cell would be required to drive the refrigeration equipment along with a hydrogen tank which in the current market retails at ~€7 480. As for the all-electric TRU, the rest of the system (electric motor, electrical systems and refrigeration machine) will cost around €13 600 – bringing the total system cost to more than €31 375.
Figure 10: All-electric TRU
Figure 11: Hydrogen fuel cell TRU
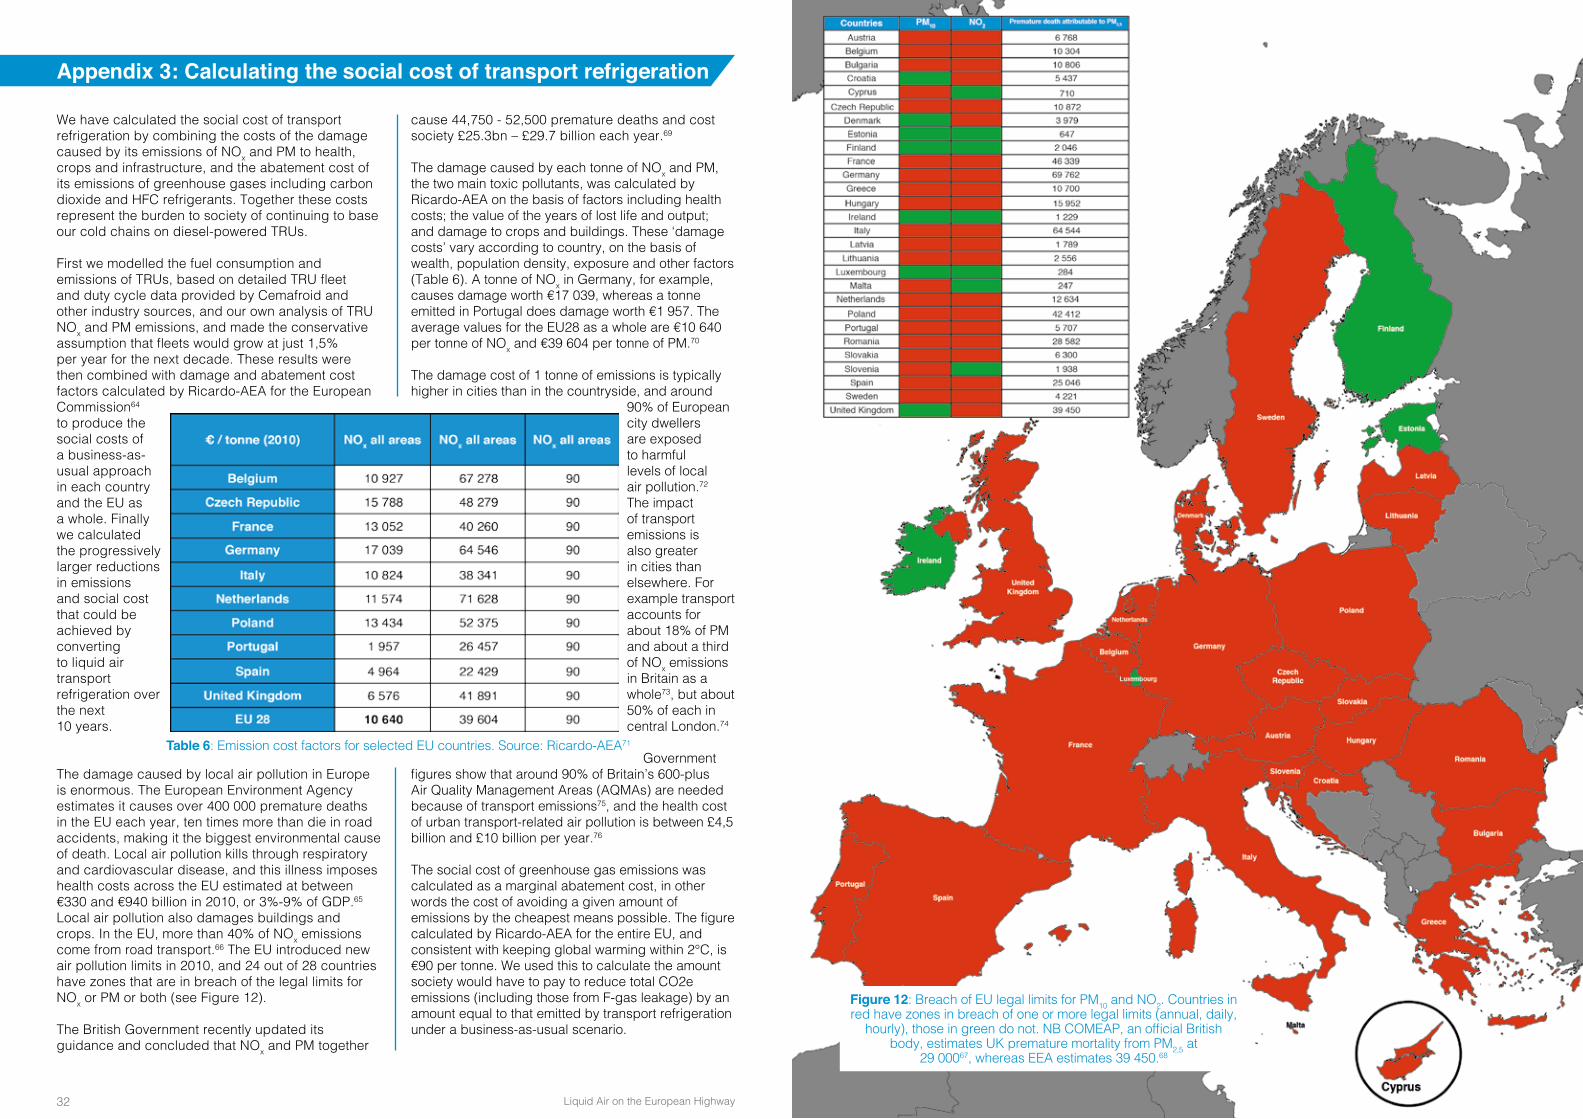
Liquid Air on the European Highway 33Liquid Air on the European Highway32
Appendix 3: Calculating the social cost of transport refrigeration
We have calculated the social cost of transport refrigeration by combining the costs of the damage caused by its emissions of NOx and PM to health, crops and infrastructure, and the abatement cost of its emissions of greenhouse gases including carbon dioxide and HFC refrigerants. Together these costs represent the burden to society of continuing to base our cold chains on diesel-powered TRUs.
First we modelled the fuel consumption and emissions of TRUs, based on detailed TRU fleet and duty cycle data provided by Cemafroid and other industry sources, and our own analysis of TRU NOx and PM emissions, and made the conservative assumption that fleets would grow at just 1,5% per year for the next decade. These results were then combined with damage and abatement cost factors calculated by Ricardo-AEA for the European Commission64 to produce the social costs of a business-as-usual approach in each country and the EU as a whole. Finally we calculated the progressively larger reductions in emissions and social cost that could be achieved by converting to liquid air transport refrigeration over the next 10 years.
The damage caused by local air pollution in Europe is enormous. The European Environment Agency estimates it causes over 400 000 premature deaths in the EU each year, ten times more than die in road accidents, making it the biggest environmental cause of death. Local air pollution kills through respiratory and cardiovascular disease, and this illness imposes health costs across the EU estimated at between €330 and €940 billion in 2010, or 3%-9% of GDP.65 Local air pollution also damages buildings and crops. In the EU, more than 40% of NOx emissions come from road transport.66 The EU introduced new air pollution limits in 2010, and 24 out of 28 countries have zones that are in breach of the legal limits for NOx or PM or both (see Figure 12).
The British Government recently updated its guidance and concluded that NOx and PM together
cause 44,750 - 52,500 premature deaths and cost society £25.3bn – £29.7 billion each year.69
The damage caused by each tonne of NOx and PM, the two main toxic pollutants, was calculated by Ricardo-AEA on the basis of factors including health costs; the value of the years of lost life and output; and damage to crops and buildings. These ‘damage costs’ vary according to country, on the basis of wealth, population density, exposure and other factors (Table 6). A tonne of NOx in Germany, for example, causes damage worth €17 039, whereas a tonne emitted in Portugal does damage worth €1 957. The average values for the EU28 as a whole are €10 640 per tonne of NOx and €39 604 per tonne of PM.70
The damage cost of 1 tonne of emissions is typically higher in cities than in the countryside, and around
90% of European city dwellers are exposed to harmful levels of local air pollution.72 The impact of transport emissions is also greater in cities than elsewhere. For example transport accounts for about 18% of PM and about a third of NOx emissions in Britain as a whole73, but about 50% of each in central London.74
Government figures show that around 90% of Britain’s 600-plus Air Quality Management Areas (AQMAs) are needed because of transport emissions75, and the health cost of urban transport-related air pollution is between £4,5 billion and £10 billion per year.76
The social cost of greenhouse gas emissions was calculated as a marginal abatement cost, in other words the cost of avoiding a given amount of emissions by the cheapest means possible. The figure calculated by Ricardo-AEA for the entire EU, and consistent with keeping global warming within 2°C, is €90 per tonne. We used this to calculate the amount society would have to pay to reduce total CO2e emissions (including those from F-gas leakage) by an amount equal to that emitted by transport refrigeration under a business-as-usual scenario.
Table 6: Emission cost factors for selected EU countries. Source: Ricardo-AEA71
Figure 12: Breach of EU legal limits for PM10 and NO2. Countries in red have zones in breach of one or more legal limits (annual, daily,
hourly), those in green do not. NB COMEAP, an official British body, estimates UK premature mortality from PM2,5 at
29 00067, whereas EEA estimates 39 450.68

Liquid Air on the European Highway 35Liquid Air on the European Highway34
Glossary
AcronymsASU: Air separation unitATP: Agreement on the International Carriage of Perishable Foodstuffs and on the Special Equipment to be Used for such CarriageCO2e: Carbon dioxide equivalent: CO2e allows other greenhouse gas emissions to be expressed in terms of CO2 based on their relative global warming potential (GWP)EEA: European Environment AgencyERTRAC: European Road Transport Research Advisory CouncilHFC: HydrofluorocarbonGDP: Gross domestic productGWP: Global warming potentialHGV: Heavy goods vehicle (above 3,5 tonnes) IEA: International Energy AgencyLGV: Light goods vehicle (under 3,5 tonnes)LiN: Liquid nitrogenLNG: Liquefied natural gasMtCO2: Million tonnes of CO2 MW: MegawattMWh: Megawatt hour HORIBA MIRA: formerly MIRA, the Motor Industry Research AssociationNOx: Nitrogen oxidesNRMM: Non-Road Mobile MachineryPM: Particulate matterTPD: Tonnes per day TRU: Transport refrigeration unitHEF: Heat exchange fluid
Technical TermsAbatement cost: The cost of reducing one more unit of pollution Alternator: Electrical generator driven by the vehicle’s propulsion engine that converts mechanical energy to electrical energy in the form of alternating currentCarbon capture and storage: (CCS) process of capturing waste carbon dioxide (CO2) from large point sources, such as fossil fuel power plants, transporting it to a storage site, and depositing it where it will not enter the atmosphere, normally an underground geological formationCold chain: A temperature-controlled supply chain of goods such as food or pharmaceutical products Cryogenic liquid: Gases that have been liquefied and that have a temperature below 120°K (-153°C)Damage cost: Costs imposed by those pollutants in terms of hospital treatment, premature death, lost life and productivity, and damage to buildings and cropsEnergy vector / carrier: a medium of moving, storing, and releasing energy Grid carbon intensity: The amount of CO2 that is emitted from the production and consumption of one unit of electricityHeat exchanger: Equipment built for efficient heat transfer from one medium to anotherF-gases: Refrigerant gasesLifecycle emissions: Emissions associated with all the stages of a product’s life from cradle to graveLiquefaction: The process of cooling a gas to the point of becoming liquid (-194°C for air)Liquid air: A cryogenic fluid comprising an atmospheric mixture of nitrogen, oxygen and the trace gases LNG re-gasification: Process by which natural gas that has been liquefied for more convenient shipping is then re-gasified by re-heating Red diesel: Diesel (or ‘gas oil’) that carries a lower excise duty than diesel used for road vehicle propulsion‘Wrong-time’ electricity: Electricity that is produced by less flexible forms of generation when there is no demand for it, eg. nuclear or wind power produced at night.
Endnotes
1 Air pollution will kill thousands in Europe, EEA warns, Guardian, 3 March 2015, http://www.theguardian.com/environment/2015/mar/03/air-pollution-will-kill-thousands-in-europe-eea-warns
2 Road freight vehicle statistics - trucks, road tractors and trailers, Eurostat Statistics Explained, 2014, Excel Spreadsheet can be downloaded at http://ec.europa.eu/eurostat/statistics-explained/index.php/Road_freight_vehicle_statistics_-_trucks,_road_tractors_and_trailers
3 Average EU price 2014: €1,398383673. Weekly Oil Bulletin, DG Energy, European Commission, http://ec.europa.eu/energy/en/statistics/weekly-oil-bulletin
4 Liquid Air on the Highway: the environmental and business case for liquid air commercial vehicles in the UK, June 2014, www.liquidair.org.uk
5 Energy Carriers for Powertrains - for a clean and efficient mobility, ERTRAC, 27.02.2014 http://www.ertrac.org/uploads/documentsearch/id32/2014-03-12_Roadmap_Energy_Carriers_for_Powertrains.pdf
6 Liquid Air on the Highway: the environmental and business case for liquid air commercial vehicles in the UK, June 2014, www.liquidair.org.uk
7 Cold Chain Market in Europe 2015-2019, technavio, 15 July 2015, http://www.technavio.com/report/cold-chain-market-in-europe-2015-2019
8 Air pollution will kill thousands in Europe, EEA warns, Guardian, 3 March 2015, http://www.theguardian.com/environment/2015/mar/03/air-pollution-will-kill-thousands-in-europe-eea-warns
9 Brussels, COM(2014) 581 final, European Commission, 25 September 2014, http://www.europarl.europa.eu/meetdocs/2014_2019/documents/com/com_com(2014)0581_/com_com(2014)0581_en.pdf; DieselNet, https://www.dieselnet.com/standards/eu/hd.php.
10 Assumptions: 12 metre frozen articulated truck using 100% auxiliary diesel power, governed by EU NRMM Stage IIIA; Euro VI HGV, 42 000km per year, fuel consumption 0,37L/km; Euro 6 Diesel car, 12 000 miles per year. NRMM IIIA is an entirely theoretical assumption, since it relates only to engines above 19kW; real-world emissions for engines of less than 19kW may in fact be higher still. Compared to NRMM IIIA, Stage 5 would reduce permitted emissions of PM/kWh by a third, but NOx emissions would remain unchanged.
11 NRMM Stage 5 limit is for NOx and HC combined, not just NOx.
12 Brussels, COM(2014) 581 final, European Commission, 25 September 2014, http://www.europarl.europa.eu/meetdocs/2014_2019/documents/com/com_com(2014)0581_/com_com(2014)0581_en.pdf; DieselNet, https://www.dieselnet.com/standards/eu/hd.php.
13 Update of the Handbook on External Costs of Transport, Ricardo-AEA, January 2014, European Commission DG MOVE, http://ec.europa.eu/transport/themes/sustainable/studies/doc/2014-handbook-external-costs-transport.pdf
14 ie taking into account the different characteristics and numbers of van, lorry and trailer TRUs.
15 Average EU price 2014: €1,398383673. Weekly Oil Bulletin, DG Energy, European Commission, http://ec.europa.eu/energy/en/statistics/weekly-oil-bulletin
16 Road freight vehicle statistics - trucks, road tractors and trailers, Eurostat Statistics Explained, 2014, Excel Spreadsheet can be downloaded at http://ec.europa.eu/eurostat/statistics-explained/index.php/Road_freight_vehicle_statistics_-_trucks,_road_tractors_and_trailers
17 Road freight vehicle statistics - trucks, road tractors and trailers, Eurostat Statistics Explained, 2014, Excel Spreadsheet can be downloaded at http://ec.europa.eu/eurostat/statistics-explained/index.php/Road_freight_vehicle_statistics_-_trucks,_road_tractors_and_trailers
18 Energy Carriers for Powertrains - for a clean and efficient mobility, ERTRAC, 27.02.2014 http://www.ertrac.org/uploads/documentsearch/id32/2014-03-12_Roadmap_Energy_Carriers_for_Powertrains.pdf
Endnotes can be found at www.dearman.co.uk

Liquid Air on the European Highway 37Liquid Air on the European Highway36
19 Air quality in Europe — 2014 report, EEA, http://www.eea.europa.eu/publications/air-quality-in-europe-2014
20 Statement on the evidence for the effects of nitrogen dioxide on health, COMEAP, 2015, https://www.gov.uk/government/uploads/system/uploads/attachment_data/file/411756/COMEAP_The_evidence_for_the_effects_of_nitrogen_dioxide.pdf
21 Nitrogen dioxide and mortality: review and meta-analysis of long-term studies, Annunziata Faustini et al, European Respiratory Journal, 19 December 2013, http://erj.ersjournals.com/content/early/2014/02/20/09031936.00114713.abstract
22 Valuing impacts on air quality: Updates in valuing changes in emissions of Oxides of Nitrogen (NOx) and concentrations of Nitrogen Dioxide (NO2) , Defra, September 2015, https://www.gov.uk/government/uploads/system/uploads/attachment_data/file/460401/air-quality-econanalysis-nitrogen-interim-guidance.pdf
23 Air quality in Europe — 2014 report, EEA, http://www.eea.europa.eu/publications/air-quality-in-europe-2014
24 Belgium and Bulgaria in the EU dock over poor air quality, Reuters, 18 June 2015, http://www.reuters.com/article/2015/06/18/us-eu-airqualty-idUSKBN0OY1FX20150618; Poland with most polluted air in EU?, the news.pl, 16.02.2015 http://www.thenews.pl/1/9/Artykul/197135,Poland-with-most-polluted-air-in-EU
25 Understanding pollutant emissions from Europe’s cities, Highlights from the EU Air Implementation Pilot project, EEA, 2013, http://www.eea.europa.eu/publications/understanding-pollutants-emissions-from-europes
26 TfL (2014) Ultra Low Emission Zone in Lon-don, page 34 https://consultations.tfl.gov.uk/environment/ultra-low-emission-zone/user_up-loads/ulez-supplementary-information---fi-nal-291014.pdf-1; Air Pollution XIX Page 32-33, Brebbia et al, 2011, https://books.google.co.uk/books?id=YVsdEPKI0p4C&pg=PA26&lp-g=PA26&dq=barcelona+air+pollution+transport&-source=bl&ots=t1dgJEe-Oq&sig=40sdXHjBP-wimwr97fzsuTcd_FJ4&hl=en&sa=X&ei=kmMaVZ-jDIaTA7Ab-ioGwCQ&ved=0CFIQ6AEwBw#v=one-page&q=barcelona%20air%20pollution%20transport&f=false
27 Les émissions en quelques chiffres, Airparif, http://www.airparif.asso.fr/etat-air/air-et-climat-quelques-chiffres
28 Ford Fiesta Studio 1.4 TDCI – 110g/km
29 Boris to consider impact of refrigerated trucks on London’s air quality, Fridgehub, http://fridgehub.com/News/boris-to-consider-impact-of-auxiliary-engines-on-londons-air-quality
30 UK Grocery Retailing, IGD, 2014, http://www.igd.com/Research/Retail/retail-outlook/3371/UK-Grocery-Retailing/ United Kingdom Retail Foods, Gain Report (2014) http://gain.fas.usda.gov/Recent%20GAIN%20Publications/Retail%20Foods_London_United%20Kingdom_12-1-2014.pdf
31 Online grocery retailing in France and Germany to double by 2016, IGD, 2013, http://www.igd.com/About-us/Media/IGD-news-and-press-releases/Online-Grocery-Retailing-in-France-and-Germany-to-Double-by-2016/
32 The State of Online Grocery Retail in Europe, Syndicate Plus, 2014, http://www.syndicateplus.com/the-state-of-online-grocery-retail-in-europe
33 German retailer REWE steels for Amazon move into food, Reuters, 12 March 2015, http://www.reuters.com/article/2015/03/12/us-rewe-germany-idUSKBN0M81JX20150312a
34 Home Delivery Fulfilment in UK Grocery Opportunities and threats from market growth, Alvarez & Marsal, http://www.alvarezandmarsal.com/sites/default/files/sidebar-callouts/am_ecs_homedeliveryfulfilment_f2_web_2.pdf
35 ‘Click and collect’ poised to overtake home delivery, FT, 21 April 2014, http://www.ft.com/cms/s/0/3ac9e120-c653-11e3-ba0e-00144feabdc0.html#axzz3dxeL6Isx
36 Growing UK Convenience Market, IGD, 2014 http://www.igd.com/our-expertise/Retail/Convenience/20473/Growing-UK-convenience-market/
37 The State of Online Grocery Retail in Europe, Syndicate Plus, 2014, http://www.syndicateplus.com/the-state-of-online-grocery-retail-in-europe
38 MIRA Ltd. is a leading independent provider of research, product engineering and test services, primarily in support of the automotive industry.
39 Air Products Inc. is a global corporation whose principal business is selling gases and chemicals for industrial uses. It is one of the largest global suppliers of liquid nitrogen.
40 Innovate UK is the UK’s innovation agency. It is an executive non-departmental public body, sponsored by the Department for Business, Innovation & Skills. Its primary aim is to fund, support and connect innovative businesses to accelerate sustainable economic growth.
41 Net calorific value from http://www.academia.edu/1073990/The_Energy_and_Fuel_Data_Sheet
42 1 kWh = 3,6 MJ, http://www.academia.edu/1073990/The_Energy_and_Fuel_Data_Sheet
43 http://www.frigoblock.com/uploads/downloads/files/files/energy-cost-saving-with-frigoblock-alternator-drive-198-1397553342.pdf
44 Emissions, Performance, and Duty Cycle Measurements of Diesel Powered TRUs, P. Mader, C. Kulkarni, H. A. Dwyer and C. J. Brodrick
45 COP – ratio of cooling energy produced by the refrigeration machine over power input to the refrigeration machine
46 Net calorific value from http://www.academia.edu/1073990/The_Energy_and_Fuel_Data_Sheet
47 1 kWh = 3,6 MJ, from http://www.academia.edu/1073990/The_Energy_and_Fuel_Data_Sheet
48 Heavy Goods Vehicle Simulation tools, Ricardo 2010
49 Emissions, Performance, and Duty Cycle Measurements of Diesel Powered TRUs, P. Mader, C. Kulkarni, H. A. Dwyer and C. J. Brodrick
50 Frigoblock quotes 10% higher efficiency
51 Global petrol prices, August 2015
52 Assumption
53 Development of a Novel Refrigerated Transport System using a combination of liquid nitrogen expansion and mechanical vapour compression, E. Teyssandier, P. Metcalf, N. Owen, R. Lawton, T. Mynott and Z. L’Heureux
54 http://www.teslamotors.com/powerwall
55 Page 25 on http://www.ricardo-aea.com/cms/assets/Documents-for-Insight-pages/8.-Review-of-cost-and-efficiency.pdf
56 COP – ratio of cooling energy produced by the refrigeration machine over power input to the refrigeration machine
57 Transport refrigerators technology assessment, CARB, August 2015
58 http://www.grimsby.ac.uk/documents/defra/trns-casestudy.pdf
59 Transport refrigerators technology assessment, CARB, August 2015
60 http://www.nyenergyhighway.com/Content/documents/89.pdf
61 Page 25 on http://www.ricardo-aea.com/cms/assets/Documents-for-Insight-pages/8.-Review-of-cost-and-efficiency.pdf
62 COP – ratio of cooling energy produced by the refrigeration machine over power input to the refrigeration machine
63 McKinsey: ‘A portfolio of power-trains for Europe: a fact-based analysis’
64 Update of the Handbook on External Costs of Transport, Ricardo-AEA, January 2014, European Commission DG MOVE, http://ec.europa.eu/transport/themes/sustainable/studies/doc/2014-handbook-external-costs-transport.pdf
65 AirClim (2014) ‘A new EU clean air strategy up to 2030’ http://www.airclim.org/acidnews/new-eu-clean-air-strategy-2030
66 EEA (2013) Understanding pollutant emissions from Europe’s cities, Highlights from the EU Air Implementation Pilot project
67 The Mortality Effects of Long-Term Exposure to Particulate Air Pollution in the United Kingdom, COMEAP, 2010, https://www.gov.uk/government/uploads/system/uploads/attachment_data/file/304641/COMEAP_mortality_effects_of_long_term_exposure.pdf
68 Air pollution country fact Country Fact Sheets, EEA, http://www.eea.europa.eu/themes/air/air-pollution-country-fact-sheets-2014; Air quality in Europe — 2014 report, EEA, http://www.eea.europa.eu/publications/air-quality-in-europe-2014

Liquid Air on the European Highway 39Liquid Air on the European Highway38
69 Valuing impacts on air quality: Updates in valuing changes in emissions of Oxides of Nitrogen (NOx) and concentrations of Nitrogen Dioxide (NO2) , Defra, September 2015, https://www.gov.uk/government/uploads/system/uploads/attachment_data/file/460401/air-quality-econanalysis-nitrogen-interim-guidance.pdf
70 Update of the Handbook on External Costs of Transport, Ricardo-AEA, January 2014, European Commission DG MOVE, http://ec.europa.eu/transport/themes/sustainable/studies/doc/2014-handbook-external-costs-transport.pdf
71 Update of the Handbook on External Costs of Transport, Ricardo-AEA, January 2014, European Commission DG MOVE, http://ec.europa.eu/transport/themes/sustainable/studies/doc/2014-handbook-external-costs-transport.pdf
72 http://www.eea.europa.eu/themes/air/intro
73 Emissions of Air Pollutants across the UK, 1970 to 2013, National Statistics Release, 18 December 2014, Defra https://www.gov.uk/government/uploads/system/uploads/attachment_data/file/388195/Emissions_of_air_pollutants_statistical_release_2014.pdf
74 In 2010, road transport responsible for 48% of NOx emissions and 54% PM10 emission in central London. Cf TfL (2014) Ultra Low Emission Zone in London, page 34 https://consultations.tfl.gov.uk/environment/ultra-low-emission-zone/user_uploads/ulez-supplementary-information---final-291014.pdf-1
75 Summary AQMA Data, Defra, http://uk-air.defra.gov.uk/aqma/summary
76 The wider costs of transport in English urban areas in 2009, Department for Transport, 2009 http://webarchive.nationalarchives.gov.uk/+/http:/www.cabinetoffice.gov.uk/media/307739/wider-costs-transport.pdf

Liquid Air on the European Highway40
Dearman, Unit 5 Stafford Cross Business Park, Croydon, CR0 4TUT: +44(0) 203 829 0035
E: [email protected] W: www.dearman.co.uk