liquid biofuels for the land transport sector in asia: implications for the global environment...
TRANSCRIPT

Liquid Biofuels for the Land Transport Sector in Asia: Implications for the
Global Environment
Jerome Weingart *
May 24, 2006
* ADB consultant
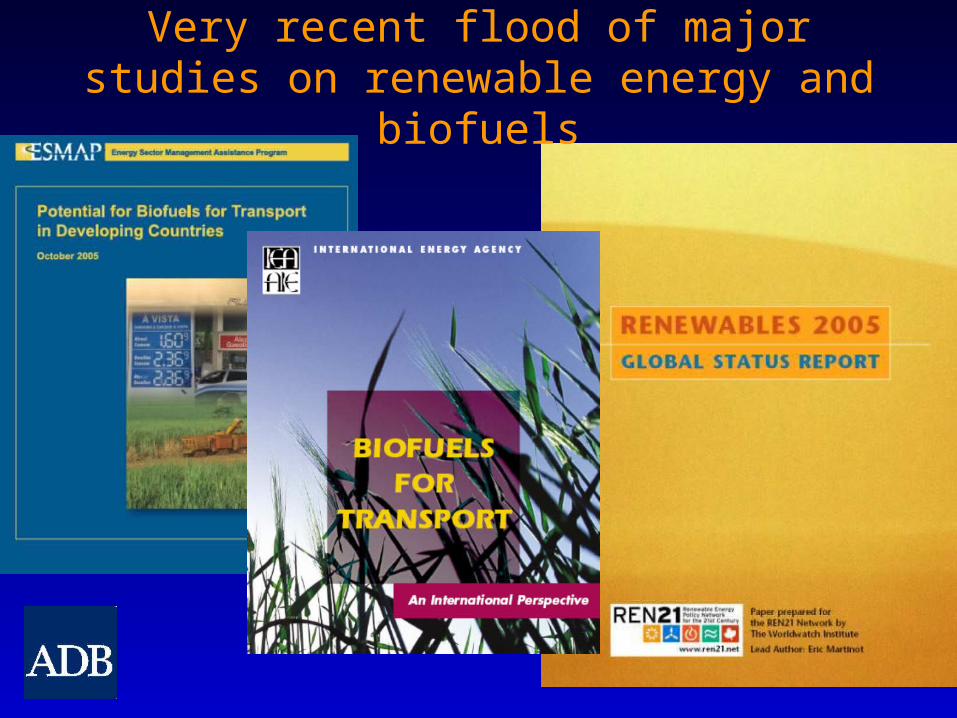
Very recent flood of major studies on renewable energy and biofuels
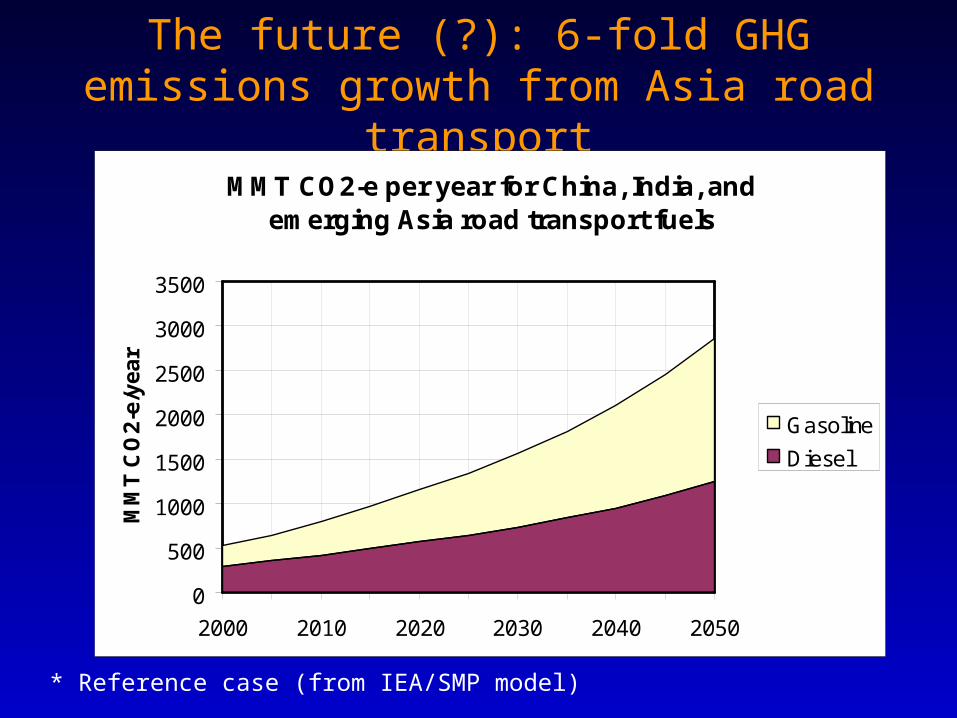
The future (?): 6-fold GHG emissions growth from Asia road transport
MMT CO2-e per year for China, India, and emerging Asia road transport fuels
0
500
1000
1500
2000
2500
3000
3500
2000 2010 2020 2030 2040 2050
MM
T C
O2
-e/y
ea
r
Gasoline
Diesel
* Reference case (from IEA/SMP model)

Objectives of the biofuels study
• Compare life-cycle GHG emissions from various biodiesel and bioethanol fuels
• Review bioethanol and biodiesel fuel production in Asia
• Assess potential of low-GHG biofuels to displace GHG emissions for road transport
• Identify policy, TA, and other measures to stimulate biofuels production and use

Liquid biofuels for transport
• Ethanol, produced from sugar cane, corn, sugar beets, wheat, and potentially from cellulosic feedstocks (gasoline additive and replacement)
• Biodiesel, made from vegetable oils from soy, rape, palm, coconut, Jatropha, and other oil seed crops (petro-diesel additive and replacement)
Some desirable characteristics of liquid biofuels for transport
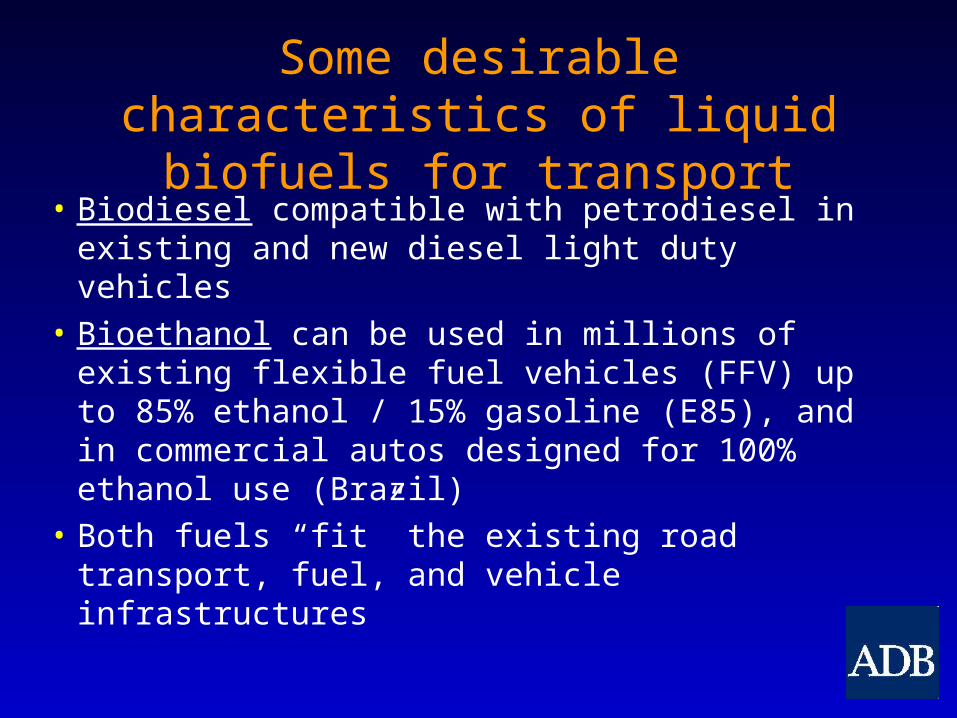
• Biodiesel compatible with petrodiesel in existing and new diesel light duty vehicles
• Bioethanol can be used in millions of existing flexible fuel vehicles (FFV) up to 85% ethanol / 15% gasoline (E85), and in commercial autos designed for 100% ethanol use (Brazil)
• Both fuels “fit” the existing road transport, fuel, and vehicle infrastructures

Why are we interested in biofuels for the Asian road transport sector?
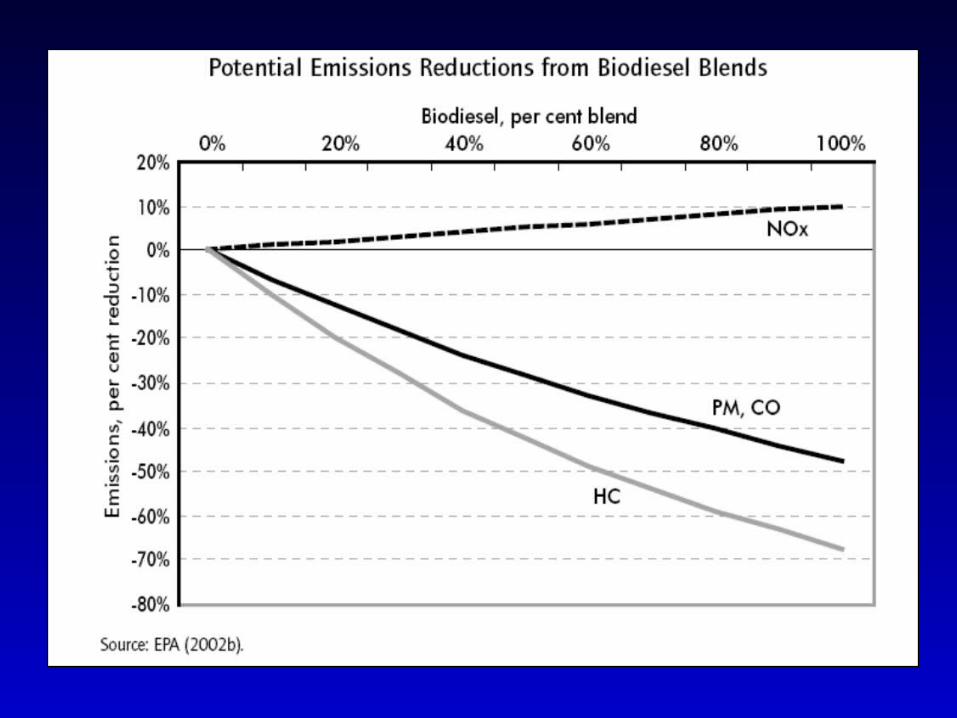
• Potentially competitive with petrofuels• Indigenous, can offset imported petroleum • Significant reduction in tailpipe emissions • Potential for major reduction (80 – 95%) in
net unit life-cycle GHG emissions compared with petrofuels, and
• Potential for large-scale sustainable production

What is Driving Growth in Biofuels Production?
• Air quality demands for cleaner fuels
• Oil supply uncertainties / fuel security
• Very high and volatile oil prices
• Biofuels increasingly competitive
• Policy incentives and mandates for biofuels
• Global warming (a minor driver)

Crude oil, ethanol, and biodiesel global production in 2002
Fuel Production (billion liters/year)
Crude oil 4,080Motor spirit
(2004)1,400
Ethanol 24Biodiesel 1.5

Benefits: Biofuels Production and Use
• Environmental impacts– GHG emission displacement– Improved air quality– Geographic diversity of supply
• Economic benefits– Income generation– Rural income expansion and diversification– Displacement of imported fossil fuels– Adds diversity and risk reduction to energy portfolio
• Security benefits
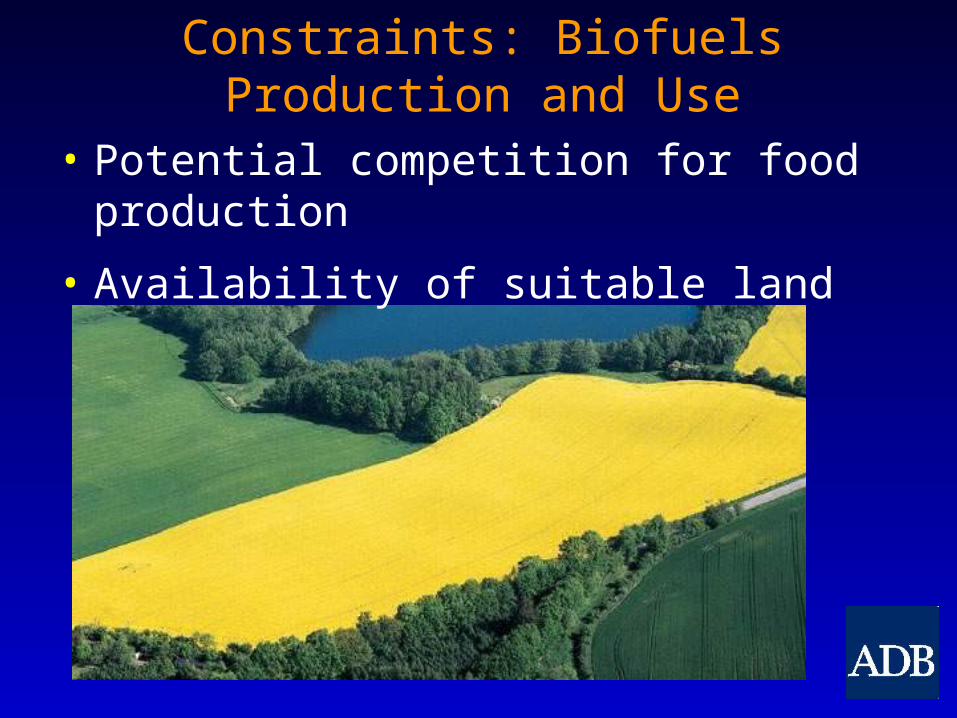
Constraints: Biofuels Production and Use
• Potential competition for food production
• Availability of suitable land

Constraints: Biofuels Production and Use
• Environmental impacts (land conversion)– Tropical forest replacement by monocrops /
deforestation– Diminished ecological diversity and resilience– Nutrient leaching– Pollution from chemicals– Loss of watersheds– Soil erosion, mud slides, and forest fires
• Global environmental impacts: nitrogen oxides from agriculture

Ethanol Production in 2005(billion liters per year)
16.14
16.00
3.80
1.70
0.30
0.17
0.09
0.08
- 5.00 10.00 15.00 20.00
United States
Brazil
China
India
Thailand
Indonesia
Pakistan
Philippines
Billion liters / year

Biofuels from field to wheels: life-cycle analysis and GHG emissions

What is life-cycle analysis?• Comprehensive methodology to identify
and quantify inputs, outputs, and impacts of a production process
• Outputs include total GHGs produced and net energy (energy per liter of biofuel minus petroleum energy input)
• LCAs needed for feedstock / biofuels options in Asia

Life-cycle stages for fuels
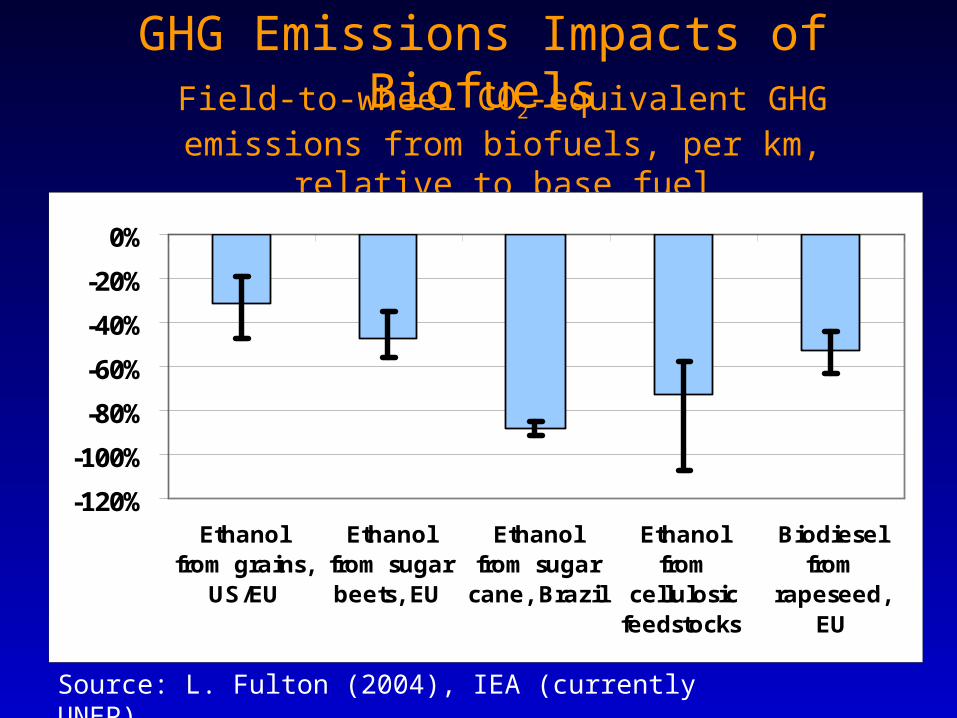
GHG Emissions Impacts of BiofuelsField-to-wheel CO2-equivalent GHG emissions from
biofuels, per km, relative to base fuel
-120%
-100%
-80%
-60%
-40%
-20%
0%
Ethanolfrom grains,
US/EU
Ethanolfrom sugarbeets, EU
Ethanolfrom sugar
cane, Brazil
Ethanolfrom
cellulosicfeedstocks
Biodieselfrom
rapeseed,EU
Source: L. Fulton (2004), IEA (currently UNEP)

Greenhouse Gas Emissions from the Asia Vehicle Transport Sector
Scenarios for market penetration of low-GHG biofuels

What is a scenario?
• A scenario is like a screen play for the future.
• A scenario is NOT a prediction; it asks “what if”, using rules that reflect real world market dynamics and constraints

What is a market penetration scenario?
• Model of a possible future
• Analytic – logistic penetration model for increasing market share of an “intruder” into an “incumbent” market (“S”-shaped curve)
• Permits specification of key parameters to assess impacts of alternative penetration rates and ultimate market fraction for new options
• Has been widely validated

Real-world market penetration dynamics
• Market penetration has distinct phases– Pioneering: Conceptual through research and
development– Preparing to go to market: prototype production– Market feedback: Market testing and evaluation– Major commercial launch: Launching of
commercial options, with wide-spread marketing and support
– Robust expansion of successful launches through larger facilities and decreased production costs (learning and experience curve effects)

• Market penetration has distinct phases– “Takeoff”, with increasingly rapid penetration of
the total market of the incumbent (e.g. petrodiesel fuels)
– “Market dynamism”, with substantial and rapidly growing market share
– “Maturation” Gradual slowdown in rate of penetration as market potential (e.g., 50% of total Asia LDV petrodiesel market) is reached.
• The rate of penetration from 1% to 99% of the potential market varies widely among technologies
Real-world market penetration dynamics

Stages of market penetration
Logistic Penetration (1% to 50% in 20 years)
-0.10.20.30.40.50.60.70.80.91.0
0 5 10 15 20 25 30 35 40 45
Year
Fra
cti
on
of
ma
rke
t p
en
etr
ati
on

IEA ethanol share of gasoline

International Energy Agency reviewof biofuels prospects and issues
• Global technical potential for biofuels is large, perhaps 50% of transport fuels by 2050
• Ethanol from sugar cane in developing countries could provide 10% of global transport fuel needs by 2020, at relatively low cost

GHG annual emissions from diesel and gasoline transport fuels in Asia
MMT CO2-e per year for China, India, and emerging Asia road transport fuels
0
500
1000
1500
2000
2500
3000
3500
2000 2010 2020 2030 2040 2050
MM
T C
O2
-e/y
ea
r
Gasoline
Diesel
* Reference case (IEA/SMP)

Assumptions behind two biofuels scenarios (S1 and S2)
Parameter Value / assumption Degree of realism
Biofuels market penetration fraction f(t)
10% to 90% penetration in a 50 year period, following a logistic or “S-shaped” penetration path.
Plausible if Asian experience can match the optimistic market projections made by IEA for global biofuels penetration.
Market fraction for biofuels
S-1: 100% of petrofuels transport market
S-2: 50%
S1: Barely plausibleS2: Reasonably plausible
Biofuels exbodied GHGs
S-1: 90% reduction in life-cycle GHG emissions relative to petrofuels
S-2: 75% reduction
Highly optimistic: Assumes best of current practice (Brazil sugarcane to ethanol) and equivalent practices with second generation biofuels can be emulated and expanded to meet Asia road transport fuel needs

Asia road transport GHG emissions with and without accelerated biofuels penetration S2
-
500
1,000
1,500
2,000
2,500
3,000
3,500
1990 2000 2010 2020 2030 2040 2050 2060
Year
MM
T C
O2-e
/yea
rPetroleum fuels With biofuels
Business as usual GHG emissions
Biofuels and reduced GHG emissions

Asia road transport GHG emissions with and without extreme biofuels penetration S1
-
500
1,000
1,500
2,000
2,500
3,000
3,500
1990 2000 2010 2020 2030 2040 2050 2060
Year
MM
T C
O2
-e/y
ea
rBase case 100% petro fuels Aggressive penetration low GHG biofuels
Business as usual GHG emissions
High biofuels penetration GHG emissions
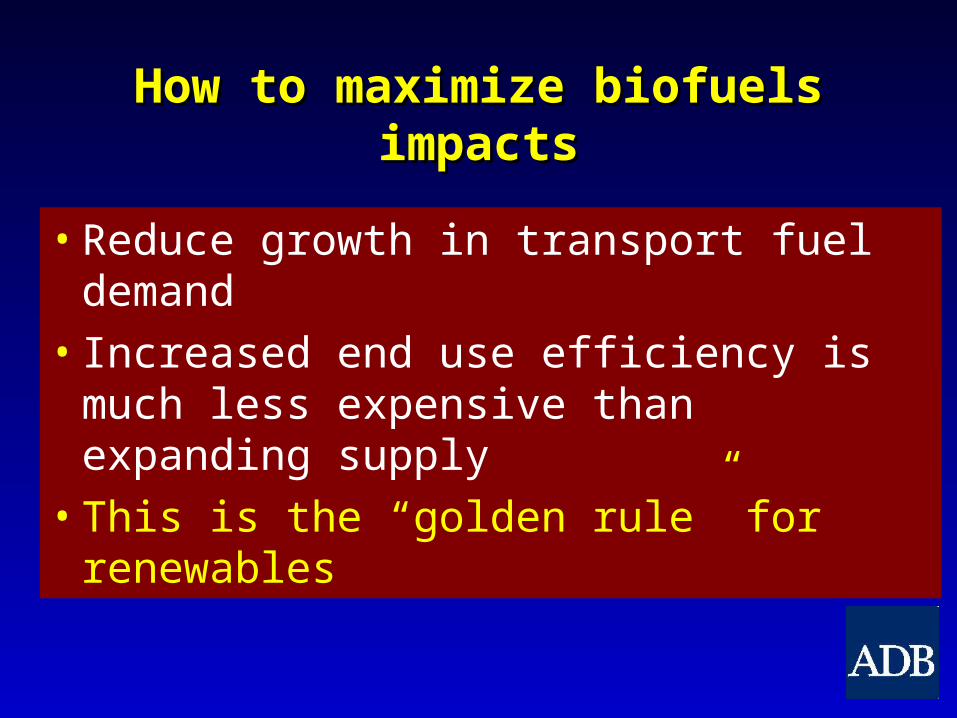
How to maximize biofuels impactsHow to maximize biofuels impacts
• Reduce growth in transport fuel demand
• Increased end use efficiency is much less expensive than expanding supply
• This is the “golden rule” for renewables
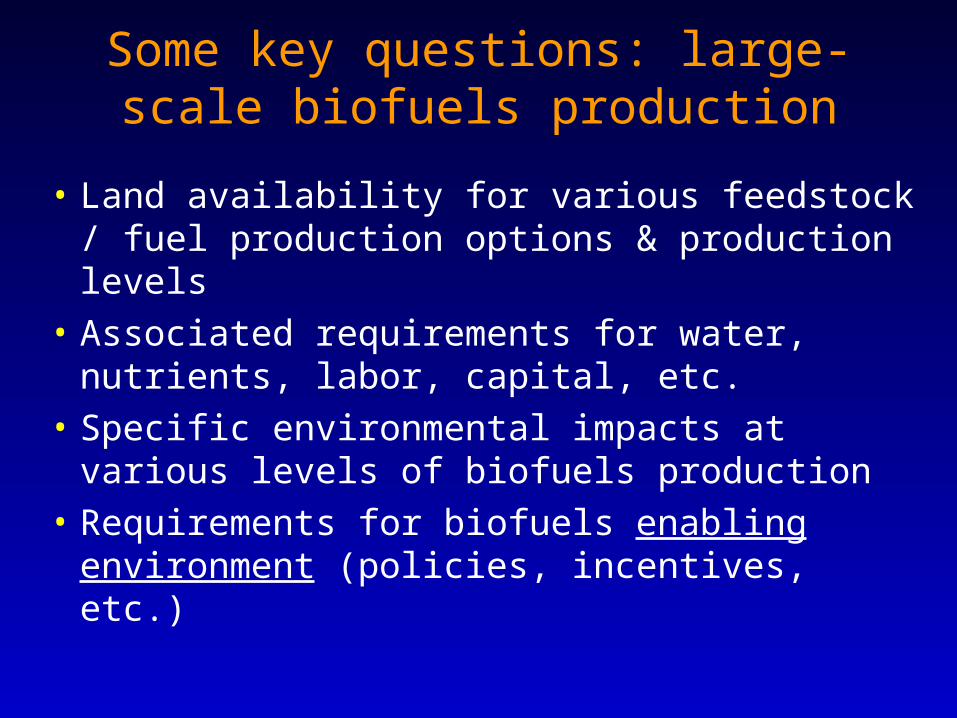
Some key questions: large-scale biofuels production
• Land availability for various feedstock / fuel production options & production levels
• Associated requirements for water, nutrients, labor, capital, etc.
• Specific environmental impacts at various levels of biofuels production
• Requirements for biofuels enabling environment (policies, incentives, etc.)

Potential next steps
• Life-cycle analysis / assessment for Asia for bio-ethanol and biodiesel options
• Collaboration among national biofuels working groups using compatible LCA methodologies
• Establishment of biofuels collaborative for collaboration, coordination, technical assistance, and knowledge management

For more information:
Jerome Weingart
Web site: www.adb.org

Thank you!

Global Production of Fuel Ethanol
-
5,000
10,000
15,000
20,000
25,000
30,000
35,000
1975 1980 1985 1990 1995 2000 2005 2010
Year
Mill
ion
lite
rs/y
ea
r

Global Production of Biodiesel Fuels
-200400600800
1,0001,2001,4001,6001,8002,000
1975 1980 1985 1990 1995 2000 2005 2010
Year
Mill
ion
lite
rs/y
ea
r
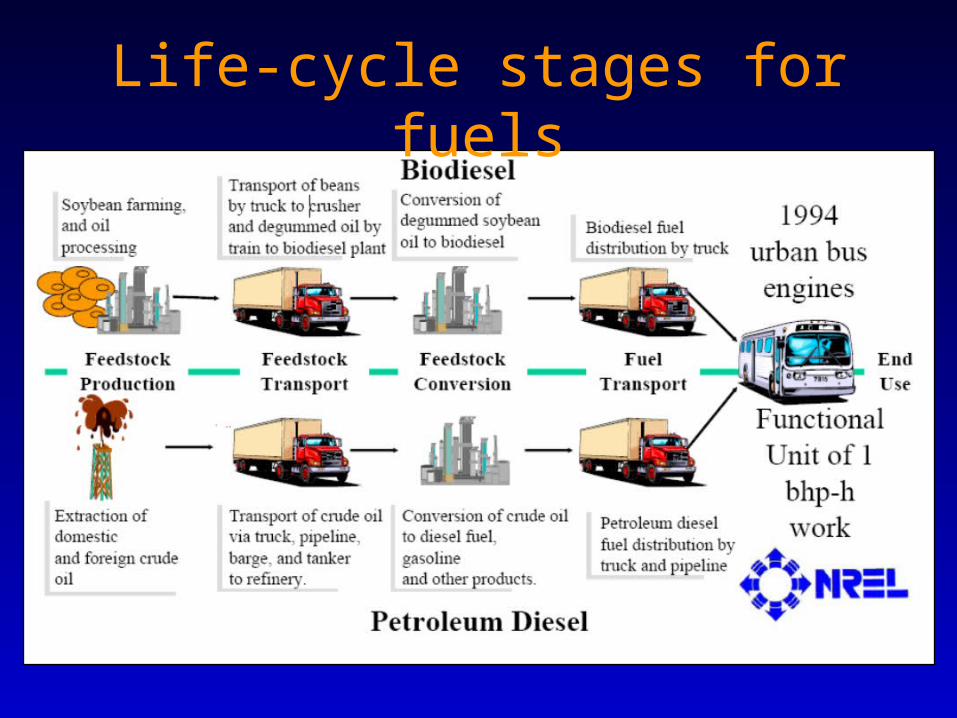
Life-cycle stages for fuels

IEA ethanol share of gasoline