liquid hydrogen production and delivery from a dedicated
TRANSCRIPT

May 2012
ENERGYU.S. DEPARTMENT OF
ANL-13/17
Argonne National Laboratory is managed by UChicago Argonne, LLC for the U.S. Department of Energy

Availability of This ReportThis report is available, at no cost, at http://www.osti.gov/bridge. It is also available on paper to the U.S. Department of Energy and its contractors, for a processing fee, from:
U.S. Department of Energy
Office of Scientific and Technical Information
P.O. Box 62
Oak Ridge, TN 37831-0062
phone (865) 576-8401
fax (865) 576-5728
DisclaimerThis report was prepared as an account of work sponsored by an agency of the United States Government. Neither the United States Government nor any agency thereof, nor UChicago Argonne, LLC, nor any of their employees or officers, makes any warranty, express or implied, or assumes any legal liability or responsibility for the accuracy, completeness, or usefulness of any information, apparatus, product, or process disclosed, or represents that its use would not infringe privately owned rights. Reference herein to any specific commercial product, process, or service by trade name, trademark, manufacturer, or otherwise, does not necessarily constitute or imply its endorsement, recommendation, or favoring by the United States Government or any agency thereof. The views and opinions of document authors expressed herein do not necessarily state or reflect those of the United States Government or any agency thereof, Argonne National Laboratory, or UChicago Argonne, LLC.
About Argonne National Laboratory Argonne is a U.S. Department of Energy laboratory managed by UChicago Argonne, LLC under contract DE-AC02-06CH11357. The Laboratory’s main facility is outside Chicago, at 9700 South Cass Avenue, Argonne, Illinois 60439. For information about Argonne and its pioneering science and technology programs, see www.anl.gov.

Liquid Hydrogen Production and Delivery from a Dedicated Wind Power Plant
Amgad Elgowainy and Marianne Mintz, Argonne National Laboratory
Darlene Steward and Olga Antonia, NREL
Daryl Brown, PNNL
Monterey Gardiner, DOE
May 2012

ABSTRACT .............................................................................................................................................................. 4
INTRODUCTION ....................................................................................................................................................... 5
PRODUCTION .......................................................................................................................................................... 8
2.1 System Characteristics ............................................................................................................................... 9
2.2 System Output and Cost ........................................................................................................................... 10
DELIVERY ............................................................................................................................................................. 14
3.1 Liquefaction ............................................................................................................................................. 15
3.2 Trucks ...................................................................................................................................................... 15
3.3 Fuel Stations ............................................................................................................................................ 15
3.4 Rail Delivery ............................................................................................................................................. 16
GREENHOUSE GAS EMISSIONS ............................................................................................................................... 18
SUMMARY AND CONCLUSIONS .............................................................................................................................. 19
REFERENCES ........................................................................................................................................................ 22
C O N T E N T S

L I Q U I D H Y D R O G E N P R O D U C T I O N A N D D E L I V E R Y F R O M A D E D I C A T E D W I N D P O W E R P L A N T
6
ABSTRACTThis report documents a case study on the production, liquefaction, and delivery of hydrogen from a dedicated wind
power plant located near Albuquerque, NM, to a fuel cell vehicle market in Los Angeles, CA. The study examined a
production scenario of 40 tonne/day needed to satisfy the demand of approximately 80,000 fuel cell vehicles. The
wind farm is connected to the grid and sized to have no net export or import to or from the grid, thus generating
no greenhouse gas (GHG) emissions from the electricity used by the electrolyzer and the liquefier. The hydrogen is
packaged and delivered in liquid form. As compared to gaseous hydrogen delivery and dispensing, liquid hydrogen (LH2)
provides higher purity, higher energy density, lower refueling station cost, and multiple dispensing options – gaseous,
liquid or cryo-compressed (high pressure, low temperature phase). The estimated cost of hydrogen production for this
case study is $6.7/kg and the cost of hydrogen delivery is $5/kg, resulting in a total delivered hydrogen cost of $11.7/
kg assuming a 10% internal rate of return (IRR). The relatively high production cost is due primarily to the capital cost of
the wind farm and liquefaction unit and required returns. Liquefaction cost can be reduced with increased demand, but
the capital cost of the wind farm is unlikely to benefit from such economies of scale. However, if one were to assume a
5% IRR, total delivered hydrogen cost could be reduced to $8.00/kg. Advantages of the wind-to-LH2 pathway include
its extremely low greenhouse gas emissions (10 g/MJ of hydrogen on a fuel-cycle basis or 20 g/mi on a well-to-
wheels basis) and similarity to today’s gasoline delivery infrastructure. Furthermore, while a kg of hydrogen contains
approximately the same amount of energy as a gallon of gasoline, a hydrogen fuel cell vehicle can drive more than
twice as far as a conventional internal combustion engine vehicle on that fuel. Thus, the $11.7/kg delivered cost of
hydrogen may be considered comparable to gasoline at approximately $6/gal.
L I Q U I D H Y D R O G E N P R O D U C T I O N A N D D E L I V E R Y F R O M A D E D I C A T E D W I N D P O W E R P L A N T
7
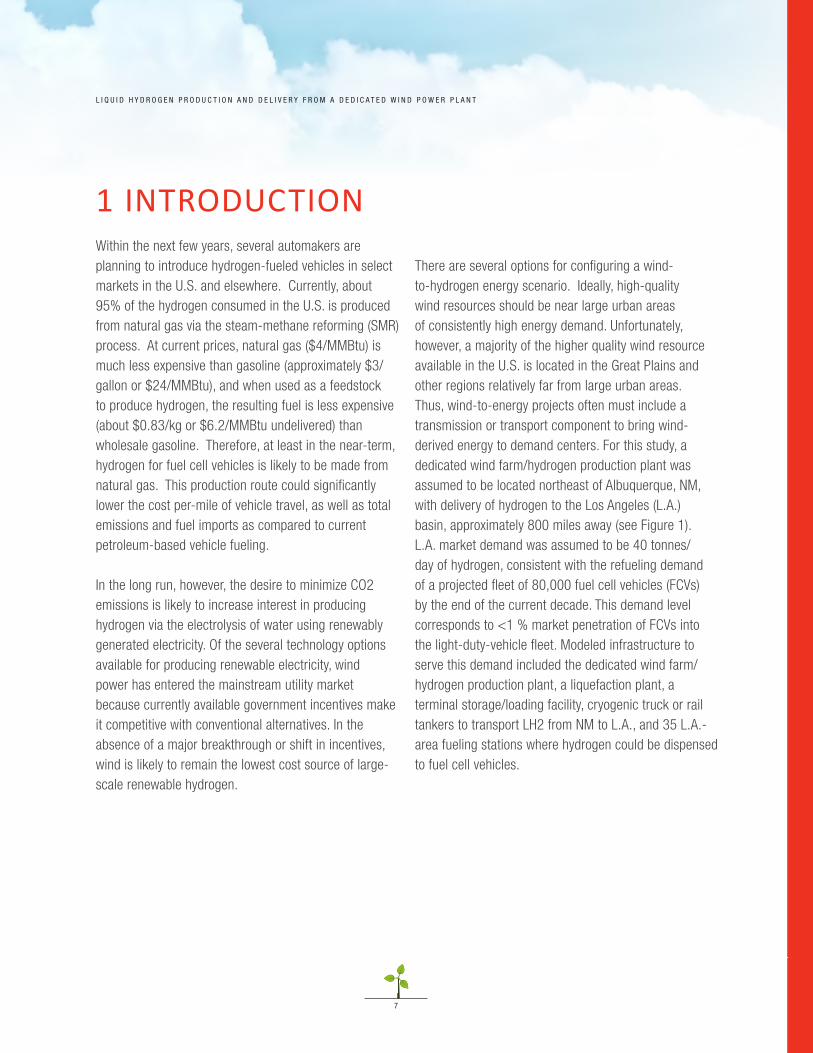
1 INTRODUCTIONWithin the next few years, several automakers are planning to introduce hydrogen-fueled vehicles in select markets in the U.S. and elsewhere. Currently, about 95% of the hydrogen consumed in the U.S. is produced from natural gas via the steam-methane reforming (SMR) process. At current prices, natural gas ($4/MMBtu) is much less expensive than gasoline (approximately $3/gallon or $24/MMBtu), and when used as a feedstock to produce hydrogen, the resulting fuel is less expensive (about $0.83/kg or $6.2/MMBtu undelivered) than wholesale gasoline. Therefore, at least in the near-term, hydrogen for fuel cell vehicles is likely to be made from natural gas. This production route could significantly lower the cost per-mile of vehicle travel, as well as total emissions and fuel imports as compared to current petroleum-based vehicle fueling.
In the long run, however, the desire to minimize CO2 emissions is likely to increase interest in producing hydrogen via the electrolysis of water using renewably generated electricity. Of the several technology options available for producing renewable electricity, wind power has entered the mainstream utility market because currently available government incentives make it competitive with conventional alternatives. In the absence of a major breakthrough or shift in incentives, wind is likely to remain the lowest cost source of large-scale renewable hydrogen.
There are several options for configuring a wind-to-hydrogen energy scenario. Ideally, high-quality wind resources should be near large urban areas of consistently high energy demand. Unfortunately, however, a majority of the higher quality wind resource available in the U.S. is located in the Great Plains and other regions relatively far from large urban areas. Thus, wind-to-energy projects often must include a transmission or transport component to bring wind-derived energy to demand centers. For this study, a dedicated wind farm/hydrogen production plant was assumed to be located northeast of Albuquerque, NM, with delivery of hydrogen to the Los Angeles (L.A.) basin, approximately 800 miles away (see Figure 1). L.A. market demand was assumed to be 40 tonnes/day of hydrogen, consistent with the refueling demand of a projected fleet of 80,000 fuel cell vehicles (FCVs) by the end of the current decade. This demand level corresponds to <1 % market penetration of FCVs into the light-duty-vehicle fleet. Modeled infrastructure to serve this demand included the dedicated wind farm/hydrogen production plant, a liquefaction plant, a terminal storage/loading facility, cryogenic truck or rail tankers to transport LH2 from NM to L.A., and 35 L.A.-area fueling stations where hydrogen could be dispensed to fuel cell vehicles.
7

L I Q U I D H Y D R O G E N P R O D U C T I O N A N D D E L I V E R Y F R O M A D E D I C A T E D W I N D P O W E R P L A N T
8
Two basic hydrogen production configurations were evaluated: a stand-alone (i.e., not connected to the electric grid) wind-to-energy plant and a grid-connected plant. The latter configuration was assumed to be designed and operated to achieve renewable electricity neutrality with respect to the grid, i.e., the sum of net annual flows of electricity to and from the grid approached zero).
The first configuration was soon found to be significantly more expensive than the second. Without the ability to purchase electricity when wind supply is low or to sell it back when supply is high, either nominal wind generating capacity had to be substantially oversized
(and power production shed during much of the year) or several months of hydrogen storage capacity had to be provided to maintain constant hydrogen production (and supply to L.A. fuel stations) despite persistently low wind speeds during the summer months. Geologic storage, generally the most economical option for storing hydrogen on the multi-month scale needed for this scenario, was investigated; however, the technical feasibility of storing hydrogen in formations other than salt domes (that are unavailable in the Albuquerque area) is unproven and the cost is uncertain. For these reasons, this analysis abandoned the grid-independent configuration. Only the grid-connected configuration is presented and discussed in this report1.
Figure 1. Location of U.S. Wind Resources, Major Population Centers, and Case Study
1For further discussion of the grid-independent case, see Mintz and Elgowainy 2010.
>10.010.0
9.59.08.58.07.57.06.5
Annual Average Wind Speed m/s at 80m

L I Q U I D H Y D R O G E N P R O D U C T I O N A N D D E L I V E R Y F R O M A D E D I C A T E D W I N D P O W E R P L A N T
9
In addition to hydrogen production and storage, this analysis also estimated the cost of hydrogen conditioning (i.e., compression and/or liquefaction), transport, and dispensing. Transporting hydrogen is always a relatively difficult task (as compared to conventional liquid fuels) because of its inherently low energy density at ambient temperature and pressure. In separate analyses, hydrogen transportation as a pressurized gas via truck or pipeline to relatively small markets at great distances from a production site was examined and found to be prohibitively expensive. Therefore, the scenario reported here assumed liquefaction of hydrogen at the wind/hydrogen plant in NM and transportation of LH2 (at −253° C) to L.A. via cryogenic truck or rail.
The following sections discuss the methodology used to model the various cost elements in the wind-to-hydrogen scenario, results obtained from the model runs, and the conclusions of this analysis. Following this brief introduction, Section 2 describes the assumptions used to estimate the cost and performance of the wind farm, electrolysis system, and site storage, and the results obtained. Section 3 provides comparable detail on liquefaction, truck transportation of LH2 from the NM wind/hydrogen plant to L.A., fuel station costs, and results of a rail delivery side analysis2. Section 4 examines energy use and greenhouse gas (GHG) emissions associated with hydrogen production and delivery on a fuel-cycle basis. Section 5 discusses aggregate results and conclusions from the analysis.
2Costs are estimated in 2009 dollars.
L I Q U I D H Y D R O G E N P R O D U C T I O N A N D D E L I V E R Y F R O M A D E D I C A T E D W I N D P O W E R P L A N T
1 0
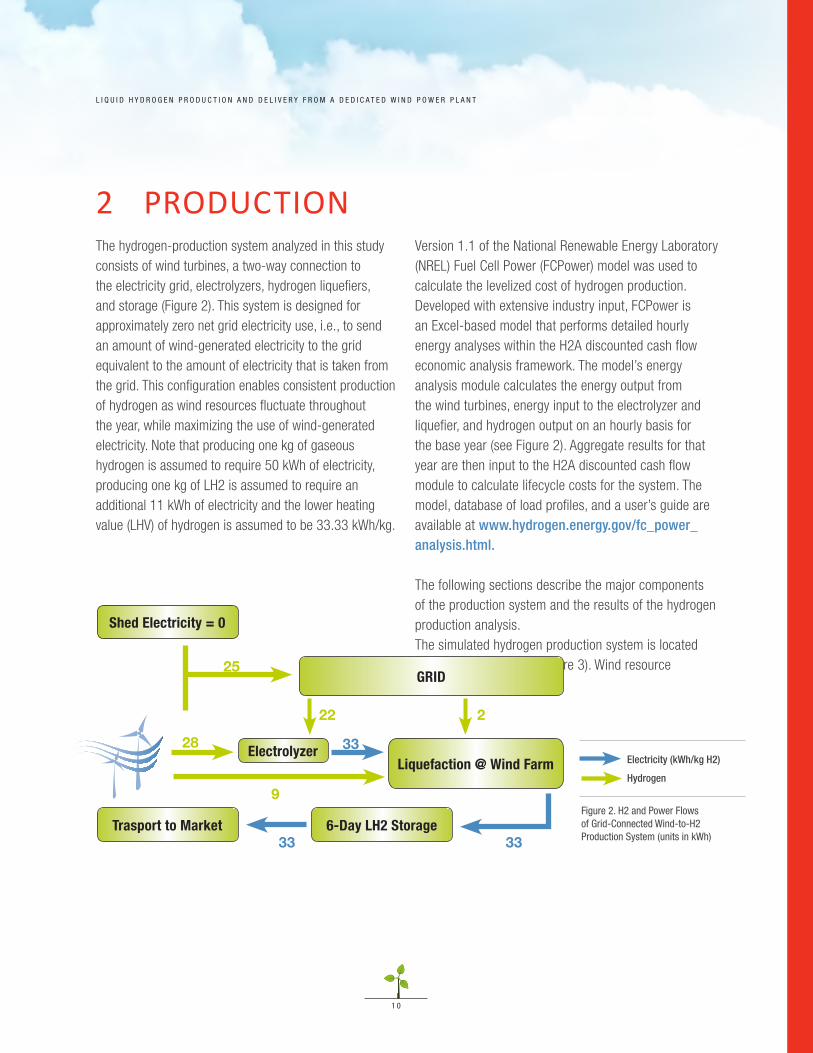
The hydrogen-production system analyzed in this study consists of wind turbines, a two-way connection to the electricity grid, electrolyzers, hydrogen liquefiers, and storage (Figure 2). This system is designed for approximately zero net grid electricity use, i.e., to send an amount of wind-generated electricity to the grid equivalent to the amount of electricity that is taken from the grid. This configuration enables consistent production of hydrogen as wind resources fluctuate throughout the year, while maximizing the use of wind-generated electricity. Note that producing one kg of gaseous hydrogen is assumed to require 50 kWh of electricity, producing one kg of LH2 is assumed to require an additional 11 kWh of electricity and the lower heating value (LHV) of hydrogen is assumed to be 33.33 kWh/kg.
Version 1.1 of the National Renewable Energy Laboratory (NREL) Fuel Cell Power (FCPower) model was used to calculate the levelized cost of hydrogen production. Developed with extensive industry input, FCPower is an Excel-based model that performs detailed hourly energy analyses within the H2A discounted cash flow economic analysis framework. The model’s energy analysis module calculates the energy output from the wind turbines, energy input to the electrolyzer and liquefier, and hydrogen output on an hourly basis for the base year (see Figure 2). Aggregate results for that year are then input to the H2A discounted cash flow module to calculate lifecycle costs for the system. The model, database of load profiles, and a user’s guide are available at www.hydrogen.energy.gov/fc_power_analysis.html.
The following sections describe the major components of the production system and the results of the hydrogen production analysis.The simulated hydrogen production system is located near Albuquerque, NM (Figure 3). Wind resource
2 PRODUCTION
Figure 2. H2 and Power Flows of Grid-Connected Wind-to-H2 Production System (units in kWh)
Shed Electricity = 0
ElectrolyzerLiquefaction @ Wind Farm
6-Day LH2 StorageTrasport to Market
GRID
22
25
2
33
28 33
33
9
Electricity (kWh/kg H2)
Hydrogen

L I Q U I D H Y D R O G E N P R O D U C T I O N A N D D E L I V E R Y F R O M A D E D I C A T E D W I N D P O W E R P L A N T
1 1
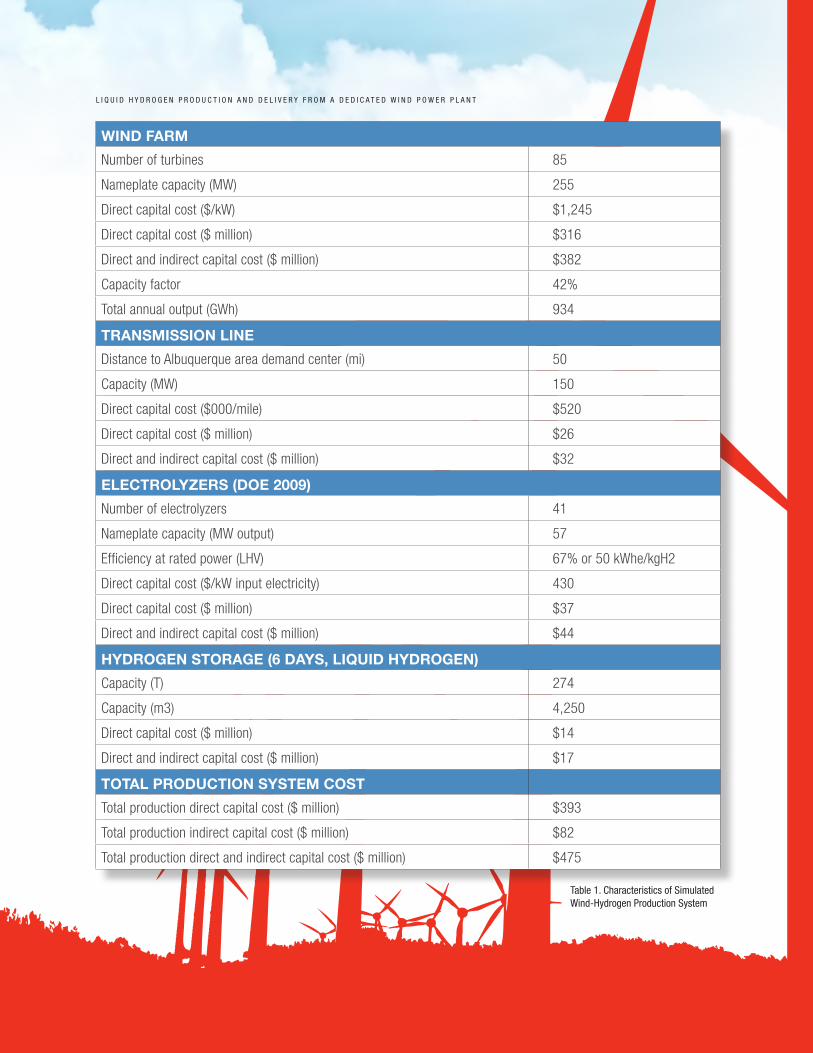
information for this area was obtained from NREL’s Western Wind Dataset, a set of modeled data based on weather predictions (NREL 2010). The Western Wind Dataset includes more than 1,770 MW of wind resource in the area of the wind farm. Less than 15% of the wind resource in this area would be required for hydrogen production. On a state-wide basis, this corresponds to only 0.06% of NM’s estimated wind resource potential.3 Table 1 summarizes key characteristics and costs of the hydrogen-production system, including the wind farm, dedicated transmission line from the wind farm
to the Albuquerque area demand center, electrolyzers, and six days of LH2 storage. Figure 4 shows direct installed capital costs for each system component as well as indirect capital costs for the entire system. The liquefaction component and cost are included in the delivery system (see Section 3 below). Wind turbine costs are derived primarily from the 2009 Wind Technologies Market Report (Wiser and Bolinger 2010). The report highlights the wide variation in installed costs for wind projects over the past decade, ranging from about $1,000/kW installed capacity to
Figure 3. Location of Wind Farm Relative to Albuquerque and the Nearest Transmission Line
3 Further, if all NM wind resources were harnessed to supply LH2, some 100 million fuel cell vehicles could be fueled from this resource alone. See http://www.windpoweringamerica.gov/wind_maps.asp.
2.1 SYSTEM CHARACTERISTICS
L I Q U I D H Y D R O G E N P R O D U C T I O N A N D D E L I V E R Y F R O M A D E D I C A T E D W I N D P O W E R P L A N T
1 2
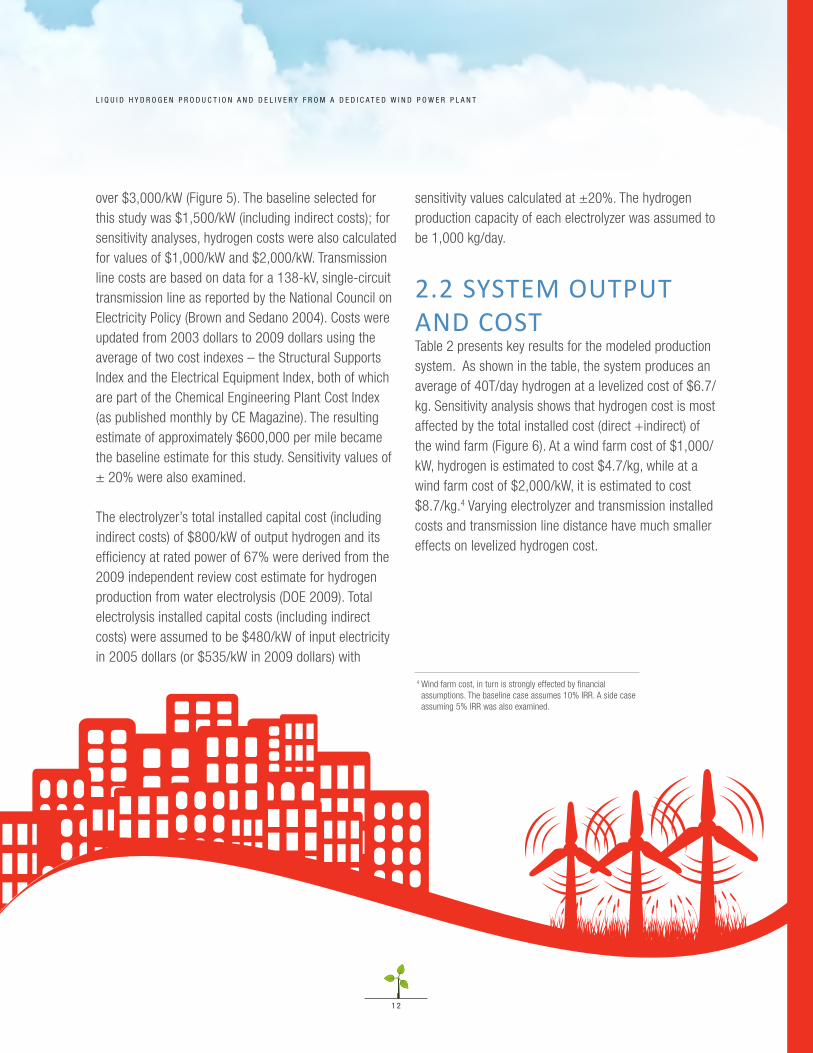
over $3,000/kW (Figure 5). The baseline selected for this study was $1,500/kW (including indirect costs); for sensitivity analyses, hydrogen costs were also calculated for values of $1,000/kW and $2,000/kW. Transmission line costs are based on data for a 138-kV, single-circuit transmission line as reported by the National Council on Electricity Policy (Brown and Sedano 2004). Costs were updated from 2003 dollars to 2009 dollars using the average of two cost indexes – the Structural Supports Index and the Electrical Equipment Index, both of which are part of the Chemical Engineering Plant Cost Index (as published monthly by CE Magazine). The resulting estimate of approximately $600,000 per mile became the baseline estimate for this study. Sensitivity values of ± 20% were also examined.
The electrolyzer’s total installed capital cost (including indirect costs) of $800/kW of output hydrogen and its efficiency at rated power of 67% were derived from the 2009 independent review cost estimate for hydrogen production from water electrolysis (DOE 2009). Total electrolysis installed capital costs (including indirect costs) were assumed to be $480/kW of input electricity in 2005 dollars (or $535/kW in 2009 dollars) with
sensitivity values calculated at ±20%. The hydrogen production capacity of each electrolyzer was assumed to be 1,000 kg/day.
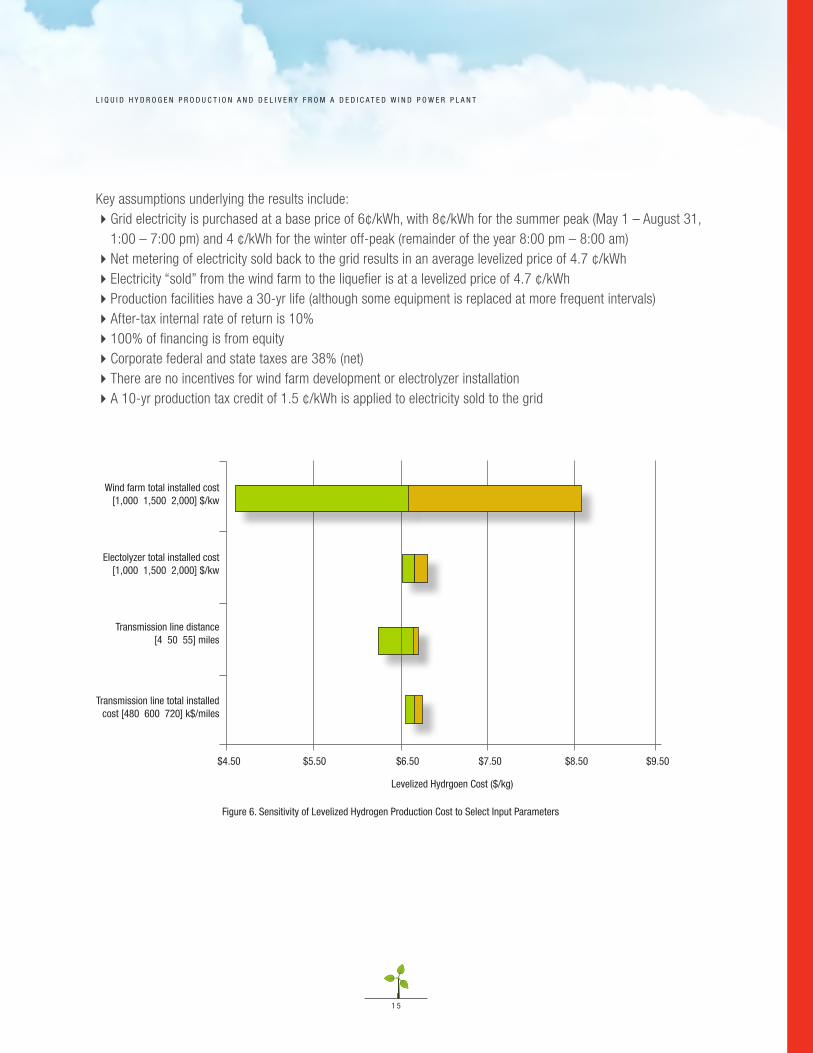
2.2 SYSTEM OUTPUT AND COST Table 2 presents key results for the modeled production system. As shown in the table, the system produces an average of 40T/day hydrogen at a levelized cost of $6.7/kg. Sensitivity analysis shows that hydrogen cost is most affected by the total installed cost (direct +indirect) of the wind farm (Figure 6). At a wind farm cost of $1,000/kW, hydrogen is estimated to cost $4.7/kg, while at a wind farm cost of $2,000/kW, it is estimated to cost $8.7/kg.4 Varying electrolyzer and transmission installed costs and transmission line distance have much smaller effects on levelized hydrogen cost.
4 Wind farm cost, in turn is strongly effected by financial assumptions. The baseline case assumes 10% IRR. A side case assuming 5% IRR was also examined.
L I Q U I D H Y D R O G E N P R O D U C T I O N A N D D E L I V E R Y F R O M A D E D I C A T E D W I N D P O W E R P L A N T
1 3
Table 1. Characteristics of Simulated Wind-Hydrogen Production System
WIND FARM
Number of turbines 85
Nameplate capacity (MW) 255
Direct capital cost ($/kW) $1,245
Direct capital cost ($ million) $316
Direct and indirect capital cost ($ million) $382
Capacity factor 42%
Total annual output (GWh) 934
TRANSMISSION LINE
Distance to Albuquerque area demand center (mi) 50
Capacity (MW) 150
Direct capital cost ($000/mile) $520
Direct capital cost ($ million) $26
Direct and indirect capital cost ($ million) $32
ELECTROLYZERS (DOE 2009)
Number of electrolyzers 41
Nameplate capacity (MW output) 57
Efficiency at rated power (LHV) 67% or 50 kWhe/kgH2
Direct capital cost ($/kW input electricity) 430
Direct capital cost ($ million) $37
Direct and indirect capital cost ($ million) $44
HYDROGEN STORAGE (6 DAYS, LIQUID HYDROGEN)
Capacity (T) 274
Capacity (m3) 4,250
Direct capital cost ($ million) $14
Direct and indirect capital cost ($ million) $17
TOTAL PRODUCTION SYSTEM COST
Total production direct capital cost ($ million) $393
Total production indirect capital cost ($ million) $82
Total production direct and indirect capital cost ($ million) $475

L I Q U I D H Y D R O G E N P R O D U C T I O N A N D D E L I V E R Y F R O M A D E D I C A T E D W I N D P O W E R P L A N T
1 4
5,000
1982
1983
1984
1985
1986
1987
1988
1989
1990
1991
1992
1993
1994
1995
1996
1997
1998
1999
2000
2001
2002
2003
2004
2005
2006
2007
2008
2009
4,500
4,000
3,500
3,000
2,500
2,000
1,500
1,000
500
0
Capacity -Weighted Average Project Cost
Range of Individual Project Cost
Polynomial Trend Line
Inst
alle
d Pr
ojec
ts C
ost (
2009
$/k
W)
Figure 5. Installed Cost of Wind Farm Projects, 1982–2009 (Wiser and Bolinger 2010)
Figure 4. Installed Capital Cost of the Wind-Hydrogen Production System ($393M)
Table 2. Key Production System Results
Wind Turbines, $316M
Indirect Capital Costs, $81M
Liquid Hydrogen Storage, $14M
Electrolyzers, $37M
Trasmission Lines, $26M
66%
17%
8%
6%
3%
HYDROGEN
Average production (T/day) 40
Levelized cost ($/kg) $6.7
ELECTRICITY
Wind farm to liquefier (% of wind farm output) 15
Wind electricity to electrolyzer (% of wind farm output) 45
Wind farm electricity to grid (% of wind farm output) 40
Electricity for hydrogen production directly from wind (%) 56
L I Q U I D H Y D R O G E N P R O D U C T I O N A N D D E L I V E R Y F R O M A D E D I C A T E D W I N D P O W E R P L A N T
1 5
Figure 6. Sensitivity of Levelized Hydrogen Production Cost to Select Input Parameters
Wind farm total installed cost [1,000 1,500 2,000] $/kw
Transmission line distance [4 50 55] miles
$4.50 $5.50 $6.50 $7.50 $8.50 $9.50
Electolyzer total installed cost [1,000 1,500 2,000] $/kw
Transmission line total installed cost [480 600 720] k$/miles
Levelized Hydrgoen Cost ($/kg)
Key assumptions underlying the results include:� Grid electricity is purchased at a base price of 6¢/kWh, with 8¢/kWh for the summer peak (May 1 – August 31,
1:00 – 7:00 pm) and 4 ¢/kWh for the winter off-peak (remainder of the year 8:00 pm – 8:00 am)�Net metering of electricity sold back to the grid results in an average levelized price of 4.7 ¢/kWh�Electricity “sold” from the wind farm to the liquefier is at a levelized price of 4.7 ¢/kWh�Production facilities have a 30-yr life (although some equipment is replaced at more frequent intervals)�After-tax internal rate of return is 10%�100% of financing is from equity�Corporate federal and state taxes are 38% (net)�There are no incentives for wind farm development or electrolyzer installation �A 10-yr production tax credit of 1.5 ¢/kWh is applied to electricity sold to the grid
L I Q U I D H Y D R O G E N P R O D U C T I O N A N D D E L I V E R Y F R O M A D E D I C A T E D W I N D P O W E R P L A N T
1 6
3 DELIVERYThe delivery costs presented here were computed from the Hydrogen Delivery Scenario Analysis Model (HDSAM), and the H2A Components model, developed by Argonne National Laboratory and the National Renewable Energy Laboratory with support from the U.S. Department of Energy’s (DOE’s) Office of Fuel Cell Technologies . HDSAM uses a generalized financial and cost engineering framework to estimate the levelized cost (i.e., cost plus a predefined return-on-investment) to deliver hydrogen in quantities sufficient to meet a given level of market demand for a selected delivery pathway. The model links pathway stages or “components” in a systematic market setting to develop capacity/flow parameters for a complete hydrogen delivery infrastructure. Using that systems level perspective, HDSAM calculates the full, levelized cost (i.e., summed across all components) of hydrogen delivery, accounting for losses and tradeoffs among the various component costs. The cost estimates in the model are generated in U.S. dollars using 2005 prices. For this analysis, costs are inflated with an economy-wide price index to 2009 dollars.
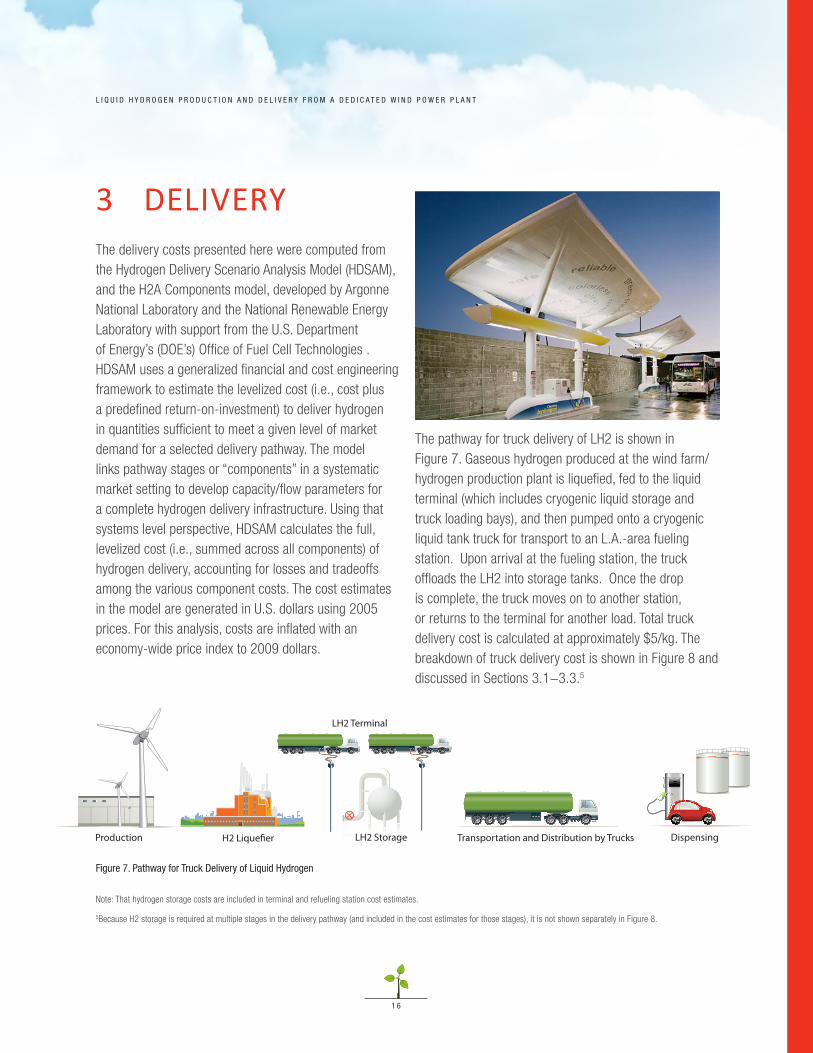
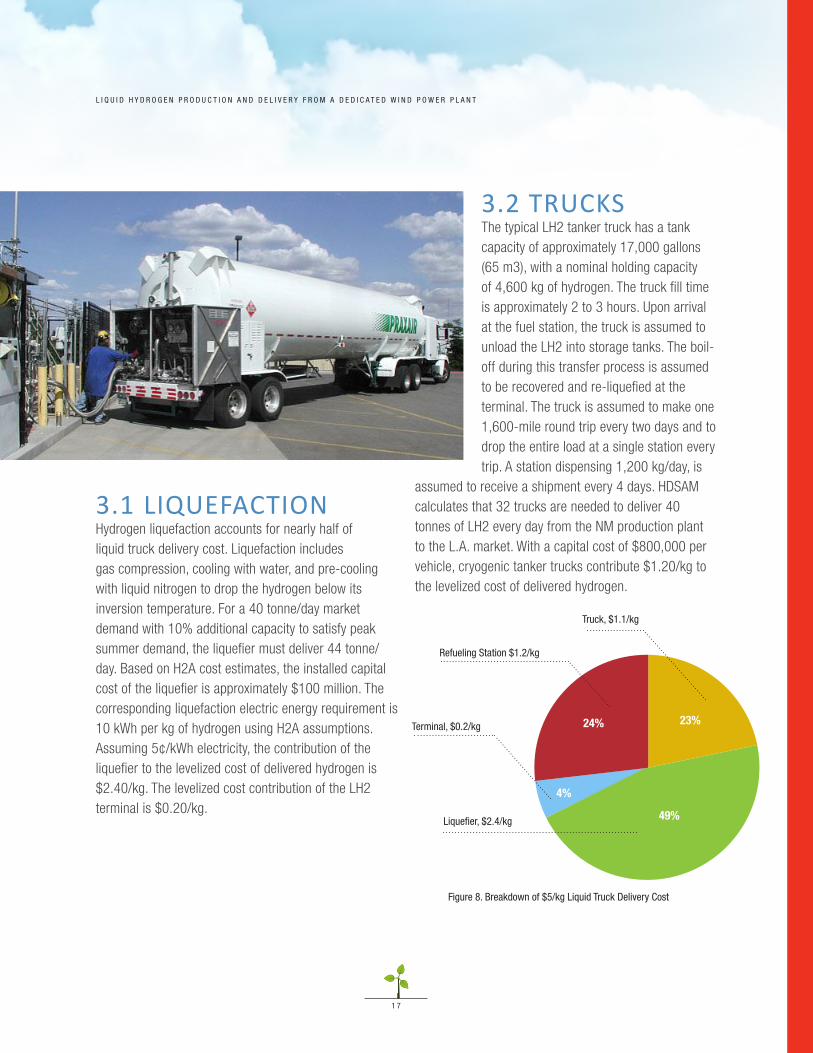
The pathway for truck delivery of LH2 is shown in Figure 7. Gaseous hydrogen produced at the wind farm/hydrogen production plant is liquefied, fed to the liquid terminal (which includes cryogenic liquid storage and truck loading bays), and then pumped onto a cryogenic liquid tank truck for transport to an L.A.-area fueling station. Upon arrival at the fueling station, the truck offloads the LH2 into storage tanks. Once the drop is complete, the truck moves on to another station, or returns to the terminal for another load. Total truck delivery cost is calculated at approximately $5/kg. The breakdown of truck delivery cost is shown in Figure 8 and discussed in Sections 3.1−3.3.5
Transportation and Distribution by Trucks Production
LH2 Terminal
LH2 StorageH2 Lique�er Dispensing
Figure 7. Pathway for Truck Delivery of Liquid Hydrogen
Note: That hydrogen storage costs are included in terminal and refueling station cost estimates.
5Because H2 storage is required at multiple stages in the delivery pathway (and included in the cost estimates for those stages), it is not shown separately in Figure 8.
L I Q U I D H Y D R O G E N P R O D U C T I O N A N D D E L I V E R Y F R O M A D E D I C A T E D W I N D P O W E R P L A N T
1 7
3.1 LIQUEFACTIONHydrogen liquefaction accounts for nearly half of liquid truck delivery cost. Liquefaction includes gas compression, cooling with water, and pre-cooling with liquid nitrogen to drop the hydrogen below its inversion temperature. For a 40 tonne/day market demand with 10% additional capacity to satisfy peak summer demand, the liquefier must deliver 44 tonne/day. Based on H2A cost estimates, the installed capital cost of the liquefier is approximately $100 million. The corresponding liquefaction electric energy requirement is 10 kWh per kg of hydrogen using H2A assumptions. Assuming 5¢/kWh electricity, the contribution of the liquefier to the levelized cost of delivered hydrogen is $2.40/kg. The levelized cost contribution of the LH2 terminal is $0.20/kg.
3.2 TRUCKSThe typical LH2 tanker truck has a tank capacity of approximately 17,000 gallons (65 m3), with a nominal holding capacity of 4,600 kg of hydrogen. The truck fill time is approximately 2 to 3 hours. Upon arrival at the fuel station, the truck is assumed to unload the LH2 into storage tanks. The boil-off during this transfer process is assumed to be recovered and re-liquefied at the terminal. The truck is assumed to make one 1,600-mile round trip every two days and to drop the entire load at a single station every trip. A station dispensing 1,200 kg/day, is
assumed to receive a shipment every 4 days. HDSAM calculates that 32 trucks are needed to deliver 40 tonnes of LH2 every day from the NM production plant to the L.A. market. With a capital cost of $800,000 per vehicle, cryogenic tanker trucks contribute $1.20/kg to the levelized cost of delivered hydrogen.
23%24%
4%
Truck, $1.1/kg
Refueling Station $1.2/kg
Terminal, $0.2/kg
Liquefier, $2.4/kg
Figure 8. Breakdown of $5/kg Liquid Truck Delivery Cost
49%
L I Q U I D H Y D R O G E N P R O D U C T I O N A N D D E L I V E R Y F R O M A D E D I C A T E D W I N D P O W E R P L A N T
1 8
3.3 FUEL STATIONSThe liquid fueling station contains all components necessary to vaporize LH2 for dispensing into fuel cell vehicles. From the liquid storage tanks, hydrogen is pumped to the dispensing pressure, evaporated using cryo-evaporators, and fed to a three-stage cascade system with a maximum pressure of 430 bar (6,250 psi). Gaseous hydrogen is then loaded onto the vehicle at 350 bar (5,000 psi). The station is assumed to dispense 1,200 kg of hydrogen every day. Thus, 35 stations are required to satisfy a 40-tonne/day average demand in the L.A. area. To account for seasonal, weekly, and daily demand peaks, each station is configured to dispense a maximum of 1,400 kg per day. Since hourly demand also varies throughout the day, stations are sized to dispense double the average daily demand during the peak hour and to fill vehicles at a rate of 3 kg/min when all hoses are occupied. Thus, the station is equipped with two dispensers, each of which has two hoses and a pumping capacity of 50 kg/h. Site storage (at the station) is sized to receive an entire truckload (4,600 kg) of LH2. The capital cost of the station components is shown in Table 3. The total installed capital cost of each station is calculated at $1.6 million, with a total capital investment of $2.0 million. The contribution of the refueling station to the levelized cost of delivered hydrogen is calculated at $1.20/kg.
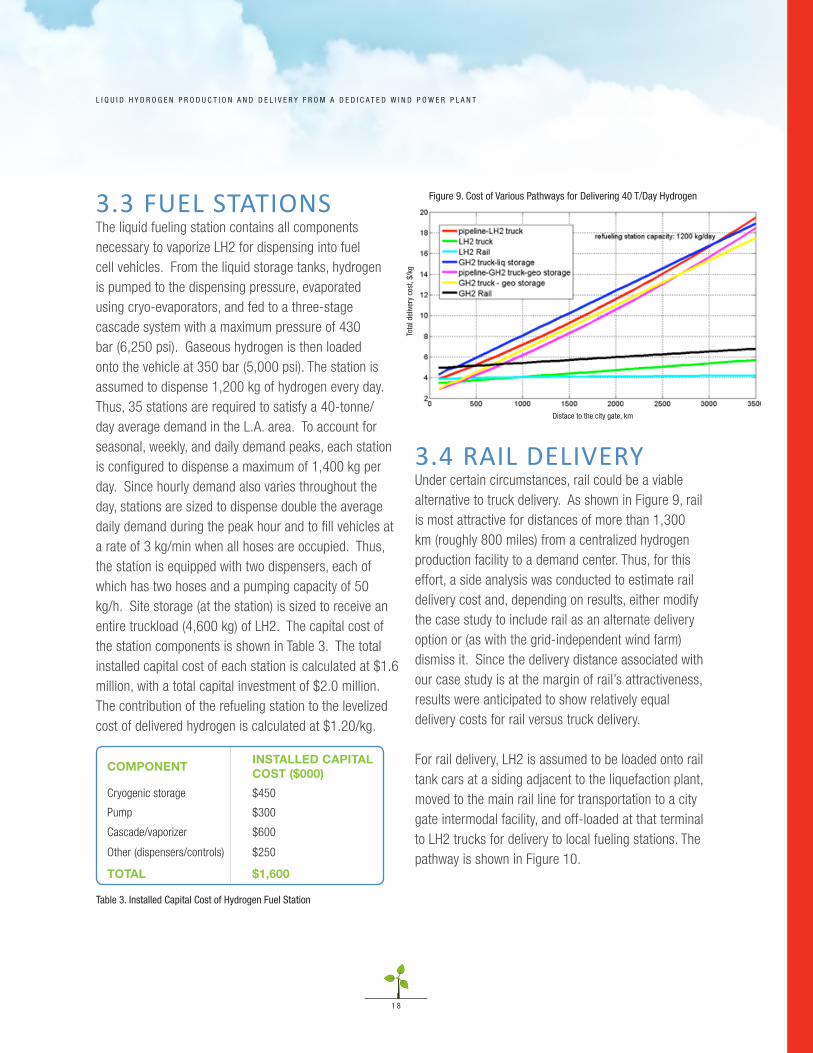
3.4 RAIL DELIVERYUnder certain circumstances, rail could be a viable alternative to truck delivery. As shown in Figure 9, rail is most attractive for distances of more than 1,300 km (roughly 800 miles) from a centralized hydrogen production facility to a demand center. Thus, for this effort, a side analysis was conducted to estimate rail delivery cost and, depending on results, either modify the case study to include rail as an alternate delivery option or (as with the grid-independent wind farm) dismiss it. Since the delivery distance associated with our case study is at the margin of rail’s attractiveness, results were anticipated to show relatively equal delivery costs for rail versus truck delivery.
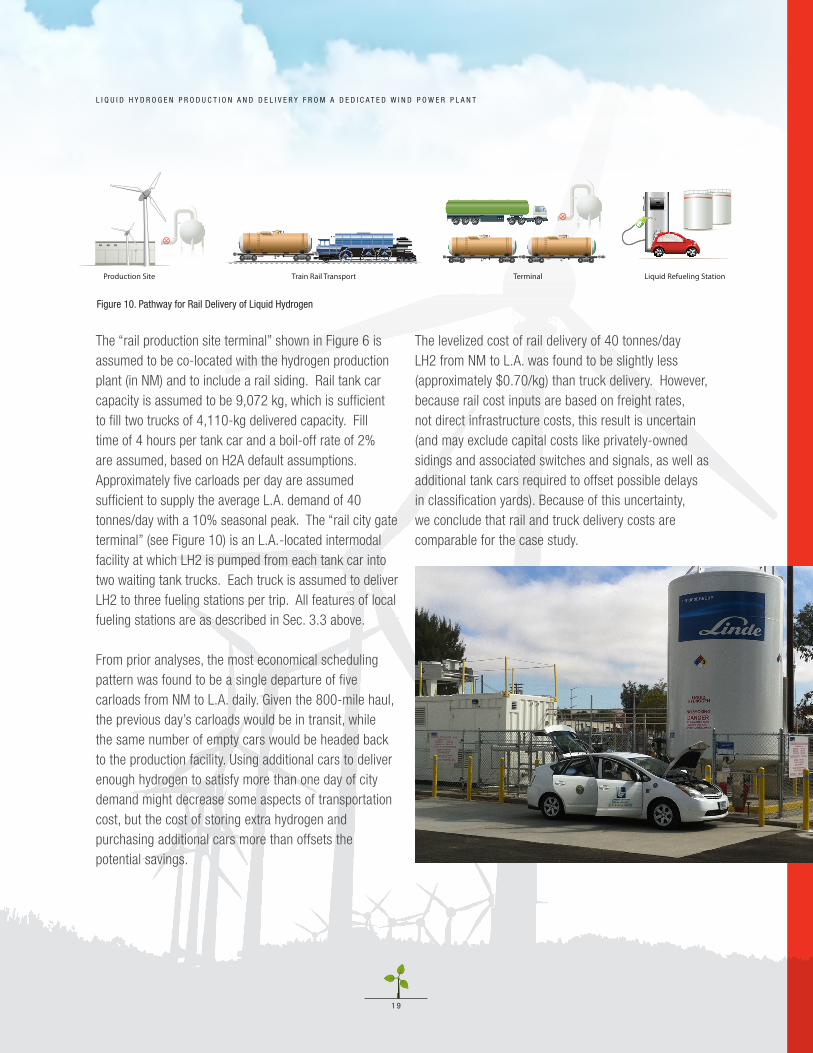
For rail delivery, LH2 is assumed to be loaded onto rail tank cars at a siding adjacent to the liquefaction plant, moved to the main rail line for transportation to a city gate intermodal facility, and off-loaded at that terminal to LH2 trucks for delivery to local fueling stations. The pathway is shown in Figure 10.
COMPONENTINSTALLED CAPITAL COST ($000)
Cryogenic storage $450
Pump $300
Cascade/vaporizer $600
Other (dispensers/controls) $250
TOTAL $1,600
Table 3. Installed Capital Cost of Hydrogen Fuel Station
Distace to the city gate, kmTo
tal d
eliv
ery
cost
, $/k
g
Figure 9. Cost of Various Pathways for Delivering 40 T/Day Hydrogen
L I Q U I D H Y D R O G E N P R O D U C T I O N A N D D E L I V E R Y F R O M A D E D I C A T E D W I N D P O W E R P L A N T
1 9
The “rail production site terminal” shown in Figure 6 is assumed to be co-located with the hydrogen production plant (in NM) and to include a rail siding. Rail tank car capacity is assumed to be 9,072 kg, which is sufficient to fill two trucks of 4,110-kg delivered capacity. Fill time of 4 hours per tank car and a boil-off rate of 2% are assumed, based on H2A default assumptions. Approximately five carloads per day are assumed sufficient to supply the average L.A. demand of 40 tonnes/day with a 10% seasonal peak. The “rail city gate terminal” (see Figure 10) is an L.A.-located intermodal facility at which LH2 is pumped from each tank car into two waiting tank trucks. Each truck is assumed to deliver LH2 to three fueling stations per trip. All features of local fueling stations are as described in Sec. 3.3 above.
From prior analyses, the most economical scheduling pattern was found to be a single departure of five carloads from NM to L.A. daily. Given the 800-mile haul, the previous day’s carloads would be in transit, while the same number of empty cars would be headed back to the production facility. Using additional cars to deliver enough hydrogen to satisfy more than one day of city demand might decrease some aspects of transportation cost, but the cost of storing extra hydrogen and purchasing additional cars more than offsets the potential savings.
The levelized cost of rail delivery of 40 tonnes/day LH2 from NM to L.A. was found to be slightly less (approximately $0.70/kg) than truck delivery. However, because rail cost inputs are based on freight rates, not direct infrastructure costs, this result is uncertain (and may exclude capital costs like privately-owned sidings and associated switches and signals, as well as additional tank cars required to offset possible delays in classification yards). Because of this uncertainty, we conclude that rail and truck delivery costs are comparable for the case study.
Train Rail Transport Liquid Refueling StationTerminal Production Site
Figure 10. Pathway for Rail Delivery of Liquid Hydrogen

L I Q U I D H Y D R O G E N P R O D U C T I O N A N D D E L I V E R Y F R O M A D E D I C A T E D W I N D P O W E R P L A N T
2 0
4 GREENHOUSE GAS EMISSIONSIn addition to estimating the cost of producing and delivering wind-derived hydrogen from NM to L.A., the study also examined the GHG emissions associated with hydrogen production, liquefaction, transmission, and distribution to the subject market. Potential reductions in GHG emissions are important discriminators among alternative energy sources. Though often claimed to be the ultimate low-GHG energy source, hydrogen (like electricity) may or may not achieve low GHG emissions. Emissions are dependent on how the energy is produced. Energy use and GHG emissions should be calculated on a fuel-cycle basis (Wang 1996). For example, using electricity to produce or liquefy hydrogen does not produce any on-site emissions, but significant emissions can occur upstream in the process of generating electricity at the power plants. The GHG emissions from the average electricity generation mix in the U.S. represent the major barrier to delivering hydrogen in liquid form. This barrier will be exacerbated further if hydrogen is produced by electrolysis drawing
from the same mix. Table 4 shows two scenarios for the GHG emissions associated with hydrogen production and delivery. The first scenario assumes that the electricity needed for producing hydrogen via electrolysis and for liquefaction is supplied by the U.S. average electricity generation mix, while the second scenario assumes that all such electricity is supplied by wind-power generation, as is the case of this analysis. The fuel-cycle GHGs emission is a staggering 450 g/MJ of hydrogen for the U.S. mix scenario, but a mere 10 g/MJ for the renewable scenario. Assuming an average fuel economy of 60 mi/kg (0.5 mi/MJ) for fuel cell vehicles, the above GHG emissions translate to 900 g/mi for the U.S. mix case and 20 g/mi for the wind-to- LH2 case. When compared to the 470 g/mi GHG emissions for conventional gasoline vehicles or the 330 g/mi for gasoline hybrid electric vehicles, the environmental advantage of the wind-to-LH2 pathway becomes more evident.
PATHWAY STAGE FUEL-CYCLE GHG EMISSIONS [G/MJ OF HYDROGEN]
U.S. Average Generation Mix Renewable Electricity (wind)
Production (electrolysis) 370 0
Liquefaction 70 0
Truck 8 8
Refueling Station 2 2
Total 450 10
Table 4. GHG Emissions of Hydrogen Production and Delivery by Source of Electricity Used
L I Q U I D H Y D R O G E N P R O D U C T I O N A N D D E L I V E R Y F R O M A D E D I C A T E D W I N D P O W E R P L A N T
2 1
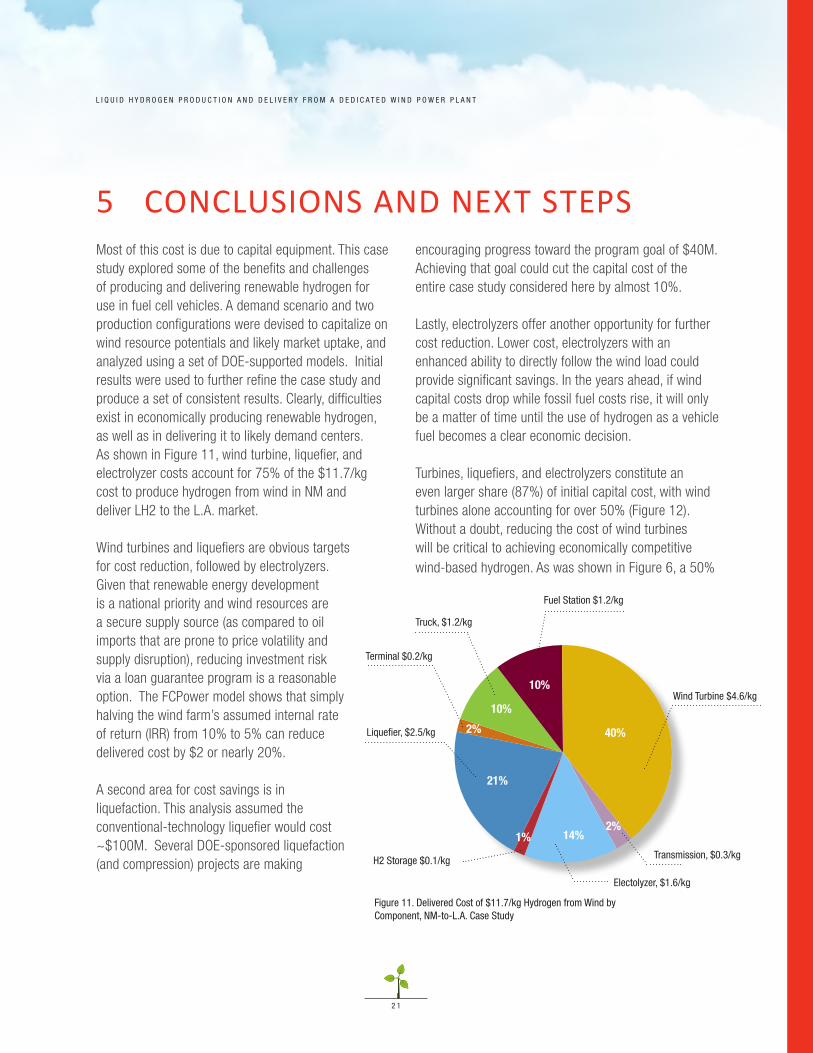
5 CONCLUSIONS AND NEXT STEPSMost of this cost is due to capital equipment. This case study explored some of the benefits and challenges of producing and delivering renewable hydrogen for use in fuel cell vehicles. A demand scenario and two production configurations were devised to capitalize on wind resource potentials and likely market uptake, and analyzed using a set of DOE-supported models. Initial results were used to further refine the case study and produce a set of consistent results. Clearly, difficulties exist in economically producing renewable hydrogen, as well as in delivering it to likely demand centers. As shown in Figure 11, wind turbine, liquefier, and electrolyzer costs account for 75% of the $11.7/kg cost to produce hydrogen from wind in NM and deliver LH2 to the L.A. market.
Wind turbines and liquefiers are obvious targets for cost reduction, followed by electrolyzers. Given that renewable energy development is a national priority and wind resources are a secure supply source (as compared to oil imports that are prone to price volatility and supply disruption), reducing investment risk via a loan guarantee program is a reasonable option. The FCPower model shows that simply halving the wind farm’s assumed internal rate of return (IRR) from 10% to 5% can reduce delivered cost by $2 or nearly 20%.
A second area for cost savings is in liquefaction. This analysis assumed the conventional-technology liquefier would cost ~$100M. Several DOE-sponsored liquefaction (and compression) projects are making
encouraging progress toward the program goal of $40M. Achieving that goal could cut the capital cost of the entire case study considered here by almost 10%.
Lastly, electrolyzers offer another opportunity for further cost reduction. Lower cost, electrolyzers with an enhanced ability to directly follow the wind load could provide significant savings. In the years ahead, if wind capital costs drop while fossil fuel costs rise, it will only be a matter of time until the use of hydrogen as a vehicle fuel becomes a clear economic decision.
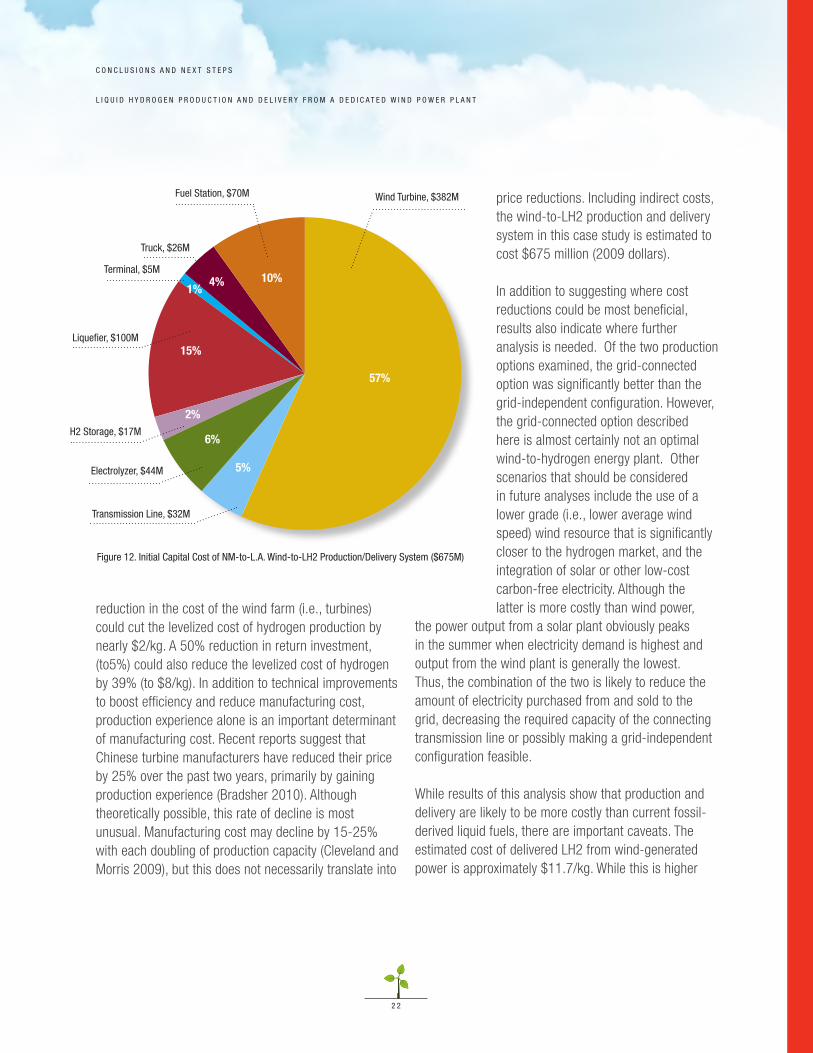
Turbines, liquefiers, and electrolyzers constitute an even larger share (87%) of initial capital cost, with wind turbines alone accounting for over 50% (Figure 12). Without a doubt, reducing the cost of wind turbines will be critical to achieving economically competitive wind-based hydrogen. As was shown in Figure 6, a 50%
Wind Turbine $4.6/kg
H2 Storage $0.1/kg
Electolyzer, $1.6/kg
Transmission, $0.3/kg
Truck, $1.2/kg
Liquefier, $2.5/kg
Terminal $0.2/kg
Fuel Station $1.2/kg
40%
10%
10%
2%
21%
1% 14%2%
Figure 11. Delivered Cost of $11.7/kg Hydrogen from Wind by Component, NM-to-L.A. Case Study
L I Q U I D H Y D R O G E N P R O D U C T I O N A N D D E L I V E R Y F R O M A D E D I C A T E D W I N D P O W E R P L A N T
2 2
C O N C L U S I O N S A N D N E X T S T E P S
57%
10%4%1%
15%
6%
5%
2%
Truck, $26M
Terminal, $5M
Liquefier, $100M
H2 Storage, $17M
Electrolyzer, $44M
Transmission Line, $32M
Wind Turbine, $382MFuel Station, $70M
reduction in the cost of the wind farm (i.e., turbines) could cut the levelized cost of hydrogen production by nearly $2/kg. A 50% reduction in return investment, (to5%) could also reduce the levelized cost of hydrogen by 39% (to $8/kg). In addition to technical improvements to boost efficiency and reduce manufacturing cost, production experience alone is an important determinant of manufacturing cost. Recent reports suggest that Chinese turbine manufacturers have reduced their price by 25% over the past two years, primarily by gaining production experience (Bradsher 2010). Although theoretically possible, this rate of decline is most unusual. Manufacturing cost may decline by 15-25% with each doubling of production capacity (Cleveland and Morris 2009), but this does not necessarily translate into
price reductions. Including indirect costs, the wind-to-LH2 production and delivery system in this case study is estimated to cost $675 million (2009 dollars).
In addition to suggesting where cost reductions could be most beneficial, results also indicate where further analysis is needed. Of the two production options examined, the grid-connected option was significantly better than the grid-independent configuration. However, the grid-connected option described here is almost certainly not an optimal wind-to-hydrogen energy plant. Other scenarios that should be considered in future analyses include the use of a lower grade (i.e., lower average wind speed) wind resource that is significantly closer to the hydrogen market, and the integration of solar or other low-cost carbon-free electricity. Although the latter is more costly than wind power,
the power output from a solar plant obviously peaks in the summer when electricity demand is highest and output from the wind plant is generally the lowest. Thus, the combination of the two is likely to reduce the amount of electricity purchased from and sold to the grid, decreasing the required capacity of the connecting transmission line or possibly making a grid-independent configuration feasible.
While results of this analysis show that production and delivery are likely to be more costly than current fossil-derived liquid fuels, there are important caveats. The estimated cost of delivered LH2 from wind-generated power is approximately $11.7/kg. While this is higher
Figure 12. Initial Capital Cost of NM-to-L.A. Wind-to-LH2 Production/Delivery System ($675M)
L I Q U I D H Y D R O G E N P R O D U C T I O N A N D D E L I V E R Y F R O M A D E D I C A T E D W I N D P O W E R P L A N T
2 3
than today’s gasoline cost (~$3/gallon), a fuel-cell vehicle can travel more than twice as far on a kg of hydrogen as can a conventional internal combustion vehicle on roughly the same amount of energy contained in a gallon of gasoline. If carbon mitigation policies were to raise the price of gasoline and grow the demand for hydrogen or if economies of scale associated with increased hydrogen demand were to reduce its delivered cost, the difference between hydrogen and gasoline could be reduced still further.
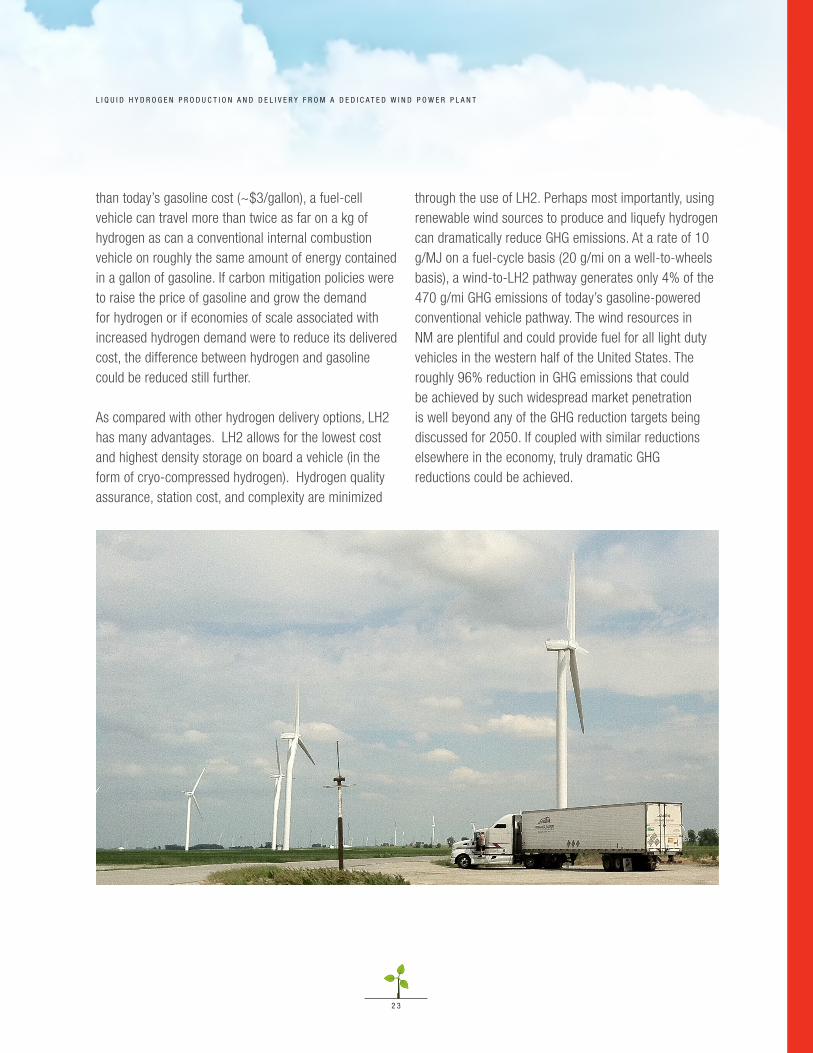
As compared with other hydrogen delivery options, LH2 has many advantages. LH2 allows for the lowest cost and highest density storage on board a vehicle (in the form of cryo-compressed hydrogen). Hydrogen quality assurance, station cost, and complexity are minimized
through the use of LH2. Perhaps most importantly, using renewable wind sources to produce and liquefy hydrogen can dramatically reduce GHG emissions. At a rate of 10 g/MJ on a fuel-cycle basis (20 g/mi on a well-to-wheels basis), a wind-to-LH2 pathway generates only 4% of the 470 g/mi GHG emissions of today’s gasoline-powered conventional vehicle pathway. The wind resources in NM are plentiful and could provide fuel for all light duty vehicles in the western half of the United States. The roughly 96% reduction in GHG emissions that could be achieved by such widespread market penetration is well beyond any of the GHG reduction targets being discussed for 2050. If coupled with similar reductions elsewhere in the economy, truly dramatic GHG reductions could be achieved.

L I Q U I D H Y D R O G E N P R O D U C T I O N A N D D E L I V E R Y F R O M A D E D I C A T E D W I N D P O W E R P L A N T
2 4
6 REFERENCESBradsher, K. 2010. “On Clean Energy, China Skirts Rules”,
New York Times, September 9.
Brown, M.H., and R.P. Sedano. 2004.
Electricity Transmission: A Primer. Washington, D.C.:
National Council on Electricity Policy. www.oe.energy.gov/
DocumentsandMedia/primer.pdf.
Cleveland, C., and C. Morris, 2009. Dictionary of Energy, Elsevier.
DOE (U.S. Department of Energy). 2009. Current (2009) State-of-
the-Art Hydrogen Production Cost Estimate Using Water Electrolysis.
Report No. NREL/BK-6A1-46676. Golden, CO: National Renewable
Energy Laboratory. www.nrel.gov/docs/fy10osti/46676.pdf.
DOE. 2010. United States—Wind Resource Potential.
www.windpoweringamerica.gov/wind_maps.asp.
Federal Register. 2008. Rules and Regulations:
November 12, 2008 (Volume 73, Number 219).
http://edocket.access.gpo.gov/2008/E8-26570.htm.
HDSAM (Hydrogen Delivery Scenario Analysis Model). 2010.
www.hydrogen.energy.gov/h2a_delivery.html.
Mintz, M and A. Elqowainy. 2010. Hydrogen Delivery Infrastructure
Analysis, Sec. 3.1, 2010 Office of Fuel Cell Technologies Annual
Report. http://www1.eere.energy.gov/hydrogenandfuelcells/mypp/
National Atlas. 2010. National Atlas of the United States.
http://nationalatlas.gov.
NREL (National Renewable Energy Laboratory). 2010.
Western Wind Dataset. www.nrel.gov/wind/integrationdatasets/
western/methodology.html.
NREL 2010. FCPower 1.1 (Fuel Cell Power Model).
www.hydrogen.energy.gov/fc_power_analysis.html
Wang, M.Q. 1996. Development and Use of the GREET Model
to Estimate Fuel-Cycle Energy Use and Emissions of Various
Transportation Technologies and Fuels. Report No. ANL/ESD-31.
Argonne, IL: Argonne National Laboratory.
Wiser, R., and M. Bolinger. 2010. 2009 Wind Technologies Market
Report. Report No. LBNL-3716E. Berkeley, CA: Lawrence Berkeley
National Laboratory. http://eetd.lbl.gov/ea/emp/re-pubs.html.