liquid-liquid phase transitions in glass-forming systems
TRANSCRIPT
Liquid-liquid phase transitions in glass-forming systems and their implications for memory technology
Pierre Lucas1, Shuai Wei2, C. Austen Angell3 1Department of Materials Science and Engineering, University of Arizona, Tucson, AZ 85721, USA
2Institute of Physics IA, RWTH Aachen University, 52074, Aachen, Germany 3School of Molecular Sciences, Arizona State University, Tempe, AZ, 85287, USA
Correspondence: [email protected]
Abstract:
While it is broadly known that solid compounds may exist in distinct crystalline arrangements
(polymorphs), the notion that some liquids may also adopt distinct phases with dissimilar
structures and densities is much less widespread. One of the reasons is that these liquid-liquid (L-
L) transitions often occur in the supercooled equilibrium regime below the melting line and can
be challenging to observe experimentally. Glass-forming liquids that supercool over significant
temperature ranges can therefore constitute useful systems for investigating these transitions. In
this paper we review experimental evidence for L-L transitions in chalcogenide systems. In that
respect, L-L transitions are found to be associated with transitions from fragile to strong viscous
behavior in these glass-forming liquids. Moreover, they are signaled by extrema in multiple
thermodynamic functions and sharp change in physical properties such as electrical conductivity.
Finally, while the physical principles underlying these transitions are still unclear, they have
been shown to play a critical role in the function of phase change materials that are poised to
transform fast computing technologies.
1 INTRODUCTION
Glass forming liquids have the ability to bypass crystallization upon cooling and can persist as
metastable equilibrium liquids down to temperatures far below the melting point. Normally, their
density, enthalpy, viscosity and other physical properties vary monotonically with decreasing
temperature until they eventually vitrify. The rate of change of these physical properties differs
greatly between material systems and the temperature dependence of the viscosity in particular

has been broadly used to categorize glass forming liquids1, 2. Liquids that show an Arrhenius
dependence are classified as “strong” while those that depart greatly from the Arrhenius behavior
are classified as fragile3. In either case, the volume, enthalpy or entropy decrease in a continuous
fashion as the viscosity increases4. However, a growing number of systems are found to exhibit
abnormal changes in viscosity with temperature as they undergo a transition from fragile to
strong (F-S)5-14. These transitions are associated with anomalies in multiple thermodynamic
variables such as the heat capacity, expansion coefficient and compressibility7, 15. In some cases
the F-S crossover can be extremely sharp, indeed discontinuous, as in the case of Si16 and models
of water17. Such anomalies have been linked to the presence of a liquid-liquid phase transition
which may be hidden below the melting point and can only be observed in the supercooled
regime18, 19. The observation of such L-L transitions can therefore be challenging as the liquid
has a limited range of stability between crystallization at high temperature and vitrification at
lower temperature20. Nevertheless, even when the system vitrifies, the presence of the L-L
transition may still be revealed in the form of solid-solid polyamorphic transitions between two
distinct glassy phases21-23. In this case the transition is most commonly observed by changing
pressure rather than temperature.
While this type of L-L transition has initially raised interest for its fundamental importance in
understanding fluid thermodynamics24, it has recently been suggested that it may play a key role
in enabling advanced information storage technologies18, 19, 25-27. Indeed, the phase memory
alloys that are the central elements of ultrafast nonvolatile computer memories have been shown
to exhibit L-L transitions and the associated F-S transitions25. The L-L transitions are essential to
the operation of these devices because the phase change memory alloys must exhibit ultrafast
crystallization at high temperature (promoted by high fluidity) and extended stability in the
glassy state (promoted by low fluidity approaching Tg). These two opposite properties can only
be achieved because the system undergoes a sharp L-L (and F-S) transition during cooling. In
addition, this transition is associated with a metal-to-semiconductor (M-SC) transition which is
also essential to provide the contrast in electrical properties necessary to encode binary
information in computer memories18, 19.
In this paper, we review the general principles of liquid-liquid and polyamorphic transitions with
a focus on chalcogenide systems. We show that L-L transitions are associated with anomalies in
multiple physical properties, including the main thermodynamic response functions: heat-
capacity, expansion coefficient and compressibility. Moreover, it is shown that these transitions
coincide with a change in viscous behavior manifested by a F-S transition as well as distinct
changes in structural features. Finally, it is observed that in chalcogenide systems, L-L
transitions are associated with a M-SC transition that has direct implications to the operation of
phase change memory alloys.
2- LIQUID-LIQUID TRANSITIONS
L-L transitions involve a reversible temperature or pressure induced conversion between two
liquids of distinct structures and physical properties but with identical chemical composition.
The most unequivocal example of a first order L-L transition is that of phosphorus 28, 29. For this
element, the liquid-liquid equilibrium line is located above the melting point within the domain
of stability of the liquid30 and the L-L transition is most easily observed by changing pressure28.
The observation of two coexisting phases with distinct structure28 and density29 unambiguously
confirm the first order nature of this L-L transition. However, in many material systems the
equilibrium line may be shifted below the melting point and the L-L transition can only be
observed in the supercooled liquid state. This is the case of high pressure ST2 water which
exhibits a first order L-L transition below the homogeneous nucleation temperature17. The
occurrence of fast crystallization make these L-L transitions experimentally challenging to
observe31. It has recently been suggested that phase change materials may undergo similar L-L
transitions although the first order nature of the transition has not been confirmed26. On the other
hand, L-L transitions of higher order are observed in many other systems such as glass-forming
chalcogenides32. Figure 1 depicts the schematic phase diagrams for two generic systems
exhibiting L-L transitions, one undergoing a first order L-L transition (Figure 1a) and one
undergoing a higher order continuous L-L transition (Figure 1b). The systems comprise two
crystalline polymorphs with distinct densities. The low density polymorph is represented with a
curved Clapeyron slope by analogy to GeSe232, Ge1Sb2Te4
26, tellurium33, and phosphorus30, all
known to exhibit polyamorphic transitions. In Figure 1a, the solid blue line represents the L-L
coexistence line, where the transition is first order. The L-L coexistence line ends with a critical
point and is followed by the Widom line depicted as the blue dotted line. This behavior is
representative of Si, ST2 water, and likely some PCMs25, 26. For the case of higher order L-L
transitions depicted in Figure 1b, the transition between the low-density and high-density phases
is continuous and the boundary between the two phases is represented as a broader region with a
finite width rather than a coexistence line. Higher order L-L transitions are most commonly
observed in chalcogenide systems as shown in Figure 2. The L-L transitions are revealed by
simultaneous anomalies in multiple thermodynamic response functions upon change in
temperature. The relatively broad width of the peaks in α, Cp and Ks shown in Figure 2 does not
meet the Ehrenfest criterion for a first-order transition. Such thermodynamic responses could be
associated with the systems crossing a Widom line with a critical point nearby, thereby implying
the possible existence of a first order transition at higher or lower (even negative) pressure.
However, there is currently no experimental evidence for such transitions in chalcogenide
systems and the L-L transitions line may be entirely of higher order. In this case there is no
critical point, as found for example in SiO234. Transitions across the L-L boundary between the
low-density liquid (LDL) and the high-density liquid (HDL) may be induced by a change in
pressure as shown for GeSe232, or by a change in temperature as shown in Figure 2. It is
important to note that crossing the L-L line through an isobaric temperature increase involves
transitioning from the LDL to the HDL (Figure 1) and must therefore result in negative thermal
expansion. This process is indeed observed systematically in systems exhibiting L-L transitions
as illustrated in Figure 2a and as will be discussed in the next sections. For temperatures and
pressures far below the melting line, the supercooled liquid easily vitrifies and the L-L transition
becomes a solid-solid polyamorphic transition between two distinct glassy phases represented by
the dashed lines in Figure 1a & 1b. Polyamorphic transitions between the low-density amorphous
(LDA) and high-density amorphous (HDA) phases are most commonly observed by changing
pressure as in the case of Si21, GeO222 or Ge1Sb2Te4
23.
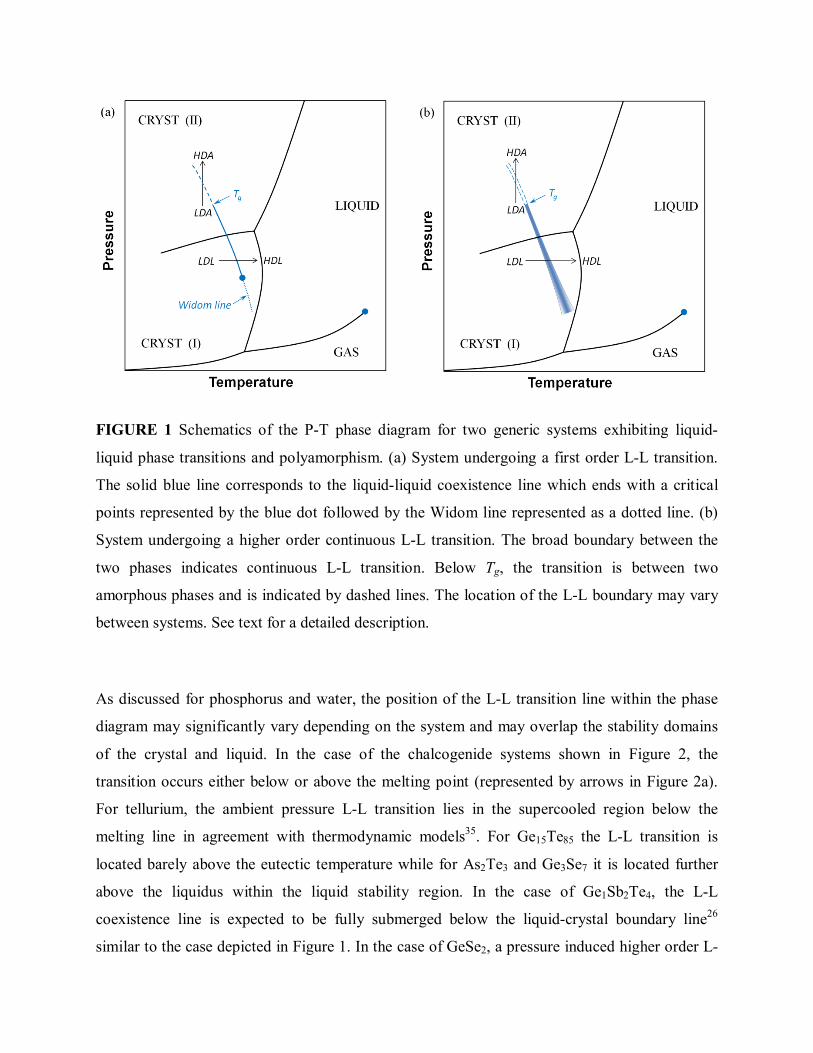
FIGURE 1 Schematics of the P-T phase diagram for two generic systems exhibiting liquid-
liquid phase transitions and polyamorphism. (a) System undergoing a first order L-L transition.
The solid blue line corresponds to the liquid-liquid coexistence line which ends with a critical
points represented by the blue dot followed by the Widom line represented as a dotted line. (b)
System undergoing a higher order continuous L-L transition. The broad boundary between the
two phases indicates continuous L-L transition. Below Tg, the transition is between two
amorphous phases and is indicated by dashed lines. The location of the L-L boundary may vary
between systems. See text for a detailed description.
As discussed for phosphorus and water, the position of the L-L transition line within the phase
diagram may significantly vary depending on the system and may overlap the stability domains
of the crystal and liquid. In the case of the chalcogenide systems shown in Figure 2, the
transition occurs either below or above the melting point (represented by arrows in Figure 2a).
For tellurium, the ambient pressure L-L transition lies in the supercooled region below the
melting line in agreement with thermodynamic models35. For Ge15Te85 the L-L transition is
located barely above the eutectic temperature while for As2Te3 and Ge3Se7 it is located further
above the liquidus within the liquid stability region. In the case of Ge1Sb2Te4, the L-L
coexistence line is expected to be fully submerged below the liquid-crystal boundary line26
similar to the case depicted in Figure 1. In the case of GeSe2, a pressure induced higher order L-

L transition is observed in the equilibrium liquid region during isothermal experiments but was
speculated to become first order in the supercooled regime32. Overall, anomalies in
thermodynamic response functions have been experimentally revealed in many systems and
suggested to be associated with L-L transitions line, but the availability of partial data often do
not permit to determine their full extent and position in P-T space.

FIGURE 2 Maxima in thermodynamic response functions indicative of liquid-liquid phase
transitions in chalcogenide systems. Arrows represent the melting point or liquidus temperature
for each system. (a) Thermal expansion coefficient α for Ge15Te8536, Te36, As2Te3
37 and Ge3Se738.
α values for Ge3Se7 were obtained by fitting density data with a fifth order polynomial; (b) Heat
capacity at constant pressure Cp for Ge15Te8539, Te39 and As2Te3
40; (c) Adiabatic compressibility

Ks for Ge15Te8536, Te36, As2Te3
41 and Ge3Se742. Ks values for As2Te3 and Ge3Se7 were obtained
from density ρ and sound velocity VS according to Ks = 1/ρVS2.
3- FRAGILE-TO-STRONG TRANSITIONS
Sudden changes in thermodynamic response functions like the heat-capacity peaks observed in
Figure 2b are expected to affect other properties such as the configurational entropy and in turn
the viscosity (per the Adam-Gibbs equation43). Indeed, Figure 3 shows that many chalcogenide
systems exhibit abnormal viscous behavior with an anomaly in viscosity-temperature
dependence indicating a transition from a fragile to a strong behavior. While most chalcogenide
melts have viscosities of similar magnitude at high temperature, they appear to surge suddenly at
lower temperature in a way that cannot be fitted with traditional viscosity models such as VFT2
or MYEGA44. It is also found that the temperature of these anomalies in viscosity match that of
other physical properties. For example Ge15Te85 shows a pronounced change in viscosity at the
same temperature as the peak in heat-capacity shown in Figure 2b7. In fact, viscosity estimates
from these heat capacity data using the Adam-Gibbs equation15 match closely with the viscosity
data shown in Figure 3. These estimates also reveal the full S-shaped fragile-to-strong transition
in this system15. Similarly, tellurium shows the onset of an anomaly in viscosity at the same
temperature as the thermodynamic anomalies of Figure 2. Unfortunately, tellurium is a poor
glass-former and viscosity data cannot be obtained further into the supercooled region to capture
the full viscosity divergence. Likewise, the phase change material AIST (AgInSbTe) crystallizes
rapidly before the anomaly in viscosity can be measured. However, recent structural
measurements by ultrafast x-ray probe have permitted to access the supercooled regime and have
provided direct structural evidence for a L-L transition in this system25. Conversely, better glass-
formers such as GeSe3 or As5Se5 allow viscosity measurements across the whole temperature
range and permit to reveal the entire F-S transition. The abnormal viscous behavior is displayed
by an intersection across the viscosity curve of selenium. Like GeO2 or toluene, selenium
exhibits a “normal” viscosity behavior that can be fitted with a single fragility parameter.
Instead, GeSe3 and As5Se5 initially exhibit a strong behavior and cross over the selenium curve
before transitioning to a more fragile trend thereby avoiding an extrapolation towards unphysical
values of viscosity.
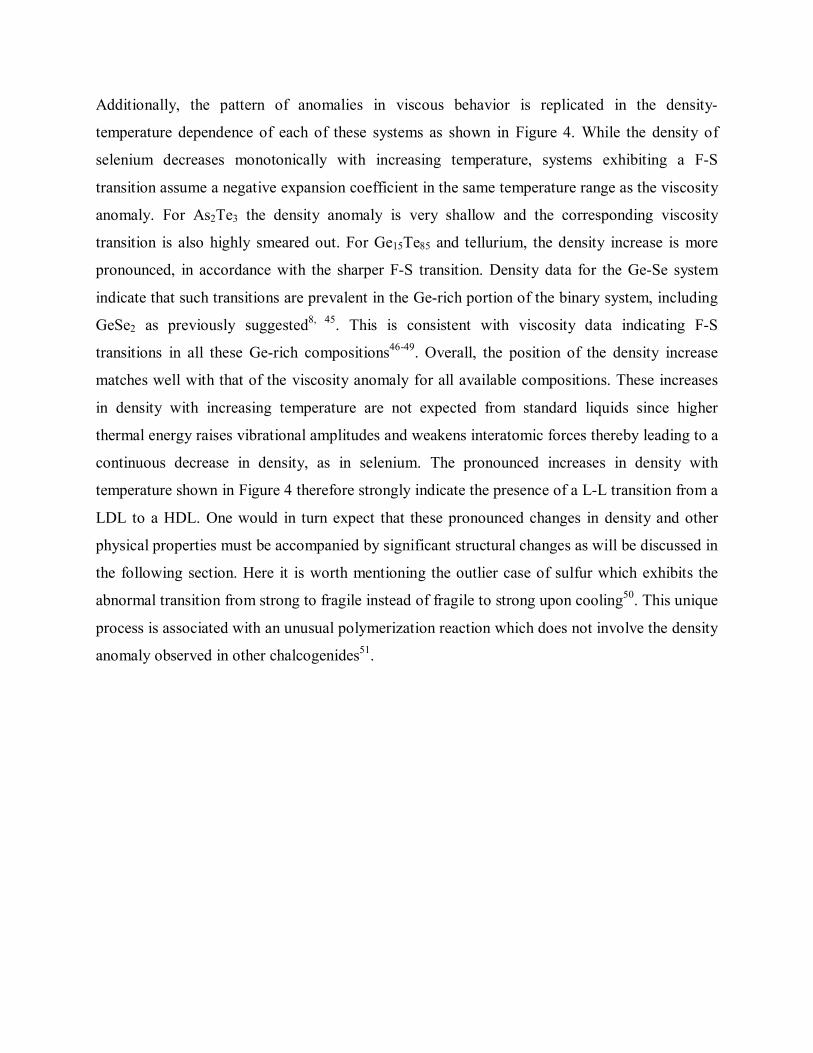
Additionally, the pattern of anomalies in viscous behavior is replicated in the density-
temperature dependence of each of these systems as shown in Figure 4. While the density of
selenium decreases monotonically with increasing temperature, systems exhibiting a F-S
transition assume a negative expansion coefficient in the same temperature range as the viscosity
anomaly. For As2Te3 the density anomaly is very shallow and the corresponding viscosity
transition is also highly smeared out. For Ge15Te85 and tellurium, the density increase is more
pronounced, in accordance with the sharper F-S transition. Density data for the Ge-Se system
indicate that such transitions are prevalent in the Ge-rich portion of the binary system, including
GeSe2 as previously suggested8, 45. This is consistent with viscosity data indicating F-S
transitions in all these Ge-rich compositions46-49. Overall, the position of the density increase
matches well with that of the viscosity anomaly for all available compositions. These increases
in density with increasing temperature are not expected from standard liquids since higher
thermal energy raises vibrational amplitudes and weakens interatomic forces thereby leading to a
continuous decrease in density, as in selenium. The pronounced increases in density with
temperature shown in Figure 4 therefore strongly indicate the presence of a L-L transition from a
LDL to a HDL. One would in turn expect that these pronounced changes in density and other
physical properties must be accompanied by significant structural changes as will be discussed in
the following section. Here it is worth mentioning the outlier case of sulfur which exhibits the
abnormal transition from strong to fragile instead of fragile to strong upon cooling50. This unique
process is associated with an unusual polymerization reaction which does not involve the density
anomaly observed in other chalcogenides51.
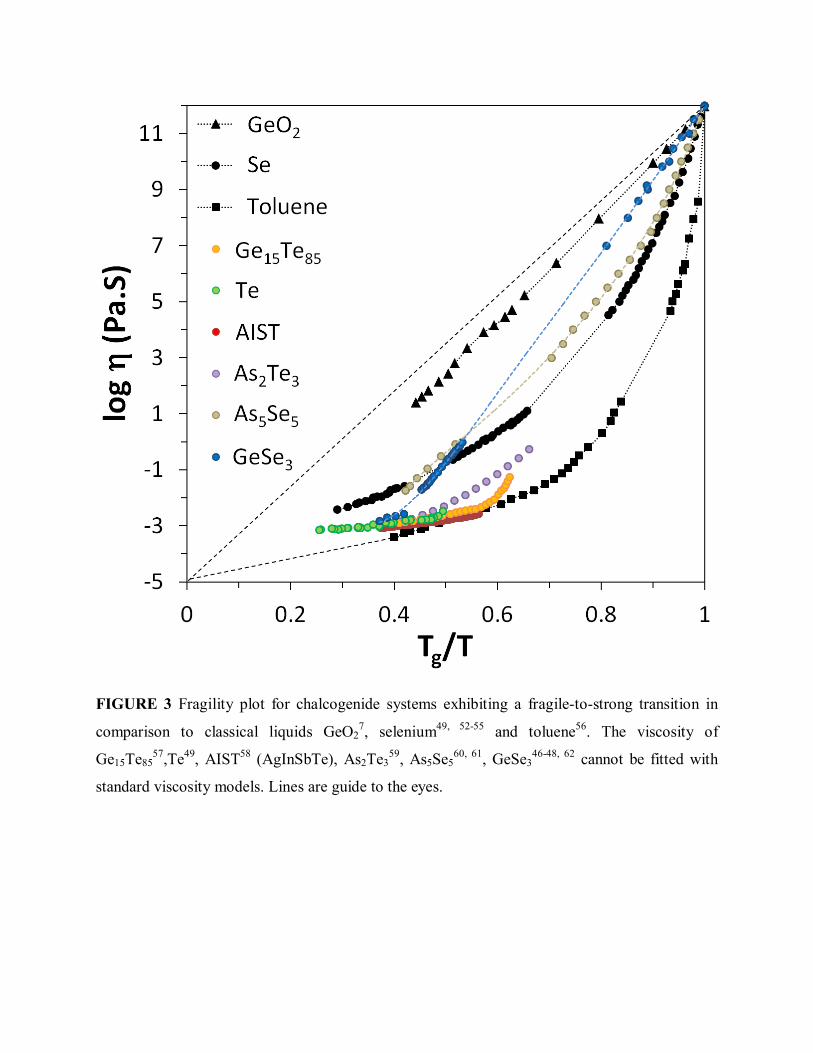
FIGURE 3 Fragility plot for chalcogenide systems exhibiting a fragile-to-strong transition in
comparison to classical liquids GeO27, selenium49, 52-55 and toluene56. The viscosity of
Ge15Te8557,Te49, AIST58 (AgInSbTe), As2Te3
59, As5Se560, 61, GeSe3
46-48, 62 cannot be fitted with
standard viscosity models. Lines are guide to the eyes.

FIGURE 4 Negative expansion coefficients in chalcogenide systems exhibiting a fragile-to-
strong transition. The density is normalized by its value at Tg for Ge15Te8536, Te36, As2Te3
37,
As5Se563 and Ge-Se38 melts.
4- STRUCTURAL TRANSITIONS
The structural origin of L-L transitions has been investigated in several systems including
metallic6, 9, 64 and chalcogenide32, 65 melts. In the case of GeSe2, the structural origin of the L-L
transition can be inferred from the high-pressure x-ray measurements shown in Figure 5. It was
found that the low-density liquid has a two-dimensional connectivity consisting of edge- and
corner-sharing tetrahedra while the high-density liquid has a three-dimensional connectivity
likely consisting mostly of corner-sharing tetrahedra32. A similar pressure-induced conversion
from edge- to corner-sharing tetrahedra is also observed in the glass at ambient temperature66.
This is consistent with the relative density of the two crystalline polymorphs where the corner-
sharing 3D crystal is 9.6% denser than the corner- and edge-sharing 2D crystal67. Increasing the
pressure of the GeSe2 melt at 1120K induces a transition between the two liquids (Figure 5). This
transition can be depicted as a vertical arrow across the liquid-liquid line in Figure 1.
Conversely, the density plot shown in Figure 4 indicates an L-L transition with a sudden density
increase near 1250K upon temperature change at ambient pressure. This transition can be
depicted as a horizontal arrow across the liquid-liquid line in Figure 1. Initially, an increase in
temperature results in a decrease in density associated with a conversion from corner to edge-
sharing tetrahdra as previously shown by Raman spectroscopy68. But crossing the L-L line along
an isobar implies a transition from the low-density (partially edge-sharing69) liquid to the high-
density (corner-sharing) liquid upon increasing temperature. This structural process would
effectively results in the negative expansion coefficient associated with the L-L transition shown
in Figure 4. Neutron diffraction measurements in this temperature range indicate a change in
medium range order of Ge-centered structural motifs that is consistent with the onset of that
process70. At higher temperature or pressure chemical disorder prevails and the structure is better
described as a random packing of hard spheres.

FIGURE 5 Change in short range order measured by x-ray diffraction during compression of
GeSe2 melt32. The melt structure evolves from a low-density 2D edge-sharing tetrahedral
structure to a high-density 3D corner-sharing tetrahedral structure upon pressure increase from
0.5 GPa to 4.1 GPa at 1120 K. Adapted from Ref 32.
The structural origin of the L-L transition in Ge15Te85 melts has been investigated by x-ray
diffraction65, neutron diffraction71 and EXAFS72. The local order around the Ge atom is found to
change from a distorted octahedron to a more regular octahedron upon temperature increase
(Figure 6). This transition is associated with a Peierls-like transition which shortens some Ge-Te
bonds and increases the local coordination. This effectively leads to a decrease in volume despite
the temperature increase. The ratio of the next-nearest to the nearest neighbor distances is found
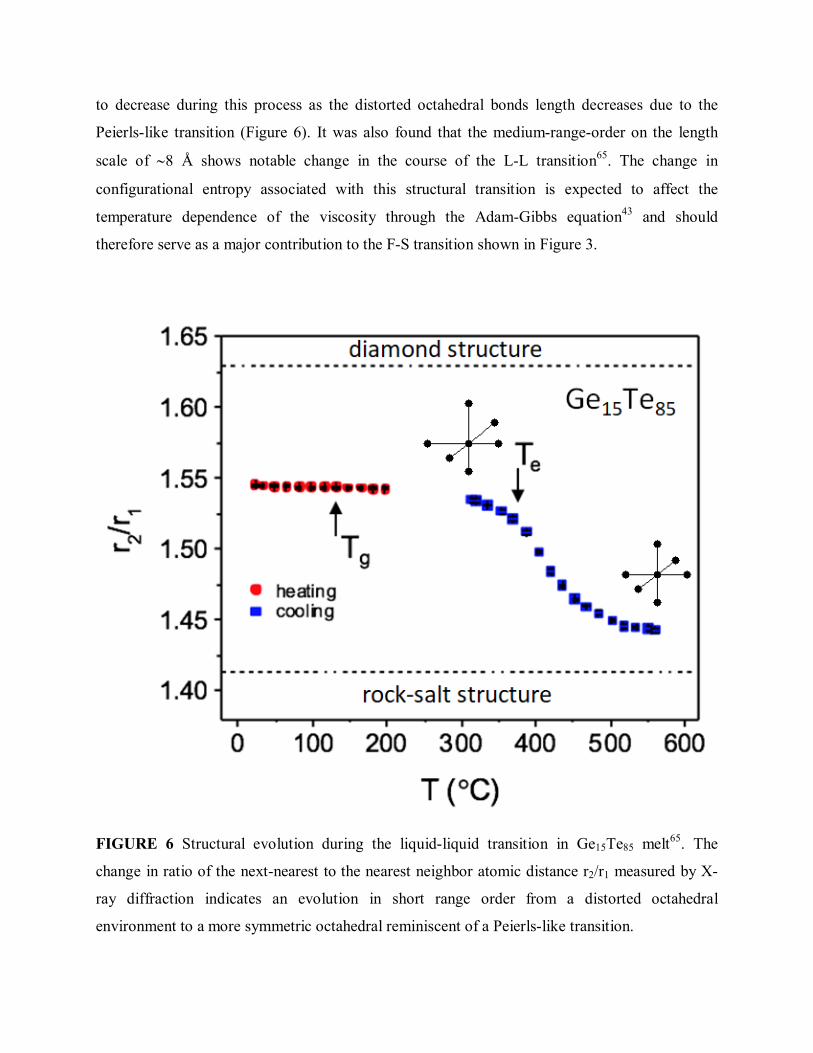
to decrease during this process as the distorted octahedral bonds length decreases due to the
Peierls-like transition (Figure 6). It was also found that the medium-range-order on the length
scale of ∼8 Å shows notable change in the course of the L-L transition65. The change in
configurational entropy associated with this structural transition is expected to affect the
temperature dependence of the viscosity through the Adam-Gibbs equation43 and should
therefore serve as a major contribution to the F-S transition shown in Figure 3.
FIGURE 6 Structural evolution during the liquid-liquid transition in Ge15Te85 melt65. The
change in ratio of the next-nearest to the nearest neighbor atomic distance r2/r1 measured by X-
ray diffraction indicates an evolution in short range order from a distorted octahedral
environment to a more symmetric octahedral reminiscent of a Peierls-like transition.

5- METAL-TO-SEMICONDUCTOR TRANSITIONS
Chalcogenide glasses have been extensively studied for their semiconducting properties and their
potential for applications in microelectronics73-75. These materials retain their semiconducting
properties as they enter the supercooled liquid above the glass transition since the short range
order of the glass and the melt are similar76. However, upon further temperature increase, the
conductivity rises rapidly until it reaches a metallic-like value76, 77. This sudden change in
electrical properties has long been presumed to originate from significant structural changes in
the melt76, 77. A link to a L-L transition then appears highly probable.
Figure 7a shows the transition from semiconductor to metallic conductivity in Ge15Te85 and
Se30Te70 melts. This behavior is representative of a large number of chalogenide melts as
demonstrated long ago by Alekseev et al.78 and recently discussed in relation to the M-SC
transition in PCMs by the present authors18. The activation energy for conductivity Ea is plotted
in Figure 7b and exhibits a clear maximum for both melts. But more interestingly, the position of
the maximum in Ea match that of the maximum in thermal expansion coefficient α that has been
recognized as a signature feature of L-L transitions. The result of Figure 7 therefore strongly
suggests that M-SC transitions are another manifestation of L-L transitions in chalcogenide
melts, along with the anomalies in density, viscosity and heat capacity. Ultimately, the changes
in all these physical properties originate from the same underlying structural transition in the
melt.
6- IMPLICATIONS TO MEMORY TECHNOLOGY
One of the most groundbreaking applications of chalcogenide materials involves the rapid
encoding of binary information in the form of amorphous and crystalline bits79, 80. In these
devices, the contrast in electrical conductivity between the two phases is exploited to produce
non-volatile memory cells on the nanometer scale. These may enable new computing
architecture where dynamic and permanent memories are combined, or neuro-inspired
computing where calculations are performed in the memory array81. Such applications require
reversibly switching between the amorphous and crystalline phases at high speed (<10 ns)
through application of an electrical pulse. The switching speed is controlled by the crystallization
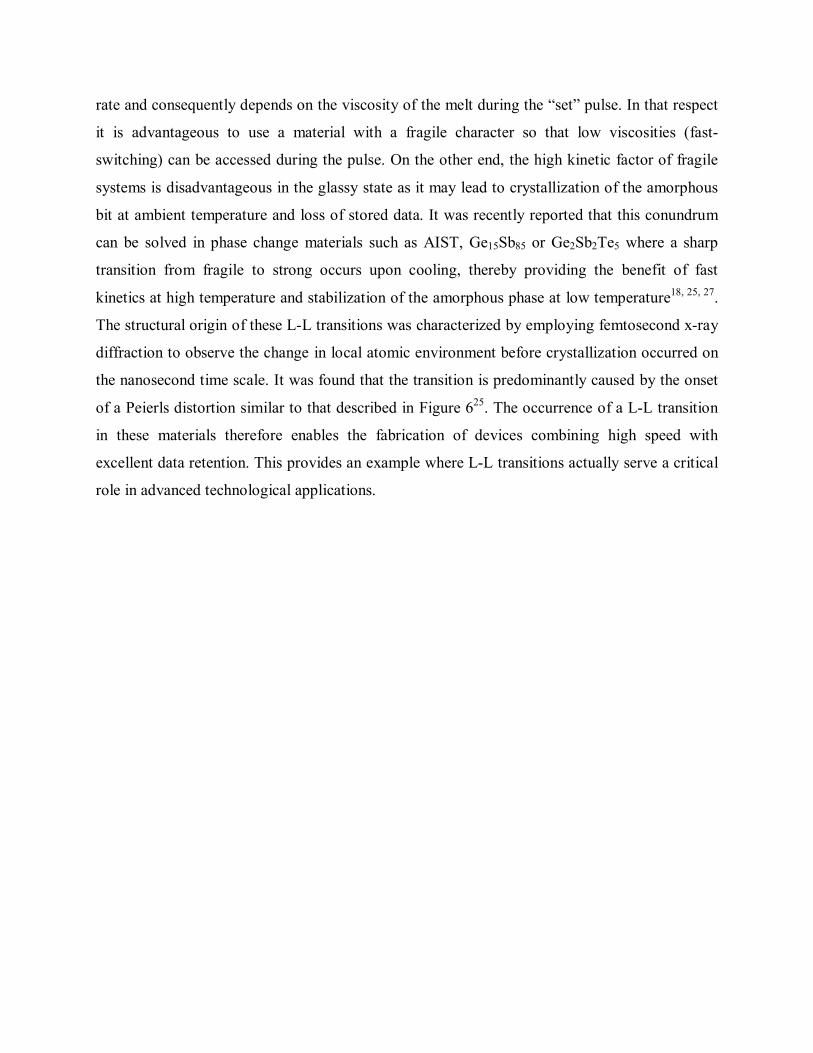
rate and consequently depends on the viscosity of the melt during the “set” pulse. In that respect
it is advantageous to use a material with a fragile character so that low viscosities (fast-
switching) can be accessed during the pulse. On the other end, the high kinetic factor of fragile
systems is disadvantageous in the glassy state as it may lead to crystallization of the amorphous
bit at ambient temperature and loss of stored data. It was recently reported that this conundrum
can be solved in phase change materials such as AIST, Ge15Sb85 or Ge2Sb2Te5 where a sharp
transition from fragile to strong occurs upon cooling, thereby providing the benefit of fast
kinetics at high temperature and stabilization of the amorphous phase at low temperature18, 25, 27.
The structural origin of these L-L transitions was characterized by employing femtosecond x-ray
diffraction to observe the change in local atomic environment before crystallization occurred on
the nanosecond time scale. It was found that the transition is predominantly caused by the onset
of a Peierls distortion similar to that described in Figure 625. The occurrence of a L-L transition
in these materials therefore enables the fabrication of devices combining high speed with
excellent data retention. This provides an example where L-L transitions actually serve a critical
role in advanced technological applications.
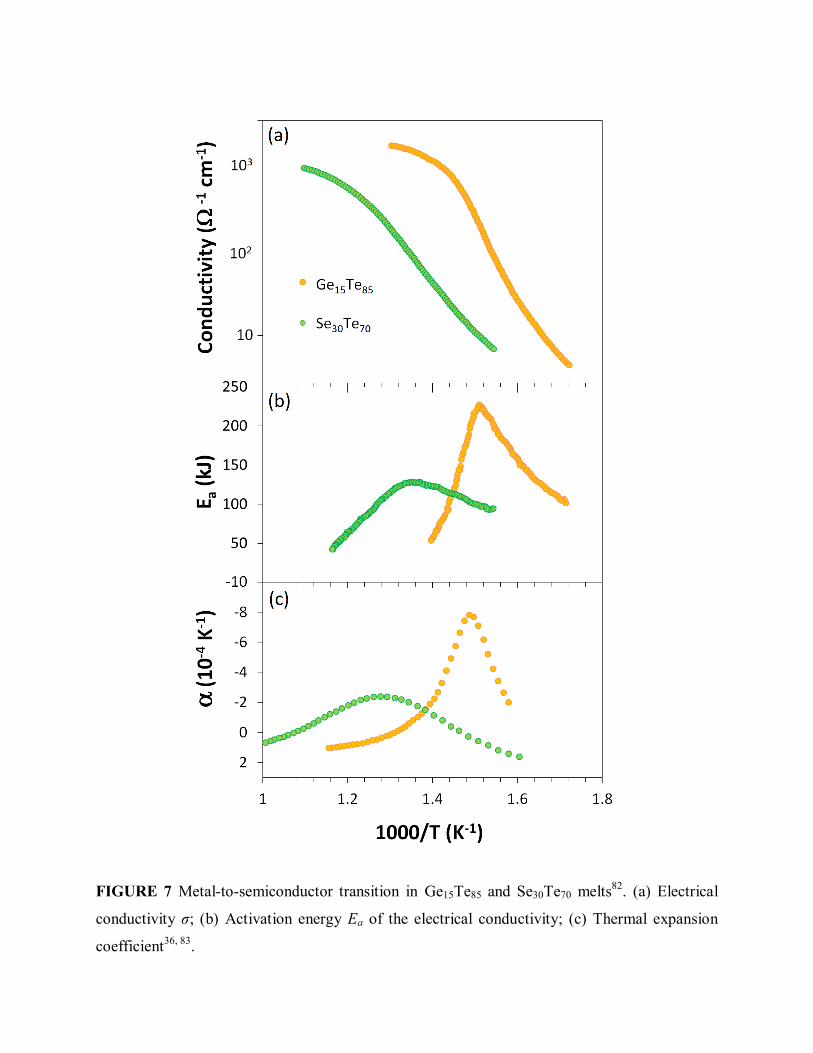
FIGURE 7 Metal-to-semiconductor transition in Ge15Te85 and Se30Te70 melts82. (a) Electrical
conductivity σ; (b) Activation energy Ea of the electrical conductivity; (c) Thermal expansion
coefficient36, 83.
7- CONCLUSION
The presence of L-L transitions in chalcogenide glass-forming systems is found to be more
common than previously thought. While these transitions are of higher order when measured at
conventionally accessible conditions of pressure and temperature they may become first order in
the deeply supercooled regime and at higher pressure as in ST2 water. The L-L transitions are
associated with significant changes in structure and negative expansion coefficients due to the
transition between LDL and HDL during isobaric temperature changes. Chalcogenide liquids
which are traditionally semiconducting near Tg are also found to undergo a M-SC transition
concomitant with the L-L transition. The change in electrical property is an important factor for
application in memory technology where binary information is encoded using the contrast in
conductivity between the amorphous and crystalline phases of telluride phase change materials.
More importantly, the F-S transition observed during L-L transitions is key to enable the fast
kinetics and data retention of phase change memory devices. Novel characterization techniques
such as ultrafast spectroscopy may be used to uncover L-L transitions in an increasing number of
chalcogenide alloys in the future.
Acknowledgement
PL acknowledge financial support from NSF-DMR under grant#: 1832817. S.W. acknowledges
the financial support from Deutsche Forschungsgemeinschaft (DFG) Grant No. 422219280.
REFERENCES
1. Angell CA. Relaxation in liquids, polymers and plastic crystals - strong/fragile patterns and problems. J Non-Cryst Solids. 1991; 131-133:13-31. 2. Debenedetti PG, Stillinger FH. Supercooled liquids and the glass transition. Nature (London, U K). 2001; 410:259-267.
3. Angell CA. Formation of glasses from liquids and biopolymers. Science (Washington, D C). 1995; 267:1924-35. 4. Martinez LM, Angell CA. A thermodynamic connection to the fragility of glass-forming liquids. Nature (London, U K). 2001; 410:663-667. 5. Ito K, Moynihan CT, Angell CA. Thermodynamic determination of fragility in liquids and a fragile-to-strong liquid transition in water. Nature. 1999; 398:492-495. 6. Wei S, Yang F, Bednarcik J, Kaban I, Shuleshova O, Meyer A, et al. Liquid-liquid transition in a strong bulk metallic glass-forming liquid. Nat Commun. 2013; 4:3083/1-3083/9. 7. Lucas P. Fragile-to-strong transitions in glass forming liquids. Journal of Non-Crystalline Solids: X. 2019; 4:100034. 8. Stolen S, Grande T, Johnsen H-B. Fragility transition in GeSe2-Se liquids. Phys Chem Chem Phys. 2002; 4:3396-3399. 9. Stolpe M, Jonas I, Wei S, Evenson Z, Hembree W, Yang F, et al. Structural changes during a liquid-liquid transition in the deeply undercooled Zr58.5Cu15.6Ni12.8Al10.3Nb2.8 bulk metallic glass forming melt. Physical Review B. 2016; 93:014201. 10. Hechler S, Ruta B, Stolpe M, Pineda E, Evenson Z, Gross O, et al. Microscopic evidence of the connection between liquid-liquid transition and dynamical crossover in an ultraviscous metallic glass former. Physical Review Materials. 2018; 2:085603. 11. Gallino I, Cangialosi D, Evenson Z, Schmitt L, Hechler S, Stolpe M, et al. Hierarchical aging pathways and reversible fragile-to-strong transition upon annealing of a metallic glass former. Acta Materialia. 2018; 144:400-410. 12. Way C, Wadhwa P, Busch R. The influence of shear rate and temperature on the viscosity and fragility of the Zr41.2Ti13.8Cu12.5Ni10.0Be22.5 metallic-glass-forming liquid. Acta Materialia. 2007; 55:2977-2983. 13. Zhang C, Hu L, Yue Y, Mauro JC. Fragile-to-strong transition in metallic glass-forming liquids. J Chem Phys. 2010; 133:014508/1-014508/7. 14. Liu H, Chen W, Pan R, Shan Z, Qiao A, Drewitt JWE, et al. From Molten Calcium Aluminates through Phase Transitions to Cement Phases. Advanced Science. 2019; n/a:1902209. 15. Wei S, Lucas P, Angell CA. Phase change alloy viscosities down to Tg using Adam-Gibbs-equation fittings to excess entropy data: A fragile-to-strong transition. J Appl Phys 2015; 118:034903/1-034903/9. 16. Sastry S, Austen Angell C. Liquid–liquid phase transition in supercooled silicon. Nature Materials. 2003; 2:739. 17. Palmer JC, Martelli F, Liu Y, Car R, Panagiotopoulos AZ, Debenedetti PG. Metastable liquid–liquid transition in a molecular model of water. Nature. 2014; 510:385-388. 18. Wei S, Coleman GJ, Lucas P, Angell CA. Glass Transitions, Semiconductor-Metal Transitions, and Fragilities in Ge-V-Te (V = As, Sb) Liquid Alloys: The Difference One Element Can Make. Phys Rev Applied. 2017; 7:034035. 19. Wei S, Lucas P, Angell CA. Phase-change materials: The view from the liquid phase and the metallicity parameter. MRS Bulletin. 2019; 44:691-698. 20. Poole PH, Grande T, Angell CA, McMillan PF. Polymorphic Phase Transitions in Liquids and Glasses. Science. 1997; 275:322. 21. McMillan PF, Wilson M, Daisenberger D, Machon D. A density-driven phase transition between semiconducting and metallic polyamorphs of silicon. Nature Materials. 2005; 4:680. 22. Smith KH, Shero E, Chizmeshya A, Wolf GH. The equation of state of polyamorphic germania glass: A two‐domain description of the viscoelastic response. The Journal of Chemical Physics. 1995; 102:6851-6857. 23. Kalkan B, Sen S, Cho JY, Joo YC, Clark SM. Observation of polyamorphism in the phase change alloy Ge1Sb2Te4. Applied Physics Letters. 2012; 101:151906. 24. Tanaka H. General view of a liquid-liquid phase transition. Physical Review E. 2000; 62:6968-6976.

25. Zalden P, Quirin F, Schumacher M, Siegel J, Wei S, Koc A, et al. Femtosecond x-ray diffraction reveals a liquid–liquid phase transition in phase-change materials. Science. 2019; 364:1062. 26. Wei S, Evenson Z, Stolpe M, Lucas P, Angell CA. Breakdown of the Stokes-Einstein relation above the melting temperature in a liquid phase-change material. Science Advances. 2018; 4:8632. 27. Orava J, Hewak DW, Greer AL. Fragile-to-Strong Crossover in Supercooled Liquid Ag-In-Sb-Te Studied by Ultrafast Calorimetry. Adv Funct Mater. 2015; 25:4851-4858. 28. Katayama Y, Mizutani T, Utsumi W, Shimomura O, Yamakata M, Funakoshi K-i. A first-order liquid–liquid phase transition in phosphorus. Nature. 2000; 403:170. 29. Katayama Y, Inamura Y, Mizutani T, Yamakata M, Utsumi W, Shimomura O. Macroscopic Separation of Dense Fluid Phase and Liquid Phase of Phosphorus. Science. 2004; 306:848. 30. Yarger JL, Wolf GH. Polymorphism in Liquids. Science. 2004; 306:820. 31. Angell CA. Insights into Phases of Liquid Water from Study of Its Unusual Glass-Forming Properties. Science. 2008; 319:582. 32. Crichton WA, Mezouar M, Grande T, Stolen S, Grzechnik A. Breakdown of intermediate-range order in liquid GeSe2 at high pressure. Nature (London, U K). 2001; 414:622-625. 33. Yaoita K, Imai M, Tsuji K, Kikegawa T, Shimomura O. Structure of liquid gallium and liquid tellurium under pressure. High Pressure Research. 1991; 7:229-231. 34. Lascaris E, Hemmati M, Buldyrev SV, Stanley HE, Angell CA. Search for a liquid-liquid critical point in models of silica. The Journal of Chemical Physics. 2014; 140:224502. 35. Makov G, Yahel E. Liquid-liquid phase transformations and the shape of the melting curve. The Journal of Chemical Physics. 2011; 134:204507. 36. Tsuchiya Y. Thermodynamics of the structural changes in the liquid Ge–Te system around the Te-rich eutectic composition. Journal of Non-Crystalline Solids. 2002; 312-314:212-216. 37. Tsuchiya Y. The molar volume of molten As–Sb, As–Bi and As–Te systems: further evidence for rapid structural changes in liquid As in the supercooled state. Journal of Non-Crystalline Solids. 1999; 250-252:473-477. 38. Ruska J, Thurn H. Change of short-range order with temperature and composition in liquid germanium selenide (GexSe1-x) as shown by density measurements. J Non-Cryst Solids. 1976; 22:277-90. 39. Tsuchiya Y, Saitoh K, Kakinuma F. Thermodynamics of Structural Changes in Liquid Ge–Te Alloys Around the Eutectic Composition: Specific Heat Measurements and Thermodynamic Stability. Monatshefte für Chemie / Chemical Monthly. 2005; 136:1963-1970. 40. Tver'yanovich YS, Ushakov VM, Tverjanovich A. Heat of structural transformation at the semiconductor-metal transition in As2Te3 liquid. Journal of Non-Crystalline Solids. 1996; 197:235-237. 41. Tsuchiya Y. Sound velocity in the molten As-Te system. Berichte der Bunsengesellschaft fuer Physikalische Chemie. 1998; 102:1123-1127. 42. Tsuchiya Y. Novel liquid-liquid transition in the liquid Se-GeSe system. EPJ Web of Conferences. 2011; 15. 43. Adam G, Gibbs JH. On the Temperature Dependence of Cooperative Relaxation Properties in Glass‐Forming Liquids. The Journal of Chemical Physics. 1965; 43:139-146. 44. Mauro JC, Yue Y, Ellison AJ, Gupta PK, Allan DC. Viscosity of glass-forming liquids. Proc Natl Acad Sci U S A. 2009; 106:19780-19784. 45. Lucas P, Coleman GJ, Venkateswara Rao M, Edwards AN, Devaadithya C, Wei S, et al. Structure of ZnCl2 Melt. Part II: Fragile-to-Strong Transition in a Tetrahedral Liquid. J Phys Chem B. 2017; 121:11210-11218. 46. Nemilov SV. Viscosity of oxygen-free vitrified systems. IV. Viscosity and structure of glasses in the selenium-germanium system. Zh Prikl Khim (S-Peterburg, Russ Fed). 1964; 37:1020-4. 47. Gueguen Y, Rouxel T, Gadaud P, Bernard C, Keryvin V, Sangleboeuf J-C. High-temperature elasticity and viscosity of GexSe1-x glasses in the transition range. Phys Rev B: Condens Matter. 2011; 84:064201/1-064201/10. 48. Laugier A, Chaussemy G, Fornazero J. Viscosity of the glass-forming germanium-selenium liquid solutions. J Non-Cryst Solids. 1977; 23:419-29.

49. Glazov VM, Shchelikov OD. Change in short-range order structure in selenium and tellurium melts during heating. Izv Akad Nauk SSSR, Neorg Mater. 1974; 10:202-7. 50. Yuan B, Aitken B, Sen S. Is the λ-transition in liquid sulfur a fragile-to-strong transition? The Journal of Chemical Physics. 2019; 151:041105. 51. Zheng KM, Greer SC. The density of liquid sulfur near the polymerization temperature. The Journal of Chemical Physics. 1992; 96:2175-2182. 52. Bernatz KM, Echeverrı́a I, Simon SL, Plazek DJ. Characterization of the molecular structure of amorphous selenium using recoverable creep compliance measurements. Journal of Non-Crystalline Solids. 2002; 307-310:790-801. 53. Koštál P, Málek J. Viscosity of selenium melt. Journal of Non-Crystalline Solids. 2010; 356:2803-2806. 54. Cukierman M, Uhlmann DR. Viscous flow behavior of selenium. Journal of Non-Crystalline Solids. 1973; 12:199-206. 55. Keezer RC, Bailey MW. The structure of liquid selenium from viscosity measurements. Materials Research Bulletin. 1967; 2:185-192. 56. Chen Z, Richert R. Dynamics of glass-forming liquids. XV. Dynamical features of molecular liquids that form ultra-stable glasses by vapor deposition. The Journal of Chemical Physics. 2011; 135:124515. 57. Neumann H, Herwig F, Hoyer W. The short range order of liquid eutectic AIII-Te and AIV-Te alloys. Journal of Non-Crystalline Solids. 1996; 205-207:438-442. 58. Orava J, Weber H, Kaban I, Greer AL. Viscosity of liquid Ag-In-Sb-Te: Evidence of a fragile-to-strong crossover. J Chem Phys. 2016; 144:194503/1-194503/6. 59. Tver'yanovich AS, Kasatkina EB. Viscosity of arsenic-tellurium-system melts. Fiz Khim Stekla. 1992; 18:86-93. 60. Nemilov SV, Petrovskii GT. Viscosity of oxygen-free vitrified systems. II. Study of the viscosity of glasses in the selenium-arsenic system. Zh Prikl Khim (S-Peterburg, Russ Fed). 1963; 36:977-81. 61. Kadoun A, Chaussemy G, Fornazero J, Mackowski JM. Kinematic viscosity of AsxSe1−x glass forming liquids. Journal of Non-Crystalline Solids. 1983; 57:101-108. 62. Glazov VM, Situlina OV. Physicochemical analysis of Group IV element-selenium binary liquid systems. Doklady Akad Nauk SSSR. 1969; 187:799-802. 63. Voronova AE, Ananichev VA, Blinov LN. Thermal Expansion of Melts and Glasses in the As–Se System. Glass Physics and Chemistry. 2001; 27:267-273. 64. Busch R, Gallino I. Kinetics, Thermodynamics, and Structure of Bulk Metallic Glass Forming Liquids. JOM. 2017; 69:2178-2186. 65. Wei S, Stolpe M, Gross O, Hembree W, Hechler S, Bednarcik J, et al. Structural evolution on medium-range-order during the fragile-strong transition in Ge15Te85. Acta Mater. 2017; 129:259-267. 66. Antao SM, Benmore CJ, Li B, Wang L, Bychkov E, Parise JB. Network Rigidity in GeSe2 Glass at High Pressure. Physical Review Letters. 2008; 100:115501. 67. Grande T, Ishii M, Akaishi M, Aasland S, Fjellvåg H, Stølen S. Structural Properties of GeSe2 at High Pressures. Journal of Solid State Chemistry. 1999; 145:167-173. 68. Edwards TG, Sen S. Structure and Relaxation in Germanium Selenide Glasses and Supercooled Liquids: A Raman Spectroscopic Study. J Phys Chem B. 2011; 115:4307-4314. 69. Penfold IT, Salmon PS. Structure of covalently bonded glass-forming melts: A full partial-structure-factor analysis of liquid GeSe2. Physical Review Letters. 1991; 67:97-100. 70. Petri I, Salmon PS, Howells WS. Change in the topology of the glass forming liquid GeSe2 with increasing temperature. Journal of Physics: Condensed Matter. 1999; 11:10219-10227. 71. Bergman C, Bichara C, Gaspard JP, Tsuchiya Y. Experimental investigation of the waterlike density anomaly in the liquid Ge0.15Te0.85 eutectic alloy. Physical Review B. 2003; 67:104202. 72. Coulet M-V, Testemale D, Hazemann J-L, Gaspard J-P, Bichara C. Reverse Monte Carlo analysis of the local order in liquid Ge0.15Te0.85 alloys combining neutron scattering and x-ray absorption spectroscopy. Physical Review B. 2005; 72:174209.
73. Borisova ZU. Glassy Semiconductors: Plenum Press; 1981. 74. Street RA, Mott NF. States in the gap in glassy semiconductors. Phys Rev Lett. 1975; 35:1293-6. 75. Ovshinsky SR, Adler D. Local structure, bonding, and electronic properties of covalent amorphous semiconductors. Contemporary Physics. 1978; 19:109-126. 76. Haisty RW, Krebs H. Electric conductivity of melts and their ability to form glasses: II. The Ge-As-Se system. Journal of Non-Crystalline Solids. 1969; 1:427-436. 77. Haisty RW, Krebs H. Electrical conductivity of melts and their ability to form glasses: I. The Ge-Sb-Se system. Journal of Non-Crystalline Solids. 1969; 1:399-426. 78. Alekseev VA, Andreev AA, Sadovskiĭ MV. Semiconductor–metal transition in liquid semiconductors. Soviet Physics Uspekhi. 1980; 23:551-575. 79. Wuttig M, Salinga M. Phase-change materials Fast transformers. Nat Mater. 2012; 11:270-271. 80. Zhang W, Mazzarello R, Wuttig M, Ma E. Designing crystallization in phase-change materials for universal memory and neuro-inspired computing. Nature Reviews Materials. 2019; 4:150-168. 81. Zhang W, Mazzarello R, Ma E. Phase-change materials in electronics and photonics. MRS Bulletin. 2019; 44:686-690. 82. Tsuchiya Y, Saitoh H. Semiconductor-Metal Transition Induced by the Structural Transition in Liquid Ge15Te85. Journal of the Physical Society of Japan. 1993; 62:1272-1278. 83. Tsuchiya Y. Molar Volume and Thermodynamics of the Structural Change of Liquid Se–Te System. Journal of the Physical Society of Japan. 1988; 57:3851-3857.