liquidity and credit risk premia in the pfandbrief … annual meetings/2011...liquidity and credit...
TRANSCRIPT

Liquidity and Credit Risk Premiain the Pfandbrief Market
Jan B. Siewert and Volker Vonhoff∗
This version: January 15, 2011
Abstract
Yield spreads between German covered bonds (Pfandbriefe) and Germangovernment bonds usually have been interpreted as pure liquidity premia. Incontrast, our analysis reveals that liquidity is the most important, but not theexclusive risk factor within the Pfandbrief market. We show that Pfandbrief yieldspreads also depend on the quality of the issuer, the type of collateral, and thequality of the cover pool. In particular, it is surprising that the issuer’s defaultrisk is priced considerably, even though Pfandbriefe are backed by high-qualitymortgages or public-sector loans and a Pfandbrief default has never been occurred.Using recently published cover pool data, we also show that the quality of the coverassets is less relevant in a normal market environment, but important in times offinancial turmoil. Hence, Pfandbrief issuers with a sustainable cover pool profitfrom lower refinancing cost, especially during market crises.
JEL classification: G01, G12, G21
EFM classification: 340, 550, 570, 780
Keywords: Pfandbriefe, Bond Liquidity, Credit Risk, Covered Bonds, Financial Crisis
∗Jan B. Siewert, Volker Vonhoff: University of Mannheim, Business School, D-68131 Mannheim,Germany. Contact: [email protected] and [email protected], Phone:+49-621-181-1521, Fax: +49-621-181-1519.

I Introduction
It is generally accepted that the recent financial crisis has its origin in the granting of
subprime loans and their securitization. As the mortgage pools experienced declines in
credit quality and losses, the market prices of mortgage-backed securities (MBS) and
other asset-backed securities (ABS) plummeted, leading to write-downs and losses all
over the world. Along with a number of moral hazard problems, this caused a general
crisis of confidence on the market for securitized mortgage loans. The confidence crisis
also considerably affected the market prices of covered bonds, even though they have a
different structure and bear different risks.
The increase of yields also spread to the German Pfandbrief market, although
Pfandbriefe are usually seen as close substitutes for high-quality government bonds and
there has never been a Pfandbrief default. Due to their security mechanisms and the
high quality of their collateral, Pfandbriefe have been considered virtually default-free.
Therefore, the yield spread with respect to German government securities has often been
interpreted as a liquidity premium. During the recent financial crisis, however, one has
observed yield differences between segments of the Pfandbrief market or single Pfandbrief
issues whose liquidity is nearly the same. Hence, it is becoming evident that the yield
spread between Pfandbriefe and German government securities cannot be interpreted as
a pure liquidity premium.
The purpose of this study is an in-depth analysis of the yield spreads within the
Pfandbrief market. We investigate the main risk factors perceived by investors and their
relative valuation for the time period from 2000 to 2009. In particular, we examine
whether liquidity, the quality of the issuer, the type of collateral, or the quality of
the underlying cover pool is the main driver of the yield spreads between individual
Pfandbriefe. Moreover, we gain insights into the behavior of Pfandbrief spreads during
different periods – the pre-crisis period and the period of the recent financial crisis.
Our contribution to the literature is threefold. First, in contrast to the assumption of
Koziol and Sauerbier (2007) or Kempf et al. (2010), we show that liquidity is an important,
but not the exclusive factor when explaining Pfandbrief yield spreads. Second, in addition
1

to previous studies such as Birkmeyer and Herbert (2002) and Breger and Stovel (2004),
we analyze individual Pfandbrief spreads over time and explicitly account for the issuers’
default risk. Third, we are the first to study the impact of the cover pool quality by using
the publications according to § 28 Pfandbrief Act.
With its origin in 1769, the German Pfandbrief is one of the oldest asset-backed
securities in the world. The cover pools mainly consist of high-quality public sector loans
or prime mortgage loans. With an average outstanding volume of EUR 916 billion, the
Pfandbrief market is one of the largest fixed income markets in the world.1 In contrast
to MBS and ABS, however, the structure is quite different: (i) the Pfandbrief is a claim
on the issuer and the cover loans remain on the issuer’s balance sheet instead of being
transferred to a special purpose vehicle, (ii) the coupon and redemption payments are
agreed on in advance and the investor does not bear any prepayment risks, (iii) the direct
access to the cover pool is only necessary if the issuer defaults on its liabilities, (iv)
there are very strict legal requirements with regard to the allowed pool assets and their
valuation,2 (v) pool borrowers are liable with all of their assets and not only with the
underlying real estate property (no jingle mail). This strong legal protection certainly is
one of the reasons that a default on a Pfandbrief has never occurred. As the Pfandbrief
has proven to be a successful source of German mortgage and public-sector loan funding
and solves some of the moral hazard problems associated with MBS and other ABS, the
introduction of a similar covered bond legislation is currently also discussed in the United
States.3
Our study is particularly related to the literature on German Pfandbriefe and, in
general, to the literature on liquidity and credit risk premia in fixed income markets.
Despite the ample size of the German Pfandbrief market and its systemic importance
for the German banking system, there are only few academic studies analyzing this
market in detail. Empirical studies of the Pfandbrief market usually investigate the yield
difference between Pfandbriefe and German government bonds (Bunds). Buhler and Hies
1Pfandbrief market statistics (2003–2009), Association of German Pfandbrief Banks (vdp).2In comparison to other covered bond markets, the Pfandbrief is considered to have the most restrictive
legal requirements.3See, e.g., Lucas et al. (2008) and Bernanke (2009).
2

(1998) and Jobst (2006) investigate the spread dynamics, but do not come up with an
economic explanation for the yield differences. Rees (2001) develops a forecasting model
for the 10 year Pfandbrief spread using macroeconomic factors. This model, however,
does not differentiate between the different types of Pfandbriefe. Koziol and Sauerbier
(2007) and Kempf et al. (2010) argue that Pfandbriefe are considered as default-free and
that yield differences between Pfandbriefe and Bunds have to be ascribed to liquidity
differences. With this presumption, they estimate term structures of illiquidity spreads
between Pfandbriefe and Bunds. In contrast to their findings, our results show that
liquidity is an important, but not the exclusive factor driving Pfandbrief yield spreads.
Schafer and Hochstein (1999) and Birkmeyer and Herbert (2002) investigate yield
differences in the market for Jumbo Pfandbriefe and relate them to several explanatory
variables like the outstanding amount and the Pfandbrief rating. Whereas Schafer and
Hochstein (1999) conclude that the Jumbo Pfandbrief market is rather homogenous,
Birkmeyer and Herbert (2002) find higher yields for Pfandbriefe issued by mortgage
banks relative to public banks. They expect an increasing importance of the issuer’s
quality for the relative pricing of Jumbo Pfandbriefe. Breger and Stovel (2004) study the
effect of credit risk and liquidity in the market for traditional and Jumbo Pfandbriefe.
The authors find a significant liquidity premium of 15 bp between traditional and Jumbo
Pfandbriefe whereas differences between AAA and AA rated Pfandbriefe do not have a
significant effect. Sunderhauf (2006) investigates the impact of the issuer’s default risk on
the pricing of Pfandbriefe. By applying and calibrating a structural Merton (1974)-type
model for a Pfandbrief bank, he comes to the conclusion that mortgage Pfandbriefe should
be considered as widely independent from the issuer’s quality. We extend this strand of
literature by conducting an in-depth analysis of individual Pfandbrief spreads. In addition
to the previous studies, we consider the time-variation by investigating different market
environments and explicitly account for the issuers’ default risk. Moreover, we are the
first to study the impact of the cover pool quality by using the publications according to
§ 28 Pfandbrief Act.
In a study of the European covered bond market, Packer et al. (2007) argue that
the pricing of covered bonds is robust to idiosyncratic shocks to issuer credit risk and to
3

the value of cover pools. In contrast to their study, we find that, particularly during times
of financial turmoil, the issuer rating as well as the cover pool quality has a considerable
impact on the yield spreads. In general, we do not aim to contribute to the literature
on yield differences between covered bonds in different regulatory environments. Former
studies like Packer et al. (2007) and Volk and Hillenbrand (2006) have shown that covered
bond yields significantly depend on the nationality of the issuer. As a uniform covered
bond regulation does not exist in Europe, it is nearly impossible to meaningfully compare
and to unambiguously extract the different risk components. Therefore, we focus on the
German Pfandbrief market with a uniform regulatory environment for all issues.
A large number of studies investigate liquidity and credit risk premia in the corporate
bond market. These studies, like Collin-Dufresne et al. (2001), Longstaff et al. (2005),
Chen et al. (2007), De Jong and Driessen (2007), and Dick-Nielsen et al. (2009), mostly
study unsecured bonds that are not backed by collateral. Studies in the corporate bond
market, however, suffer from a considerable heterogeneity of bond characteristics and the
issuers strongly differ in terms of risk even within a rating class. Therefore, the authors
have to rely on strong assumptions to disentangle liquidity and credit risk. In contrast,
due to the high level of standardization and the legal requirements, it is relatively easy
to isolate the different risk components within the Pfandbrief market.
The main results of our study are the following. First, we show that liquidity is
not the exclusive driver of yield spreads between Pfandbriefe and German government
bonds and issuer-specific effects as well as the quality of the cover pool are also relevant.
Second, yield spreads between individual Pfandbriefe are mainly driven by their relative
liquidity and whether they are covered by public-sector or mortgage loans. Whereas
the type of cover assets appears to be less important during the recent financial crisis,
liquidity proves to have the most important effect and accounts for up to 70 bp of the
yield spread. Third, our empirical results reveal that Pfandbrief investors demand an
additional default risk premium between low rated and high rated issuers of 7 bp during
normal market conditions and up to 40 bp during the financial crisis. Fourth, the impact
of the cover pool quality appears to be quite small. During the recent financial crisis,
however, maturity mismatches between Pfandbriefe and their corresponding cover pool
4

assets, the fraction of German cover assets and the granularity of the cover pool show a
significant impact on the yield spreads.
The remainder of this paper is structured as follows. In Section II, we begin by
describing the institutional details of the Pfandbrief market. Section III describes the
methodology of our analysis and presents the data. In Section IV, we provide and discuss
the empirical results. Section V concludes.
II Details of the Pfandbrief Market
This section reviews the most important features and the regulatory background of the
German Pfandbrief market.4 The legal basis for a Pfandbrief issuance is the Pfandbrief
Act of 2005 that replaced the Public Pfandbrief Act (OPG) and the Mortgage Bank
Act (HBG) dating back to 1900. Until 2005, Pfandbrief issuers had to be specialized
banks, but nowadays every wholesale bank is allowed to apply for a Pfandbrief licence.
The Pfandbrief Act, however, sets restrictive formalities such that Pfandbriefe are highly
standardized and investors can easily assess their quality. Beyond the general banking
supervision under the terms of the German Banking Act (KWG), Pfandbrief issuers are
permanently supervised by an independent trustee appointed by the German financial
supervisory authority (BaFin). This strong regulation is set up to ensure timely payment
and remoteness in the case of bankruptcy.
Pfandbriefe are dual recourse bonds with (i) a claim on the issuer and (ii) a priority
claim on an underlying asset pool in case of a default. The cover pool is kept on the
issuer’s balance sheet and only separated in case of the issuer’s default. The cover
pool mainly consists of high-quality public-sector or first-rank residential and commercial
mortgage loans.5 Pfandbriefe backed by loans to public-sector entities are called public
Pfandbriefe and those backed by mortgage loans are referred to as mortgage Pfandbriefe.
It is important to note that every issuer has only one cover pool for each Pfandbrief
4A more detailed description of the German Pfandbrief and the European covered bond markets canbe found, e.g., in Mastroeni (2001), Packer et al. (2007), and Cross (2008). Moreover, Peterson (2008)investigates the main differences between Pfandbriefe and ABS.
5Moreover, Pfandbriefe on ship and airplane loans exist, but only account for a small fraction of thePfandbrief market.
5

segment. Hence, every public Pfandbrief of an issuer is backed by the same issuer-specific
public cover pool and every mortgage Pfandbrief by the same issuer-specific mortgage
cover pool. The Pfandbrief Act sets conservative guidelines for the quality, the size, and
the valuation of the cover assets as well as to its supervision to ensure timely payments
in case of an issuer’s default. Moreover, Pfandbriefe are not subject to prepayment risk,
and matured or defaulted loans in the cover pool have to be replaced by the issuer. The
issuer also has to assure that the present value of the cover pool assets always exceeds the
present value of the outstanding Pfandbriefe by at least 2%. This dynamic feature of the
cover pool further ensures a sustainable high collateral value for the Pfandbrief.
Public Pfandbriefe are issued on loans to the federal government, the federal state
governments, local authorities, and public-sector institutions in the European Economic
Area, Switzerland, the U.S., Canada and Japan. Moreover, loans to German public
agencies or public banks that are guaranteed by these bodies are eligible for the public
cover pool. It is noteworthy that the withdrawn public sector guarantees for Landesbanks
and for debt issued by savings banks in 2005 have led to a shrinking supply of public-
sector collateral and, therefore, public Pfandbriefe.6 Mortgage Pfandbriefe are covered
by first rank mortgage loans fully collateralized by real estate properties in the European
Economic Area, Switzerland, the U.S., Canada and Japan. The underlying properties
may be residential, commercial, or both. The loan-to-value ratio of each underlying loan
must not exceed 60% and is subject to permanent supervision. Compared to covered
bond legislation in other countries or MBS, the maximum loan-to-value ratio required for
Pfandbriefe is most conservative. For the purpose of liquidity management, maturity-
matching between cover assets and outstanding Pfandbriefe, and currency hedging, it is
allowed to further include specified claims against qualified banks as well as derivatives.
Pfandbrief holders have preferential claims on the cover assets in the event of an
issuer’s insolvency. In this case, the cover pools are separated and managed by an
independent trustee (“Sachwalter”) in favor of the Pfandbrief holders. The cover pools
are not included in the insolvency proceedings until the Pfandbrief creditors are fully
redeemed. Alternatively, another Pfandbrief issuer may take over the cover assets and
6See, e.g., ECB (2008), p. 10.
6

serve the Pfandbrief payments in a timely manner. An early repayment of the Pfandbrief
should be avoided. All these arrangements are set to ensure that Pfandbrief holders are
additionally protected against insolvency caused outside the issuer’s cover operations and
that the Pfandbrief payments occur on time.
An important Pfandbrief segment is the market for Jumbo Pfandbriefe. This segment
is defined by minimum standards agreed on by Pfandbrief banks. It was introduced in
1995 in order to increase the liquidity of large Pfandbrief issues. Jumbo Pfandbriefe are
required to be plain-vanilla bearer bonds with fixed coupon payments, a bullet payment
at maturity, and without embedded options. The minimal issue size is EUR 1 billion.
Moreover, Jumbo Pfandbriefe have to be listed at an exchange, and at least five market
makers have to continuously provide a price quote for a trading volume of up to EUR
15 million. In addition, the quoted bid-ask spread is not allowed to exceed a maturity-
dependent boundary. These standards significantly enhance the liquidity in this segment,
and Jumbo Pfandbriefe are very actively traded.7 Smaller and less liquid issues in either
bearer or registered form are commonly referred to as traditional Pfandbriefe.
III Data and Methodology
III.1 Bond Prices and Yield Spreads
Our sample period covers the time span from January 2000 until January 2009. To gain
insight into the behavior of liquidity and credit risk premia during the recent financial
turmoil, we divide our sample period into three sub-sample periods. The first sub-sample
period is referred to as pre-crisis and covers the time span previous to the subprime
crisis. It ranges from January 2000 until June 2007. The second sub-sample period lasts
from July 2007 until 14 September 2008 and is considered the subprime crisis. The third
sub-sample period starts after the collapse of Lehman Brothers on 15 September 2008
and ends in January 2009. We refer to the last period as the post-Lehman period.
We consider all public and mortgage Pfandbriefe outstanding in our sample period
with fixed coupon and without embedded options. Our total sample consists of 6,398
7See, e.g., Winkler (2006).
7

Pfandbriefe issued by 80 different banks. We exclude all Pfandbriefe that do not have at
least one price quote during the sample period or for which the prices exceed reasonable
bounds.8 Since trading close to maturity is particularly thin and small pricing errors
translate into relatively large annualized yield errors, we exclude all Pfandbriefe with less
than six months to maturity. After this data preparation, we remain with 2,592 Pfandbrief
issues and almost 182,000 weekly price observations.
We use weekly mid prices obtained via Bloomberg over the whole observation period.
Approximately 60%–70% of the Pfandbrief market volume is traded over the phone and
most of the remaining part on electronic trading platforms.9 Due to marginal trading on
stock exchanges, Bloomberg is the most reliable source available since prices are provided
by at least five contributors.10 Bloomberg prices are quoted on a three-day settlement
basis, and we compute accrued interest using the respective day count fraction. We select
Wednesdays as valuation days as very few holidays happen to coincide with Wednesdays.
We use the price of the same week’s Tuesday or Thursday if a Wednesday price is not
available. In this case, we adjust the calculation of accrued interest.
Table 1 presents the summary information of the data set. Panel A shows that
traditional Pfandbriefe account for the major part of the number of issues in the German
Pfandbrief market. However, we have access to price data of only 35% of these issues in
contrast to 90% of the Jumbo issues. Moreover, Jumbo and traditional Pfandbrief issues
differ considerably in terms of their outstanding amount which is approximately 10 times
higher for Jumbos, and the Jumbos in our sample appear to have a slightly longer time to
maturity on average. Due to the higher liquidity in the Jumbo segment, it is not surprising
that the number of weekly bond price observations for Jumbos exceeds the number for
traditional Pfandbriefe. This discrepancy is even more pronounced during the financial
crisis. Moreover, it is important to note that nearly all Jumbo and approximately 90% of
all traditional Pfandbrief price observations used in our study are on Wednesdays.
Panel B of Table 1 shows the distribution of the Pfandbrief issues with respect to
8We exclude price quotes below 1% and above 500% that are apparently due to data errors.9See, e.g., Winkler (2006), p. 25.
10The prices are indicative and do not represent actual transactions. However, we cross-check ourresults with data provided by Morgan Stanley and did not find meaningful differences.
8

the issuer rating classes. Pfandbrief issues are grouped into the classes according to their
issuers’ long-term credit rating. We calculate this rating as the average rating from the
three major rating agencies Fitch, Moody’s and Standard & Poor’s. Pfandbrief issuers
are mainly rated AA and A and the rating classes are similarly distributed in each of the
Pfandbrief segments. As no issuer is rated AAA during the financial crisis periods and
the number of issuers rated BB is rather small, we consider only the three different rating
segments AAA/AA, A, and BBB/BB for our empirical study.
We compute individual yield spreads for every Pfandbrief on a weekly basis relative
to (i) German government bonds (Bunds) and (ii) public Jumbo Pfandbriefe. We
choose Bunds as the natural risk-free benchmark and public Jumbo Pfandbriefe as
they are considered the safest and most liquid instruments in the Pfandbrief market.
This approach facilitates identifying risk premia within the Pfandbrief market that are
not driven by factors that affect the Pfandbrief market as a whole. For yield spreads
relative to Bunds, we use Nelson and Siegel (1987) term structure estimates provided
by the Deutsche Bundesbank. For public-sector Jumbo Pfandbriefe, we estimate the
Nelson-Siegel parameters on a weekly basis by minimizing the squared differences between
estimated and observed yields.11 The mean absolute yield error of the estimation is 3.67
bp on average.
To avoid distortions due to maturity, coupon, or taxation effects as in the case
of simply comparing yields-to-maturity of duration-matched bonds, we define the yield
spread of an individual Pfandbrief as follows: First, we calculate a theoretical bond price
as the bond’s cash flows discounted with the benchmark yield curve. Second, given
the theoretical and the actual bond price, we compute the theoretical and the observed
yield-to-maturity. The yield spread is the difference between the actually observed and
the theoretical yield.
11This approach is consistent with the methodology of Deutsche Bundesbank. See, e.g., Schich (1997),p. 18.
9

III.2 Explanatory Variables
We relate the obtained yield spreads to the following explanatory variables that capture
the different risk factors within the Pfandbrief market. These factors should, at least
partially, account for the yield differences between particular issues.
It is an advantage of the Pfandbrief market that different risk components are
relatively easy to identify by just comparing the different market segments. First, we
compare the yield spread between mortgage and public Jumbo Pfandbriefe by introducing
a mortgage Jumbo dummy variable. Usually, at least before the advent of the Greek
sovereign debt crisis, Pfandbriefe backed by mortgages are considered to be more risky
than Pfandbriefe backed by high-quality public-sector debt. Therefore, we expect
mortgage Jumbo Pfandbriefe to trade at a credit risk yield premium compared to public
Jumbo Pfandbriefe. Second, we introduce a dummy for a public traditional Pfandbrief.
By definition, Jumbo Pfandbriefe are more liquid in terms of outstanding volume, a
maximal bid-ask spread, and the vested market-making, among others. Hence, public
traditional Pfandbriefe should trade at a liquidity yield premium compared to public
Jumbo Pfandbriefe. Third, a dummy for traditional mortgage Pfandbriefe measures the
joint effect of liquidity and credit risk. For the sovereign bond market, Favero et al. (2010)
find yield differences increasing in both liquidity and credit risk with an interaction term
of the opposite sign. Moreover, Buhler and Trapp (2010) find a negative correlation
between liquidity and credit risk for high quality AAA rated corporate bonds.12 As the
Pfandbrief market is comparable to the European sovereign bond market and to high
quality corporate bonds in terms of liquidity and credit risk, it is reasonable to expect a
similar result, i.e. a yield premium that is positive, but smaller than the sum of the pure
liquidity and the pure credit risk premium.
It is straightforward to classify the different Pfandbrief issues with respect to their
Pfandbrief rating. The Pfandbrief rating mainly measures the quality of the underlying
cover pool. For a high Pfandbrief rating, it has to be highly plausible that the Pfandbrief
payments can be made by the underlying cover pool even if the issuer defaults. At the
outset, Pfandbrief ratings were independent from the general financial strength of the
12For lower rated bonds, however, they find a positive correlation.
10

issuer, but nowadays rating agencies also consider the issuer rating to compute a limit
for the highest possible Pfandbrief rating.13 As Pfandbriefe are backed by the cover pool,
however, their rating exceeds or is at least equal to the issuer’s long term credit rating.
We use data on the issuance rating published by Bloomberg. This data, however,
should be used with care as the fraction of several rating classes changes significantly
over time. At the beginning of our sample period, 80% of all price observations are from
Pfandbriefe that are not rated. This number declines to approximately 45% until the
end of 2004, presumably driven by rating requirements from investors. Starting with
the advent of the subprime crisis, this fraction steadily declines below 1%. This sharp
decline provides evidence that Pfandbriefe without rating are scarcely traded during
the recent financial turmoil. Moreover, conversation with Pfandbrief issuers suggest
that in recent years it has become hardly possible to place a Pfandbrief without rating
due to the investors’ requirements. Vice versa, the fraction of AAA-rated Pfandbrief
observations increase from 20% to 88% during our sample period and the fraction of
AA-rated Pfandbrief observations from 0% to 11%.
Even though Pfandbriefe are backed by high-quality cover pools that may serve the
Pfandbrief payments after an issuer’s default, the issuer rating may also have an impact
on their relative pricing. For our study, we use the long-term issuer credit rating from
the three major rating agencies Fitch, Moody’s and Standard & Poor’s and calculate an
average rating. The issuer rating serves as a measure for the issuer’s default risk, and
its impact on the yield spread can be interpreted either as credit risk premium or as
liquidity premium, or both. The credit risk view considers that the cover pool may not
be sufficient to serve the Pfandbrief payments after the issuer’s default. Then, a direct
loss on the Pfandbrief may occur. The liquidity view deems the cover pool to be valuable
enough to serve the payments but anticipates a collapse in trading the defaulted issuer’s
Pfandbriefe. Since both risks are serious for investors and should affect the yield spread
in the same direction, it is difficult to isolate the particular premia. In general, however,
13Standard & Poor’s were the last to consider the issuer’s rating when they changed their ratingmethodology at the end of 2009.
11

a better long-term issuer credit rating should lead to a lower yield spread.14
Pfandbrief issuers also differ by the type of institution. Pfandbriefe issued by
Landesbanks until 18 July 2005 are guaranteed by the German federal states through
a so-called guarantor liability (“Gewahrtragerhaftung”) mechanism.15 Due to this
guarantee, we expect Landesbanks’ Pfandbriefe that are issued until 18 July 2005
trading at a yield discount relative to comparable Pfandbriefe of other issuers. After
its discontinuation, the yield spreads should rise considerably. Moreover, we investigate
whether Landesbank Pfandbriefe trade at significant discounts or premia during the recent
financial turmoil.
Typical proxies for the liquidity of a fixed income security are trading activity, the
bid-ask spread, the proportion of zero-return days, the outstanding amount, and the age.
For this study, only the last two proxies are available. A higher outstanding amount signals
a higher liquidity and, therefore, should lead to a lower yield spread. Moreover, trading
directly after the issuance date is usually more active and diminishes as the security
ages. Therefore, the liquidity premium and, thus, the yield spread should be positively
related to the Pfandbrief’s age. To account for differences in the maturity spectrum of
the Pfandbriefe, we standardize the liquidity measure and use the relative age, i.e. the
age divided by the initial time to maturity.
For our study we also consider fixed effects for the single Pfandbrief issuers. Thereby,
we take idiosyncratic effects like the financial disorder of Allgemeine Hypothekenbank
Rheinboden (AHBR) in 2001–2005 and the tremendous problems of DEPFA and Hypo
Real Estate during the recent financial turmoil into account. We will address these
particular effects when presenting our empirical results.
III.3 Cover Pool Information According to § 28 Pfandbrief Act
For an in-depth yield spread analysis, we further obtain information on the particular cover
pools. Since the Pfandbrief Act came into effect on 19 July 2005, issuers are required
14Instead of only using the rating categories, the use of the Pfandbrief issuers’ CDS spreads would bea meaningful alternative. Unfortunately, CDS spreads are not available for most of the issuers.
15Due to a Grandfather clause, Pfandbriefe issued after 19 July 2001 are guaranteed if they do notmature after 31 December 2015.
12

to publish details of their cover pool composition to enhance the transparency of the
Pfandbrief market. These publications according to § 28 Pfandbrief Act are compulsory
for all issuers starting on 31 December 2005 and are released on a quarterly basis as of
31 March, 30 June, 30 September, and 31 December. The reports are usually published
on the issuer’s website within six weeks after the reporting date.16
The transparency report of an issuer basically contains the following information
on the public-sector cover pool and all outstanding public Pfandbriefe as well as on the
mortgage cover pool and all outstanding mortgage Pfandbriefe:17
– Notional Pfandbrief volume outstanding, the corresponding cover pool values, and
the amount of overcollateralization
– Present value18 of outstanding Pfandbriefe, the corresponding cover pool present
values, and the amount of overcollateralization
– Maturity profile of outstanding Pfandbriefe and cover loans
– Categorization of mortgage cover pool by cover loan size
– Breakdown of public cover pool by borrower’s place of residence
– Breakdown of mortgage cover pool by real property location and property type
financed
We collect these data for 40 Pfandbrief issuers from their website or their investor relations
department for the time span from December 2005 to December 2008.19 These dates are
determined by the first compulsory report and the last report within our sample period,
respectively. Table 2 presents the summary information for the cover pool information.
16Recently, the Association of German Pfandbrief Banks has started a transparency initiative andpublishes the reports of all their members in a uniform format on their website. This data, however, onlydates back to the fourth quarter 2009.
17Additional cover pool assets and derivatives as well as the cover loans being overdue for at least 90days are also reported. These values, however, usually account for a negligible fraction of the cover pooland, therefore, are not considered in our study.
18In this context, the “present value” is defined according to the Pfandbrief-Barwertverordnung(PfandBarwertV) as the sum of future cash flows discounted by using customary yield curves.
19Due to mergers and acquisitions within the last years, the number of Pfandbrief banks in our sampledropped to 46. Six issuers with in total only 27 outstanding Pfandbriefe do not report according to thecurrent Pfandbrief Act.
13

The results show that cover pools differ considerably between different issuers. For public
Pfandbriefe, for example, the cover pool’s notional values range between EUR 60 million
and EUR 91,383 million. For mortgage Pfandbriefe, the range lies between EUR 75 million
and EUR 54,237 million. On average, approximately 3/4 of the total cover pool consists
of public-sector loans. This number slightly declines over time.
Most of the outstanding Pfandbriefe and cover pool loans have a maturity of 1 to 5
years with slight differences between the issuers. For public Pfandbriefe, a large fraction
of the pool consists of German cover pool assets. For mortgage Pfandbriefe, the majority
is also backed by German cover loans. Whereas a considerable amount of commercial
mortgages in the cover pools is from abroad, there is only a small amount of foreign
residential mortgages. However, there is a great variety between issuers since issuers
without any German cover pool asset as well as issuers without any foreign cover pool
asset exist.
Recognizing the differences between the cover pools, we define the following
explanatory variables to capture the different types of risk within the cover pools. These
variables are calculated for every Pfandbrief issuer on a quarterly basis.
– Overcollateralization: OC = Cover pool value – Outstanding amount PfandbriefeOutstanding amount Pfandbriefe
– Term transformation: TRANS =
Average maturity of pool assets – Average maturity of outstanding Pfandbriefe
– Percentage of Pfandbriefe due the following year:
PBDUE = Amount of Pfandbriefe due next yearOutstanding amount Pfandbriefe
– Percentage of cover loans due the following year:
CLDUE = Amount of cover loans due next yearTotal amount cover loans
– Percentage of German cover pool assets: GERM = Amount of German cover pool assetsTotal amount cover pool assets
– Percentage of small cover loans: SMALL = Amount of cover loans ≤ EUR 300.000Total amount cover loans
– Percentage of large cover loans: LARGE = Amount of cover loans > EUR 5 millionTotal amount cover loans
– Percentage of residential cover loans: RES = Amount of residential cover loansTotal amount cover loans
14

– Percentage of commercial cover loans: COM = Amount of commercial over loansTotal amount cover loans
Table 3 shows the summary statistics of these variables. Overcollateralization (OC ) can be
measured on a notional or present value basis. The median OC amounts to 9.8% for public
and 17.8% for mortgage Pfandbriefe on a notional basis and is slightly higher in terms of
present value. § 4 Pfandbrief Act requires the OC to be a least 2% on a present value basis
and, therefore, the minimum is always above this value. The extreme maximum values
are for WestLB that had already built a large cover pool when it started to issue the first
public-sector Pfandbriefe under the new Pfandbrief Act, and for SachsenLB with many
cover loans, but hardly any mortgage Pfandbrief outstanding shortly before taken over by
LBBW. Maintaining the OC on a higher level than the minimum level is often required by
rating agencies for assigning a specific Pfandbrief rating. In particular, this requirement is
made for mortgage Pfandbriefe, leading to a higher OC on average. In general, however,
a higher amount of OC shows a relatively higher amount of assets to guarantee for the
outstanding Pfandbrief payments for both, public and mortgage Pfandbriefe. Therefore,
we expect the yield spread to be negatively related to OC .
The term transformation (TRANS ) measures the volume-weighted average maturity
of cover pool assets versus outstanding Pfandbriefe. If TRANS is zero, the average
maturities coincide. A higher TRANS signals a shorter average maturity of the
outstanding Pfandbriefe, a smaller one signals a shorter average maturity of the cover
pool. On average, TRANS is slightly below 1/2 year, i.e. the average cover pool maturity
is 1/2 year longer than the average maturity of the outstanding Pfandbriefe. However,
there may be large maturity mismatches since TRANS ranges between −6 and 6 years. In
general, a maturity mismatch may cause several problems. First, the cover pool and the
outstanding Pfandbriefe may react differently to interest rate changes. Second, a shorter
maturity of the outstanding Pfandbriefe may lead to the need of refinancing for the issuer.
In particular, this is important when markets dry up and refinancing is difficult. Third,
a shorter maturity of the cover pool may force the issuer to provide additional cover
assets. Therefore, a higher TRANS as well as a lower TRANS may signal higher risks
for the Pfandbrief holder and we expect a positive relation between the yield spread and
|TRANS |.
15

The interpretation of the next two variables, the percentage of Pfandbriefe and
cover loans due the following year (PBDUE and CLDUE ), is quite similar. A higher PBDUE
may signal the need of short-term refinancing, a higher CLDUE the necessity to provide
additional cover assets. Hence, we expect both variables to be positively related to the
yield spread. Table 3 shows meaningful differences between the issuers. On average,
PBDUE and CLDUE amount to 15% to 20%, but may also be 0% or almost 100%. These
variables, however, have to be used with care since maturity mismatches can also be
compensated by the use of derivatives or other bank assets and liabilities.
Pfandbriefe are mainly backed by German cover assets with median values of 89%
for public and 98% for mortgage Pfandbriefe. However, the percentage of German cover
assets (GERM ) varies substantially between 8.5% and 100%. This variable can have two
opposite effects. On the one hand, GERM signals lower diversification and, therefore,
higher residual risk, which should lead to a higher risk premium. On the other hand,
German public-sector debt is considered relatively safe compared to other European
countries, and the German real estate market has shown less volatile and less overvalued
than real estate markets of other countries.20 Therefore, German cover assets can be
regarded as less risky leading to a lower yield spread. The empirical analysis will provide
evidence whether one of these effects is prevalent or whether the impact even depends on
the considered sample period.
SMALL and LARGE show the percentage of mortgage cover loan amounts below
EUR 300,000 and above EUR 5 million, respectively. Their values range between 0% and
100%. A higher value of SMALL means that the cover pool is more granular and hence,
ceteris paribus, less risky. Therefore, we expect the yield spread being negatively related
to SMALL. Vice versa, we predict a positive relation for LARGE as a measure for low
diversification.
On average, Pfandbrief issuers finance residential and commercial mortgages in equal
shares. However, there are large differences between issuers, ranging from complete
residential financing to complete commercial financing. Since commercial financing is
20For the last ten years, the IPD Total Return Property Index for Germany shows a substantially lowerannualized volatility of below 1% compared to values above 2% for most other countries (up to 5% forthe United States).
16

usually more risky and shows a higher dependence on the business cycle, a high fraction
of commercial mortgages (COM ) – or, equivalently, a low fraction of residential mortgages
(RES ) – should lead to a risk premium for the corresponding Pfandbriefe. Moreover, it
is important to note that the variables RES and COM are closely related to SMALL and
LARGE as residential mortgages are typically smaller and commercial mortgages often
exceed EUR 5 million. Therefore, is is not surprising that the variables are positively
correlated, with ρ(SMALL,RES ) = 0.93 and ρ(LARGE ,COM ) = 0.89. To avoid the
problem of multicollinearity, we do not simultaneously include them into a regression.
We compute the quarterly yield spreads for each Pfandbrief as the average of the
weekly yield spreads during the six weeks following the record date. This period is the
usual time by which nearly all issuers have published their reports. The calculation of
the average yield spread during this period is considered as a trade-off between using the
yield spread precisely at the record date or using the yield spread after six weeks when the
information is actually available to all market participants. As the cover pool composition
for a single issuer remains relatively constant over time, this assumption is not likely to
distort our results. After the quarterly calculation, we remain with 972 outstanding
Pfandbriefe with available price data and 4,678 quarterly yield spreads for the time span
from December 2005 to December 2008. Table 4 presents the summary information for
the quarterly data. The number of available issues drops due to the modification of the
time period. The composition of the data set in terms of Pfandbrief segments and rating
classes, however, does not change notably.
IV Empirical Results
IV.1 Descriptive Statistics
We first investigate the yield spreads of the different Pfandbrief segments relative to
Bunds. Figure 1 shows the average yield spreads of the four segments on a weekly basis.
The vertical lines mark the beginning of the subprime crisis period, and the post-Lehman
period, respectively. In the pre-crisis period until June 2007, the average Pfandbrief spread
for all segments relative to Bunds is approximately 10 bp with a maximum of up to 30
17

bp. Surprisingly, also periods with average Pfandbrief spreads below zero exist, showing
that Pfandbriefe sometimes even trade at a small yield discount relative to Bunds. This
result signals the very high quality of Pfandbriefe perceived by investors.
With the advent of the subprime crisis the picture completely changes. Starting in
July 2007, the average yield spreads steadily rise to approximately 50 bp until September
2008. Furthermore, after the collapse of Lehman Brothers, the spreads drastically increase
to approximately 120 bp for Jumbo Pfandbriefe and 150 bp for traditional Pfandbriefe.
These spreads signal the high risk premia demanded by investors during the recent
financial turmoil and suggest that, at least during financial crises, Pfandbriefe cannot
be regarded as close substitutes for Bunds in terms of risk. Moreover, this figure clearly
supports the partitioning of our sample in a pre-crisis period and separate periods for the
subprime crisis and the post-Lehman financial crisis.
Comparing the Pfandbrief spreads with respect to Bunds, however, does not allow
to disentangle the different risk premia contained in the Pfandbrief market. Hence, it is
still questionable whether the strong increase in yield spreads is mainly driven by liquidity
or credit risk. For an in-depth analysis, we therefore compute the yield spreads relative
to public Jumbo Pfandbriefe. This approach enables us to better isolate the individual
risk premia by comparing Pfandbriefe that only differ in one dimension. Figure 2 shows
the average yield spreads of the remaining three Pfandbrief segments on a weekly basis
and striking yield differences within the Pfandbrief market become visible.
Similar to the yield spreads relative to Bunds, this figure also shows a different
behavior during the pre-crisis period, the subprime crisis, and the post-Lehman period.
In the pre-crisis period, the three average segment yield spreads mostly vary between −5
bp and 10 bp. Whereas mortgage Jumbo Pfandbriefe trade relatively stable at a yield
spread of 2 bp on average, traditional Pfandbrief yield spreads are more volatile and trade
at a premium of 3–5 bp on average. With the beginning of the subprime crisis, the average
yield spreads increase to 10 bp for mortgage Jumbo Pfandbriefe and 20 bp for traditional
Pfandbriefe, rising up to 50 bp after the collapse of Lehman Brothers.
For a detailed analysis, Table 5 shows the descriptive statistics of the individual
yield spreads relative to the average public Jumbo Pfandbrief yield curve for the total
18

sample and the different subperiods. In general, mortgage Jumbo Pfandbriefe trade at a
small premium and traditional Pfandbriefe at a larger premium relative to public Jumbo
Pfandbriefe. Hence, Pfandbriefe backed by mortgages seem to be considered as more risky
than those covered by public-sector loans. Moreover, the lower liquidity of traditional
Pfandbriefe is priced with 4–6 bp on average relative to Jumbo Pfandbriefe. During the
crisis subperiods the average yield spreads significantly increase up to 38 bp for public
traditional Pfandbriefe. Even though a rise in the credit risk premium for mortgage Jumbo
Pfandbriefe can be observed, the effect on the liquidity premia for traditional Pfandbriefe
is substantially larger.
Within a specific Pfandbrief segment, however, the yield spreads also vary
considerably. During the pre-crisis and the subprime crisis period traditional Pfandbrief
spreads are much more volatile with an increasing volatility during the latter period. In
the post-Lehman period, yield spreads highly fluctuate within all Pfandbrief segments.
Even for public Jumbo Pfandbriefe the yield spreads vary between −48 bp and 192 bp.
This observation shows that it is not sufficient to partition the Pfandbrief market into the
four segments to entirely explain the varying yield spreads. Hence, further risk factors
should be considered.
In summary, the results clearly show that the Pfandbrief market cannot be regarded
as homogenous and considerable differences between the Pfandbriefe segments as well as
between individual Pfandbriefe exist. In the following, we explore the yield spreads within
the Pfandbrief market in detail and relate them to liquidity and credit risk proxies.
IV.2 Analysis of Pfandbrief Spreads
In this section we investigate the Pfandbrief yield spreads on a weekly basis. We aim
to assign the different components of the yield spreads to the explanatory variables
introduced in Section III.2. Panel A of Table 6 displays seven regression results for
the pre-crisis period which all comprise segment dummies and differ by the inclusion of
Pfandbrief rating dummies (Regression B) and issuer rating dummies (Regression C).
Regressions D to G further include the Pfandbrief’s relative age and outstanding amount
as liquidity proxies as well as two dummies for Landesbank Pfandbriefe issued before and
19

after the abolishment of the guarantor liability on 18 July 2005.
The results show a significant and positive relation between the yield spreads and
the dummies for mortgage and traditional Pfandbriefe. Depending on the inclusion of
further explanatory variables, the average credit risk premium for mortgage Pfandbriefe
relative to public Pfandbriefe amounts to 2 bp and the average liquidity premium for
traditional Pfandbriefe relative to Jumbo Pfandbriefe adds up to 4 bp. The joint dummy
variable is always higher and approximately equals the sum of the credit risk and the
liquidity premium. Altogether, these segment variables already explain some part of the
variation in the yield spreads.
As expected, the Pfandbrief rating has a significant influence on the yield spread
and a higher rating leads to a lower spread. The differences are around 2 bp between AA
and AAA rated Pfandbriefe. Surprisingly, the absence of a Pfandbrief rating does not
unambiguously lead to a higher yield spread. This result, however, may be driven by the
fact that Pfandbriefe are usually not rated in the beginning of our sample period and,
thus, a rating does not signal a higher credit quality per se. Even though the impact of the
rating dummies is significant, they hardly explain any variation in the yield spreads when
omitting the segment dummies (not reported). In contrast, the issuer rating may explain a
meaningful part, increasing the adjusted R2 up to 10%. The results are also economically
significant as a Pfandbrief from a BBB/BB rated issuer on average trades at a premium
of more than 4 bp compared to a AAA/AA rated issuer. This result provides evidence
that investors already value the long-term issuer credit quality during the pre-crisis period
when Pfandbriefe are typically considered as close substitutes to Bunds.
The results also show a significant and positive relation between the yield differences
and the liquidity proxies. Besides the premium for traditional Pfandbriefe, a higher
relative age and a lower outstanding amount (both signaling a lower liquidity) lead to a
significantly higher yield spread. In particular, a Pfandbrief close to maturity on average
trades at an additional yield spread of 6 bp relative to its issuance. Hence, liquidity seems
to be an important priced risk factor even during the pre-crisis period.
Our results further show that the average yield spreads for Landesbank Pfandbriefe
significantly increase after the discontinuation of the guarantor liability. Investors seem
20

to attribute a risk premium of 3 bp to Pfandbriefe that are not guaranteed by the federal
states even though the underlying cover pools did not change considerably. Overall, the
full model (Regression G) explains roughly 14% of the yield spread variation within the
Pfandbrief market.
The results for the subprime crisis presented in Panel B of Table 6 are similar in
terms of sign and significance, but much more pronounced. The yield spreads are higher
in absolute terms and the adjusted R2 is up to 40%. It is important to note that the
credit risk premium between mortgage and public Pfandbriefe only increases to 3–5 bp
whereas the liquidity premium between traditional and Jumbo Pfandbriefe considerably
increases up to 14 bp. In contrast to the results in Panel A, the joint effect is smaller than
the sum of the credit risk and the liquidity premium, suggesting a negative correlation
between liquidity and credit risk. This result complements the findings of Favero et al.
(2010) for European sovereign bonds and Buhler and Trapp (2010) for high quality AAA
rated corporate bonds that, in contrast to the findings for sub-investment grade bonds,
liquidity and credit risk interact negatively in high quality bond markets.
Whereas the yield spread between AA and AAA rated Pfandbriefe is approximately
4 bp, the yield spreads between the issuer rating categories are up to 7 bp. Similar to
the pre-crisis period, the issuer rating explains a higher fraction of the variation in the
yield spreads. In addition, the Pfandbrief’s relative age and its outstanding amount have
a significant impact similar to the pre-crisis period, but larger in absolute values. This
result, in conjunction with the higher yield spreads for traditional Pfandbriefe, provides
evidence of a considerably higher liquidity premium during the subprime crisis.
In contrast to the results during the pre-crisis period, Landesbank Pfandbriefe are
penalized with significant yield spreads of up to 4 bp. This result can be rationalized by the
fact that nearly all Landesbanks were engaged in unsuccessful investments in the subprime
market. Hence, investors also appear to value the risk stemming from non-Pfandbrief
businesses. As expected, the yield spread is significantly higher for Pfandbriefe issued
after the abolishment of the guarantor liability.
The results substantially change during the period after the collapse of Lehman
Brothers. While the explanatory variables explain a large part of the yield spread in
21

the previous regressions, Panel C of Table 6 shows that the Pfandbrief segments are able
to exclusively explain only 16%. The major part can be proxied by the issuer rating
dummies, the liquidity proxies and firm-specific effects leading to an adjusted R2 of 50%
for the full model. However, there are still significant differences between the Pfandbrief
segments, most notably between traditional and Jumbo Pfandbriefe. The average yield
spread between these segments is up to 45 bp and shows the particular relevance of
liquidity in the post-Lehman era. Moreover, yield spreads between low and high rated
Pfandbriefe as well as low and high rated issuers increase considerably. The average yield
spread of a BBB rated issuer compared to an AA rated issuer exceeds 22 bp and is larger
than the impact of the Pfandbrief rating or whether the Pfandbrief is covered by mortgage
or public-sector loans. This result strongly indicates that investors consider the issuers’
default risk even though Pfandbriefe are backed by high-quality cover assets.
Besides the striking yield difference between traditional and Jumbo Pfandbriefe,
the relative age has a strong impact of up to 25 bp between recently issued and almost
matured Pfandbriefe. Hence, liquidity seems to be the most important factor considered
by Pfandbrief investors. However, the Pfandbrief yield spreads are also driven by various
issuer fixed effects during this periods. In contrast to the previous results, Landesbank
Pfandbriefe trade at a yield discount of up to 17 bp compared to other Pfandbriefe –
irrespective whether the Pfandbrief is issued before or after the discontinuation of the
guarantor liability. This result signals that, against the background of the financial
crisis, investors expect the owners or the state to rescue Landesbanks even though a legal
guarantee does not apply any more. Apparently, the evident problems of the private banks
DEPFA and Hypo Real Estate are priced by investors with yield spreads of approximately
96 bp and 50 bp, respectively. Hence, investors do not completely anticipate the rescue
of these issuers in case of default. However, it is important to note that the problems of
these issuers did not arise in the cover pool assets, but are due to non-Pfandbrief business.
Therefore, our investigation provides further evidence that investors evaluate the default
risk of an issuer to a large extent, even though the cover pools remain reliable.
In summary, our results show that the Pfandbrief market exhibits considerable
heterogeneity, and the risks perceived by investors strongly vary over time. During the
22

pre-crisis and the subprime crisis period, the four Pfandbrief segments account for a large
part of the Pfandbrief yield spreads whereas the issuer rating does not play an important
role. After the collapse of Lehman Brothers, however, the issuer rating and issuer-specific
factors become more important. Moreover, it is surprising that the specific cover pool
quality, proxied by mortgage versus public-sector loans as well as the Pfandbrief rating,
seems to be only a subordinate factor beyond liquidity and issuer default risk. Therefore,
it seems sensible that rating agencies nowadays consider the issuer quality as an additional
factor for their rating methodology. Above all, liquidity appears to be the most important
risk factor priced in the secondary Pfandbrief market.
IV.3 Detailed Analysis Using Cover Pool Data
Up to this point, we only approximate the cover pool quality by the distinction between
mortgage and public-sector cover loans and the Pfandbrief rating. In the following, we
explicitly consider proxies for the quality of the cover pool using the information according
to § 28 Pfandbrief Act presented in Section III.3.
Cover pool information is available on a quarterly basis only. In order to ensure
consistency, we initially compare the basic results for weekly and quarterly yield spread
data. Table 7 reports the descriptive statistics for the individual Pfandbrief yield spreads
relative to public Jumbo Pfandbriefe on a quarterly basis. The results are very similar
to those using weekly data and being presented in Table 5: Mortgage Jumbo Pfandbriefe
trade at a small premium and traditional Pfandbriefe at a larger premium. The premia
substantially increase during the financial crisis. Even though the number of observations
is much smaller, the regression results do not change considerably when using quarterly
data. Table 8 shows that the sign of the coefficient estimates mostly coincide and the
magnitude is quite similar compared to the results displayed in Table 6. Hence, the
interpretation of the results does not change compared to the results for weekly data
presented in Section IV.2. This robustness check shows the consistency of the samples
with weekly and quarterly data. Therefore, we proceed with quarterly data to analyze
the impact of the cover pool variables.
The regression results presented in Tables 6 and 8 have shown that the model
23

including the Pfandbrief segments, the issuer rating, and the liquidity proxies is superior
in explaining the individual Pfandbrief yield spreads. Therefore, we use this model as the
basic model when measuring the impact of the cover pool variables. In contrast to the
previous regressions, however, we refrain from using the Pfandbrief rating dummies since
we aim to measure the quality of the cover pool directly by using the cover pool variables
defined above. Table 9 displays the regression results for the pre-crisis period (Panel A),
the subprime crisis (Panel B) and the post-Lehman financial crisis (Panel C). Regression
A shows the basic model and Regression B to G include the six cover pool variables
defined in Section III.3 separately. Regression H provides the coefficient estimates for the
cover pool variables only, and Regression I presents the results for the full model.
During the pre-crisis period, only the impact of the overcollateralization OC is
significant when including the cover pool variables separately. As expected, a higher OC
leads to a lower yield spread. The impact, however, is economically small given that an
OC of 100% may decrease the yield spread by only 0.22 bp. Considering the six cover
pool variables alone, the adjusted R2 amounts to roughly 3% signaling that only a very
small part of the Pfandbrief yield spreads can be explained by the cover pool variables.
Estimating the full model, however, leads to superior results. Even though the cover pool
variables only account for a small rise of the adjusted R2, three of them have a significant
impact. First, the OC is significant negative as in Regression B. Second, a higher fraction
of German cover assets leads to a higher yield spread. Thus, Pfandbrief investors seem to
price the lower regional diversification within the cover pools. Third, Pfandbriefe with a
more granular portfolio trade at a significant yield discount, signaling the higher value of
Pfandbriefe with a diversified underlying cover pool.21
It is important to note that the sign and significance of the basic model variables
do not change when including the cover pool variables. Comparing these results to Panel
A of Table 8, we provide evidence that, during the pre-crisis period, the Pfandbrief yield
spreads are mainly driven by the differences between the four Pfandbrief segments and
their relative liquidity. The additional impact of the issuer rating and the quality of the
cover pool is of minor importance.
21Instead of SMALL, we separately include LARGE , RES , and COM into the regression analysis. Theresults, however, do not change remarkably, and the interpretation remains identical.
24

The results only slightly change during the period of the subprime crisis. Whereas
the four Pfandbrief segments and the liquidity proxies already explain 42% of the variation
in the yield spreads, the full model only marginally improves the adjusted R2 by 1%.
During the subprime crisis, however, the variable measuring the term transformation,
|TRANS |, has a significant impact on the yield spreads. A maturity-mismatch of the
cover assets and the outstanding Pfandbriefe by one year accounts for 1 bp of the yield
spread. Moreover, a higher fraction of Pfandbriefe due within the following year, PBDUE ,
is significantly related to a higher yield spread. These results indicate that, during the
period of the subprime crisis, investors are concerned about the term transformation of
the Pfandbrief issuer. Moreover, as during the pre-crisis period, Pfandbriefe with a more
granular portfolio trade at a significant yield discount. However, the Pfandbrief segment
variables and the liquidity variables remain the primary drivers of the yield spread.
The picture completely changes when investigating the post-Lehman period. Panel
C of Table 8 has already shown that the issuer’s long term credit rating is an important
driver of the yield spread beyond the Pfandbrief segment and the liquidity variables. In
addition, Panel C of Table 9 provides evidence that Pfandbrief investors also evaluate the
cover pool quality in detail. When considering the six cover pool variables separately, four
of them are significantly related to the yield spread. As during the subprime period, the
term transformation, |TRANS |, is positively related to the yield spread with an impact of
6 bp for each year of maturity-mismatch. A higher amount of cover loans due within the
following year, CLDUE , is also positively related to the yield spread at a 10% significance
level. This is consistent with investors being concerned about the capability of the issuer
to provide additional cover assets of at least the same quality.
In contrast to the results for the pre-crisis period, the fraction of German cover pool
assets, GERM , has a significant negative impact. This result suggests that investors prefer
the high quality and lower volatility of German cover assets to international diversification
of the cover pool during times of financial turmoils. Moreover, a more granular cover pool
as measured with SMALL and, equivalently, a higher fraction of residential mortgages
have a significantly negative impact on the yield spread. Thus, Pfandbrief investors prefer
cover pools that are less volatile and less dependent on the contemporaneous economic
25

conditions.
Considering the full model, Regression I shows that the cover pool variables
additionally account for almost 4% of the adjusted R2 compared to the basic model
(Regression A). It is surprising that the cover pool variables even explain a larger part of
the Pfandbrief yield spread than the consideration of the Pfandbrief rating as in Regression
G in Panel C of Table 8. Moreover, it is noteworthy that the overcollateralization OC does
not have a significant impact during the period of the subprime crisis and the post-Lehman
period. Moreover, the impact is economically very small in the pre-crisis period. Hence,
investors do not seem to take into account the amount of OC when pricing a Pfandbrief.
On the one hand, this result may show that the legal requirement of a minimal OC is
sufficient and any additional OC does not have any impact. On the other hand, OC can
be regarded as less relevant since the number frequently may change by the issuance of
new Pfandbriefe. Overall, our results show that the general composition of the cover pool
is more important than simply the amount of overcollateralization.
Altogether, the results for the post-Lehman financial crisis provide evidence that
liquidity is the most important risk factor for pricing Pfandbriefe. Whereas it is
less relevant whether the Pfandbrief is backed by public-sector or mortgage loans, the
composition of the cover pool gains more importance. The issuer rating as well as
firm-specific effects remain relevant.
V Summary and Conclusion
In this paper we extensively study credit risk and liquidity premia within the Pfandbrief
market. In contrast to previous studies, we show that liquidity is not the exclusive driver
of yield spreads between Pfandbriefe and German government bonds and issuer-specific
effects as well as the cover pool quality is also relevant. Therefore, our results show that
the presumption of a homogenous Pfandbrief market cannot be sustained any longer.
Pfandbriefe differ with respect to their type of collateral, the quality of the issuer, the
quality of the cover pool, and their liquidity. In general, yield spreads between individual
Pfandbriefe are mainly driven by their relative liquidity and whether they are covered by
26

public-sector or mortgage loans. Even though the recent financial crisis has its origin in
the mortgage market, the type of cover assets appears to be less important during this
period. Liquidity, however, proves to have the most important effect.
Strict legal requirements ensure the high quality of the Pfandbrief cover pool and
aim to guarantee the Pfandbrief holder timely payments of the Pfandbrief obligations.
However, the general quality of the Pfandbrief issuer still has an important impact, in
particular during the financial crisis. This result shows that Pfandbrief investors are
concerned about an issuer’s default and the potential subsequent illiquidity or devaluation
of a Pfandbrief. Hence, it is not surprising that nowadays all major rating agencies
consider the issuer rating as an important factor for their Pfandbrief rating methodology.
In general, the impact of the cover pool quality is quite small. Hence, our results
provide evidence that the strict regulation of German Pfandbriefe ensures the overall
high quality of the cover pool. During the recent financial crisis, however, some variables
like the term transformation between Pfandbriefe and their cover pool or the fraction
of German cover assets show a significant impact on the yield spreads. Therefore, the
mandatory publications according to § 28 Pfandbrief Act seem to be less important during
normal market times, but provide additional value in times of financial turmoil. During
these periods, Pfandbrief issuers with a sustainable cover pool may profit from relatively
lower refinancing cost.
Altogether, the Pfandbrief market has shown to develop from a relatively
homogenous market until the end of the nineties to a heterogenous market with
issuer-specific and liquidity related risk premia. The understanding of the different risk
premia within the Pfandbrief market is important for investors, issuers, and regulators.
Investors are mainly interested in accurately knowing about the risks inherent in the
Pfandbrief market during different market environments. Issuers need to know the
perceived risk factors priced by investors to design an optimal Pfandbrief issuance. As the
Pfandbrief market is systemic for the German banking system, regulators are concerned
about the issuers’ long-term ability to meet their Pfandbrief obligations. Moreover,
regulators from other countries should be informed about the important risk factors when
setting up a legal framework for covered bonds.
27

References
Bernanke, B. S. (2009). The future of mortgage finance in the United States. The B.E.
Journal of Economic Analysis & Policy, 9(3.2):1–9.
Buhler, A. and Hies, M. (1998). Yields and spreads on the German market. The
Pfandbrief, 3:51–58.
Buhler, W. and Trapp, M. (2010). Time-varying credit risk and liquidity premia in bond
and CDS markets. Working Paper, University of Mannheim, University of New South
Wales, and University of Cologne.
Birkmeyer, J. and Herbert, T. (2002). Jumbo Pfandbrief spreads: Everything new,
everything different or everything as it was? The Pfandbrief, 7:69–77.
Breger, L. and Stovel, D. (2004). Agency ratings in the Pfandbrief market. Journal of
Portfolio Management, 30(4):239–243.
Chen, L., Lesmond, D., and Wei, J. (2007). Corporate yield spreads and bond liquidity.
Journal of Finance, 62(1):119–149.
Collin-Dufresne, P., Goldstein, R., and Martin, S. (2001). The determinants of credit
spread changes. Journal of Finance, 56(6):2177–2207.
Cross, G. (2008). The German Pfandbrief and European covered bonds market. In
Fabozzi, F. J., editor, Handbook of Finance: Volume 1. Hoboken, NJ: John Wiley &
Sons.
De Jong, F. and Driessen, J. (2007). Liquidity risk premia in corporate bond markets.
Working Paper, Tilburg University and University of Amsterdam.
Dick-Nielsen, J., Feldhutter, P., and Lando, D. (2009). Corporate bond liquidity before
and after the onset of the subprime crisis. Working Paper, Copenhagen Business School.
ECB (2008). Covered bonds in the EU financial system. European Central Bank,
December 2008.
Favero, C., Pagano, M., and von Thadden, E.-L. (2010). How does liquidity
affect government bond yields? Journal of Financial and Quantitative Analysis,
45(1):107–134.
Jobst, A. A. (2006). European securitization: A GARCH model of secondary market
spreads. Journal of Structured Finance, 12(1):55–80.
28

Kempf, A., Korn, O., and Uhrig-Homburg, M. (2010). The term structure of illiquidity
premia. Working Paper, University of Cologne, University of Gottingen, and University
of Karlsruhe.
Koziol, C. and Sauerbier, P. (2007). Valuation of bond illiquidity: An option-theoretical
approach. Journal of Fixed Income, 16(4):81–107.
Longstaff, F. A., Mithal, S., and Neis, E. (2005). Corporate yield spreads: Default risk
or liquidity? New evidence from the credit-default swap market. Journal of Finance,
60(5):2213–2253.
Lucas, D. J., Fabozzi, F. J., Goodman, L. S., Montanari, A., and Peter, A. (2008). Covered
bonds: A new source of U.S. mortgage loan funding? Journal of Structured Finance,
14(3):44–48.
Mastroeni, O. (2001). Pfandbrief-styple products in Europe. In The Changing Shape of
Fixed Income Markets: A Collection of Studies by Central Bank Economists. Basel:
Bank for International Settlements, BIS Paper Series.
Merton, R. (1974). On the pricing of corporate debt: The risk structure of interest rates.
Journal of Finance, 29(2):449–470.
Nelson, C. and Siegel, A. (1987). Parsimonious modeling of yield curves. Journal of
Business, 60(4):473–489.
Packer, F., Stever, R., and Upper, C. (2007). The covered bond market. BIS Quarterly
Review, 34(3):43–55.
Peterson, C. L. (2008). Over-indebtedness, predatory lending, and the international
political economy of residential home mortgage securitization: Comparing the U.S.
subprime home mortgage lending crisis to home finance in the United Kingdom,
Germany, and Japan. Working Paper, University of Florida.
Rees, A. (2001). A fair value model for the Pfandbrief spread. The Pfandbrief, 6:59–66.
Schafer, H. and Hochstein, M. (1999). Competitiveness of the German Pfandbrief. Recent
theoretical and empirical findings. Kredit & Kapital, 34(4):547–580.
Schich, S. T. (1997). Estimating the German Term Structure. Discussion Paper 4/97,
Economic Research Group, Deutsche Bundesbank.
Sunderhauf, R. (2006). Bewertung des Ausfallrisikos deutscher Hypotheken-Pfandbriefe.
BWV Berliner Wissenschafts-Verlag, Berlin.
29

Volk, B. and Hillenbrand, F. (2006). The European Jumbo covered bond market in the
footsteps of the German Pfandbrief. The Pfandbrief, 11:58–70.
Winkler, B. (2006). What you always wanted to know about the secondary market for
Jumbo covered bonds. The Pfandbrief, 11:22–27.
30

-50050100
150
200 20
0020
0220
0420
0620
08
bp
Mor
tgag
e Ju
mbo
Pub
lic T
radi
tion
al
Mor
tgag
e T
radi
tion
al
Pub
lic J
umbo
Fig
ure
1:Y
ield
Spre
ads
rela
tive
toG
erm
anB
unds
Thi
sfig
ure
show
sth
eav
erag
eyi
eld
spre
ads
ofth
efo
urP
fand
brie
fse
gmen
tsre
lati
veto
the
term
stru
ctur
eof
Ger
man
Bun
dsin
basi
spo
ints
.T
heav
erag
eyi
eld
spre
ads
are
calc
ulat
edon
aw
eekl
yba
sis
for
the
tim
epe
riod
from
Janu
ary
2000
unti
lJa
nuar
y20
09.
31

-200204060
2000
2002
2004
2006
2008
bp
Mor
tgag
e Ju
mbo
Pub
lic T
radi
tion
al
Mor
tgag
e T
radi
tion
al
Fig
ure
2:Y
ield
Spre
ads
rela
tive
topublic
Jum
bo
Pfa
ndbri
efe
Thi
sfig
ure
show
sth
eav
erag
eyi
eld
spre
ads
ofth
ree
Pfa
ndbr
ief
segm
ents
rela
tive
toth
ete
rmst
ruct
ure
ofpu
blic
Jum
boP
fand
brie
fein
basi
spo
ints
.T
heav
erag
eyi
eld
spre
ads
are
calc
ulat
edon
aw
eekl
yba
sis
for
the
tim
epe
riod
from
Janu
ary
2000
unti
lJa
nuar
y20
09.
32

Tab
le1:
Sum
mar
yIn
form
atio
nof
the
Pfa
ndbri
efD
ata
Set
(Wee
kly
Dat
a)
Thi
sta
ble
show
sth
esu
mm
ary
info
rmat
ion
for
the
Pfa
ndbr
iefe
cons
ider
edin
our
stud
y.P
anel
Abr
eaks
dow
nth
est
atis
tics
byth
eP
fand
brie
fse
gmen
t,P
anel
Bby
the
aver
age
long
-ter
mis
suer
cred
itra
ting
byF
itch
,M
oody
’s,
and
Stan
dard
&P
oor’
s.A
sing
leis
sue
isun
ambi
guou
sly
assi
gned
toa
Pfa
ndbr
iefs
egm
ent
and
may
beal
loca
ted
repe
ated
lyfo
ra
spec
ific
issu
erra
ting
due
tora
ting
chan
ges.
The
data
onth
eou
tsta
ndin
gam
ount
isav
erag
edac
ross
the
diffe
rent
issu
esfr
omth
esa
me
segm
ent,
the
data
onth
eti
me
tom
atur
ity
acro
ssth
edi
ffere
ntis
sues
from
the
sam
ese
gmen
tan
dth
enac
ross
tim
e.T
henu
mbe
rof
wee
kly
obse
rvat
ions
isth
enu
mbe
rof
avai
labl
ebo
ndpr
ices
for
the
resp
ecti
veis
sues
duri
ngth
eth
ree
sub-
peri
ods
and
the
who
lesa
mpl
epe
riod
from
Janu
ary
2000
toJa
nuar
y20
09.
The
thre
esu
b-pe
riod
sra
nge
from
Janu
ary
2000
toJu
ne20
07(p
re-c
risi
s),
from
July
2007
toSe
ptem
ber
2008
(sub
prim
ecr
isis
)an
dfr
omSe
ptem
ber
2008
toJa
nuar
y20
09(p
ost-
Leh
man
).
Pan
elA
:P
fandbri
efSeg
men
t #Is
sues
Out
stan
ding
Tim
eto
Mat
urit
y(y
ears
)#
Wee
kly
Obs
erva
tion
s(B
ond
Pri
ces)
Pri
ces
Pfa
ndbr
ief
Segm
ent
#Is
sues
wit
hP
rice
Am
ount
subp
rim
epo
st-
subp
rim
epo
st-
occu
rrin
gon
Ava
ilabi
lity
(EU
Rm
illio
n)pr
e-cr
isis
cris
isL
ehm
anpr
e-cr
isis
cris
isL
ehm
anal
lW
edne
sday
s
Pub
licJu
mbo
464
420
1,46
73.
162.
762.
8972
,546
7,99
62,
098
82,6
4099
.6%
Mor
tgag
eJu
mbo
9684
1,51
44.
203.
293.
3313
,932
2,86
280
617
,600
99.7
%P
ublic
Tra
diti
onal
3,61
71,
357
165
2.92
1.81
1.90
40,7
256,
992
1,32
949
,046
89.2
%M
ortg
age
Tra
d.2,
221
731
125
2.77
2.25
2.26
29,6
632,
527
511
32,7
0191
.1%
Ove
rall
6,39
82,
592
409
2.96
2.21
2.39
156,
866
20,3
774,
744
181,
987
95.3
%
Pan
elB
:Is
suer
Rat
ing
#Is
sues
wit
hP
rice
Ava
ilabi
lity
#W
eekl
yO
bser
vati
ons
(Bon
dP
rice
s)Is
suer
Rat
ing
Pub
licM
ortg
age
Pub
licM
ortg
age
subp
rim
epo
st-
Jum
boJu
mbo
Tra
diti
onal
Tra
diti
onal
all
pre-
cris
iscr
isis
Leh
man
all
AA
A53
156
713
175
211
,660
00
11,6
60A
A26
144
1,15
850
51,
968
65,6
537,
585
1,82
275
,060
A32
978
541
435
1,38
360
,334
11,6
002,
711
74,6
45B
BB
9020
8191
282
10,0
0229
918
410
,485
BB
3112
3619
9883
965
00
1,48
9N
oR
atin
g90
917
381
353
8,37
824
327
8,64
8
33

Tab
le2:
Sum
mar
ySta
tist
ics
ofC
over
Pool
Info
rmat
ion
acco
rdin
gto§2
8P
fandbri
efA
ct
Thi
sta
ble
repo
rts
the
sum
mar
yst
atis
tics
ofth
eco
ver
pool
info
rmat
ion
acco
rdin
gto§2
8P
fand
brie
fA
ct.
Pan
elA
show
sth
eda
tafo
rpu
blic
Pfa
ndbr
iefe
,P
anel
Bfo
rm
ortg
age
Pfa
ndbr
iefe
.T
henu
mbe
rsar
eca
lcul
ated
from
quar
terl
yob
serv
atio
nsfo
r40
Pfa
ndbr
ief
issu
ers
give
nin
EU
Rm
illio
n.D
ueto
mis
sing
outs
tand
ing
Pfa
ndbr
iefe
ina
spec
ific
segm
ent
and
acqu
isit
ions
ofP
fand
brie
fiss
uers
,we
rem
ain
wit
h45
3ob
serv
atio
nsfo
rpu
blic
Pfa
ndbr
iefe
and
398
obse
rvat
ions
for
mor
tgag
eP
fand
brie
fe.
The
tota
lsam
ple
cons
ists
ofqu
arte
rly
obse
rvat
ions
from
13qu
arte
rsas
ofD
ecem
ber
2005
toD
ecem
ber
2008
.T
heov
eral
lst
atis
tics
isba
sed
onth
eav
erag
eag
greg
ate
num
ber
for
all
issu
ers
publ
ishe
dby
the
Ass
ocia
tion
ofG
erm
anP
fand
brie
fB
anks
(vdp
)ov
erth
e13
quar
ters
ofth
esa
mpl
epe
riod
.
Pan
elA
:P
ublic
Pfa
ndbri
efe
Var
iabl
eM
ean
Std.
Min
.25
%M
edia
n75
%M
ax.
Ove
rall
Dev
.P
erc.
Per
c.
Not
iona
lva
lue
cove
rpo
ol19
,844
21,2
4860
3,19
313
,077
26,4
9991
,383
692,
004
Not
iona
lva
lue
outs
tand
ing
Pfa
ndbr
iefe
17,9
2819
,592
232,
689
11,5
2925
,262
87,7
8162
5,08
0
Pre
sent
valu
eco
ver
pool
20,4
4521
,971
563,
216
13,6
1626
,353
97,3
8271
2,92
8P
rese
ntva
lue
outs
tand
ing
Pfa
ndbr
iefe
18,2
1619
,942
232,
771
11,8
9324
,983
88,9
0263
5,05
0
Cov
erlo
ans
wit
hm
atur
ity
upto
1ye
ar4,
393
5,73
20
426
2,53
35,
163
37,3
7715
3,18
9C
over
loan
sw
ith
mat
urit
y>
1ye
arup
to5
year
s7,
416
8,37
60
1,06
15,
278
9,47
540
,150
258,
551
Cov
erlo
ans
wit
hm
atur
ity
>5
year
sup
to10
year
s5,
672
6,79
20
1,23
53,
044
6,82
534
,105
197,
569
Cov
erlo
ans
wit
hm
atur
ity
>10
year
s2,
364
3,29
30
224
1,13
92,
782
16,7
0881
,671
Out
stan
ding
Pfa
ndbr
iefe
wit
hm
atur
ity
upto
1ye
ar3,
413
4,18
40
435
2,23
24,
311
24,0
4611
8,81
1O
utst
andi
ngP
fand
brie
few
ith
mat
urit
y>
1ye
arup
to5
year
s8,
919
10,5
370
1,20
46,
288
10,5
2845
,866
311,
401
Out
stan
ding
Pfa
ndbr
iefe
wit
hm
atur
ity
>5
year
sup
to10
year
s3,
501
4,18
00
444
2,01
14,
878
24,2
2012
1,54
2O
utst
andi
ngP
fand
brie
few
ith
mat
urit
y>
10ye
ars
2,09
52,
775
014
41,
206
2,84
913
,191
72,7
84
Ger
man
cove
rpo
olas
sets
16,1
5017
,884
602,
885
10,8
7020
,792
87,1
5855
6,93
2Fo
reig
nco
ver
pool
asse
ts3,
587
6,08
80
274
1,10
54,
181
30,8
7511
3,27
8
34

Tab
le2
cont
inue
d.
Pan
elB
:M
ortg
age
Pfa
ndbri
efe
Var
iabl
eM
ean
Std.
Min
.25
%M
edia
n75
%M
ax.
Ove
rall
Dev
.P
erc.
Per
c.
Not
iona
lva
lue
cove
rpo
ol7,
619
11,5
1875
839
4,50
97,
362
54,2
3723
4,36
4N
otio
nal
valu
eou
tsta
ndin
gP
fand
brie
fe6,
567
10,2
613
576
3,97
06,
435
48,1
6520
2,05
8
Pre
sent
valu
eco
ver
pool
7,91
512
,028
7686
44,
621
7,58
558
,110
243,
416
Pre
sent
valu
eou
tsta
ndin
gP
fand
brie
fe6,
695
10,5
493
570
4,04
46,
406
51,4
9620
5,90
9
Cov
erlo
ans
wit
hm
atur
ity
upto
1ye
ar2,
028
3,89
70
112
543
1,77
822
,806
62,1
54C
over
loan
sw
ith
mat
urit
y>
1ye
arup
to5
year
s2,
985
4,98
47
261
1,63
22,
713
28,0
9691
,984
Cov
erlo
ans
wit
hm
atur
ity
>5
year
sup
to10
year
s2,
207
2,67
134
318
1,38
22,
815
12,6
2467
,993
Cov
erlo
ans
wit
hm
atur
ity
>10
year
s39
651
60
3415
463
21,
993
12,0
62
Out
stan
ding
Pfa
ndbr
iefe
wit
hm
atur
ity
upto
1ye
ar1,
183
2,05
30
2235
51,
305
12,6
7036
,509
Out
stan
ding
Pfa
ndbr
iefe
wit
hm
atur
ity
>1
year
upto
5ye
ars
3,42
55,
580
027
31,
530
3,55
930
,469
105,
228
Out
stan
ding
Pfa
ndbr
iefe
wit
hm
atur
ity
>5
year
sup
to10
year
s1,
623
2,64
20
7178
21,
742
16,5
8550
,082
Out
stan
ding
Pfa
ndbr
iefe
wit
hm
atur
ity
>10
year
s33
556
40
011
638
12,
765
10,4
14
Cov
erlo
anam
ount
upto
EU
R30
0.00
03,
116
5,96
80
8774
53,
229
32,5
8495
,643
Cov
erlo
anam
ount
>E
UR
300.
000
upto
EU
R5
mln
1,75
82,
944
016
375
81,
591
14,0
5554
,009
Cov
erlo
anam
ount
>E
UR
5m
ln2,
315
3,63
70
190
1,15
63,
042
23,5
6271
,271
Ger
man
cove
rpo
olas
sets
(res
iden
tial
)4,
172
7,23
80
240
1,52
93,
735
39,1
4713
1,42
2G
erm
anco
ver
pool
asse
ts(c
omm
erci
al)
2,14
83,
248
034
574
62,
392
15,3
4562
,798
Fore
ign
cove
rpo
olas
sets
(res
iden
tial
)44
132
00
019
908
1,57
8Fo
reig
nco
ver
pool
asse
ts(c
omm
erci
al)
778
1,87
60
022
472
11,5
1424
,186
35

Tab
le3:
Sum
mar
ySta
tist
ics
ofC
over
Pool
Expla
nat
ory
Var
iable
s
Thi
sta
ble
repo
rts
the
sum
mar
yst
atis
tics
ofth
eco
ver
pool
expl
anat
ory
vari
able
s.P
anel
Ash
ows
the
data
for
publ
icP
fand
brie
fe,
Pan
elB
for
mor
tgag
eP
fand
brie
fe.
The
num
bers
are
calc
ulat
edfr
omqu
arte
rly
obse
rvat
ions
for
40P
fand
brie
fis
suer
s.D
ueto
issu
ers
wit
hou
tsta
ndin
gP
fand
brie
fein
only
one
segm
ent
and
due
toac
quis
itio
nsof
Pfa
ndbr
ief
issu
ers,
we
rem
ain
wit
h45
3ob
serv
atio
nsfo
rpu
blic
Pfa
ndbr
iefe
and
398
obse
rvat
ions
for
mor
tgag
eP
fand
brie
fe.
The
tota
lsa
mpl
eco
nsis
tsof
quar
terl
yob
serv
atio
nsfr
om13
quar
ters
asof
Dec
embe
r20
05to
Dec
embe
r20
08.
Pan
elA
:P
ublic
Pfa
ndbri
efe
Var
iabl
eM
ean
Std.
Dev
.M
inim
um25
%P
erc.
Med
ian
75%
Per
c.M
axim
um
Ove
rcol
late
raliz
atio
n(n
otio
nal)
0.27
490.
6241
0.01
120.
0506
0.09
760.
2112
8.13
04O
verc
olla
tera
lizat
ion
(pre
sent
valu
e)0.
3453
1.05
720.
0268
0.07
310.
1128
0.22
3514
.273
0
Ave
rage
term
tran
sfor
mat
ion
(yea
rs)
0.43
231.
4232
-5.0
120
-0.3
611
0.47
581.
1438
6.02
25
Per
cent
age
ofP
fand
brie
fedu
eth
efo
llow
ing
year
0.18
240.
1290
0.00
000.
1081
0.18
200.
2438
0.93
74P
erce
ntag
eof
cove
rlo
ans
due
the
follo
win
gye
ar0.
2039
0.14
370.
0000
0.09
750.
1682
0.31
170.
8317
Per
cent
age
Ger
man
cove
rpo
olas
sets
0.85
570.
1353
0.30
580.
7888
0.88
510.
9633
1.00
00
Pan
elB
:M
ortg
age
Pfa
ndbri
efe
Var
iabl
eM
ean
Std.
Dev
.M
inim
um25
%P
erc.
Med
ian
75%
Per
c.M
axim
um
Ove
rcol
late
raliz
atio
n(n
otio
nal)
1.49
326.
1683
0.02
280.
0895
0.17
760.
6506
61.4
230
Ove
rcol
late
raliz
atio
n(p
rese
ntva
lue)
1.46
545.
7029
0.04
060.
1144
0.20
350.
7024
56.4
230
Ave
rage
term
tran
sfor
mat
ion
(yea
rs)
0.46
901.
7885
-6.1
132
-0.7
951
0.35
361.
5977
5.62
63
Per
cent
age
ofP
fand
brie
fedu
eth
efo
llow
ing
year
0.15
900.
1620
0.00
000.
0485
0.13
350.
2145
1.00
00P
erce
ntag
eof
cove
rlo
ans
due
the
follo
win
gye
ar0.
2082
0.14
130.
0000
0.10
800.
1645
0.27
740.
7331
Per
cent
age
ofG
erm
anco
ver
pool
asse
ts0.
8943
0.20
080.
0849
0.89
440.
9797
1.00
001.
0000
Per
cent
age
ofsm
all
cove
rlo
ans
0.33
220.
3025
0.00
000.
0503
0.24
490.
5979
0.99
51P
erce
ntag
eof
larg
eco
ver
loan
s0.
4051
0.29
800.
0000
0.11
250.
3866
0.62
901.
0000
Per
cent
age
ofre
side
ntia
lco
ver
loan
s0.
4930
0.28
560.
0000
0.23
150.
5013
0.75
581.
0000
Per
cent
age
ofco
mm
erci
alco
ver
loan
s0.
5070
0.28
560.
0000
0.24
420.
4987
0.76
851.
0000
36
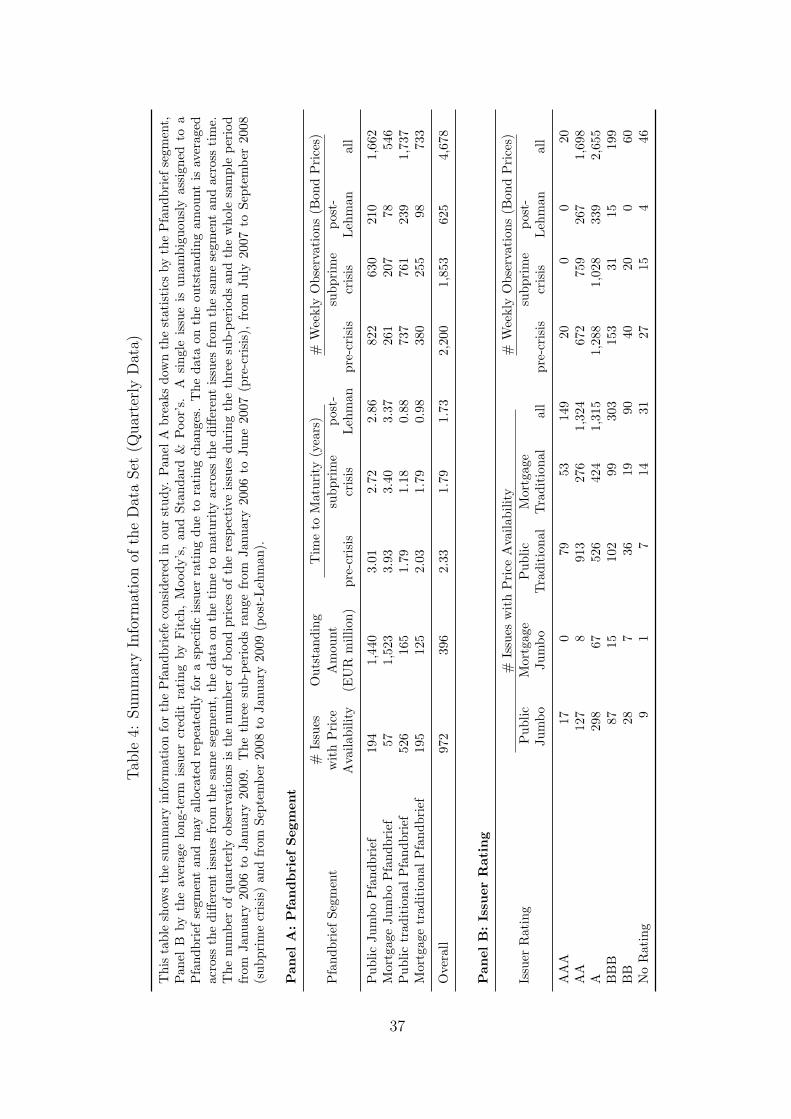
Tab
le4:
Sum
mar
yIn
form
atio
nof
the
Dat
aSet
(Quar
terl
yD
ata)
Thi
sta
ble
show
sth
esu
mm
ary
info
rmat
ion
for
the
Pfa
ndbr
iefe
cons
ider
edin
our
stud
y.P
anel
Abr
eaks
dow
nth
est
atis
tics
byth
eP
fand
brie
fse
gmen
t,P
anel
Bby
the
aver
age
long
-ter
mis
suer
cred
itra
ting
byF
itch
,M
oody
’s,
and
Stan
dard
&P
oor’
s.A
sing
leis
sue
isun
ambi
guou
sly
assi
gned
toa
Pfa
ndbr
ief
segm
ent
and
may
allo
cate
dre
peat
edly
for
asp
ecifi
cis
suer
rati
ngdu
eto
rati
ngch
ange
s.T
heda
taon
the
outs
tand
ing
amou
ntis
aver
aged
acro
ssth
edi
ffere
ntis
sues
from
the
sam
ese
gmen
t,th
eda
taon
the
tim
eto
mat
urit
yac
ross
the
diffe
rent
issu
esfr
omth
esa
me
segm
ent
and
acro
ssti
me.
The
num
ber
ofqu
arte
rly
obse
rvat
ions
isth
enu
mbe
rof
bond
pric
esof
the
resp
ecti
veis
sues
duri
ngth
eth
ree
sub-
peri
ods
and
the
who
lesa
mpl
epe
riod
from
Janu
ary
2006
toJa
nuar
y20
09.
The
thre
esu
b-pe
riod
sra
nge
from
Janu
ary
2006
toJu
ne20
07(p
re-c
risi
s),
from
July
2007
toSe
ptem
ber
2008
(sub
prim
ecr
isis
)an
dfr
omSe
ptem
ber
2008
toJa
nuar
y20
09(p
ost-
Leh
man
).
Pan
elA
:P
fandbri
efSeg
men
t
#Is
sues
Out
stan
ding
Tim
eto
Mat
urit
y(y
ears
)#
Wee
kly
Obs
erva
tion
s(B
ond
Pri
ces)
Pfa
ndbr
ief
Segm
ent
wit
hP
rice
Am
ount
subp
rim
epo
st-
subp
rim
epo
st-
Ava
ilabi
lity
(EU
Rm
illio
n)pr
e-cr
isis
cris
isL
ehm
anpr
e-cr
isis
cris
isL
ehm
anal
l
Pub
licJu
mbo
Pfa
ndbr
ief
194
1,44
03.
012.
722.
8682
263
021
01,
662
Mor
tgag
eJu
mbo
Pfa
ndbr
ief
571,
523
3.93
3.40
3.37
261
207
7854
6P
ublic
trad
itio
nal
Pfa
ndbr
ief
526
165
1.79
1.18
0.88
737
761
239
1,73
7M
ortg
age
trad
itio
nal
Pfa
ndbr
ief
195
125
2.03
1.79
0.98
380
255
9873
3
Ove
rall
972
396
2.33
1.79
1.73
2,20
01,
853
625
4,67
8
Pan
elB
:Is
suer
Rat
ing
#Is
sues
wit
hP
rice
Ava
ilabi
lity
#W
eekl
yO
bser
vati
ons
(Bon
dP
rice
s)Is
suer
Rat
ing
Pub
licM
ortg
age
Pub
licM
ortg
age
subp
rim
epo
st-
Jum
boJu
mbo
Tra
diti
onal
Tra
diti
onal
all
pre-
cris
iscr
isis
Leh
man
all
AA
A17
079
5314
920
00
20A
A12
78
913
276
1,32
467
275
926
71,
698
A29
867
526
424
1,31
51,
288
1,02
833
92,
655
BB
B87
1510
299
303
153
3115
199
BB
287
3619
9040
200
60N
oR
atin
g9
17
1431
2715
446
37

Table 5: Descriptive Statistics for Yield Spreads (Weekly Data)
This table shows the summary statistics for the Pfandbrief yield spreads relative to theterm structure of public Jumbo Pfandbriefe in basis points. The statistics are basedon the equally weighted yield spread observations in the respective Pfandbrief segmentand time period (winsorized at the 0.5th and 99.5th percentiles). N is the number ofweekly observations. The sample period ranges from January 2000 to January 2009(Panel A) and is partitioned into the pre-crisis period (January 2000 to June 2007, PanelB), the period of the subprime crisis (July 2007 to September 2008, Panel C), and thepost-Lehman period (September 2008 to January 2009, Panel D).
Panel A: Total Sample
Pfandbrief Segment MeanStd.
Min. Median Max. % > 0 NDev.
Public Jumbo Pfandbrief 0.0 7.2 -48.3 -0.2 191.5 46.3% 82,640Mortgage Jumbo Pfandbrief 2.6 8.5 -41.3 1.3 120.6 68.6% 17,600Public Traditional Pfandbrief 5.5 13.9 -61.9 5.4 187.5 77.0% 49,046Mortgage Traditional Pfandbrief 6.3 11.3 -36.2 6.1 195.9 81.9% 32,701
Panel B: Pre-Crisis Period
Pfandbrief Segment MeanStd.
Min. Median Max. % > 0 NDev.
Public Jumbo Pfandbrief 0.0 3.5 -9.4 -0.2 15.0 46.9% 72,546Mortgage Jumbo Pfandbrief 2.1 4.5 -7.6 1.2 21.4 68.3% 13,932Public Traditional Pfandbrief 2.9 9.9 -61.9 4.6 31.9 74.6% 40,725Mortgage Traditional Pfandbrief 5.4 9.4 -33.1 5.9 63.0 81.7% 29,663
Panel C: Subprime Crisis
Pfandbrief Segment MeanStd.
Min. Median Max. % > 0 NDev.
Public Jumbo Pfandbrief 0.0 4.9 -12.3 -0.4 22.4 45.6% 7,996Mortgage Jumbo Pfandbrief 4.0 5.8 -7.0 2.7 22.6 77.1% 2,862Public Traditional Pfandbrief 14.4 13.1 -30.0 14.0 48.1 89.9% 6,992Mortgage Traditional Pfandbrief 11.6 13.8 -27.7 11.2 52.4 84.7% 2,527
Panel D: Post-Lehman Period
Pfandbrief Segment MeanStd.
Min. Median Max. % > 0 NDev.
Public Jumbo Pfandbrief -0.1 39.4 -48.3 -11.0 191.5 27.4% 2,098Mortgage Jumbo Pfandbrief 5.8 32.6 -41.3 -2.7 120.6 43.1% 806Public Traditional Pfandbrief 38.2 39.4 -42.7 41.8 187.5 82.8% 1,329Mortgage Traditional Pfandbrief 30.0 36.9 -36.2 26.9 195.9 79.3% 511
38
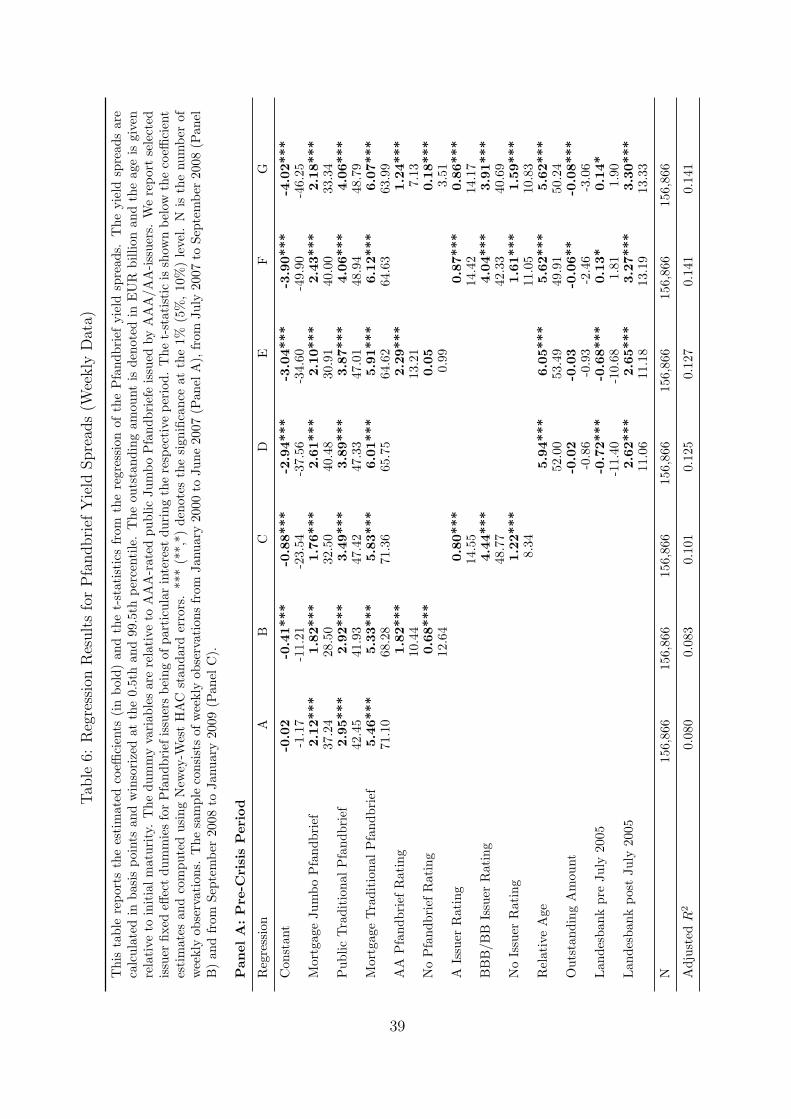
Tab
le6:
Reg
ress
ion
Res
ult
sfo
rP
fandbri
efY
ield
Spre
ads
(Wee
kly
Dat
a)
Thi
sta
ble
repo
rts
the
esti
mat
edco
effici
ents
(in
bold
)an
dth
et-
stat
isti
csfr
omth
ere
gres
sion
ofth
eP
fand
brie
fyi
eld
spre
ads.
The
yiel
dsp
read
sar
eca
lcul
ated
inba
sis
poin
tsan
dw
inso
rize
dat
the
0.5t
han
d99
.5th
perc
enti
le.
The
outs
tand
ing
amou
ntis
deno
ted
inE
UR
billi
onan
dth
eag
eis
give
nre
lati
veto
init
ialm
atur
ity.
The
dum
my
vari
able
sar
ere
lati
veto
AA
A-r
ated
publ
icJu
mbo
Pfa
ndbr
iefe
issu
edby
AA
A/A
A-i
ssue
rs.
We
repo
rtse
lect
edis
suer
fixed
effec
tdu
mm
ies
for
Pfa
ndbr
iefi
ssue
rsbe
ing
ofpa
rtic
ular
inte
rest
duri
ngth
ere
spec
tive
peri
od.
The
t-st
atis
tic
issh
own
belo
wth
eco
effici
ent
esti
mat
esan
dco
mpu
ted
usin
gN
ewey
-Wes
tH
AC
stan
dard
erro
rs.
***
(**,
*)de
note
sth
esi
gnifi
canc
eat
the
1%(5
%,
10%
)le
vel.
Nis
the
num
ber
ofw
eekl
yob
serv
atio
ns.
The
sam
ple
cons
ists
ofw
eekl
yob
serv
atio
nsfr
omJa
nuar
y20
00to
June
2007
(Pan
elA
),fr
omJu
ly20
07to
Sept
embe
r20
08(P
anel
B)
and
from
Sept
embe
r20
08to
Janu
ary
2009
(Pan
elC
).
Pan
elA
:P
re-C
risi
sPer
iod
Reg
ress
ion
AB
CD
EF
G
Con
stan
t-0
.02
-0.4
1***
-0.8
8***
-2.9
4***
-3.0
4***
-3.9
0***
-4.0
2***
-1.1
7-1
1.21
-23.
54-3
7.56
-34.
60-4
9.90
-46.
25M
ortg
age
Jum
boP
fand
brie
f2.
12**
*1.
82**
*1.
76**
*2.
61**
*2.
10**
*2.
43**
*2.
18**
*37
.24
28.5
032
.50
40.4
830
.91
40.0
033
.34
Pub
licT
radi
tion
alP
fand
brie
f2.
95**
*2.
92**
*3.
49**
*3.
89**
*3.
87**
*4.
06**
*4.
06**
*42
.45
41.9
347
.42
47.3
347
.01
48.9
448
.79
Mor
tgag
eT
radi
tion
alP
fand
brie
f5.
46**
*5.
33**
*5.
83**
*6.
01**
*5.
91**
*6.
12**
*6.
07**
*71
.10
68.2
871
.36
65.7
564
.62
64.6
363
.99
AA
Pfa
ndbr
ief
Rat
ing
1.82
***
2.29
***
1.24
***
10.4
413
.21
7.13
No
Pfa
ndbr
ief
Rat
ing
0.68
***
0.05
0.18
***
12.6
40.
993.
51A
Issu
erR
atin
g0.
80**
*0.
87**
*0.
86**
*14
.55
14.4
214
.17
BB
B/B
BIs
suer
Rat
ing
4.44
***
4.04
***
3.91
***
48.7
742
.33
40.6
9N
oIs
suer
Rat
ing
1.22
***
1.61
***
1.59
***
8.34
11.0
510
.83
Rel
ativ
eA
ge5.
94**
*6.
05**
*5.
62**
*5.
62**
*52
.00
53.4
949
.91
50.2
4O
utst
andi
ngA
mou
nt-0
.02
-0.0
3-0
.06*
*-0
.08*
**-0
.86
-0.9
3-2
.46
-3.0
6L
ande
sban
kpr
eJu
ly20
05-0
.72*
**-0
.68*
**0.
13*
0.14
*-1
1.40
-10.
681.
811.
90L
ande
sban
kpo
stJu
ly20
052.
62**
*2.
65**
*3.
27**
*3.
30**
*11
.06
11.1
813
.19
13.3
3
N15
6,86
615
6,86
615
6,86
615
6,86
615
6,86
615
6,86
615
6,86
6
Adj
uste
dR
20.
080
0.08
30.
101
0.12
50.
127
0.14
10.
141
39

Tab
le6
cont
inue
d.
Pan
elB
:Subpri
me
Cri
sis
Reg
ress
ion
AB
CD
EF
G
Con
stan
t-0
.02
-0.4
5***
1.33
***
-4.0
0***
-4.4
6***
-4.3
3***
-4.8
7***
-0.2
0-5
.05
7.47
-13.
24-1
4.73
-11.
14-1
2.39
Mor
tgag
eJu
mbo
Pfa
ndbr
ief
4.04
***
1.99
***
4.14
***
5.15
***
3.15
***
4.92
***
3.09
***
23.6
08.
1726
.05
25.5
112
.23
26.7
412
.74
Pub
licT
radi
tion
alP
fand
brie
f14
.43*
**14
.03*
**14
.03*
**9.
84**
*9.
76**
*10
.27*
**10
.17*
**63
.40
59.9
259
.03
32.6
632
.74
35.1
335
.13
Mor
tgag
eT
radi
tion
alP
fand
brie
f11
.59*
**10
.85*
**11
.92*
**8.
67**
*7.
80**
*8.
90**
*8.
04**
*30
.24
29.0
831
.55
21.2
519
.41
22.1
620
.31
AA
Pfa
ndbr
ief
Rat
ing
4.95
***
4.56
***
4.23
***
12.3
312
.62
11.9
0N
oP
fand
brie
fR
atin
g2.
32**
*-1
.33*
**-1
.55*
**9.
90-5
.29
-6.0
8A
Issu
erR
atin
g-2
.68*
**0.
000.
00-1
1.87
-0.0
10.
00B
BB
/BB
Issu
erR
atin
g5.
99**
*7.
64**
*7.
40**
*15
.41
16.6
316
.06
No
Issu
erR
atin
g-1
.90*
**2.
01**
*3.
24**
*-3
.98
3.60
5.70
Rel
ativ
eA
ge11
.42*
**12
.81*
**10
.91*
**12
.51*
**30
.42
29.7
429
.22
28.4
1O
utst
andi
ngA
mou
nt-1
.84*
**-1
.87*
**-1
.84*
**-1
.88*
**-1
2.86
-13.
24-1
4.71
-15.
09L
ande
sban
kpr
eJu
ly20
051.
55**
*1.
36**
*1.
96**
*1.
80**
*5.
324.
875.
595.
26L
ande
sban
kpo
stJu
ly20
054.
00**
*4.
12**
*4.
25**
*4.
43**
*15
.19
15.7
012
.46
12.9
5
N20
,377
20,3
7720
,377
20,3
7720
,377
20,3
7720
,377
Adj
uste
dR
20.
302
0.31
70.
332
0.37
10.
382
0.38
90.
400
40
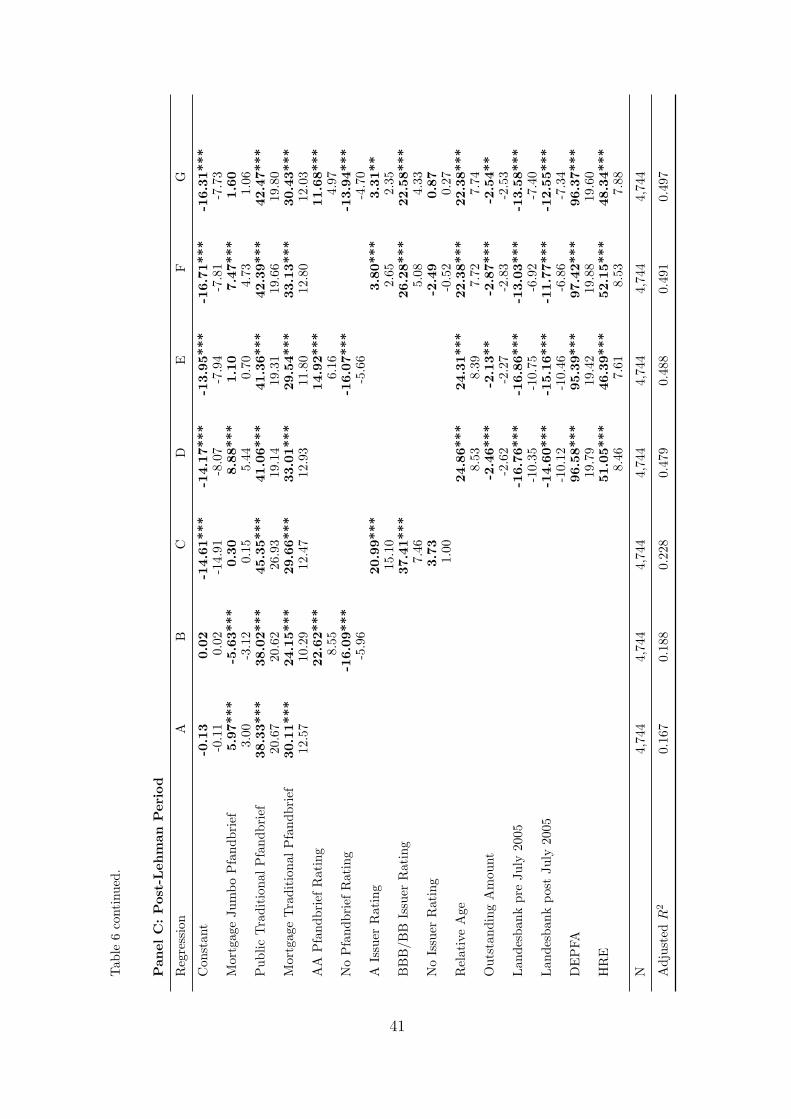
Tab
le6
cont
inue
d.
Pan
elC
:Pos
t-Leh
man
Per
iod
Reg
ress
ion
AB
CD
EF
G
Con
stan
t-0
.13
0.02
-14.
61**
*-1
4.17
***
-13.
95**
*-1
6.71
***
-16.
31**
*-0
.11
0.02
-14.
91-8
.07
-7.9
4-7
.81
-7.7
3M
ortg
age
Jum
boP
fand
brie
f5.
97**
*-5
.63*
**0.
308.
88**
*1.
107.
47**
*1.
603.
00-3
.12
0.15
5.44
0.70
4.73
1.06
Pub
licT
radi
tion
alP
fand
brie
f38
.33*
**38
.02*
**45
.35*
**41
.06*
**41
.36*
**42
.39*
**42
.47*
**20
.67
20.6
226
.93
19.1
419
.31
19.6
619
.80
Mor
tgag
eT
radi
tion
alP
fand
brie
f30
.11*
**24
.15*
**29
.66*
**33
.01*
**29
.54*
**33
.13*
**30
.43*
**12
.57
10.2
912
.47
12.9
311
.80
12.8
012
.03
AA
Pfa
ndbr
ief
Rat
ing
22.6
2***
14.9
2***
11.6
8***
8.55
6.16
4.97
No
Pfa
ndbr
ief
Rat
ing
-16.
09**
*-1
6.07
***
-13.
94**
*-5
.96
-5.6
6-4
.70
AIs
suer
Rat
ing
20.9
9***
3.80
***
3.31
**15
.10
2.65
2.35
BB
B/B
BIs
suer
Rat
ing
37.4
1***
26.2
8***
22.5
8***
7.46
5.08
4.33
No
Issu
erR
atin
g3.
73-2
.49
0.87
1.00
-0.5
20.
27R
elat
ive
Age
24.8
6***
24.3
1***
22.3
8***
22.3
8***
8.53
8.39
7.72
7.74
Out
stan
ding
Am
ount
-2.4
6***
-2.1
3**
-2.8
7***
-2.5
4**
-2.6
2-2
.27
-2.8
3-2
.53
Lan
desb
ank
pre
July
2005
-16.
76**
*-1
6.86
***
-13.
03**
*-1
3.58
***
-10.
35-1
0.75
-6.9
2-7
.40
Lan
desb
ank
post
July
2005
-14.
60**
*-1
5.16
***
-11.
77**
*-1
2.55
***
-10.
12-1
0.46
-6.8
6-7
.34
DE
PFA
96.5
8***
95.3
9***
97.4
2***
96.3
7***
19.7
919
.42
19.8
819
.60
HR
E51
.05*
**46
.39*
**52
.15*
**48
.34*
**8.
467.
618.
537.
88
N4,
744
4,74
44,
744
4,74
44,
744
4,74
44,
744
Adj
uste
dR
20.
167
0.18
80.
228
0.47
90.
488
0.49
10.
497
41
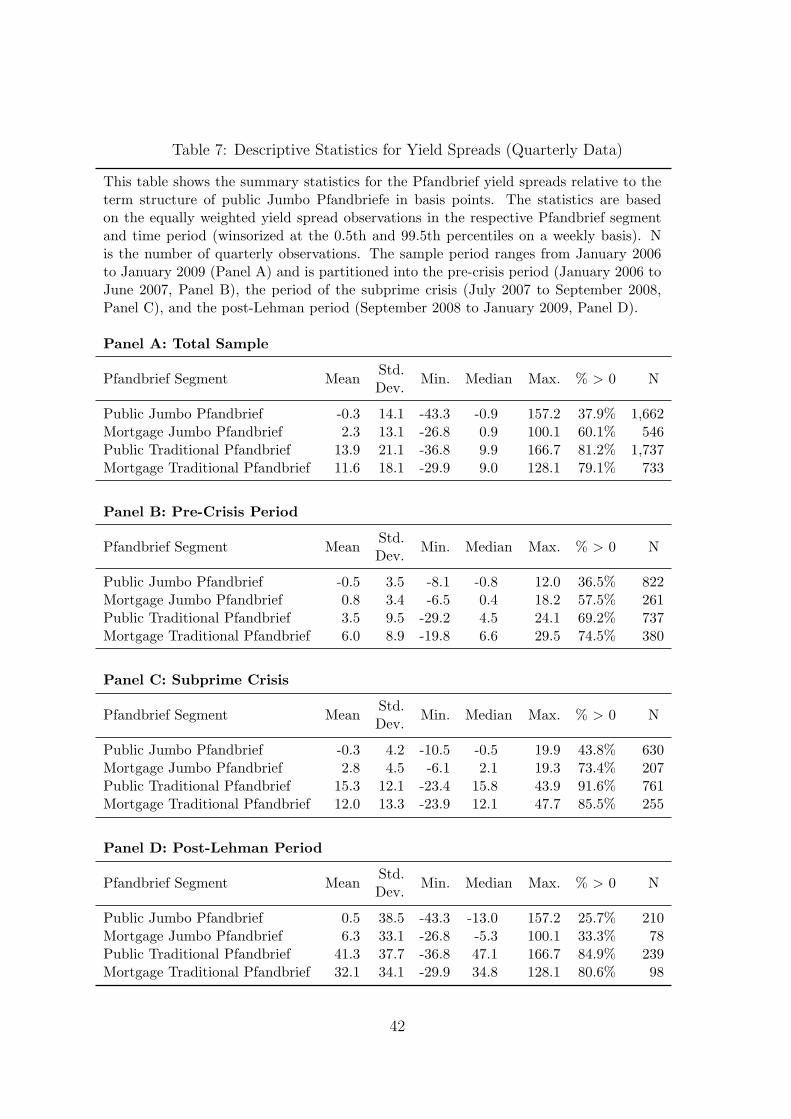
Table 7: Descriptive Statistics for Yield Spreads (Quarterly Data)
This table shows the summary statistics for the Pfandbrief yield spreads relative to theterm structure of public Jumbo Pfandbriefe in basis points. The statistics are basedon the equally weighted yield spread observations in the respective Pfandbrief segmentand time period (winsorized at the 0.5th and 99.5th percentiles on a weekly basis). Nis the number of quarterly observations. The sample period ranges from January 2006to January 2009 (Panel A) and is partitioned into the pre-crisis period (January 2006 toJune 2007, Panel B), the period of the subprime crisis (July 2007 to September 2008,Panel C), and the post-Lehman period (September 2008 to January 2009, Panel D).
Panel A: Total Sample
Pfandbrief Segment MeanStd.
Min. Median Max. % > 0 NDev.
Public Jumbo Pfandbrief -0.3 14.1 -43.3 -0.9 157.2 37.9% 1,662Mortgage Jumbo Pfandbrief 2.3 13.1 -26.8 0.9 100.1 60.1% 546Public Traditional Pfandbrief 13.9 21.1 -36.8 9.9 166.7 81.2% 1,737Mortgage Traditional Pfandbrief 11.6 18.1 -29.9 9.0 128.1 79.1% 733
Panel B: Pre-Crisis Period
Pfandbrief Segment MeanStd.
Min. Median Max. % > 0 NDev.
Public Jumbo Pfandbrief -0.5 3.5 -8.1 -0.8 12.0 36.5% 822Mortgage Jumbo Pfandbrief 0.8 3.4 -6.5 0.4 18.2 57.5% 261Public Traditional Pfandbrief 3.5 9.5 -29.2 4.5 24.1 69.2% 737Mortgage Traditional Pfandbrief 6.0 8.9 -19.8 6.6 29.5 74.5% 380
Panel C: Subprime Crisis
Pfandbrief Segment MeanStd.
Min. Median Max. % > 0 NDev.
Public Jumbo Pfandbrief -0.3 4.2 -10.5 -0.5 19.9 43.8% 630Mortgage Jumbo Pfandbrief 2.8 4.5 -6.1 2.1 19.3 73.4% 207Public Traditional Pfandbrief 15.3 12.1 -23.4 15.8 43.9 91.6% 761Mortgage Traditional Pfandbrief 12.0 13.3 -23.9 12.1 47.7 85.5% 255
Panel D: Post-Lehman Period
Pfandbrief Segment MeanStd.
Min. Median Max. % > 0 NDev.
Public Jumbo Pfandbrief 0.5 38.5 -43.3 -13.0 157.2 25.7% 210Mortgage Jumbo Pfandbrief 6.3 33.1 -26.8 -5.3 100.1 33.3% 78Public Traditional Pfandbrief 41.3 37.7 -36.8 47.1 166.7 84.9% 239Mortgage Traditional Pfandbrief 32.1 34.1 -29.9 34.8 128.1 80.6% 98
42

Tab
le8:
Reg
ress
ion
Res
ult
sfo
rP
fandbri
efY
ield
Spre
ads
(Quar
terl
yD
ata)
Thi
sta
ble
repo
rts
the
esti
mat
edco
effici
ents
(in
bold
)an
dth
et-
stat
isti
csfr
omth
ere
gres
sion
ofth
eP
fand
brie
fyi
eld
spre
ads.
The
yiel
dsp
read
sar
eca
lcul
ated
inba
sis
poin
tsan
dw
inso
rize
dat
the
0.5t
han
d99
.5th
perc
enti
leon
aw
eekl
yba
sis.
The
outs
tand
ing
amou
ntis
deno
ted
inE
UR
billi
onan
dth
eag
eis
give
nre
lati
veto
init
ial
mat
urit
y.T
hedu
mm
yva
riab
les
are
rela
tive
toA
AA
-rat
edpu
blic
Jum
boP
fand
brie
feis
sued
byA
AA
/AA
-iss
uers
.W
ere
port
sele
cted
issu
erfix
edeff
ect
dum
mie
sfo
rP
fand
brie
fis
suer
sbe
ing
ofpa
rtic
ular
inte
rest
duri
ngth
ere
spec
tive
peri
od.
The
t-st
atis
tic
issh
own
belo
wth
eco
effici
ent
esti
mat
esan
dco
mpu
ted
usin
gN
ewey
-Wes
tH
AC
stan
dard
erro
rs.
***
(**,
*)de
note
sth
esi
gnifi
canc
eat
the
1%(5
%,1
0%)
leve
l.N
isth
enu
mbe
rof
quar
terl
yob
serv
atio
ns.
The
sam
ple
cons
ists
ofqu
arte
rly
obse
rvat
ions
from
Janu
ary
2006
toJu
ne20
07(P
anel
A),
from
July
2007
toSe
ptem
ber
2008
(Pan
elB
)an
dfr
omSe
ptem
ber
2008
toJa
nuar
y20
09(P
anel
C).
Pan
elA
:P
re-C
risi
sPer
iod
Reg
ress
ion
AB
CD
EF
G
Con
stan
t-0
.52*
**-1
.15*
**-0
.09
-2.5
3***
-2.6
2***
-3.7
1***
-3.7
6***
-3.2
2-5
.20
-0.2
6-4
.16
-4.3
2-5
.32
-5.4
4M
ortg
age
Jum
boP
fand
brie
f1.
31**
*0.
73**
1.62
***
2.34
***
1.46
***
2.42
***
1.64
***
4.27
2.22
5.09
5.73
3.53
6.03
3.89
Pub
licT
radi
tion
alP
fand
brie
f4.
03**
*3.
84**
*4.
06**
*2.
04**
*2.
12**
*2.
74**
*2.
77**
*8.
768.
388.
883.
473.
674.
754.
88M
ortg
age
Tra
diti
onal
Pfa
ndbr
ief
6.52
***
6.24
***
6.64
***
4.90
***
4.83
***
5.16
***
5.03
***
11.0
710
.57
11.6
47.
217.
107.
857.
64A
AP
fand
brie
fR
atin
g2.
29**
*2.
47**
*2.
18**
*3.
493.
683.
25N
oP
fand
brie
fR
atin
g1.
56**
*-0
.81*
-0.8
3*4.
03-1
.80
-1.8
4A
Issu
erR
atin
g-1
.40*
**0.
280.
33-3
.27
0.58
0.68
BB
B/B
BIs
suer
Rat
ing
2.74
***
3.09
***
2.80
***
4.11
4.71
4.27
No
Issu
erR
atin
g6.
23**
*8.
54**
*8.
92**
*3.
985.
185.
20R
elat
ive
Age
7.83
***
8.78
***
7.74
***
8.73
***
11.4
510
.01
11.4
39.
87O
utst
andi
ngA
mou
nt-1
.50*
**-1
.55*
**-1
.19*
**-1
.27*
**-5
.77
-5.9
6-4
.59
-4.8
2L
ande
sban
kpr
eJu
ly20
05-0
.12
-0.2
30.
340.
23-0
.27
-0.5
20.
650.
45L
ande
sban
kpo
stJu
ly20
053.
86**
*3.
88**
*4.
24**
*4.
28**
*6.
076.
065.
735.
74
N2,
200
2,20
02,
200
2,20
02,
200
2,20
02,
200
Adj
uste
dR
20.
108
0.11
90.
143
0.21
40.
220
0.23
70.
243
43
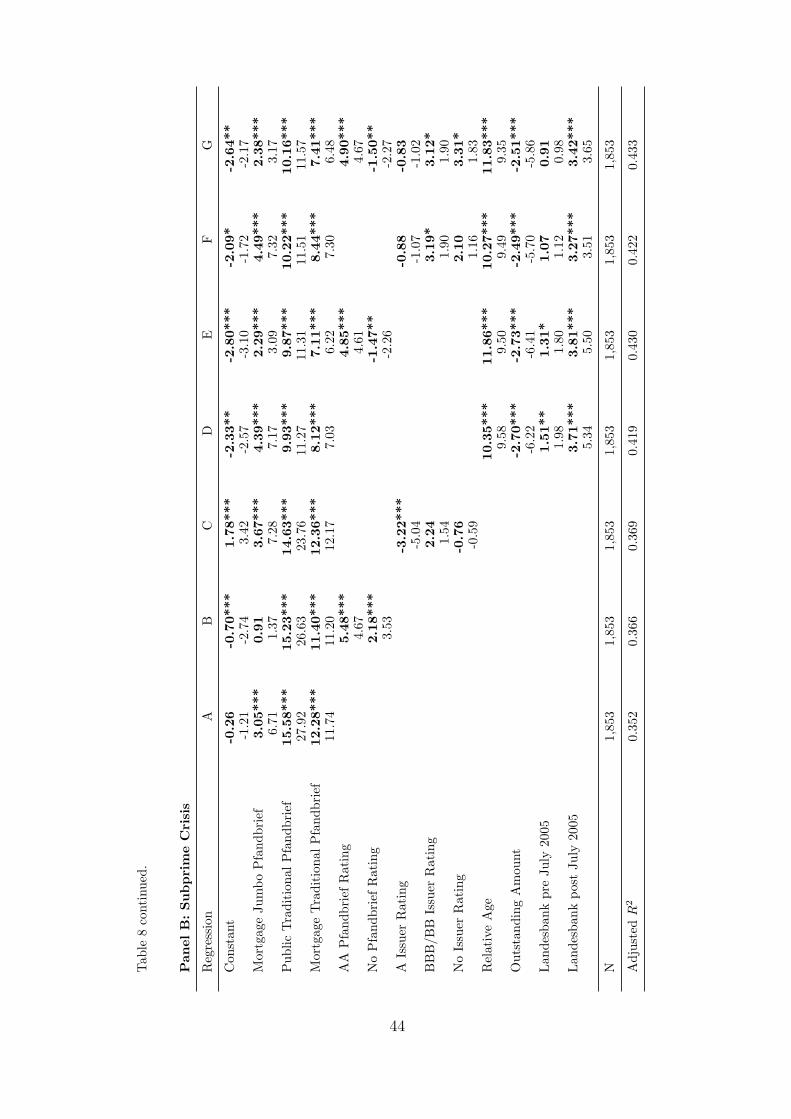
Tab
le8
cont
inue
d.
Pan
elB
:Subpri
me
Cri
sis
Reg
ress
ion
AB
CD
EF
G
Con
stan
t-0
.26
-0.7
0***
1.78
***
-2.3
3**
-2.8
0***
-2.0
9*-2
.64*
*-1
.21
-2.7
43.
42-2
.57
-3.1
0-1
.72
-2.1
7M
ortg
age
Jum
boP
fand
brie
f3.
05**
*0.
913.
67**
*4.
39**
*2.
29**
*4.
49**
*2.
38**
*6.
711.
377.
287.
173.
097.
323.
17P
ublic
Tra
diti
onal
Pfa
ndbr
ief
15.5
8***
15.2
3***
14.6
3***
9.93
***
9.87
***
10.2
2***
10.1
6***
27.9
226
.63
23.7
611
.27
11.3
111
.51
11.5
7M
ortg
age
Tra
diti
onal
Pfa
ndbr
ief
12.2
8***
11.4
0***
12.3
6***
8.12
***
7.11
***
8.44
***
7.41
***
11.7
411
.20
12.1
77.
036.
227.
306.
48A
AP
fand
brie
fR
atin
g5.
48**
*4.
85**
*4.
90**
*4.
674.
614.
67N
oP
fand
brie
fR
atin
g2.
18**
*-1
.47*
*-1
.50*
*3.
53-2
.26
-2.2
7A
Issu
erR
atin
g-3
.22*
**-0
.88
-0.8
3-5
.04
-1.0
7-1
.02
BB
B/B
BIs
suer
Rat
ing
2.24
3.19
*3.
12*
1.54
1.90
1.90
No
Issu
erR
atin
g-0
.76
2.10
3.31
*-0
.59
1.16
1.83
Rel
ativ
eA
ge10
.35*
**11
.86*
**10
.27*
**11
.83*
**9.
589.
509.
499.
35O
utst
andi
ngA
mou
nt-2
.70*
**-2
.73*
**-2
.49*
**-2
.51*
**-6
.22
-6.4
1-5
.70
-5.8
6L
ande
sban
kpr
eJu
ly20
051.
51**
1.31
*1.
070.
911.
981.
801.
120.
98L
ande
sban
kpo
stJu
ly20
053.
71**
*3.
81**
*3.
27**
*3.
42**
*5.
345.
503.
513.
65
N1,
853
1,85
31,
853
1,85
31,
853
1,85
31,
853
Adj
uste
dR
20.
352
0.36
60.
369
0.41
90.
430
0.42
20.
433
44

Tab
le8
cont
inue
d.
Pan
elC
:Pos
t-Leh
man
Per
iod
Reg
ress
ion
AB
CD
EF
G
Con
stan
t0.
470.
69-1
3.94
***
-16.
48**
*-1
6.05
***
-18.
93**
*-1
8.72
***
0.14
0.21
-5.1
0-4
.07
-3.9
5-3
.98
-4.0
2M
ortg
age
Jum
boP
fand
brie
f5.
86-7
.74
-0.0
49.
76**
0.15
8.51
**0.
531.
03-1
.52
-0.0
12.
120.
042.
030.
14P
ublic
Tra
diti
onal
Pfa
ndbr
ief
40.8
1***
40.5
1***
48.4
2***
45.4
9***
45.8
7***
48.2
3***
48.4
6***
9.40
9.47
12.7
410
.57
10.7
611
.75
11.9
5M
ortg
age
Tra
diti
onal
Pfa
ndbr
ief
31.6
6***
24.6
5***
29.8
6***
34.8
2***
30.5
4***
36.5
0***
32.8
0***
6.27
4.94
6.09
6.99
6.17
7.47
6.79
AA
Pfa
ndbr
ief
Rat
ing
28.2
2***
19.2
0***
16.3
5***
4.14
3.52
3.29
No
Pfa
ndbr
ief
Rat
ing
-22.
61**
*-2
1.92
***
-19.
40**
-2.7
4-2
.77
-2.4
1A
Issu
erR
atin
g20
.71*
**0.
540.
646.
320.
150.
19B
BB
/BB
Issu
erR
atin
g55
.98*
**41
.76*
**38
.14*
**3.
922.
902.
72N
oIs
suer
Rat
ing
-7.7
6-1
8.26
-8.0
0-0
.68
-1.2
2-0
.77
Rel
ativ
eA
ge29
.26*
**28
.80*
**27
.30*
**27
.14*
**4.
804.
854.
614.
66O
utst
andi
ngA
mou
nt-2
.27
-1.8
4-1
.35
-0.9
9-1
.19
-0.9
7-0
.73
-0.5
4L
ande
sban
kpr
eJu
ly20
05-2
1.41
***
-21.
53**
*-1
9.91
***
-19.
94**
*-5
.85
-6.2
0-4
.52
-4.7
6L
ande
sban
kpo
stJu
ly20
05-1
7.31
***
-18.
39**
*-1
6.06
***
-16.
90**
*-5
.52
-5.7
6-3
.98
-4.2
2D
EP
FA10
3.15
***
100.
48**
*10
4.04
***
101.
72**
*20
.05
19.1
220
.74
20.0
5H
RE
40.2
5***
32.9
0**
41.8
7***
35.5
0***
3.28
2.58
3.38
2.79
N62
562
562
562
562
562
562
5
Adj
uste
dR
20.
199
0.23
40.
272
0.52
80.
546
0.55
10.
563
45

Tab
le9:
Reg
ress
ion
Res
ult
sfo
rP
fandbri
efY
ield
Spre
ads
onC
over
Pool
Var
iable
s(Q
uar
terl
yD
ata)
Thi
sta
ble
repo
rts
the
esti
mat
edco
effici
ents
(in
bold
)an
dth
et-
stat
isti
csfr
omth
ere
gres
sion
ofth
eP
fand
brie
fyi
eld
spre
ads.
The
yiel
dsp
read
sar
eca
lcul
ated
inba
sis
poin
tsan
dw
inso
rize
dat
the
0.5t
han
d99
.5th
perc
enti
leon
aw
eekl
yba
sis.
The
outs
tand
ing
amou
ntis
deno
ted
inE
UR
billi
onan
dth
eag
eis
give
nre
lati
veto
init
ial
mat
urit
y.T
hedu
mm
yva
riab
les
are
rela
tive
toA
AA
-rat
edpu
blic
Jum
boP
fand
brie
feis
sued
byA
AA
/AA
-iss
uers
.W
ere
port
sele
cted
issu
erfix
edeff
ect
dum
mie
sfo
rP
fand
brie
fis
suer
sbe
ing
ofpa
rtic
ular
inte
rest
duri
ngth
ere
spec
tive
peri
od.
The
t-st
atis
tic
issh
own
belo
wth
eco
effici
ent
esti
mat
esan
dco
mpu
ted
usin
gN
ewey
-Wes
tH
AC
stan
dard
erro
rs.
***
(**,
*)de
note
sth
esi
gnifi
canc
eat
the
1%(5
%,1
0%)
leve
l.N
isth
enu
mbe
rof
quar
terl
yob
serv
atio
ns.
The
sam
ple
cons
ists
ofqu
arte
rly
obse
rvat
ions
from
Janu
ary
2006
toJu
ne20
07(P
anel
A),
from
July
2007
toSe
ptem
ber
2008
(Pan
elB
)an
dfr
omSe
ptem
ber
2008
toJa
nuar
y20
09(P
anel
C).
Pan
elA
:P
re-C
risi
sPer
iod
Reg
ress
ion
AB
CD
EF
GH
I
OC
-0.2
2*0.
10-0
.27*
*-1
.82
0.93
-2.1
4|T
RA
NS|(
year
s)0.
040.
390.
040.
171.
420.
16PB
DU
E2.
88-2
.75
2.02
1.18
-0.9
30.
76C
LD
UE
1.42
3.37
*1.
000.
911.
790.
60G
ER
M1.
368.
21**
*2.
51*
1.21
5.16
1.84
SMA
LL
-1.1
71.
42-2
.61*
-0.9
51.
60-1
.75
Con
stan
t-3
.71*
**-3
.79*
**-3
.82*
**-4
.26*
**-3
.99*
**-4
.89*
**-3
.76*
**-5
.72*
**-6
.32*
**-5
.32
-5.3
9-5
.28
-5.4
4-5
.24
-4.7
9-5
.39
-3.7
4-5
.10
Mor
tgag
eJu
mbo
Pfa
ndbr
ief
2.42
***
2.49
***
2.47
***
2.53
***
2.44
***
2.33
***
2.96
***
3.42
***
6.03
6.13
6.05
6.24
6.02
5.46
4.36
4.49
Pub
licT
radi
tion
alP
fand
brie
f2.
74**
*2.
73**
*2.
73**
*2.
73**
*2.
75**
*2.
76**
*2.
75**
*2.
82**
*4.
754.
734.
724.
764.
734.
834.
764.
99M
ortg
age
Tra
diti
onal
Pfa
ndbr
ief
5.16
***
5.39
***
5.24
***
5.26
***
5.21
***
5.16
***
5.79
***
6.50
***
7.85
7.79
7.77
7.82
7.74
7.55
6.33
6.71
AIs
suer
Rat
ing
0.28
0.27
0.29
0.31
0.24
0.28
0.33
0.19
0.58
0.53
0.58
0.61
0.49
0.57
0.69
0.38
BB
B/B
BIs
suer
Rat
ing
3.09
***
3.07
***
3.07
***
3.00
***
2.96
***
3.07
***
3.08
***
2.73
***
4.71
4.56
4.52
4.47
4.30
4.60
4.62
3.89
No
Issu
erR
atin
g8.
54**
*8.
80**
*8.
84**
*9.
06**
*8.
78**
*8.
76**
*8.
58**
*7.
88**
*5.
185.
004.
934.
934.
974.
984.
874.
32R
elat
ive
Age
7.74
***
7.83
***
7.84
***
7.78
***
7.80
***
7.83
***
7.75
***
7.75
***
11.4
311
.36
11.3
811
.29
11.3
011
.36
11.4
111
.24
Out
stan
ding
Am
ount
-1.1
9***
-1.1
8***
-1.1
9***
-1.2
1***
-1.2
3***
-1.1
6***
-1.1
9***
-1.1
3***
-4.5
9-4
.52
-4.5
8-4
.64
-4.7
0-4
.58
-4.5
7-4
.51
Lan
desb
ank
pre
July
2005
0.34
0.55
0.42
0.41
0.42
0.20
0.40
0.11
0.65
0.98
0.76
0.75
0.77
0.34
0.75
0.17
Lan
desb
ank
post
July
2005
4.24
***
4.32
***
4.26
***
4.27
***
4.24
***
4.05
***
4.28
***
3.87
***
5.73
5.68
5.58
5.64
5.58
5.11
5.72
4.80
N2,
200
2,17
62,
176
2,17
62,
176
2,17
62,
183
2,17
62,
176
Adj
uste
dR
20.
237
0.24
00.
239
0.24
00.
240
0.24
00.
237
0.02
60.
241
46

Tab
le9
cont
inue
d.
Pan
elB
:Subpri
me
Cri
sis
Reg
ress
ion
AB
CD
EF
GH
I
OC
-0.1
00.
59-0
.10
-0.3
31.
10-0
.37
|TR
AN
S|(
year
s)1.
01**
1.45
***
0.89
**2.
342.
762.
03PB
DU
E11
.57*
**18
.82*
**11
.57*
*2.
633.
092.
28C
LD
UE
0.93
-10.
02**
*-2
.50
0.42
-3.6
4-0
.93
GER
M-1
.53
9.76
***
-1.0
9-0
.92
4.13
-0.5
6SM
ALL
-3.5
8*-3
.42*
*-3
.96*
-1.8
3-2
.10
-1.6
7C
onst
ant
-2.0
9*-2
.10*
-3.0
4**
-3.9
1***
-2.2
0*-0
.83
-2.1
2*-2
.55
-3.5
9*-1
.72
-1.7
3-2
.41
-2.7
8-1
.74
-0.4
6-1
.75
-1.1
3-1
.77
Mor
tgag
eJu
mbo
Pfa
ndbr
ief
4.49
***
4.48
***
4.37
***
4.58
***
4.43
***
4.60
***
5.84
***
6.22
***
7.32
7.28
7.10
7.28
7.18
7.18
5.89
5.44
Pub
licT
radi
tion
alP
fand
brie
f10
.22*
**10
.22*
**10
.17*
**10
.06*
**10
.21*
**10
.20*
**10
.33*
**10
.13*
**11
.51
11.5
211
.53
11.3
911
.49
11.4
011
.56
11.4
9M
ortg
age
Tra
diti
onal
Pfa
ndbr
ief
8.44
***
8.51
***
8.30
***
8.47
***
8.40
***
8.55
***
10.1
4***
10.5
0***
7.30
7.13
7.21
7.25
7.24
7.30
6.66
6.14
AIs
suer
Rat
ing
-0.8
8-0
.89
-0.9
3-1
.08
-0.9
8-0
.98
-0.9
6-1
.03
-1.0
7-1
.08
-1.1
4-1
.32
-1.1
8-1
.18
-1.1
7-1
.28
BB
B/B
BIs
suer
Rat
ing
3.19
*3.
18*
3.20
*2.
81*
3.16
*3.
12*
3.40
**3.
08*
1.90
1.90
1.96
1.69
1.88
1.85
2.03
1.88
No
Issu
erR
atin
g2.
102.
091.
611.
941.
942.
311.
581.
521.
161.
160.
900.
931.
041.
280.
850.
72R
elat
ive
Age
10.2
7***
10.2
8***
10.3
9***
10.0
2***
10.2
4***
10.2
8***
10.2
9***
10.2
3***
9.49
9.47
9.59
9.18
9.28
9.47
9.47
9.28
Out
stan
ding
Am
ount
-2.4
9***
-2.4
8***
-2.4
7***
-2.5
5***
-2.5
1***
-2.5
2***
-2.4
3***
-2.4
2***
-5.7
0-5
.69
-5.6
9-5
.86
-5.7
6-5
.74
-5.5
2-5
.59
Lan
desb
ank
pre
July
2005
1.07
1.11
0.98
0.71
1.06
1.28
0.93
0.70
1.12
1.16
1.05
0.77
1.11
1.30
0.98
0.72
Lan
desb
ank
post
July
2005
3.27
***
3.29
***
3.16
***
2.94
***
3.26
***
3.47
***
3.13
***
2.87
***
3.51
3.51
3.44
3.18
3.50
3.63
3.34
2.98
N1,
853
1,85
21,
852
1,85
21,
852
1,85
21,
852
1,85
21,
852
Adj
uste
dR
20.
422
0.42
20.
425
0.42
60.
422
0.42
20.
423
0.06
30.
429
47

Tab
le9
cont
inue
d.
Pan
elC
:Pos
t-Leh
man
Per
iod
Reg
ress
ion
AB
CD
EF
GH
I
OC
-3.0
0-2
.92
-2.6
9-0
.38
-0.3
0-0
.34
|TR
AN
S|(
year
s)6.
49**
12.4
0***
10.3
6***
2.43
3.53
3.92
PB
DU
E-1
6.74
-39.
99*
-46.
86**
*-1
.02
-1.7
6-2
.63
CL
DU
E22
.90*
35.8
2**
22.1
2*1.
832.
231.
69G
ER
M-4
7.61
***
-78.
23**
*-3
2.83
***
-4.9
8-5
.54
-3.4
6SM
ALL
-30.
03**
*-6
.93
-20.
18*
-2.9
4-0
.73
-1.7
4C
onst
ant
-18.
93**
*-1
8.70
***
-25.
91**
*-1
5.85
***
-21.
09**
*19
.61*
*-1
8.72
***
74.7
6***
3.41
-3.9
8-3
.91
-5.0
8-2
.87
-4.4
22.
10-4
.03
5.31
0.33
Mor
tgag
eJu
mbo
Pfa
ndbr
ief
8.51
**8.
86**
4.56
7.66
*7.
61*
10.5
8***
19.6
4***
8.21
2.03
2.04
1.03
1.79
1.94
2.80
3.02
1.33
Pub
licT
radi
tion
alP
fand
brie
f48
.23*
**48
.22*
**48
.13*
**48
.04*
**47
.71*
**49
.54*
**49
.30*
**48
.62*
**11
.75
11.7
711
.74
11.7
611
.54
12.2
912
.24
12.1
2M
ortg
age
Tra
diti
onal
Pfa
ndbr
ief
36.5
0***
37.5
3***
31.6
8***
36.2
6***
35.5
3***
41.7
6***
50.9
9***
41.4
6***
7.47
6.53
5.86
7.46
7.24
8.43
7.01
5.30
AIs
suer
Rat
ing
0.54
0.32
3.99
0.67
-2.3
0-1
.95
0.85
1.94
0.15
0.09
1.14
0.19
-0.5
8-0
.57
0.24
0.55
BB
B/B
BIs
suer
Rat
ing
41.7
6***
41.5
2***
43.1
0***
43.4
7***
38.1
3***
40.9
6***
39.6
8***
43.0
3***
2.90
2.88
2.90
3.12
2.74
3.11
2.87
3.57
No
Issu
erR
atin
g-1
8.26
-18.
27-1
8.89
-19.
91-2
0.69
-11.
22-2
1.24
-23.
39-1
.22
-1.2
1-1
.20
-1.4
2-1
.26
-0.7
9-1
.32
-1.3
7R
elat
ive
Age
27.3
0***
27.1
7***
29.6
0***
27.7
9***
26.0
5***
24.0
0***
25.6
5***
27.6
2***
4.61
4.57
4.95
4.69
4.41
4.15
4.39
4.81
Out
stan
ding
Am
ount
-1.3
5-1
.28
-1.2
8-1
.34
-1.8
7-0
.62
-0.7
2-0
.76
-0.7
3-0
.70
-0.6
8-0
.73
-1.0
1-0
.35
-0.4
0-0
.42
Lan
desb
ank
pre
July
2005
-19.
91**
*-1
9.40
***
-22.
06**
*-1
8.89
***
-20.
18**
*-1
3.96
***
-20.
30**
*-1
6.43
***
-4.5
2-4
.27
-4.9
9-4
.26
-4.4
7-3
.20
-4.6
6-3
.63
Lan
desb
ank
post
July
2005
-16.
06**
*-1
5.61
***
-17.
37**
*-1
5.47
***
-16.
43**
*-1
0.63
***
-16.
84**
*-1
3.22
***
-3.9
8-3
.67
-4.3
3-3
.82
-3.9
2-2
.66
-4.1
5-3
.05
DE
PFA
104.
04**
*10
4.15
***
102.
02**
*10
3.59
***
100.
30**
*83
.16*
**10
3.20
***
81.0
9***
20.7
420
.77
19.9
920
.48
18.4
913
.01
20.7
812
.34
HR
E41
.87*
**41
.83*
**35
.72*
**42
.29*
**37
.78*
**42
.41*
**37
.39*
**26
.62*
3.38
3.38
2.66
3.40
2.96
3.40
3.16
1.86
N62
562
562
562
562
562
562
562
562
5
Adj
uste
dR
20.
551
0.55
00.
557
0.55
10.
554
0.57
40.
559
0.16
40.
587
48