liquidity distribution in the limit order book on the stock exchange of thailand
TRANSCRIPT

Available online at www.sciencedirect.com
International Review of Financial Analysis 17 (2008) 291–311
Liquidity distribution in the limit order book on the stockexchange of Thailand
Nuttawat Visaltanachoti a, Charlie Charoenwong b, David K. Ding b,⁎
a Department of Commerce, Massey University, Auckland, New Zealandb Nanyang Business School, Nanyang Technological University, Singapore
Available online 22 March 2006
Abstract
The liquidity distribution, or the shape of the limit order book, influences trading behavior and choice oforder submission by public liquidity suppliers. The present study seeks to discover whether liquidityproviders are concerned about being picked off by informed traders, and whether they are less willing tosupply liquidity at the market or demand higher price spreads. The results show that liquidity at the marketis a small portion of total liquidity, and that firm size, minimum tick size, volatility, and trading volume playsignificant roles in determining the liquidity distribution within an order book.© 2006 Elsevier Inc. All rights reserved.
JEL classification: G14; G15Keywords: Liquidity; Tick size; Thailand
1. Introduction
A limit order book contains the orders remaining after netting for execution and cancellation. Itindicates the availability of liquidity for an instantaneous trade. Many exchanges around theworld, including Euronext, the Tokyo Stock Exchange, the Hong Kong Stock Exchange, theAustralian Stock Exchange, and the Stock Exchange of Thailand, operate on a pure limit orderdriven system. In this system, there is no dealer or market maker, and liquidity is totally suppliedby the public trader. For the NYSE and NASDAQ, liquidity is provided through a public limitorder book and market maker. Since June 2003, the NYSE has disclosed the real-time specialist'sorder book and all liquidity quote information through a membership subscription. Bondarenko
⁎ Corresponding author. Division of Banking and Finance, Nanyang Business School, Nanyang TechnologicalUniversity, Singapore 639798, Singapore. Tel.: +65 6790 4927; fax: +65 6791 3697.
E-mail address: [email protected] (D.K. Ding).
1057-5219/$ - see front matter © 2006 Elsevier Inc. All rights reserved.doi:10.1016/j.irfa.2005.09.005

292 N. Visaltanachoti et al. / International Review of Financial Analysis 17 (2008) 291–311
and Sung (2003) predicted that the transparency of a specialist's order book could result in areduction in the specialist's participation and profits, a reduction in the bid–ask spreads, anincrease in trading volume, and a reduction in price volatility. In other words, these researchersthought liquidity information beyond the best quote would affect the price discovery process andthe behavior of traders. However, there are few microstructure studies that document the nature ofliquidity beyond the best quote. Fortunately, the order and trade data on the SET allows forreconstruction of the limit order book. As a result, it is possible to illustrate the characteristics anddistribution of liquidity in the limit order book on the SET.
In the absence of asymmetric information, the orders standing on the order book may notnecessarily have a uniform distribution (i.e., the depths and price spreads in the order book are notall equal). Parlour (1998) showed that because of the crowding-out effect, liquidity providerscompete against each other for the liquidity payment. As a result, even though all traders have thesame set of information, the orders do not arrive randomly; instead, they exhibit a specific patternthat reflects a crowding-out effect.
In the presence of informed traders, limit order traders are concerned about the picked-off risk,so they supply less liquidity at the market, resulting in thinner market depths. Moreover, a ticksize rule could affect the liquidity distribution of an order book. A small tick size may not beenough to compensate for the cost of liquidity provision in the presence of informed traders;therefore, in order to receive higher price spreads, limit order traders submit their orders awayfrom the market, resulting in thin liquidity at the market.
Interestingly, the literature reports different types of liquidity distribution of order books indifferent markets. Biais, Hillion, and Spatt (1995) found that the order book on the Paris Bourse isweakly concave, whereas Niemeyer and Sandas (1993) showed that the order book on theStockholm Stock Exchange (SSE) is convex. Al-Suhaibani and Kryzanowski (2000) reported thatthe order book on the Saudi Stock Market (SSM) tends to be linear. The concavity or convexity ofthe order book refers to the degree of the curvature of the graph that plots the depth of each quotein the order book along the horizontal axis, and the distance between the price limit and the quotemidpoint along the vertical axis. Intuitively, convexity is associated with the availability ofliquidity (thick depths) and little cost (small price spreads) at the market compared to further awayfrom the market. To date, the causes of liquidity distribution in a limit order book have not beenfully understood.
Therefore, this study recreates the limit order book from the order and trade data on the SET,and examines the liquidity distribution of the limit order book. It is shown that the size of the bestbid–ask spread and market depths is significantly different from other price spreads and depths.The bid–ask spread is widest compared to all other spreads. The pattern of the intraday variationsof the price spreads and depths at the best quote is similar to the patterns of other price spreads anddepths away from the market. The price spreads exhibit a downward pattern, while the depthsshow an upward pattern, supporting the idea that trading alleviates asymmetric informationbecause the information is incorporated into the price. The cross-sectional order book on the SETis weakly convex on the bid side of the order book, and uniformly distributed on the ask side.Further investigation reveals that the liquidity distribution in the order book is determined by thetick size and asymmetric information. Specifically, the order books of small, high-priced volatilityfirms have less liquidity available at the market compared to large, low-priced volatility firms.
The rest of the paper is organized as follows: Section 2 reviews the relevant literature andformulates our hypotheses. Section 3 describes the market architecture of the SET and theconstruction of the limit order book. Section 4 presents our research methodology and empiricalresults. Section 5 summarizes and concludes the study.
293N. Visaltanachoti et al. / International Review of Financial Analysis 17 (2008) 291–311
2. Literature review and hypotheses
2.1. Liquidity distribution in the limit order book
Biais et al. (1995) examined the relationship of spreads and depths between adjacent quotes inthe order book. They found that on the Paris Bourse, the spreads, excluding the bid–ask spread, oneach side of the book were relatively constant, but the bid–ask spread was more than twice as largeas other spreads. Furthermore, the depths at the market were lower than the depths away from themarket. Market depths on the Paris Bourse only reflected a small portion of overall liquidity, andthe other depths away from the market were not significantly different. Al-Suhaibani andKryzanowski (2000) found that the liquidity distribution in the order book of the Saudi StockMarket was weakly concave near the second quote, and convex thereafter. The convexity of thelimit order book is associated with the higher liquidity (thicker depths) and lower trading cost(smaller price spreads) at the best quote than at other quotes, while concavity is associated withlower liquidity (thinner depths) and higher trading cost (wider price spreads) at the best quote thanat other quotes. Al-Suhaibani and Kryzanowski (2000) suggested that the order book at the SaudiStock Market had a more pronounced adverse selection problem, resulting in a wide inside spreadand small depth at the market. Niemeyer and Sandas (1993) studied the nonlinearity priceschedule on the Stockholm Stock Exchange. On the SSE, the average quoted volume was highernear the market and was lower away from the market on the bid and ask side. Unlike the ParisBourse and the Saudi Stock Market, the inside spread was lower than other spreads behind themarket in the Stockholm Stock Exchange. In comparison, the price schedule of the Paris Boursewas weakly concave, with a narrow spread and large volume away from the market, but the orderbook of Swedish stocks was convex, with a wide spread and small volume away from the market.
Niemeyer and Sandas (1993) argued that the conflicting results between the SSE and the ParisBourse could arise from the large minimum tick size on the SSE. Most Swedish stocks trade atprices between SEK 20 and SEK 500 and have a minimum relative spread between 0.2% and2.5%. Harris (1991) reported that most NYSE stocks trade at prices between 5 USD and 50 USD,implying a minimum relative spread between 0.25% and 2.5%. This suggests that Swedish andNYSE stocks have a similar minimum relative spread. However, tick sizes at the most relevantprice range on the Paris Bourse are only one-tenth of those on the Stockholm Stock Exchange.According to Harris (1991, 1994), the minimum tick size reflects a trade-off between the costs andbenefits of a nonzero tick. The minimum tick size causes discrete price spreads, and increases theexecution cost of liquidity demanders. Minimum tick sizes motivate limit order traders to provideliquidity by enforcing minimum compensation and order precedence rules for liquidity suppliers.Furthermore, the minimum tick size simplifies the information sets and decreases the negotiationcost among traders.
Limit order traders provide the liquidity and earn the spread to offset for an asymmetricinformation risk when they trade against an informed trader. The limit order trader may choose toprovide less liquidity at the market to avoid being picked off by the more informed trader.Consequently, high information asymmetry results in a concave price schedule, with a widespread and small volume at the best quote. Therefore, a large tick size should be attractive to theliquidity trader in a strict-time-priority limit order market because the limit order trader receives ahigher payment for supplying liquidity and is compensated for the adverse selection cost.
Harris (1994) showed that depth is positively associated with minimum tick size. Harris foundthat Swedish stocks have narrow bid–ask spreads and large market depths, just the opposite ofstocks on the Paris Bourse. This argument is also applied to the Saudi Stock Market, which has a

294 N. Visaltanachoti et al. / International Review of Financial Analysis 17 (2008) 291–311
relatively lower minimum tick size that is similar to the Stockholm Stock Exchange. Al-Suhaibaniand Kryzanowski (2000) showed that cross-sectional mean and median transaction prices are SR196.07 and SR 111.81, while the minimum tick size for all stocks on the SSM is SR 1, which isapproximately 0.51% and 0.89% of trade price.
The study discussed in this paper seeks to provide further evidence about the association ofliquidity distribution in the limit order book, asymmetric information, and minimum tick size.During the period under study, about 57% of transactions on the SET traded between 10 and50 baht, or a minimum relative spread of 0.5–2.5%. The mean and median of trade prices of 141stocks was 50.75 and 24.08 baht, with a cross-sectional minimum relative spread of 0.99% and1.04%, respectively. Descriptively, the observed minimum relative spread on the SET was widerthan many other limit order markets. Angel (1997) reported that the relative tick size for 2517stocks covered by Morgan Stanley Capital International was 0.38%. New Zealand was the onlycountry studied by Angel (1997) that had a larger relative tick size (1.83%). Consequently, thispresent study aims to shed light on the role of asymmetric information and minimum tick size inorder to explain the shape of the limit order book. It was thought that the distribution of liquidityin the order book on the SET should be consistent with the following hypotheses:
Hypothesis 1. Bid–ask spread is wider than other spreads away from the market.
Hypothesis 2. Depth at the best quote is thinner than depth away from the market.
Hypothesis 3. Convexity of the price schedule in the order book (availability of liquidity near thebest quote, with low trading cost) is positively associated with minimum tick size and negativelyassociated with asymmetric information.
2.2. Intraday variation of the order book
It is well-known that a bid–ask spread on the NYSE exhibits a U-shape pattern (McInish &Wood, 1992). An intraday variation of spread infers the variation of either an inventory or anasymmetric information cost. As mentioned by Madhavan (1992), trade incorporates informationinto price, so adverse selection problems should be alleviated over the trading day. Therefore, theportion of asymmetric information cost included in the bid–ask spread should decline and causethe total bid–ask spread to fall throughout the trading day. However, a higher spread on the NYSEat the closing reflects the monopolist power of a specialist.
Chan, Chung, and Johnson (1995) compared the intraday pattern of spreads for actively tradedCBOE options and their NYSE-traded underlying stocks. They found that while both options andtheir underlying stocks have a wide spread at the open, the option spreads are narrowest at theclose while stock spreads become wide again. Such results arise from the differences in theunderlying market architecture. While CBOE has competing market makers, the NYSE hasmonopolist market makers. Market makers use spreads to manage an imbalance in their inventoryby increasing the bid or lowering the ask quotes to attract orders from other dealers. Thisdecreases the inside spread. Chan, Christie, and Schultz (1995) also found that the bid–ask spreadfor NASDAQ stocks decline throughout the day. This leads to the following hypothesis:
Hypothesis 4. Spread is widest at the opening and continually declines to narrowest at theclosing.
Depth in the order book reflects the immediacy of liquidity for trading. Although liquidityproviders receive spreads to compensate for their inventory costs and adverse selection risk, these

295N. Visaltanachoti et al. / International Review of Financial Analysis 17 (2008) 291–311
advantages are usually lost when they trade with informed traders. Consequently, the depth atdifferent price limits in an order book should increase throughout the trading day because the degreeof asymmetric information falls over the course of trading. The following hypotheses should hold:
Hypothesis 5. Depth is smallest at the opening and continually increases to largest at the closing.
Hypothesis 6. Length of order book is shortest at the opening and continually increases tolongest at the closing.
3. Market architecture and limit order book construction
3.1. Market architecture of stock exchange of Thailand
The Stock Exchange of Thailand (SET) has operated under an automated limit order tradingsystem, the Automated System for the Stock Exchange of Thailand (ASSET), since May 30,1991. Trading on the SET can occur on five trading boards: main, foreign, big lot, odd lot andspecial. The common stocks, preferred stocks, warrants, and unit trusts are traded on the mainboard, big lot board, and odd lot board. Only stocks registered under foreigners' names are tradedon the foreign board. Government and state enterprise bonds, debentures, and convertibledebentures are traded on the special board. Each trading unit or ‘board lot’, contains 100 shares ofa security, except for stocks trading at 500 baht or more for six consecutive months for which oneboard lot equals 50 shares. Orders of less than one board lot are traded on the odd lot board whileorders of either more than 3 million baht or 1 million shares are traded on the big lot board.
The ASSET system consists of two trading possibilities: Automatic Order Matching (AOM),the main system; and Put-Through (PT), the support system. The AOM system implements anorder queuing process and arranges the orders according to a price-then-time priority. First, allorders are grouped according to price, with the best price taking precedence. Then, within eachprice group, orders are arranged according to time. There are two matching procedures:continuous order matching and call market matching. While call market matching is used todetermine the opening price in the morning and afternoon sessions, all orders placed during thetrading session are subject to continuous order matching.
The Put-Through (PT) system is a support system that records approved transactionsnegotiated privately by members. Under the PT system, members can advertise their buying andselling interests on a screen provided by ASSET. Each member can then directly negotiate withanother party; and the effective executed price may be different from that advertised and may notfollow the price spread rules. After negotiations are concluded, members must send the results ofthe negotiated deal to the ASSET system for recording. The PT system can be used only for big lottrading, trading securities registered under a foreigner's name, and trading government bonds,state enterprise bonds, debentures, convertible debentures, and warrants on debentures.
ASSET allows traders to place seven order types: market order, limit order, at-the-open order,at-the-close order, immediate-or-cancel order, fill-or-kill order, and conditioned published order.Market order is simply an order to buy or sell securities at the best prevailing price. Limit order isan order to trade at a price no worse than the limit price specified. If no trade occurs, the order willstand as an offer to trade in the limit order book. At-the-open orders and at-the-close orders areorders to buy or sell securities at the opening price or at the closing price. The immediate-or-cancel order is an order to buy or sell securities immediately at a specific price. If there is anyunmatched volume, the remaining volume will be canceled. The fill-or-kill order is an order tobuy or sell the whole ordered volume at a specific price. If this condition cannot be met, the order

296 N. Visaltanachoti et al. / International Review of Financial Analysis 17 (2008) 291–311
will be canceled. The conditioned published order is an order that allows a trader to reveal someportion of his or her order size and hide the remaining order from the public. The volume of apublished order must be at least 10 board lots and indicate an equal number of shares to bepublished or revealed. When the revealed portion is transacted, the next portion is placed in thequeue until the whole ordered volume is completely transacted.
The SET imposes a minimum tick size rule on the main board. The tick size on the SET is astep function of stock prices. Table 1 contains details about absolute and relative tick sizes. In1997, there were seven price ranges that defined the minimum tick size, from a lowest tick of0.1 baht to a highest tick of 6 baht. For securities with prices below 10 baht, the minimum tick sizecould be very large relative to the price. For securities priced less than 1 baht, their prices wereallowed to fluctuate within a range of ±100%. In general, the minimum tick size was more than0.5% but less than 1% of the price.
The use of various minimum tick sizes suggests that the SET attempts to control the variationof the relative tick sizes across price ranges. This argument was strengthened when the SETdecided to implement a new minimum tick size rule on November 5, 2001. Table 1 (Panel B)shows the price ranges and the minimum tick sizes used under the new rule. As can be seen, therelative tick sizes under the new rule have less variation than those under the old rule.
3.2. Limit order book construction
The data provided by the SET contain an order file and a trade file. An order file records atrading date, a time stamp, an order identification (order ID), a buy/sell indicator, an order price in
Table 1Minimum tick size rule
Price range (baht) Tick size (baht) Tick size range (%)
Panel A: minimum tick size rule in 1997Less than 10 0.10 At least 1.00From 10 to less than 50 0.25 0.50–2.50From 50 to less than 100 0.50 0.50–1From 100 to less than 200 1.00 0.50–1From 200 to less than 600 2.00 0.33–1From 600 to less than 1000 4.00 0.40–0.67From 1000 upward 6.00 At most 0.60
Panel B: current minimum tick size, effective November 5, 2001Less than 2 0.01 At least 0.50From 2 to less than 5 0.02 0.40–1From 5 to less than 10 0.05 0.50–1From 10 to less than 25 0.10 0.40–1From 25 to less than 50 0.25 0.50–1From 50 to less than 100 0.50 0.50–1From 100 to less than 200 1.00 0.50–1From 200 to less than 400 2.00 0.50–1From 400 to less than 800 4.00 0.50–1From 800 upward 6.00 0.38–0.75
This table presents the minimum tick size rule used on the SET. The tick size range is computed from the ratio betweenthe minimum tick size and the lower or upper price range. Panel A shows the tick size rule used during 1997. Panel Bshows the current rule, which went into effect November 5, 2001. Source: Stock Exchange of Thailand Website http://www.set.or.th.

297N. Visaltanachoti et al. / International Review of Financial Analysis 17 (2008) 291–311
baht, an order volume in shares, a condition of order price, a condition of order volume, and astatus of order at the end of the trading day. The order time stamp is accurate to the nearest one-hundredth of a second. The order identification consists of a set of numbers that is used to indicatethe identity of the exchange member. Unfortunately, with the order ID alone, it is not possible toclassify the orders into groups of similar characteristics. Although the ASSET system also recordsa trader type and a brokerage ID, these data are unavailable in the dataset.
The buy/sell indicator shows either the buy or the sell instruction. Traders can submit an orderprice that is consistent with the minimum tick size rule. The number of shares should be in a boardlot unit, in multiples of 100 shares. The order status indicates what is going to occur to the order atthe end of the trading day. The order status at the end of the trading day is shown in the order files,and the status can be only one of the following four types: opened, matched, canceled by firms, orcanceled by the system. The SET allows traders to partially reveal their ordered volume bysubmitting a published order. Specifically, the published order is an order to buy or sell stockswith an ordered volume of at least 10 board lots (1000 shares) and specifying the ordered volumeto be published in the ASSET system. When the published portion of the ordered volume isexecuted, the next remaining portion is placed in the queue until the whole ordered volume hasbeen executed. The remaining published order is canceled by the ASSET system at the end ofeach trading session.
A trade file consists of a trading date, a traded time stamped to the nearest one-hundredth of asecond, a trade identification (trade ID), a traded price measured in baht, a traded volumemeasured in shares, and the identifications of the corresponding bid and ask orders. In eachtrading day, the trade ID is unique for each trade. Similar to the order identification, no additionalinformation can be inferred from the trade ID.
Since the data do not explicitly provide bid and ask quotes, to get the spread and depth of asecurity it was necessary to construct a limit order book from the order and trade files. The methodemployed in this study is similar to the limit order book construction of NYSE stocks used byKavajecz (1999). However, unlike the trading system used by the NYSE, ASSET clears allremaining orders in its system after market close. All securities traded on the SET start with afresh, empty book at the beginning of each day. Therefore, it was not necessary to estimate theinitial balance of the book at the beginning of the day, and the limit order books constructed forthis study are not in error by the initial book estimation.
A limit order book for a given time period was created by classifying all orders prior to the timein consideration into three categories: buy, sell, and canceled. Shares from the buy and sell orderswere assigned to their corresponding prices in the limit order book. Then, the number of sharestraded prior to the end of the interval was subtracted from the number of shares available on bothsides of the book. Because the traded or matched price could be better than the price of the trade-initiated order, it was necessary to be careful when subtracting the traded shares from both sides ofthe order book. Fortunately, each trade record in the trade file provides the ID numbers of the buyand sell orders. These IDs made it possible to determine the exact orders from which the numberof shares traded were being subtracted.
While the database indicates which order was eventually canceled, it does not provide the timeit was canceled. Since the construction of a limit order book needs the cancellation time, thefollowing assumptions were made. A canceled order that was never filled was immediatelycanceled after its submission. A canceled order that was partially filled was canceled at the time ofits last filled trade. With these assumptions, the simulated limit order book was essentiallyupdated faster than the true book. Because at-the-market limit orders must stand ready to tradeagainst an upcoming market order, they are unlikely to become canceled orders. Therefore, when

298 N. Visaltanachoti et al. / International Review of Financial Analysis 17 (2008) 291–311
an order was canceled, it was more likely to be a behind-the-market limit order rather than an at-the-market limit order. These assumptions created a certain bias for the bid–ask spreads anddepths. While the total depth or thickness of the limit order book was underestimated, the marketdepth and the bid–ask spread may or may not be underestimated.
Finally, if traders use conditioned published orders, their existence will affect the accuracy ofthe limit order book. It was possible to identify the time and portion of a conditioned publishedorder when it was matched, but not the time and the whole size of the order when it was originallysubmitted. This incomplete information about the conditioned published orders did affect theaccuracy of the estimates of this study, but the problem is not serious. The bid–ask spread wasunaffected because the transacted portion of the conditioned published order cannot be in front ofthe prevailing market quotes. While the total depth and market depth was underestimated, theywere similar to those displayed to the public. An example of an estimated limit order book ispresented in Table 2 and Fig. 1.
Table 2 shows a limit order book for Bangkok Bank Limited (BBL) on the first trading day of1997, immediately after the start of the trading session. The absolute bid–ask spread from thislimit order book was 1 baht, which was the difference between the best bid price (190 baht) andthe best ask price (191 baht). The market depth on the bid (ask) side was 18,700 shares (10,100
Table 2Estimated limit order book of Bangkok Bank Limited
Position on ask side Ask volume Price Bid volume Position on bid side
A14 10,000 210A13 1000 208A12 500 206A11 500 204A10 3600 202A9 2200 200A8 6000 199A7 14,300 197A6 1000 196A5 3400 195A4 2600 194A3 9700 193A2 800 192A1 10,100 191
190 18,700 B1189 33,200 B2188 16,700 B3187 5400 B4186 15,200 B5185 10,600 B6184 5800 B7183 400 B8181 100 B9180 19,000 B10178 19,000 B11172 3500 B12
This table presents a limit order book for Bangkok Bank Limited (BBL) as of January 2, 1997 at 10:01 a.m., recreated froman order and trade file. Position on ask (bid) side is the location of non-zero volume limit orders relative to the best ask(bid). Ask (bid) volume is the number of shares available in the order book. Price is the limit price in baht. The SETdisplays up to the best three bid and ask quotes.

186.00
187.00
188.00
189.00
190.00
191.00
192.00
1000 1001 1002 1003 1004 1005 1006 1007 1008 1009 1010
Time of the Day
Price (Baht)
Bid Price Ask Price
Fig. 1. Bid–ask quotes and execution prices of Bangkok Bank. This figure presents the movement of bid–ask quotes andtransaction prices of Bangkok Bank limited as of January 2, 1997 from 10:00 to 10:10 a.m.
299N. Visaltanachoti et al. / International Review of Financial Analysis 17 (2008) 291–311
shares). Traders could only observe the best three quotes on each side of the book, so the totalnumber of displayed buy (sell) orders was 20,600 shares (68,600 shares).
In addition, Fig. 1 presents the time series movement of best quote and trading price. For aliquid stock, the order book could be updated many times in a minute, while the limit order bookof a non-liquid stock might be updated a few times a day. In this study, in order to examine theliquidity distribution and the determinants of order submission, the limit order book was updatedwhenever a new order arrived.
4. Empirical results
4.1. Descriptive statistics
This study analyzed the trades and orders of all listed stocks on the SET during 1997. The limitorder book of non-liquid securities was not as informative as actively traded securities. As shownin Ding and Charoenwong (2003), the bid–ask spreads of thinly traded futures contractscomputed from days with trades were more informative than those computed from days withouttrades. Therefore, it was necessary for the selected stocks to have at least 120 trading days with aminimum of 10 trades a day in order to ensure that the limit order book had bid–ask quotes inmost trading periods. These criteria reduced the data from 457 stocks to 141 stocks. Although thenumber of selected stocks is less than one-third of the total number of stocks, the marketcapitalization and trading volume of the selected stocks comprised 80.57% and 83.75%,respectively, of the whole stock market during 1997.
Past studies on the pure limit order market explored a small number of stocks, covered a shortperiod of time, or only examined a specific part in the order book, especially the quote at themarket. Biais et al. (1995) performed an early study on the price schedule of the limit order bookand the successive order flow pattern on the Paris Bourse. Their dataset covered 19 trading daysof 40 stocks listed on the CAC 40 index. Al-Suhaibani and Kryzanowski (2000) and Niemeyerand Sandas (1993) performed similar analyses with only 56 stocks and 30 stocks on the SaudiStock Market and the Stockholm Stock Exchange, respectively.

300 N. Visaltanachoti et al. / International Review of Financial Analysis 17 (2008) 291–311
Table 3 (Panel A) compares the cross-sectional statistics of trades in the morning and afternoonsessions on the SET. There was an average of 333 order arrivals a day, equivalent to 1.83 millionshares, or 65 million baht. Trading volume was approximately one-half of the order volume interms of number of trades, and only one-fourth in terms of shares traded. Large stocks had highertrading volumes and lower return volatility compared to small stocks. The number of buy orderswas almost equal to the number of sell orders. About one-third of total orders resulted in animmediate execution. The proportion of sell and immediately executed orders was higher forsmall stocks. In addition, price-conditional orders (e.g., fill-or-kill, immediate-or-cancel, and at-the-market-opening) were only 0.14% of total orders. Canceled orders comprised 21.17% of totalorders, and most of these orders were canceled by a firm, not by ASSET. Large stocks had morecanceled orders than small stocks.
Table 3Descriptive statistics of order file, trade file and limit order book
Mean Median SD Min Max Correlation withfirm size
Panel A: order fileNumber of order 333 175 432 34 2785 0.5261Order size (thousand shares) 1831 827 2812 67 19,635 0.3841Order value (million baht) 65.44 18.04 134.78 1.13 1009.79 0.8195Buy order 0.5051 0.5139 0.0667 0.2597 0.7178 0.1508Limit order 0.7429 0.7426 0.0310 0.6316 0.8306 0.1555Matched orders 0.4627 0.4646 0.0474 0.3429 0.5749 0.0883Price conditional order 0.0014 0.0011 0.0012 0.0002 0.0102 0.0911Canceled order 0.2117 0.2098 0.0367 0.1019 0.2959 0.3052
Panel B: limit order bookComplete quote 0.9227 0.9413 0.0617 0.6117 0.9936 0.3234Relative spread 0.0338 0.0298 0.0184 0.0084 0.1026 −0.4195Absolute spread (baht) 1.13 0.58 1.49 0.11 11.60 0.2702Quote midpoint (baht) 51.11 24.04 71.99 1.55 504.21 0.5215Market depth (thousand shares) 54.29 28.31 63.15 1.78 376.42 0.2781Displayed depth (thousand shares) 170.59 75.07 191.62 7.18 1070.05 0.1997Total depth (thousand shares) 351.73 170.78 480.17 18.07 3303.28 0.3405Length of book 13.90 13.32 5.12 4.14 29.09 0.6943Length of bid 6.40 5.86 2.69 1.59 14.81 0.6807Length of ask 7.50 7.15 2.59 2.17 14.46 0.6642
Panel C: trade fileNo. active trading days 200 215 46 120 247 0.3937Number of trades 159 82 211 17 1281 0.5027Trade size (thousand shares) 417 201 661 12 4615 0.3870Trade value (million baht) 15.10 4.01 31.61 0.25 230.05 0.8056Price (baht) 50.75 24.08 71.95 1.56 503.64 0.5228Daily return 0.0049 0.0032 0.0104 −0.0165 0.0480 −0.2767SD of return 0.0122 0.0099 0.0082 0.0030 0.0404 −0.3851Mean absolute return 0.0068 0.0045 0.0063 0.0007 0.0310 −0.3585Hi–Lo return 0.0608 0.0595 0.0172 0.0229 0.1093 −0.0179
This table shows the cross-sectional descriptive statistics for the order file, limit order book, and trade file of stocks listedon the SET. Stock selection was based on two criteria. First, an active trading day must have at least 10 trades. Second, aselected stock must have at least 120 active trading days. The filtered dataset contained 141 stocks from a total of457 stocks.

301N. Visaltanachoti et al. / International Review of Financial Analysis 17 (2008) 291–311
Table 3 (Panel B) shows that a limit order book with at least one bid and one ask quoteoccurred 92.27% of the trading time, and the complete order book was likely to occur for a largestock. There was only 1.51% and 1.19% of total trading time when either the best bid or ask wasunavailable. The relative spread was 3.38%, while the cross-sectional average of the minimumrelative spread was 1%. The absolute spread was 1.13 baht. Large stocks had a lower relativespread, but higher absolute spread, because large stocks usually have a higher price and largerminimum tick size. Market depth, displayed depth, and total depth were higher for large stockscompared to small stocks. The length of book, length of bid side, and length of ask side were 13.9,6.4, and 7.5, respectively. Large stocks had a longer length of book on both the bid and ask side ofthe order book.
4.2. Liquidity distribution in the limit order book
The SET displays up to the best three quotes on each side of the order book to the publicinvestor, but only market surveillance officers can see the entire order book. The SET's orderbook was reconstructed using data from the order and trade file. Spreads between adjacent quotesand the depths at the three displayed quotes and the next three undisplayed quotes are reported inTable 4.
Table 4 shows the cross-sectional mean, median, and standard deviation for relative spread,absolute spread, and depth. The relative and absolute bid–ask spreads of the sample were 3.38%and 1.13 baht, higher than the 1.79% on the SSM and 1.36% on the SSE (Al-Suhaibani &Kryzanowski, 2000; Niemeyer & Sandas, 1993). Angel (1997) reported that the median ofrelative bid–ask spreads in 15 major market indices was only 0.65%. The wide relative spread onthe SET is partially due to a large minimum tick size rule. The minimum tick size on the SET isapproximately 1% on average trade price, which is twice the minimum tick size on the SaudiStock Market (0.51%). In addition, Thailand faced a currency crisis during 1997, and the SETindex fell more than 50%.
The bid–ask spread was widest compared to all other spreads on both sides of the order book.Bid price spreads away from the quote were wider than the spread near the quote, but the ask pricespreads were relatively constant. The relative (absolute) spreads were 2.14% (0.66 baht) for thefirst bid spread and 4.07% (0.74 baht) for the fifth bid spread, but the relative (absolute) spreadswere 1.86% (0.57 baht) for the first ask spread and 1.66% (0.59 baht) for the fifth ask spread.
The depth at best bid was 33,880 shares, the highest on the bid side, while the depth at best askwas 20,414 shares, the lowest on the ask side. Depths at other price limits were not much differentfrom their best quote depth. Depths at the sixth bid (ask) quote were 31,932 shares (24,400 shares)on average. The equality of price spreads and depths was tested by regressing the average time-series value with sets of dummy variables that represent the quote order:
Spreadi ¼ bB5�B6DB5�B6 þ bB4�B5DB4�B5 þ bB3�B4DB3�B4 þ bB2�B3DB2�B3
þ bB1�B2DB1�B2 þ bA1�B1DA1�B1 þ bA2�A1DA2�A1 þ bA3�A2DA3�A2
þ bA4�A3DA4�A3 þ bA5�A4DA5�A4 þ bA6�A5DA6�A5 þ ei ð1Þ
Depthj ¼ bB6DB6 þ bB5DB5 þ bB4DB4 þ bB3DB3 þ bB2DB2 þ bB1DB1 þ bA1DA1
þ bA2DA2 þ bA3DA3 þ bA4DA4 þ bA5DA5 þ bA6DA6 þ ei ð2Þwhere Spreadi is the average time-series value of price spread computed from the difference in theprice limits at successive quotes; and Depthj is the number of shares at a particular quote in the
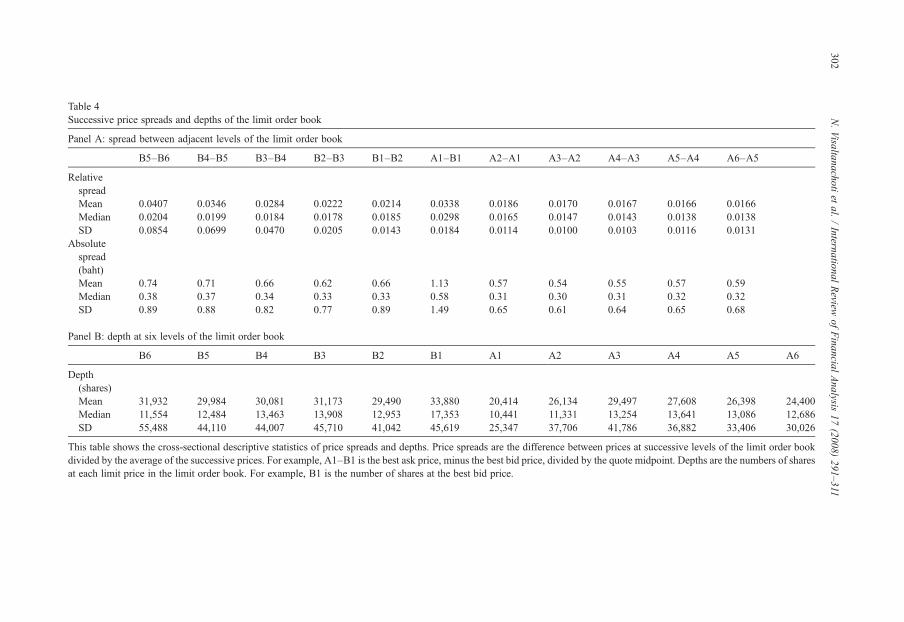
Table 4Successive price spreads and depths of the limit order book
Panel A: spread between adjacent levels of the limit order book
B5–B6 B4–B5 B3–B4 B2–B3 B1–B2 A1–B1 A2–A1 A3–A2 A4–A3 A5–A4 A6–A5
RelativespreadMean 0.0407 0.0346 0.0284 0.0222 0.0214 0.0338 0.0186 0.0170 0.0167 0.0166 0.0166Median 0.0204 0.0199 0.0184 0.0178 0.0185 0.0298 0.0165 0.0147 0.0143 0.0138 0.0138SD 0.0854 0.0699 0.0470 0.0205 0.0143 0.0184 0.0114 0.0100 0.0103 0.0116 0.0131
Absolutespread(baht)Mean 0.74 0.71 0.66 0.62 0.66 1.13 0.57 0.54 0.55 0.57 0.59Median 0.38 0.37 0.34 0.33 0.33 0.58 0.31 0.30 0.31 0.32 0.32SD 0.89 0.88 0.82 0.77 0.89 1.49 0.65 0.61 0.64 0.65 0.68
Panel B: depth at six levels of the limit order book
B6 B5 B4 B3 B2 B1 A1 A2 A3 A4 A5 A6
Depth(shares)Mean 31,932 29,984 30,081 31,173 29,490 33,880 20,414 26,134 29,497 27,608 26,398 24,400Median 11,554 12,484 13,463 13,908 12,953 17,353 10,441 11,331 13,254 13,641 13,086 12,686SD 55,488 44,110 44,007 45,710 41,042 45,619 25,347 37,706 41,786 36,882 33,406 30,026
This table shows the cross-sectional descriptive statistics of price spreads and depths. Price spreads are the difference between prices at successive levels of the limit order bookdivided by the average of the successive prices. For example, A1–B1 is the best ask price, minus the best bid price, divided by the quote midpoint. Depths are the numbers of sharesat each limit price in the limit order book. For example, B1 is the number of shares at the best bid price.
302N.Visaltanachoti
etal.
/International
Review
ofFinancial
Analysis
17(2008)
291–311

303N. Visaltanachoti et al. / International Review of Financial Analysis 17 (2008) 291–311
order book. The explanatory variables are the group of dummy variables that equal 1 if theobservations of the dependent variable belong to a certain quote in the order book. The number ofobservations in Eqs. (1) and (2) are 1551 (141×11) and 1692 (141×12), respectively.
Table 5 presents the Wald statistics for the equality test of cross-sectional spreads and depths atall six successive quotes. The hypothesis that displayed spreads, including bid–ask spreads, areequal was rejected, but the hypothesis that displayed price spreads, excluding bid–ask spread, areequal was not rejected. In other words, the bid–ask spread was wider than other price spreads, andthe size of displayed bid spreads was not statistically different from displayed ask spreads. Whilethe market depth on the bid side was largest compared to other bid depths, the market depth on theask side was smallest compared to other offer depths. It was found that displayed and undisplayedspreads were statistically different on the bid side, but statistically insignificant on the ask side. Inother words, the price spreads behind the market were wider only on the bid side and relativelyconstant on the ask side. The depths of displayed and undisplayed quotes on both sides of theorder book were not significantly different.
The distribution of liquidity in the limit order book can be visualized by plotting the price limitdeviation from the best quote midpoint on a vertical axis against the cumulative depth from the
Table 5Equality test of price spreads and depths
Panel A: equality of spread
DF Relative spreadequality test
Wald test P-value
Displayed spreads including bid–ask spread: βB2–B3=βB1–B2=βA1–B1=βA2–A1=βA3–A2 4 16.88 0.0020Displayed spreads excluding bid–ask spread: βB2–B3=βB1–B2=βA2–A1=βA3–A2 3 1.69 0.6402Spreads on the bid side: βB5–B6=βB4–B5=βB3–B4=βB2–B3=βB1–B2 4 26.36 0.0000Spreads on the ask side: βA2–A1=βA3–A2=βA4–A3=βA5–A4=βA6–A5 4 0.28 0.9908
Panel B: equality of depth
DF Depth equality test
Wald test P-value
Displayed depths including market depths: βB3=βB2=βB1=βA1=βA2=βA3 5 9.22 0.1006Displayed depth excluding market depths: βB3=βB2=βA2=βA3 3 1.13 0.7690Depths on the bid side: βB6=βB5=βB4=βB3=βB2=βB1 5 1.13 0.9519Depths on the ask side: βA1=βA2=βA3=βA4=βA5=βA6 5 4.09 0.5366
This table presents the equality test of price spreads and depths using the Wald linear restriction test from the followingregression:
Spreadi ¼ bB5�B6DB5�B6 þ bB4�B5DB4�B5 þ bB3�B4DB3�B4 þ bB2�B3DB2�B3 þ bB1�B2DB1�B2 þ bA1�B1DA1�B1
þ bA2�A1DA2�A1 þ bA3�A2DA3�A2 þ bA4�A3DA4�A3 þ bA5�A4DA5�A4 þ bA6�A5DA6�A5 þ ei
Depthj ¼ bB6DB6 þ bB5DB5 þ bB4DB4 þ bB3DB3 þ bB2DB2 þ bB1DB1 þ bA1DA1 þ bA2DA2 þ bA3DA3
þ bA4DA4 þ bA5DA5 þ bA6DA6 þ ei
where Spreadi and Depthj are the price spread and depth of successive levels in the order book for all stocks after stackingall observations; and Di, i=B5–B6,… , A6–A5 and Dj where j=B6,… , A6 are dummy variables that equal 1 if theobservation of spread or depth belongs to the book level i or j. The numbers for i and j are 11 and 12, respectively. Waldstatistics were used to test the sets of linear restrictions.

304 N. Visaltanachoti et al. / International Review of Financial Analysis 17 (2008) 291–311
best quote on a horizontal axis. The positive (negative) value of price limit deviation and thecumulative depth refers to the bid (ask) side of the order book. If the price spreads betweensuccessive price limits and depths are equal across the limit order book, the order book wouldexhibit a straight-line relationship.
Figs. 2 and 3 present a hypothetical convex and concave order book. The hypothetical convexorder book was plotted from a book that had price spreads monotonically increase and depthsmonotonically decrease away from the market. In other words, the liquidity distribution of theconvex order book was concentrated near the best quotes rather than away from the market, andthe execution cost per shares traded was positively associated with the size of the market order.
The limit order book on the SETwas approximately linear on the sell side and weakly convexon the buy side (see Fig. 4). The displayed bid and ask sides of the order book were approximatelylinear. Nevertheless, the undisplayed bid side exhibited a weakly convex shape as a result of widerspreads further away from the best quote, but the undisplayed ask side did not significantlydeviate from the linear. Wide undisplayed bid spreads might reflect the high degree of asymmetricinformation for buyers in a bear market. Because buyers are concerned about being picked off byinformed traders, they submit a conservative limit order expecting to receive a larger spread tocompensate for higher asymmetric information risks.
Biais et al. (1995) reported that the order book on the Paris Bourse is slightly concave, that is,the depth at the market is smaller than the depth away from the market. It could be argued that thedegree of market transparency affects the shape of the order book. This argument is not likelybecause both the Stockholm Stock Exchange and Paris Bourse similarly display the five bestquotes, while the Saudi Stock Market and the SET only display the two and three best quotes,respectively. Nevertheless, this study's dataset did not allow for a direct test of the transparencyimpact on liquidity distribution in a limit order book.
Niemeyer and Sandas (1993) reconciled their results with those of Biais et al. (1995) byarguing that a larger tick size on the Stockholm Stock Exchange compared to the Paris Bourse isthe reason for the difference in patterns. With the larger tick size, the five displayed quotes of the
-0.40
-0.30
-0.20
-0.10
0.00
0.10
0.20
0.30
0.40
-150,000 -100,000 -50,000 0 50,000 100,000 150,000
Cumulative Depth (Shares)
Convex Limit Order Book
Relative Price Deviation from Midpoint
Fig. 2. Hypothetical example of convex limit order book. This figure shows the convex shape of an order book when therelative price spreads increase by 20% and the depths decrease by 20% at each successive quote away from the market. Thevertical axis is the relative price deviation away from the mid-quote price, while the horizontal axis is the cumulative depthat the six best bid and best ask quotes of the order book. The positive (negative) relative price deviation and cumulativedepths represent the order book on the bid (ask) side.

-0.15
-0.10
-0.05
0.00
0.05
0.10
0.15
-400,000 -300,000 -200,000 -100,000 0 100,000 200,000 300,000 400,000
Cumulative Depth (Shares)
Concave Limit Order Book
Relative Price Deviation from Midpoint
Fig. 3. Hypothetical example of concave limit order book. This figure shows the concave shape of an order book when therelative price spreads decrease by 20% and the depths increase by 20% at each successive quote away from the market. Thevertical axis is the relative price deviation away from the mid-quote price, while the horizontal axis is the cumulative depthat the six best bid and best ask quotes of the order book. The positive (negative) relative price deviation and cumulativedepths represent the order book on the bid (ask) side.
305N. Visaltanachoti et al. / International Review of Financial Analysis 17 (2008) 291–311
order book on the Stockholm Stock Exchange should cover a wider price range than thecorresponding levels on the Paris Bourse, resulting in a more transparent order book. Moreimportantly, large tick size attracts liquidity suppliers.
In addition to the tick size, asymmetric information and the liquidity distribution of the limitorder book affect the order placement behavior of liquidity providers. Liquidity providers aremost likely facing a loss when trading against the informed trader, so they shift the limit orderplaced at the market away from the market to receive wider price spreads as a cushion against theloss. This behavior is consistent with Lee, Mucklow, and Ready (1993), who found wide bid–ask
-0.20
-0.15
-0.10
-0.05
0.00
0.05
0.10
0.15
0.20
-200,000 -150,000 -100,000 -50,000 0 50,000 100,000 150,000 200,000
Cumulative Depth (Shares)
Relative Price Deviation from Midpoint
Fig. 4. Cross-sectional shape of order book on the SET. This figure presents the relationship between average pricedeviation and cumulative depth at the six best bid and best ask quotes of the order book. The positive (negative) pricedeviation and cumulative depths represent the order book on the bid (ask) side.

306 N. Visaltanachoti et al. / International Review of Financial Analysis 17 (2008) 291–311
spreads and thin market depths during the earning announcement period when the degree ofadverse selection is high.
As mentioned by Amihud (2002), liquidity is an elusive concept because it cannot be directlyobserved, and a single measure is unlikely to capture all aspects of liquidity. Spread and depth arewidely used to measure liquidity. In addition, the liquidity distribution should reflect the variationof price spreads and depths across price limits on the order book. To combine these aspects ofliquidity together, a new variable called convexity is defined as follows:
DSlopeBIDðASKÞk ¼ Skþ2−Skþ1
Dkþ2−Dkþ1−Skþ1−SkDkþ1−Dk
� �=
Skþ2−Skþ1
Dkþ2−Dkþ1þ Skþ1−SkDkþ1−Dk
=2
� �
Convexity ¼
XKk¼1
DSlopek
Kð3Þ
where Sk andDk are the limit price differences from the mid-quote and the cumulative depth at thekth away from the market; ΔSlopek is the change in price schedule slope at the kth away from themarket; and Convexity is the average of ΔSlopek. The zero convexity indicates a linearrelationship between the limit price difference from the mid-quote and the cumulative depth. Inother words, the depths and price spreads at the market were approximately the same as thoseaway from the market.
Intuitively, convexity is associated with the availability of low-cost liquidity at the market.Positive convexity implies either a narrower price spread or a larger depth at the market. Negativeconvexity or concavity implies that either the price spreads away from the market are narrowerthan the price spreads at the market, or the depths away from the market are larger than the depthsat the market. The majority of stocks in the dataset (95 stocks out of 141 stocks) had a positiveconvexity. When the convexity on the bid side and on the ask side were computed separately, thenumber of positive convexity securities was 108 stocks on the bid side and 47 stocks on the askside. This indicates that the positive convexity of the order book comes from the bid side becausethe price spreads on the bid side continually increased further away from the market. Therelationship between the shape of the order book, tick size, and degree of asymmetric informationwas investigated using the following regression:
Convexityi ¼ b0 þ b1TickSizei þ b2FirmSizei þ b3Volatilityi þ b4Volumei þ ei ð4Þwhere Convexityi is the average of the slope difference of the price schedule; TickSizei is theminimum relative price spread; FirmSizei is the market capitalization; Volatilityi is the trade pricevolatility; and Volumei is the trading volume. All the variables were standardized by subtractingthe cross-sectional mean and dividing by the standard deviation.
Table 6 presents the determinants of the liquidity distribution within the limit order book.Minimum tick size was negatively associated with market capitalization (−0.26) and positivelyassociated with daily volatility (0.57). Firm size was negatively associated with daily volatility(−0.39). The results indicate positive coefficients for minimum tick size and firm size, and anegative coefficient for volatility. Such relationships are consistent with the hypotheses discussedin the previous section. Securities with large tick sizes had more convex order books compared tosecurities with small tick sizes. In other words, the findings support the argument that thedifference in the shape of the order book is influenced by a difference in minimum tick size rule(Niemeyer & Sandas, 1993). Moreover, high information asymmetry securities (e.g., small firms

Table 6Determinants of the shape of the limit order book
Total book All firms
All firms Large firms Small firms Large tick size Small tick size Bid side Ask side
Tick size 0.556 −0.009 0.773 0.762 0.051 0.466 0.546(6.56)⁎⁎ (−0.11) (7.50)⁎⁎ (6.77)⁎⁎ (0.48) (6.70)⁎⁎ (5.23)⁎⁎
Firm size 0.205 −0.003 0.026 0.038 0.078 0.141 0.245(3.11)⁎⁎ (−0.04) (0.29) (0.71) (0.98) (2.20)⁎ (3.59)⁎⁎
Volatility −0.693 −0.800 −0.427 −0.271 −0.805 −0.718 −0.491(−7.45)⁎⁎ (−8.21)⁎⁎ (−3.09)⁎⁎ (−4.29)⁎⁎ (−7.95)⁎⁎ (−8.21)⁎⁎ (−4.38)⁎⁎
Volume 0.032 −0.164 0.120 0.223 −0.1334 0.068 −0.024(0.63) (−2.08)⁎ (1.21) (3.12)⁎⁎ (1.61) (1.08) (−0.45)
Durbin-Watson 1.90 1.77 1.20 1.75 2.00 1.81 2.00Adjusted-R2 0.45 0.52 0.48 0.50 0.57 0.45 0.29
The factors determining the shape of the order book are examined through the following regression:
Convexityi ¼ b0 þ b1TickSizei þ b2FirmSizei þ b3Volatilityi þ b4Volumei þ ei
where Convexityi is the average of the slope difference of the price schedule; TickSizei is the minimum relative pricespread; FirmSizei is the market capitalization; Volatilityi is the trade price volatility; and Volumei is the trading volume. Allthe variables are standardized by subtracting the cross-sectional mean and dividing by the standard deviation. Total refersto the regression when Convexityi is computed including both bid and ask sides. Bid (Ask) side is the regression whenConvexityi is computed including only bid (ask) side. Positive (Negative) Convexity is the regression based on firms withpositive (negative) Convexityi. Large (Small) firms are firms with market capitalization larger (smaller) than the median ofall firms. Large (Small) Tick Size are firms with relative tick size larger (smaller) than the median tick size of all firms. Thenumber in the parenthesis is the t-statistic adjusted by White heteroskedasticity, where ⁎ and ⁎⁎ denote a 95% and 99%statistical significance.
307N. Visaltanachoti et al. / International Review of Financial Analysis 17 (2008) 291–311
with high-return volatility) were likely to have a concave order book compared to low informationasymmetry securities. This shows that the liquidity distribution within the order book is sensitiveto the degree of asymmetric information.
A robustness check was performed by separating the dataset into two sub-samples according tomarket capitalization and relative tick size. The findings indicate that the impact of minimum ticksize on the convexity of the order book only occurred in small firms and was insignificant forlarge firms. Moreover, the study examined whether the determinants of order convexity on the bidside would be different from the ask side, and the findings indicate no difference between the bidside and the ask side.
4.3. Intraday variation of the limit order book
Intraday patterns of the order book were investigated using a regression of the variables ofinterest with time of day and day of the week dummies:
Ykt ¼ a þ
X9h¼1
bhdtimeh;t þX5k¼1
gkdweekk;t þ et; subject toX9h¼1
bh ¼ 0;X5k¼1
gk ¼ 0 ð5Þ
where Ytk denotes the variables of interest, which consist of complete quote, length of order book,
length of bid, length of ask, bid–ask spread, price spread of the best bid price and last displayedbid price (B1–B3), price spread of best ask price and the last displayed ask price (A3–A1), marketdepth, displayed depth, total depth, and proportion of displayed depth. Note that B1 (A1), B2

Table 7Intraday variation of the order book
Panel A: time variation of complete quote, length of the book, and spread
Complete quote Length of book Length of bid Length of ask Bid–ask spread B1–B2 B2–B3 A2–A1 A3–A2
Constant 0.9227⁎⁎ 13.90⁎⁎ 6.40⁎⁎ 7.50⁎⁎ 1.1294⁎⁎ 0.6563⁎⁎ 0.6198⁎⁎ 0.5722⁎⁎ 0.5416⁎⁎
10:00–10:30 0.0046⁎⁎ −1.93⁎⁎ −0.75⁎⁎ −1.18⁎⁎ 0.5248⁎⁎ 0.0945⁎⁎ 0.0504⁎⁎ 0.0949⁎⁎ 0.0579⁎⁎
10:30–11:00 0.0128⁎⁎ −0.83⁎⁎ −0.20⁎⁎ −0.62⁎⁎ 0.1763⁎⁎ 0.0409⁎⁎ 0.0300⁎⁎ 0.0390⁎⁎ 0.0334⁎⁎
11:00–11:30 0.0129⁎⁎ −0.34⁎⁎ 0.01 −0.35⁎⁎ 0.0553⁎⁎ 0.0066⁎⁎ 0.0127⁎⁎ 0.0227⁎⁎ 0.0179⁎⁎
11:30–12:00 0.0113⁎⁎ −0.05⁎⁎ 0.10⁎⁎ −0.15⁎⁎ −0.0140 −0.0035 0.0071⁎⁎ 0.0061 0.0085⁎⁎
12:00–12:30 0.0105⁎⁎ 0.17⁎⁎ 0.11⁎⁎ 0.06⁎⁎ −0.0590⁎⁎ −0.0070 0.0030 −0.0063⁎⁎ −0.001114:30–15:00 −0.0017 0.48⁎⁎ 0.13⁎⁎ 0.34⁎⁎ −0.1294⁎⁎ −0.0192⁎⁎ −0.0202⁎⁎ −0.0218⁎⁎ −0.0146⁎⁎15:00–15:30 −0.0049⁎⁎ 0.65⁎⁎ 0.16⁎⁎ 0.50⁎⁎ −0.1565⁎⁎ −0.0244⁎⁎ −0.0195⁎⁎ −0.0316⁎⁎ −0.0231⁎⁎15:30–16:00 −0.0138⁎⁎ 0.83⁎⁎ 0.23⁎⁎ 0.60⁎⁎ −0.1885⁎⁎ −0.0326⁎⁎ −0.0242⁎⁎ −0.0443⁎⁎ −0.0333⁎⁎16:00–16:30 −0.0316⁎⁎ 1.02⁎⁎ 0.21⁎⁎ 0.81⁎⁎ −0.2090⁎⁎ −0.0554⁎⁎ −0.0393⁎⁎ −0.0586⁎⁎ −0.0456⁎⁎Monday 0.0046⁎⁎ −0.21⁎⁎ −0.29⁎⁎ 0.08⁎⁎ 0.1006⁎⁎ 0.0137 0.0231 0.0242⁎⁎ 0.0092⁎⁎
Tuesday −0.0004 0.08⁎⁎ 0.03 0.05 0.0215⁎ −0.0074 −0.0084 0.0052 0.0097Wednesday −0.0032 0.05 0.31⁎⁎ −0.26⁎⁎ −0.0370⁎⁎ −0.0083 −0.0120 −0.0168⁎⁎ −0.0111⁎⁎Thursday −0.0026 0.07⁎⁎ 0.03 0.04 −0.0327⁎⁎ 0.0125 0.0143 −0.0081 −0.0058Friday 0.0016 0.01 −0.09⁎⁎ 0.10⁎⁎ −0.0524⁎⁎ −0.0105⁎⁎ −0.0170⁎⁎ −0.0046 −0.0020
308N.Visaltanachoti
etal.
/International
Review
ofFinancial
Analysis
17(2008)
291–311

Panel B: the time variation of depth
Market depth Displayed depth Total depth B1 B2 B3 A1 A2 A3
Constant 51,941⁎⁎ 150,578⁎⁎ 351,730⁎⁎ 32,629⁎⁎ 26,960⁎⁎ 26,729⁎⁎ 19,881⁎⁎ 25,164⁎⁎ 26,979⁎⁎
10:00–10:30 −13,439⁎⁎ −43,719⁎⁎ −112,639⁎⁎ −7286⁎⁎ −8357⁎⁎ −7806⁎⁎ −6062⁎⁎ −7027⁎⁎ −7968⁎⁎10:30–11:00 −8728⁎⁎ −24,559⁎⁎ −61,699⁎⁎ −5241⁎⁎ −4713⁎⁎ −4245⁎⁎ −3555⁎⁎ −3597⁎⁎ −4444⁎⁎11:00–11:30 −6162⁎⁎ −14,055⁎⁎ −33,942⁎⁎ −4007⁎⁎ −2614⁎⁎ −2540⁎⁎ −2289⁎⁎ −1539⁎⁎ −2130⁎⁎11:30–12:00 −3931⁎⁎ −6993⁎⁎ −15,130⁎⁎ −2678⁎⁎ −1460⁎⁎ −1096⁎⁎ −1456⁎⁎ −573⁎⁎ −859⁎⁎12:00–12:30 −2038⁎⁎ −1401⁎⁎ 77 −1222⁎⁎ −234 −70⁎⁎ −996⁎⁎ −67⁎⁎ −6514:30–15:00 2689⁎⁎ 8920⁎⁎ 24,611⁎⁎ 1858⁎⁎ 2075⁎⁎ 1942⁎⁎ 868⁎⁎ 1120⁎⁎ 1804⁎⁎
15:00–15:30 5385⁎⁎ 16,396⁎⁎ 43,802⁎⁎ 2932⁎⁎ 3050⁎⁎ 3078⁎⁎ 2474⁎⁎ 2187⁎⁎ 3090⁎⁎
15:30–16:00 8988⁎⁎ 24,530⁎⁎ 62,656⁎⁎ 4751⁎⁎ 4314⁎⁎ 4136⁎⁎ 4244⁎⁎ 3816⁎⁎ 4073⁎⁎
16:00–16:30 17,235⁎⁎ 40,881⁎⁎ 92,266⁎⁎ 10,892⁎⁎ 7939⁎⁎ 6601⁎⁎ 6772⁎⁎ 5681⁎⁎ 6499⁎⁎
Monday −10,987⁎⁎ −20,068⁎⁎ −36,417⁎⁎ −9518⁎⁎ −2220⁎⁎ −3553⁎⁎ −1474⁎⁎ −2413⁎⁎ −1868⁎⁎Tuesday −8632⁎⁎ −10,447⁎⁎ −14,568⁎⁎ −8434⁎⁎ −248 −388⁎⁎ −187 −858⁎ −355Wednesday 647 1941⁎⁎ −230 −1023 −676 −540 1702 1957⁎⁎ 1023⁎⁎
Thursday 19,967⁎⁎ 25,201⁎⁎ 35,395⁎⁎ 20,274⁎⁎ 1295⁎⁎ 1888 −369 705 955⁎⁎
Friday −995 3373 15,819⁎⁎ −1300 1849⁎⁎ 2593⁎⁎ 329 609⁎⁎ 245
The intraday patterns of interested variables are estimated as follows:
Ykt ¼ aþ
X9h¼1
bhdtimeh;t þX5k¼1
gkdweekk;t þ et ; subject toX9h¼1
bh ¼ 0;X5k¼1
gk ¼ 0
where Ytk denotes the variables of interest, which consist of complete quote, bid–ask spread, length of order book, length of bid, length of ask, price spreads of the successive quote
(B1–B2, B2–B3, A2–A1, A3–A2), length of limit order book, length of bid, length of ask, market depth, displayed depth, total depth, and depths at display quoted (B3, B2, B1, A1,A2, A3). For each variable, the data of 141 stocks are stacked into a column and standardized by subtracting the mean and dividing by the standard deviation of its own stock. Then,the standardized variables are regressed against time of day and day of the week dummies. The table reports the cross-sectional averages of the coefficients and the adjusted R2. Thestatistical significance is based on the signed test of the estimated coefficients, where ⁎⁎ and ⁎ indicate a 99% and 95% statistical significance.
309N.Visaltanachoti
etal.
/International
Review
ofFinancial
Analysis
17(2008)
291–311

310 N. Visaltanachoti et al. / International Review of Financial Analysis 17 (2008) 291–311
(A2), B3 (A3) are the price limit at the first, second, and third best quote on the bid (ask) side. Thelength of an order book refers to the number of different price limits in the order book.
Table 7 exhibits an intraday pattern of the order book. The order book was more likely toconsist of both bid and ask quotes in the morning session or on a Monday than in the afternoonsession or a later day of the week. This finding indicates that after a trade occurred and tookliquidity away from the order book, new liquidity did not immediately appear. The length of orderbook, bid side, and ask side were lowest after the market opened and highest before the marketclosed. This suggests that a limit order trader who provides liquidity at a later time of the daysubmits his or her quote further away from the best quote. The placement strategy of these tradersis likely to hedge the position or set up a cut-loss limit in case of an unfavorable price movement,and these traders allow trading to occur for a while before implementing these placements.
Furthermore, the results show that all displayed spreads become narrower as the trading timepasses. Bid–ask spreads exhibited a downward intraday pattern where they were highest in thefirst 30-min interval and lowest in the last 30-min interval. Other displayed spreads on both bidand ask sides, such as the first and second bid spread (B1–B2 and B2–B3), show a similardownward pattern. The findings support Madhavan's (1992) argument that the cost ofasymmetric information is alleviated after trading because more information is incorporatedinto the price. In a period of high adverse selection cost, limit order traders would make a loss ifthey traded against a better-informed trader. Consequently, the liquidity supplier is unwilling toprovide liquidity during a period of high asymmetric information.
The intraday variation of liquidity in the order book shown in Table 7 supports this argument.The market depth, displayed depth, and total depth are at their minimum in the first 30 min of atrading day, and they increase as trading continues. The level of liquidity reaches its maximumduring the last 30 min of a trading day. Volumes in the order book, which are bid and ask volumesand at the market and away from the market volumes, follow an upward pattern.
5. Conclusion
An order book at any point in time represents an accumulation of limit orders after deductingcancellations and market orders. A change in the order book reflects information flow, liquiditychange, and trader expectation. The order book becomes an indispensable source of informationwhen a trader wants to design an appropriate submission strategy. The order book in a period ofthin depth and wide spread may be the result of liquidity shock or a high degree of informationasymmetry. In this situation, market order submission is considered a costly strategy. Uninformedtraders offer liquidity when it is expensive and consume liquidity when it is cheap. Informedtraders, on the other hand, submit orders to maximize the value of private information by eithertrading fast, breaking large orders to conceal themselves, or submitting aggressive orders toincrease the chance of successfully completing their trades. An understanding of the liquiditydistribution in the limit order book is vital to all market participants.
This study analyzes the shape of the limit order book on the SET. The findings reveal that theorder book on the SETexhibits a weakly convex shape on the bid side and a relatively linear shapeon the ask side. Bid–ask spread is larger than other spreads away from the market. Spreads awayfrom the market are larger than the spread near the market on the bid side, but are approximatelyequal on the ask side. On the bid side, the depth at the market is largest compared to the otherdepths away from the market, but on the ask side, the depth at the market is smallest. Excludingdepth at the market, depths away from the market are not statistically different. The findings showthat the variation of liquidity distribution within the SET's order book is affected by minimum

311N. Visaltanachoti et al. / International Review of Financial Analysis 17 (2008) 291–311
tick size and degree of adverse selection. The order book of stocks with large minimum tick sizesis more convex than the order book of stocks with lower minimum tick sizes (Niemeyer &Sandas, 1993). Moreover, the degree of convexity is negatively associated with firm size as aproxy for asymmetric information.
In addition, while previous studies show the existence of the intraday variation of bid–askspread and market depth, this study shows that the spread and depth away from the market have asimilar intraday pattern as the spread and depth at the market. The bid–ask spread and other pricespreads between successive quotes are widest at the opening period and become narrowest at theclosing period. The market depth and other depths away from the market show an upward pattern,lowest at the opening and increasing to highest at the closing. These findings support thehypothesis that trading resolves the problem of asymmetric information.
Acknowledgement
The authors thank Kee H. Chung, Quentin C. Chu, Chandrasekhar Krishnamurti, seminarparticipants at the 8th New Zealand Finance Colloquium and Nanyang Technological University.Any remaining errors are the responsibility of the authors.
References
Al-Suhaibani, M., & Kryzanowski, L. (2000). An exploratory analysis of the order book, and order flow and execution onthe Saudi Stock Market. Journal of Banking and Finance, 24, 1323–1357.
Amihud, Y. (2002). Illiquidity and stock returns: Cross-section and time-series effects. Journal of Financial Markets, 5,31–56.
Angel, J. (1997). Tick size, share prices, and stock splits. Journal of Finance, 52(2), 655–681.Biais, B., Hillion, P., & Spatt, C. (1995). An empirical analysis of the limit order book and the order flow in the Paris
Bourse. Journal of Finance, 50, 1655–1689.Bondarenko, O., & Sung, J. (2003). Specialist participation and limit orders. Journal of Financial Markets, 6, 539–571.Chan, K., Christie, W. G., & Schultz, P. H. (1995). Market structure and the intraday pattern of bid–ask spreads for
NASDAQ securities. Journal of Business, 68, 35–60.Chan, K., Chung, P., & Johnson, H. (1995). The intraday behavior of bid–ask spreads for NYSE stocks and CBOE options.
Journal of Financial and Quantitative Analysis, 30, 329–346.Ding, D. K., & Charoenwong, C. (2003). Bid–ask spreads, volatility, quote revisions, and trades of thinly traded futures
contracts. Journal of Futures Market, 23, 455–486.Harris, L. (1991). Stock price clustering and discreteness. Review of Financial Studies, 4, 389–415.Harris, L. (1994). Minimum price variations, discrete bid/ask spreads and quotation sizes. Review of Financial Studies, 7,
149–178.Kavajecz, K. A. (1999). A specialist's quoted depth, and the limit order book. Journal of Finance, 54, 747–771.Lee, C., Mucklow, B., & Ready, M. (1993). Spreads, depths, and the impact of earnings information: An intraday analysis.
Review of Financial Studies, 6, 345–374.Madhavan, A. (1992). Trading mechanisms in securities market. Journal of Finance, 47, 607–642.McInish, T., & Wood, R. (1992). An analysis of intraday patterns in bid/ask spreads for NYSE stocks. Journal of Finance,
47, 753–764.Niemeyer, J., & Sandas, P. (1993). An empirical analysis of the trading structure at the Stockholm Stock Exchange.
Journal of Multinational Financial Management, 3, 63–101.Parlour, C. (1998). Price dynamics in limit order markets. Review of Financial Studies, 11, 789–816.