liquidity management and its effect on profitability in a ... · pdf fileemmanuel opoku ware...
TRANSCRIPT

International Journal of Research in Business Studies and Management
Volume 2, Issue 11, November 2015, PP 34-66
ISSN 2394-5923 (Print) & ISSN 2394-5931 (Online)
*Address for correspondence:
International Journal of Research in Business Studies and Management V2 ● I11 ● November 201 34
Liquidity Management and Its Effect on Profitability in a Tough
Economy: (A Case of Companies Listed on the Ghana Stock
Exchange)
Emmanuel Opoku Ware
School of Business & Faculty of Law, Kings University College, Accra, Ghana
ABSTRACT
Liquidity management, especially at the wake of the global financial crisis, has become a major source of
concern for business managers as bank loans are becoming too expensive to maintain as a result of tightening of
both the local and international financial market and the reluctance of the public to invest in the share of
companies as a result to the crash of the capital market. This research work measures the relationship between
liquidity and profitability and its effect on profitability in a tough economy using data from all the 33 companies
listed on the Ghana Stock Exchange. The result of the study was obtained using descriptive analysis and the
finding shows that liquidity measured in terms of the companies Cash Conversion Cycle, Average Collection
Period and Average Payment Period have no statistical significant on profitability and it is concluded that
managers can increase profitability by putting in place good credit policy, short cash conversion cycle and an
increase in current ratios.
BACKGROUND OF THE STUDY
Entrepreneurs set up enterprises with the aim of making profit. According to Pimentel et al, (2005),
Profitability can be defined as the final measure of economic success achieved by a company in
relation to the capital invested in it. This economic success is determined by the magnitude of the net
profit.
Owolabi and Obida (2012) also defined profitability as the ability to make profit from all the business
activities of an enterprise. It measures management efficiency in the use of organizational resources in
adding value to the business. Profitability may be regarded as a relative term measurable in terms of
profit and its relation with other elements that can directly influence the profit. Profitability is the
relationship of income to some balance sheet measure which indicates the relative ability to earn
income on assets.
According to Shim and Siegel (2000) accounting liquidity is the company‘s capacity to liquidate
maturing short-term debt (within one year). Maintaining adequate liquidity is much more than a
corporate goal, it is a condition without which the continuity of a business is at risk.
Liquidity is defined by the relative ease, cost, and speed with which an asset can be converted into
cash (Bodie& Merton, 2000). The objective of liquidity management, in the words of Gallinger&
Healey (1991), is ―to provide for adequate availability and safekeeping of corporate funds under
varied economic conditions in order to help achieve the desired corporate objectives of shareholder‘s
wealth maximization‖.
The management of Liquidity involves managing inventories, accounts receivable and payable, and
cash (Kishore, 2008).
Liquidity Management refers to all management decisions and actions that influence the size and
effectiveness of liquidity. It emphasizes the management of current assets, current liabilities and the
relationship that exist between them. The effect of liquidity management involves planning and
controlling current assets and current liabilities in such a manner that eliminates the risk of the
inability to meet due short term obligations.

Emmanuel Opoku Ware “Liquidity Management and Its Effect on Profitability in a Tough Economy: (A
Case of Companies Listed on the Ghana Stock Exchange)”
35 International Journal of Research in Business Studies and Management V2 ● I11 ● November 2015
The main objective of companies operating in capitalist economies is to achieve an appropriate return
over the amount of risk accepted by the shareholders. After all, profit is the propulsive element of any
investments in different projects.
The assessment of profitability is usually done through the ROA (Return on Assets = Net Income /
Total Assets) and ROE (Return on Equity = Net Income / Equity), which is the ultimate measure of
economic success (Damilola, 2007).
Liquidity is a necessity for the survival of the firm. While comparing liquidity with profitability,
liquidity gets higher priority. No firm will continue to exist if it has no liquidity. Firms which do not
make profit may be treated as under par but not having liquidity may cease to operate over a period
(Agarwal& Mishra 2007).
According to AssafNeto (2003), the greater the amount of funds invested in current assets, the lower
the profitability, and by the same time the less risky is the working capital strategy. In this situation,
the returns are lower in the case of a greater financial slack, in comparison to a less liquid working
capital structure. Conversely, a smaller amount of net working capital, while sacrificing the safety
margin of the company, by raising its insolvency‘s risk, positively contributes to the achievement of
larger return rates, since it restricts the volume of funds tied up in assets of lower profitability. This
risk-return ratio behaves in a way that no change in liquidity occurs without the consequence of an
opposite move in profitability.
Marques and Braga (1995) confirmed the inverse relationship between liquidity and profitability for a
sample of food companies. Blatt (2001), also confirmed a negative relationship between liquidity and
profitability, measured by Dynamic Model and profitability.
However, Perobelli et al. (2007) argued that on the long-term, there is a necessity to achieve a balance
between the financial and economic profile. For these authors, liquidity and financial position
reflected in return on equity, which also contains the effect of financial leverage, are two sides of a
coin which is the economic and financial health of companies. One thing to note is that the
appropriate return allows the self-financing of business operations through the retained portion of net
profit. Thus, good profitability increases the liquidity and marketability promotes proper growth and
future profitability.
Liquidity management is a concept that is receiving serious attention all over the world especially
with the current financial situations and the state of the world‘s economy. The concern of business
owners and managers all over the world is to devise a strategy of managing their day to day
operations in order to meet their obligations as they fall due and increase profitability and
shareholder‘s wealth. It is on this note that the study is being carried out to ascertain the relationship
between liquidity and profitability of companies listed on the Ghana Stock Exchange.
Statement of the Problem
Business financing, especially at the wake of the global financial crisis, has become a major source of
concern for business managers as bank loans are becoming too expensive to maintain as a result of
tightening of both the local and international financial market and the reluctance of the public to
invest in the share of companies sequel to the crash of the capital market. These situations compel
business managers to device various strategies of managing internally generated revenue to enhance
their chances of making profit and meeting existing shareholders expectations.
Liquidity management and profitability are very important issues in the growth and survival of
business and the ability to handle the trade-off between the two a source of concern for financial
managers.
One of the major reasons that may cause liquidation is illiquidity and inability to make adequate
profit. These are some of the basic ingredient of measuring the ―going concern‖ of an establishment.
For these reasons companies are developing various strategies to improve their liquidity position.
Strategies which can be adapted within the firm to improve liquidity and cash flows concern the
management of working capital, areas which are usually neglected in times of favorable business
conditions (Pass & Pike 1984). The problem to be addressed by this study is to evaluate the
relationship between liquidity management and profitability of institutions listed on the Ghana Stock
Exchange.

Emmanuel Opoku Ware “Liquidity Management and Its Effect on Profitability in a Tough Economy: (A
Case of Companies Listed on the Ghana Stock Exchange)”
International Journal of Research in Business Studies and Management V2 ● I11 ● November 2015 36
Purpose of the Study
The purpose of the study is to determine the relationship between Liquidity and Profitability of
institutions listed on the Ghana Stock Exchange.
Specifically, the research seeks to:
1. Determine the relationship between Liquidity measured by Cash Conversion Cycle, Average
Receivable Period and Average Payment Period on the profitability of listed institutions on the
Ghana Stock exchange.
2. To determine the direction of the relationship between Liquidity and Profitability. That is whether
there is a positive or negative relationship between them.
Significance of the Study
The relationship between Liquidity and profitability of institutions listed on the Ghana Stock
Exchange is being researched into since it is of critical importance and it will consistently help
institutions maintain proper balance between current assets and current liabilities to enable them meet
their day to day financial obligation.
The study is intended to broaden existing knowledge and also serve as a basis for other research in
this area of study.
Research Question and Hypotheses
Research question
The research question for the study is;
What is the relationship between Liquidity and the Profitability of institutions listed on the Ghana
stock exchange?
Hypotheses
Ho: There is a statistically significant relationship between profitability of institutions listed on the
Ghana Stock Exchange.
H1: There is no statistically significant relationship between profitability of institutions listed on the
Ghana Stock Exchange.
Methodology
Research Approach and Design
In this study, the researcher will apply quantitative approach and correlation design in ascertaining the
relationship between institutions listed on the Ghana Stock Exchange. Owolabi&Obida ( 2012) in
ascertaining the relationship between liquidity and profitability on some manufacturing companies
listed on the Nigerian Stock Exchange used the same approach. They stated that according to
Damilola, 2007 the liquidity management of a company could be measured in term of it Debtors
Collection Period (DCP), Creditors Payment Period (CPP) and Cash Conversion Cycle (CCC).
Profitability in the other hand could be measured using the Return on Investment Ratio (ROI), Return
on Equity (ROE) and Return on Asset (ROA). Return on Asset, Return on equity and Return on
investment are part of the group of ratios called the profitability and efficiency ratio. These classes of
ratios judge the relative profitability and efficiency of utilization of resources of a business.
Renato (2010) used qualitative approach and he also used the correlation design in evaluating the
relationship between liquidity and profitability of airline companies.
We will therefore use both quantitative and descriptive techniques for the study. This will involve a
cross sectional collective data from the annual financial report of all listed institutions on the Ghana
Stock Exchange. The researchers will use secondary data to establish the relationship between
liquidity and profitability.
Data source and collection
Time series data will be extracted from the financial statements of the listed institution over the period
2005 to 2009.The financial data used in the study will be acquired from the Ghana Stock Exchange
(GSE).

Emmanuel Opoku Ware “Liquidity Management and Its Effect on Profitability in a Tough Economy: (A
Case of Companies Listed on the Ghana Stock Exchange)”
37 International Journal of Research in Business Studies and Management V2 ● I11 ● November 2015
The population of the study will be institutions listed on the Ghana Stock Exchange. In all there are
thirty-three (33) institutions on the Ghana Stock Exchange.
Analytical Technique
The regression, descriptive statistics and correlation analysis will be used. The regression model will
be estimated with the ordinary least squares technique by pulling together the data. The usual
assumption of linearity and no presence of multicollinearity will be made and tested. The summary
statistics to be used to describe the data includes mean, standard deviation, mode and median. The
hypothesis will be tested using the t-values and the associated probability. The SPSS will be used for
the estimation.
Limitations of the Study
The study is challenged by the following limitations;
Access to data
The researcher has problems with accessing data for the project work. For this reason the study may
not portray a fair picture of the problem.
Time Constraints
The time frame for this project work is very limited coupled with the fact that the researcher has other
academic responsibilities.
Scope and Organization of the Study
The research will be written and presented in Five Chapters:
Chapter One gives an overview of the background of the study and also outlines the research question
and the null hypothesis of the study and defines the purpose, the aim, the significance of the study, the
condensed mythology and the condensed literature. It also outlines the research question and the null
hypothesis of the study.
Chapter Two contains the literature review thus both theoretical and empirical literature as well as
operational definitions .This chapter outlines relevant theories from different authors based on the
research topic and also relevant empirical works.
Chapter Three is the methodology. It contains the plan that outlines the various activities needed to do
an analysis in order to address the research question.
Chapter Four comprises the data analysis and interpretation.
Chapter Five contains the summaries, discussions, conclusion and recommendations.
LITERATURE REVIEW
Introduction
This chapter reviews existing theoretical and empirical literature on the relationship between liquidity
and profitability of institutions listed on the Ghana Stock Exchange. The theoretical literature
provides information on the concept of liquidity management, debtors‘ collection period, creditors‘
payment period and cash conversion cycle and some relevant principles on liquidity management
from various authors. Theoretical literature also provides the concept of profitability using the return
on investment ratios, return on equity and return on assets. The empirical literature on the other hand
gives the practical studies conducted by some researchers on the relationship between liquidity and
profitability of institutions listed on the stock exchange.
Theoretical Literature
Definition of Liquidity
Liquidity is defined by the relative ease, cost, and speed with which an asset can be converted into
cash (Bodie& Merton, 2000).
Mayo (2003) also defined liquidity as the ease with which assets can be converted into cash with little
risk of loss of principal.

Emmanuel Opoku Ware “Liquidity Management and Its Effect on Profitability in a Tough Economy: (A
Case of Companies Listed on the Ghana Stock Exchange)”
International Journal of Research in Business Studies and Management V2 ● I11 ● November 2015 38
Brigham & Houston (2001) added on that liquidity is the ease of selling the asset and converting it to
cash at a fair market value.
Shim and Siegel (2000) on the other hand defined accounting liquidity as the company‘s capacity to
liquidate maturing short-term debt (within one year). Maintaining adequate liquidity is much more
than a corporate goal, it is a condition without which the continuity of a business is at risk.
2.1.2 Liquidity management
Liquidity Management refers to all management decisions and actions that influence the size and
effectiveness of liquidity. It emphasizes the management of current assets, current liabilities and the
relationship that exists between them. Liquidity management involves planning and controlling
current assets and current liabilities in such a manner that eliminates the risk of the inability to meet
due short term obligations.
he firm‘s liquidity management is considered best if it is based on the principle of cash collecting
from debtors early and holdup the payments of current debts and obligations/liabilities as much as
possible (Muneeb&Kashif 2012). When a business firm is not able to manage its liquidity
position it will definitely face difficulty in paying its short term debts and therefore the business may
be forced to resort to external financing to clear its short term debts.
Management will use a combination of policies and techniques for the management of liquidity.
These policies aim at managing the current assets (generally cash and cash equivalents, inventories
and debtors) and the short term financing.
When a business firm is not able to manage its liquidity position it will definitely face
difficulty in paying its short term debts and therefore the business may be forced to resort to external
financing to clear its short term debts(Muneeb&Kashif 2012). They stated that the efficiency of
liquidity management is based on the principle of expediting the collections from debtors‘ as much
as possible and delaying down the cash payments as much as possible.
Current Asset Management
In financial Accounting, assets are economic resources tangible or intangible that is capable of being
owned or controlled to produce value and that is held to have positive economic value.
According to Adelman and Marks (2007), a current asset is an asset on the balance sheet which is
expected to be sold or otherwise used up in the near future, usually within one year, or one operating
cycle whichever is longer and continually change. They are listed on the balance sheet in order of
their liquidity or how fast they can be converted into cash. Current Assets include: cash, debtors,
prepaid expenses and account receivables.
Cash Management
In ordinary language cash refers to money in the physical form of currency, such as banknotes and
coins.
In bookkeeping and finance, cash refers to current assets comprising currency or currency equivalents
that can be accessed immediately or near-immediately (as in the case of money market accounts).
Cash is seen either as a reserve for payments, in case of a structural or incidental negative cash flow
or as a way to avoid a downturn on financial markets.
Brigham & Houston (2001) defined cash management as minimizing the amount of cash the firm
must hold for use in conducting its normal business activities but yet having sufficient cash to take
trade discounts, maintain credit rating and to meet unexpected cash needs. Cash and cash equivalents
are the most liquid assets found within the asset portion of a company's balance sheet. Cash
equivalents are assets that are readily convertible into cash, such as money market holdings, short-
term government bonds or Treasury bills, marketable securities and commercial paper. Cash
equivalents are distinguished from other investments through their short-term existence; they mature
within three months whereas short-term investments are twelve months or less, and long-term
investments are any investments that mature in excess of twelve months.
Another important condition a cash equivalent needs to satisfy is that the investment should have
insignificant risk of change in value; thus, common stock cannot be considered a cash equivalent, but
Emmanuel Opoku Ware “Liquidity Management and Its Effect on Profitability in a Tough Economy: (A
Case of Companies Listed on the Ghana Stock Exchange)”
39 International Journal of Research in Business Studies and Management V2 ● I11 ● November 2015
preferred stock acquired shortly before its redemption date can be. Cash is managed by identifying the
cash balance which allows for the business to meet day to day expenses, but reduces cash holding
costs.
Effective cash management involves investing idle cash in those short-term marketable securities that
offer not only safety of principal but also a positive rate of return. Cash management is a part of
effective liquidity management that involves a trade-off between risk and return .
Other effective cash management as outlined by Brigham & Houston (2001) encompasses proper
management of cash inflows and outflows which entails synchronizing cash flows, using float,
accelerating collections, getting available funds to where they are needed and controlling
disbursements.
Debtors Management
A debtor is an entity that owes a debt to someone else. The entity may be an individual, a firm, a
government, a company or other legal person. The counterparty is called a creditor. Debtors are
people or other firms who owe money to the firm. This will usually happen where the firm has sold
goods with a period of credit. The firm sells the good or service but allows the purchaser a period of
credit to pay - usually a month. During this month the purchaser owes the firm the money and is
therefore a debtor.
If the firm has debts these are considered an asset, because when the debtors pay the firm will have
converted the debt into cash in the bank. Because most debts are relatively short-term they are
considered current assets.
Debtors are managed by identifying the appropriate credit policy, i.e. credit terms which will attract
customers, such that any impact on cash flows and the cash conversion cycle will be offset by
increased revenue and hence return on Capital or vice versa.
Inventory Management.
Inventory means stockbought by an institution in order to resell them. Inventory management
involves the control of the assets that are used in the production process or produced to be sold in the
normal course of the firm‘s operations (Keown et al 1996)
Thus company'smerchandise, raw materials, and finished and unfinished products which have not yet
been sold are termed as inventory. These are considered liquid assets, since they can be converted into
cash quite easily.
Inventory management is primarily about specifying the size and placement of stocked goods which
are required at different locations within a facility or within multiple locations of a supply network to
protect the regular and planned course of production against the random disturbance of running out of
materials or goods.
This would include the monitoring of material moved into and out of stockroom locations and the
reconciling of the inventory balances. Also may include ABC analysis, lot tracking, cycle counting
support etc. Management of the inventories, with the primary objective of determining/controlling
stock levels within the physical distribution function to balance the need for product availability
against the need for minimizing stock holding and handling costs.
Current Liabilities Management
According to Williams et al (2005), a liability is a debt assumed by a business entity as a result of its
borrowing activities or other fiscal obligations (such as funding pension plans for its employees);
liabilities are paid off under either short term or long term arrangements. The amount of time allotted
to pay off the liability is typically determined by the size of the debt, large amount of money are
usually borrowed under long term plans.
Current liabilities are short term obligations that are paid off within one year or one current operating
cycle, whichever is longer. Typical current liabilities include creditors, account payables, accrued
expenses. Current liabilities management consists of minimizing firm‘s obligations and payments for
short-term debt, accrued liabilities and accounts payable. Current liabilities management consists of
short-term debt management, accrued liabilities management and accounts payable management.

Emmanuel Opoku Ware “Liquidity Management and Its Effect on Profitability in a Tough Economy: (A
Case of Companies Listed on the Ghana Stock Exchange)”
International Journal of Research in Business Studies and Management V2 ● I11 ● November 2015 40
Creditors Management
A creditor is a party (e.g. person, organization, company or government) that has a claim to the
services of a second party. It is a person or institution to whom money is owed. The first party, in
general, has provided some property or service to the second party under the assumption (usually
enforced by contract) that the second party will return an equivalent property or service. The second
party is frequently called a debtor or borrower. The first party is the creditor, which is the lender of
property, service or money.
The term creditor is frequently used in the financial world, especially in reference to short term loans,
long term bonds, and mortgage loans. In law, a person who has a money judgment entered in their
favour by a court is called a judgement creditor.
The term creditor is derived from the notion of credit. In modern America, credit refers to a rating
which indicates the likelihood a borrower will pay back his or her loan. In earlier times, credit also
referred to reputation or trustworthiness.
Creditors can be classified as either "personal" or "real". Those people who loan money to friends
or family are personal creditors. Real creditors (i.e. a bank or finance company) have legal contracts
with the borrower granting the lender the right to claim any of the debtor's property used as collateral
if the debtor refuses to pay back the loan.
Account Payables Management
Account payable represents the current liabilities towards suppliers from whom the firm has
purchased raw materials on credit (Pandey 2004). It is sometimes referred to as trade payables. The
account payable is a form of credit that suppliers offer to their customers by allowing them to pay for
a product or service after it has already been received.
The largest portion of accounts payable normally consists of the obligations of a firm that were
obtained by purchasing inventory on credit as well as other items such as travel expenses and
maintenance services. The purpose of managing accounts payable is to minimize the cash paid for
inventories and these other obligations. Because inventories comprise the largest portion of accounts
payable, the firm can normally minimize these cash payments by taking advantage of the discounts
that are offered by vendors.
Working Capital Management Policy
Working capital policy is basically about how much working capital the company should maintain.
Should they go in for a zero-risk arrangement, or can they try a bit of daredevilry in their liquidity
management?
On this base the literature of Pandey (2004) classifies working capital policy into three categories,
Matching, Aggressive and Conservative
Matching policy
A company adopts a financial plan which matches the expectancy life cycle of assets with the
expected life of the sources of capital raised to finance the assets. The justification for the exact
matching is that, since the purpose of financing is to pay for assets, the source of financing and assets
should have the same life cycle. However, it should be realized that exact matching will be impossible
because of the uncertainty about the life expectancy of assets (Pandey 2004)
Aggressive policy
A company can follow aggressive policy by financing its current assets with short term debt because
it gives the low interest rate but the risk associated with short term debt is higher than the long term
debt. This approach is very risky because the difference between short term or liquid assets and short
term liabilities turns very little. Such a policy is adopted by the company which is operating in a
stable economy and is quite certain about future cash flows. A company with aggressive working
capital policy offers short credit period to customers, holds minimal inventory and has a small amount
of cash in hand.
Conservative Working Capital Policy
In this policy, you not only match the current assets and the current liabilities, but you also keep a
little safety net just in case of any uncertainty. Undoubtedly, this is the lowest risk working capital

Emmanuel Opoku Ware “Liquidity Management and Its Effect on Profitability in a Tough Economy: (A
Case of Companies Listed on the Ghana Stock Exchange)”
41 International Journal of Research in Business Studies and Management V2 ● I11 ● November 2015
policy, but it reduces the money used in increasing the production some companies want neither to be
aggressive by reducing the level of current assets as compared to current liabilities nor to be defensive
by increasing the level of current assets as compared to current liabilities. So, In order to balance the
risk and return these firms are following the moderate or conservative approach. This approach is a
mixture of matching and aggressive policy. In these approach temporary current assets, assets which
appear on the balance sheet for short period will be financed by the short term borrowings and long
term debts are used to finance fixed assets and permanent current assets.
Liquidity Ratios
Current ratio
The current ratio is an indication of the extent with which current liabilities, which must be paid
within is year, are covered by current assets by current assets (Mayo 2003). It is a firm's market
liquidity and ability to meet creditor's demands. Acceptable current ratios vary from industry to
industry. If a company's current ratio is in this range, then it is generally considered to have good
short-term financial strength. If current liabilities exceed current assets (the current ratio is below 1),
then the company may have problems meeting its short-term obligations. If the current ratio is too
high, then the company may not be efficiently using its current assets or its short-term financing
facilities. This may also indicate problems in liquidity management.
The current ratio is a financial ratio that measures whether or not a firm has enough resources to pay
its debts over the next 12 months. It compares a firm's current assets to its current liabilities.
Low values for the current or quick ratios (values less than 1) indicate that a firm may have difficulty
meeting current obligations. Low values, however, do not indicate a critical problem. If an
organization has good long-term prospects, it may be able to borrow against those prospects to meet
current obligations. Some types of businesses usually operate with a current ratio less than one.
For example, if inventory turns over much more rapidly than the accounts payable become due, then
the current ratio will be less than one. This can allow a firm to operate with a low current ratio.
It is expressed as follows:
Current ratio = Current asset
Current liability
Quick Ratio
Mayo (2003) defined current ration as an indicator of the company‘s ability to meet its current
liabilities as they become due, hat determines whether a firm has enough short-term assets to cover its
immediate liabilities without selling inventory. The acid-test ratio is far more strenuous than the
working capital ratio primarily because the working capital ratio allows for the inclusion of inventory
assets. Current assets includes inventory and prepaid expenses, which are relatively illiquid compared
to cash, short-term investments, and accounts receivable hence, a better measure of liquidity for
companies with large inventories or prepaid expenses is the quick ratio (acid-test ratio, quick asset
ratio), which is the same as the current ratio, but without the value of inventory and prepaid expenses
in the numerator.
Calculated by:
Quick Ratio = Current Assets – Inventory
Current Liabilities
Measures of Liquidity Management
The liquidity of a company is measured with use of some financial ratios refers to as
liquidity ratios. These group of ratios measures the ability of the firms to meet its current
obligations (Liabilities).Analysis of liquidity needs the preparation of cash budgets and cashflow
statement; but liquidity ratio, by establishing a relationship between cash and other current assets to
current obligations, provided a quick measure of liquidity (Pandy 2005). The most common ratios,
which indicate the extent of liquidity or lack of it, are:
Cash Conversion Cycle
The Cash Conversion Cycle (CCC) measures how long a firm will be deprived of cash if it increases
its investment in resources in order to expand customer sales. It is thus a measure of the liquidity risk
entailed by growth.

Emmanuel Opoku Ware “Liquidity Management and Its Effect on Profitability in a Tough Economy: (A
Case of Companies Listed on the Ghana Stock Exchange)”
International Journal of Research in Business Studies and Management V2 ● I11 ● November 2015 42
As cited by Muneeb&Kashif 2012, Besley and Brigham (2005) describe cash conversion cycle as ―the
length of time from the payment for the purchase of raw materials to manufacture a product until the
collection of account receivable associated with the sale of the product.‖
However, shortening the CCC creates its own risks: while a firm could even achieve a negative CCC
by collecting from customers before paying suppliers, a policy of strict collections and lax payments
is not always sustainable.
The term "cash conversion cycle" refers to the time span between a firm's disbursing and collecting
cash. However, the CCC cannot be directly observed in cash flows, because these are also influenced
by investment and financing activities; it must be derived from Statement of Financial Position data
associated with the firm's operations.
Cash Conversion Cycle must be calculated by tracing a change in cash through its effect upon
receivables, inventory, payables, and finally back to cash—thus, the term cash conversion cycle, and
the observation that these four accounts "articulate" with one another.
Besley and Brigham (2005) acknowledged that to account for the efficiency of the firm‘s cash
management, the practitioners and researchers use the cash conversion cycle (CCC) parameter by
considering the variables of inventory conversion, debtors conversion and the payables
conversion. The CCC is calculated by taking into account the
1. Debtors conversion period,
2. Payables conversion period, and
3. Inventory conversion period.
CCC = inventory conversion period + debtors conversion period – payables conversion period
2.6.2 Average Collection Period or Debtors Collection Period.
This ratio shows number of days it takes an organization to recover it credit sales. The shorter the
period, the better for the organization. Account receivables with longer recoverable period posses the
risk of bad debt for the company and also affects liquidity in the short run (Owalabi and Obida 2012)
DCP ratio is calculated by dividing Trade debtors by Turnover and multiply by 365:
DCP = Average Trade Debtors × 365 Days
Turnover
The average collection period is the number of days on average that it takes a company to collection
of its credit accounts or its accounts receivables. In other words, the average collection period of
accounts receivable is the average number of days required to convert receivables into cash.
2.6.3 Average Payment Period (APP) or Creditors Payment Period (CPP)
This ratio shows the number of days the company is required to settle its short term obligations. The
longer the period the better for the company as it gives the company leverage to recover it
receivables. Where the period is shorter than the debtors‘ collection period it exacts pressure on the
liquidity of the company (Owalabi and Obida 2012)
CPP ratio is calculated by dividing Average Trade Creditors by Cost of Goods Sold and
multiply the 365 days.
CPP = Average Trade Creditors × 365 Days
Cost of Goods Sold
It is a short-term liquidity measure used to quantify the rate at which a company pays off its suppliers.
Accounts payable turnover ratio is calculated by taking the total purchases made from suppliers and
dividing it by the average accounts payable amount during the same period. The measure shows
investors how many times per period the company pays its average payable amount.
The average payment period ratio represents the number of days by the firm to pay its creditors. A
high creditor‘s turnover ratio or a lower credit period ratio signifies that the creditors are being paid
promptly.
The Relationship between Liquidity and Profitability
Management of short-term assets and liabilities warrants a careful investigation since the liquidity
management plays an important role in a firm‘s profitability and risk as well as its value (Smith,
1980). Efficient management of liquidity is a fundamental part of the overall corporate strategy in

Emmanuel Opoku Ware “Liquidity Management and Its Effect on Profitability in a Tough Economy: (A
Case of Companies Listed on the Ghana Stock Exchange)”
43 International Journal of Research in Business Studies and Management V2 ● I11 ● November 2015
creating the shareholders‘ value. Firms try to keep an optimal level of working capital that maximizes
their value (Deloof, 2003).
In general, from the perspective of Chief Financial Officer (CFO), liquidity management is a simple
and straightforward concept of ensuring the ability of the organization to fund the difference between
the short-term assets and short-term liabilities.
However, a ‘Total‘ approach is desired as it can cover all the company‘s activities relating to vendor,
customer and product. In practice, liquidity management has become one of the most important issues
in the organizations where many financial executives are struggling to identify the basic working
capital drivers and an appropriate level of working capital.
Consequently, companies can minimize risk and improve the overall performance by understanding
the role and drivers of liquidity management. A firm may adopt an aggressive liquidity management
policy with a low level of current assets as a percentage of total assets, or it may also be used for the
financing decisions of the firm in the form of high level of current liabilities as a percentage of total
liabilities.
Excessive levels of current assets may have a negative effect on the firm‘s profitability, whereas a low
level of current assets may lead to a lower level of liquidity and stock outs, resulting in difficulties in
maintaining smooth operations.
The main objective of liquidity management is to maintain an optimal balance between each of the
working capital components. Business success heavily depends on the financial executives‘ ability to
effectively manage receivables, inventory, and payables.
Profitability
Owolabi&Obida (2012) defined profitability as the ability to make profit from all the business
activities of an organization, company, firm, or an enterprise. It measures management efficiency
in the use of organizational resources in adding value to the business. profitability may be
regarded as a relative term measurable in terms of profit and its relation with other elements
that can directly influence the profit. Profitability is the relationship of income to some balance
sheet measure which indicates the relative ability to earn income on assets. Irrespective of the fact that
profitability is an important aspect of business, it may be faced with some weakness such window
dressing of the financial transactions and the use of different accounting principles.
Financial Effect on Profitability
Business managers should understand not only how to make profit, but also the financial effects of
making profit. Profit does not simply mean an increase in cash. Sales revenue and expenses affect
several assets other than cash and operating liabilities.
Making profit involves additional transactions that are closely allied with sales and expenses. These
tightly connected transactions include the following:
• Collecting cash from customers for credit sales made to them, which takes place after recording the
sales revenue.
• Purchasing (or manufacturing) products that are put in inventory and held there until the products
are sold sometime later, at which time the cost of products sold is charged to expense in order to
match up with the revenue from the sale.
• Paying certain costs in advance of when they are charged to expense.
• Paying for products bought on credit and for other items that are not charged to expense until
sometime after the purchase.
• Paying for expenses that have been recorded sometime earlier.
• Making payments to the government for income tax expense that has already been recorded.
These allied transactions are the ―before and after‖ of recording sales and expense transactions. The
allied transactions are not reported as such in a financial statement. However, the allied transactions
change assets and liabilities, and they definitely affect cashflow.
2.8.2 Measures of Corporate Profitability
A company should earn profit to survive and grow over a long period of time (Owolabi&Obida 2012).
They further stated that profits were essential, but all management decision should not be profit
centered at the expense of the concerns for stakeholders such as customers, employees, suppliers

Emmanuel Opoku Ware “Liquidity Management and Its Effect on Profitability in a Tough Economy: (A
Case of Companies Listed on the Ghana Stock Exchange)”
International Journal of Research in Business Studies and Management V2 ● I11 ● November 2015 44
or social consequences. Owulabi and Obida (2012) further stated that profit is the difference between
revenues and expenses over a period of time (usually one year). Profit is the ultimate ‗output‘ of a
company, and it will have nofuture if it fails to make sufficient profits. The profitability ratios are
calculated to measure the operating efficiency of the company. Some the profitability ratios include
the following:
Return on Investment (ROI)
According to Owulabi and Obida (2012) the term investment may refer to total assets or net assets.
The funds employed in net assets in are known as capita employed. Net assets equal net fixed
assets plus current assets minus current liabilities excluding bank loan. The conventional
approach of calculating return on investment is to divide profit after tax (PAT) by investment.
Investment refers to pool of funds supplied by shareholders and lenders, while PAT represents residue
income of shareholders. The formula of ROI is stated thus:
Return on Investment = Profit After Tax
Net Assets
Return on Equity (ROE)
Mayo (2003) defined return on equity as the sum of stock, additional paid-in capital if any and
retained earnings if any. He said it measures the amount that the firm is earning on stockholders
investment. The rate of dividend is not fixed; the earnings may be distributed to shareholders or
retained in the business. Nevertheless, the net profit after tax represents their return. A return on
shareholder‘s equity is calculated to see the profitability of owners‘ investment. The shareholders‘
equity or net worth will include paid up share capital, share premium and reserves and surplus less
accumulated losses. The ROI is net profit after taxes divided by shareholders‘ equity which is given
by net worth. It is being computed as follows:
Return on Equity = Profit After Taxes
Equity (Net Worth)
Return on Assets (ROA)
Return on Assets expresses the net income earned by a company as a percentage of the total
assets available for use by that company (Owulabi&Obida 2012). ROA suggests that companies with
higher amounts of assets should be able to earn higher levels of income. ROA measures
management‘s ability to earn a return on the firm‘s resources (assets). The income amount used in
this computation is income before the deduction of interest expense, since interest is the return to
creditors for the resources that they provide to the firm. The resulting adjusted income amount is
thereby the income before any distribution to those who provided funds to the company. ROA is
computed by dividing net income plus interest expense by the company‘s average investment in asset
during the year.
Return on Assets = Profit Before Taxes
Total Assets
Empirical Literature
Marques and Braga (1995) confirmed the inverse relationship between liquidity and profitability for a
sample of food companies. Blatt (2001), also confirmed a negative relationship between liquidity and
profitability, measured by Dynamic Model and profitability.
However, Perobelli et al. (2007) argued that on the long-term, there is a necessity to achieve a balance
between the financial and economic profile. For these authors, liquidity and financial position
reflected in return on equity, which also contains the effect of financial leverage, are two sides of a
coin which is the economic and financial health of companies. One thing to note is that the
appropriate return allows the self financing of business operations through the retained portion of net
profit. Thus, good profitability increases the liquidity and marketability promotes proper growth and
future profitability.
Lairodi and et.al (1999) studied in a research the relation between liquidity and leverage ratios and
profitability in companies of London Stock Exchange in period of 1993-1997. The results of their
research showed that cash conversion cycle, current ratio and liquid ratio have a negative and

Emmanuel Opoku Ware “Liquidity Management and Its Effect on Profitability in a Tough Economy: (A
Case of Companies Listed on the Ghana Stock Exchange)”
45 International Journal of Research in Business Studies and Management V2 ● I11 ● November 2015
significant relationship with profitability ratios including net profit margin ratio, assets return ratio
and equities return ratio. Also, there is a positive and significant relationship between cash conversion
cycle and current and liquid ratios and accordingly the increase of current and liquid ratios must not
be assumed as improved liquidity status since simultaneous increase of cash conversion cycle suggest
that liquidity status become worse.
Liarodi&Lazaridis (2000) also studied in a research the relationship between liquidity and leverage
ratios and profitability for 82 companies of Food Industry of Greece Stock Exchange in 1997 and
found that there is a positive and significant relationship between cash conversion cycle and assets
return ratio. Also, there is a positive and significant relationship between cash conversion cycle and
current and liquid ratios.
A study carried out on the relationship between liquidity management and company profitability and
value for Japanese and Taiwanese companies in period of 1985-1996 (Wang 2002). The results of his
research showed that there is a negative and significant relationship between cash conversion cycle
and profitability indices (equities return ratio and assets return ratio). Additionally, brave liquidity
management occurring by decreasing cash conversion cycle results in improved company
performance and accordingly increased company value.
Eljelly (2004) also confirmed in a study in a research the relationship between liquidity and
profitability for 29 corporations of Saudi Arabia in period of 1996-2000 the negative and significant
relationship between profitability and companies liquidity level having being measured by current
ratio and cash conversion cycle.
Sharma and Kumar (2011) concluded that there is no significant relationship between cash conversion
cycle and profitability (assets return) through studying the relationship between working capital
management and profitability.
METHODOLOGY
Research Design
The aim of the study was to determine the relationship between liquidity and profitability of
institutions listed on the Ghana Stock Exchange and its effect on profitability in a tough economy.
The research question for the study was: What is the relationship between Liquidity and Profitability
of institutions listed on the Ghana stock exchange?
The research was a causal design based on an in-depth analysis of the relationship between Liquidity
and Profitability of listed institutions in Ghana.
Both quantitative and descriptive techniques were used for the study. It was a cross sectional
collective data from the annual financial report of all listed institutions.
The researcher used secondary data to establish the relationship between liquidity and profitability.
Population of the Study
The population of the study was institutions listed on the Ghana Stock Exchange. In all there were
thirty-three (33) institutions on the Ghana Stock Exchange. Due to the small population size and large
variations among these institutions listed on Ghana Stock Exchange, the researcher carried out a
census study. Thus all the institutions listed on the Ghana Stock Exchange were used.
Data Source and Collection
Time series data was extracted from the financial statements of the listed financial institution over the
period 2005 to 2009.The financial data used in the study was acquired from the Ghana Stock
Exchange (GSE) and the individual companies.
The financial statements of listed institutions for the most recent five years were used to compute
profitability and liquidity ratios for the regression and correlation analysis. The data extracted for the
analysis covered a period of five years starting from 2005 to 2009.
Model of Specification
The model used for the estimation was adopted from Samiloglu and Demirgunes, (2008) which is
presented as follows:

Emmanuel Opoku Ware “Liquidity Management and Its Effect on Profitability in a Tough Economy: (A
Case of Companies Listed on the Ghana Stock Exchange)”
International Journal of Research in Business Studies and Management V2 ● I11 ● November 2015 46
ROA it =β0 + β1 (WCit) + β2 (DEBT it) + β3 (FIX it) +β4 (SIZE it) + β5 (GROWTH it) + ε
In the above model, WCit represents the measures of Working Capital Management which are;
• Cash Conversion Cycle (CCC)
• Average Receivable Period (ARP)
• Average Payment Period (APP)
This model is re-written using the measures of Working Capital Management as;
Model 1: ROAXt=β0 + β1(CCCXt) + β2 (DEBT Xt) + β3 (FIX Xt) +β4 (SIZE Xt) + β5 (GROWTHxt) + ε
Model 2: ROAXt=β0 + β1(ARPXt) + β2 (DEBT Xt) + β3 (FIX Xt) +β4 (SIZE Xt) + β5 (GROWTHxt) + ε
Model 3: ROAXt=β0 + β1(APPXt) + β2 (DEBT Xt) + β3 (FIX Xt) +β4 (SIZE Xt) + β5 (GROWTH xt) + ε
Where;
ROAit is the return on asset of firm i at time t
ROA = Net Income/Total Asset
β0: the intercept of the equation
CCC = Cash Conversion Cycle
ARP= Average Receivable Period
APP= Average Payment Period
DEBT= Debt Ratio
SIZE = InTotal Assets Natural Logarithm of Total Assets
FIX= Financial Assets/ Total Assets
GROWTH = Interest Received-Interest Receivedt-1/Interestt-1
t: time = 1, 2…5 years.
i: Financial Institutions = 1,2,…,9 firms.ε: The error term.
Since we were researching on the relationship between liquidity and profitability, we intended to
change the variables to suite our research. The model was presented as follows:
ROE it= β0 + β1 (Lit) + β2 (SIZE it) + β3 (GROWTH it) + ε
In the above model, Lit will be represented by measures of Liquidity which are;
• Cash Conversion Cycle (CCC)
• Average Collection Period (ACP)
• Average Payment Period (APP)
This model was re-written using the measures of Liquidity as;
Model 1: ROE it= β0 + β1 (CCCit) + β2 (SIZE it) + β3 (GROWTH it) + ε
Model 2: ROE it= β0 + β1 (ACPit) + β2 (SIZE it) + β3 (GROWTH it) + ε
Model 3: ROE it= β0 + β1 (APPit) + β2 (SIZE it) + β3 (GROWTH it) + ε
Where;
ROEit is the return on equity of firm i at time t
ROE = Profit after Taxes / Equity (Net Worth)
β0: the intercept of the equation
CCC = Cash Conversion Cycle
ACP= Average Collection Period

Emmanuel Opoku Ware “Liquidity Management and Its Effect on Profitability in a Tough Economy: (A
Case of Companies Listed on the Ghana Stock Exchange)”
47 International Journal of Research in Business Studies and Management V2 ● I11 ● November 2015
APP= Average Payment Period
SIZE = InTotal Assets Natural Logarithm of Total Assets
GROWTH = Interest Received-Interest Receivedt-1/Interestt-1
t: time = 1, 2…5 years.
i: Institutions = 1,2,…,36 firms.
ε: The error term.
Analytical Technique
In addition to the regression, descriptive statistics and correlation analysis were used.The regression
model was estimated with the ordinary least squares technique by pulling together the data. The usual
assumption of linearity and no presence of multicollineary were made and tested. The summary
statistics used to describe the data included mean, standard deviation, mode and median. The
hypothesis was tested using the t-values and the associated probability. The SPSS was used for the
estimation.
DATA PRESENTATION, ANALYSIS AND FINDINGS
Introduction
This report covers the statistical analysis and interpretation of fitting regression models between
Liquidity and profitability of listed institutions in Ghana. The models are to identify which liquidity
indicator has a strong influence in predicting the profitability of listed firms in Ghana. The return on
equity (ROE) is used as a measure of the companies‘ profitability and acts as the dependent variable
in the regression model while the key predictive indicators of liquidity are CCC, ACP, APP, SIZE and
GROWTH.
Table1. Descriptive Statistics
N Minimum Maximum Mean Std. Deviation
ROE 165 -93.1244 106.5800 9.997224 26.3410032
CCC 165 -359.3667 445.7706 58.300907 123.8731447
ACP 165 .7289 359.1600 81.443793 62.2668549
APP 165 .6134 728.1070 102.883139 116.0901136
GROWTH 165 -.9568 11.3167 .236059 .9659804
SIZE 165 8.9947 26.0068 17.324035 3.3030107
Valid N (list wise) 165
a. Dependent Variable: ROE
Source: Field data, 2013.
Table 1 provides a summary of the descriptive statistics of the dependent and independent variables
for the listed firms in Ghana. It shows the average indicators of variables computed from the financial
statements. The profitability rate measured by the return on Equity (ROE) reveals an average of
9.99%. This indicates a poor return on Equity of the sampled firms during the five year period. This
can be linked to the sharp economic downturn experienced by the global economy during this period.
The variable Cash Conversion Cycle (CCC) as a measure of Liquidity has an average of 58.3; the
value indicates that, it takes an average listed firm approximately 58 days to convert their activities
into cash.
The Average Collection Period (ACP) which is also a measure of Liquidity has an average of 81.44.
This implies that, on the average it takes a listed firm approximately 81 days to receive money due it
within a year.
The Average Payment Period (APP) also has average of 102.88. This indicates that, it takes listed
companies approximately 103 days to make payments that are due to other entities in a year.
The average size and growth of the listed Ghanaian firms is about 17 and 24% respectively. Size and
the growth of the firms were determined using the log of total assets and growth in income

Emmanuel Opoku Ware “Liquidity Management and Its Effect on Profitability in a Tough Economy: (A
Case of Companies Listed on the Ghana Stock Exchange)”
International Journal of Research in Business Studies and Management V2 ● I11 ● November 2015 48
respectively. The average figures indicate that most of the sampled firms are large in nature. Also, it is
indicative that Ghanaian firms saw an average growth over the period studied.
Fitting the Linear Regression Models
The proposed model is of the form;
Model: ROE it= β0 + β1 (CCCit) + β2 (ACPit) + β3 (APPit) + β4 (SIZE it) + β5 (GROWTH it) + ε
Where;
ROEit is the return on equity of firm i at time t
ROE = Profit After Taxes / Equity (Net Worth)
β0: the intercept of the equation
CCC = Cash Conversion Cycle
ACP= Average Collection Period
APP= Average Payment Period
SIZE = InTotal Assets Natural Logarithm of Total Assets
GROWTH = Interest Received-Interest Receivedt-1/Interestt-1
t: time = 1, 2…5 years.
i: Institutions = 1,2,…,33 firms.
ε: The error term.
Test for Assumption of Linearity and Multicollinearity
Linear regression model is based on the assumption that, there is a linear relationship between the
dependent variable and the independent variable(s). Thus, the existence of significant regression
model is largely based on the existence of linear relationship between the dependent variable and each
of the independent variable.
Another condition that can be challenging is multicollinearity, which sometimes can lead to
inaccurate and misleading results. Multicollinearity or collinearity occurs when there are high inter-
correlations among some set of the predictor or independent variables. The existence of collinearity
means that, two or more predictors contain much of the same information. In assessing the linearity
and the collinearity of the data, a correlation matrix on all the variables is computed and the results are
as summarized in table 2.
Table2. Correlation Matrix
Correlations
ROE CCC ACP APP GROWTH SIZE
ROE Pearson Correlation 1 -0.117 -0.01 -0.103 0.069 0.037
Sig. (2-tailed) 0.133 0.894 0.186 0.379 0.633
N 165 165 165 165 165 165
CCC Pearson Correlation -0.117 1 -0.026 -.509** 0.01 0.014
Sig. (2-tailed) 0.133 0.739 0 0.896 0.861
N 165 165 165 165 165 165
ACP Pearson Correlation -0.01 -0.026 1 .454** 0.123 -0.145
Sig. (2-tailed) 0.894 0.739 0 0.116 0.064
N 165 165 165 165 165 165
APP Pearson Correlation -0.103 -.509** .454** 1 0.085 -0.119
Sig. (2-tailed) 0.186 0 0 0.278 0.128
N 165 165 165 165 165 165
GROWTH Pearson Correlation 0.069 0.01 0.123 0.085 1 0.016
Sig. (2-tailed) 0.379 0.896 0.116 0.278 0.839
N 165 165 165 165 165 165
SIZE Pearson Correlation 0.037 0.014 -0.145 -0.119 0.016 1
Sig. (2-tailed) 0.633 0.861 0.064 0.128 0.839
N 165 165 165 165 165 165

Emmanuel Opoku Ware “Liquidity Management and Its Effect on Profitability in a Tough Economy: (A
Case of Companies Listed on the Ghana Stock Exchange)”
49 International Journal of Research in Business Studies and Management V2 ● I11 ● November 2015
ROE CCC ACP APP GROWTH SIZE
ROE Pearson Correlation 1 -0.117 -0.01 -0.103 0.069 0.037
Sig. (2-tailed) 0.133 0.894 0.186 0.379 0.633
N 165 165 165 165 165 165
CCC Pearson Correlation -0.117 1 -0.026 -.509** 0.01 0.014
Sig. (2-tailed) 0.133 0.739 0 0.896 0.861
N 165 165 165 165 165 165
ACP Pearson Correlation -0.01 -0.026 1 .454** 0.123 -0.145
Sig. (2-tailed) 0.894 0.739 0 0.116 0.064
N 165 165 165 165 165 165
APP Pearson Correlation -0.103 -.509** .454** 1 0.085 -0.119
Sig. (2-tailed) 0.186 0 0 0.278 0.128
N 165 165 165 165 165 165
GROWTH Pearson Correlation 0.069 0.01 0.123 0.085 1 0.016
Sig. (2-tailed) 0.379 0.896 0.116 0.278 0.839
N 165 165 165 165 165 165
SIZE Pearson Correlation 0.037 0.014 -0.145 -0.119 0.016 1
Sig. (2-tailed) 0.633 0.861 0.064 0.128 0.839
N 165 165 165 165 165 165
**. Correlation is significant at the 0.01 level (2-tailed).
It can be observed from the correlation matrix that, none of the independent variables tends to have
strong linear relationship with ROE, as indicated by their Pearson correlation coefficient which are
less than 50% indicating insignificant associations.
However, it can be observed that there exist significant correlation among some of the independent
variable especially between CCC and APP and that of ACP and APP. It can therefore be said that
there exist the problem of multicollinearity.
To resolve this problem a stepwise regression has been adopted. The result is the three regression
models below.
Model 1: ROE it= β0 + β1 (CCCit) + β2 (SIZE it) + β3 (GROWTH it) + ε
Model 2: ROE it= β0 + β1 (ACPit) + β2 (SIZE it) + β3 (GROWTH it) + ε
Model 3: ROE it= β0 + β1 (APPit) + β2 (SIZE it) + β3 (GROWTH it) + ε
Tests for the Assumption of Normality
Assumption: The residual or the error term is normally distributed.
In testing the above assumption the probability plots is generated. The Probability plots are used to
determine whether the distribution of a variable matches a given distribution. If the selected variable
matches the test distribution, the points cluster around a straight line. The generated graph is as shown
in chart 1 below.
Figure1. The probability plot
It can be observed that, all the points are clustered around the straight line, which indicates that, the
variables are normally distributed.
Table 3 is a component of the regression output which examines the extent to which the predictors
combine to explain the variations in the dependent variable (ROE).

Emmanuel Opoku Ware “Liquidity Management and Its Effect on Profitability in a Tough Economy: (A
Case of Companies Listed on the Ghana Stock Exchange)”
International Journal of Research in Business Studies and Management V2 ● I11 ● November 2015 50
Table3. Model Summary (b)
Model Summary
Model R R Square Adjusted R Square Std. Error of the Estimate
1 .767a 0.589 0.536 0.057125
2 .537a 0.289 0.254 0.120682
3 .623a 0.388 0.358 0.11196
a. Predictors: (Constant), CCC, ACP, APP, GROWTH, SIZE
The R is termed as multiple correlation coefficients and measures the relationship between the
observed and predicted values of the dependent variable. It ranges from -1.0 to +1.0. Larger values of
R indicate stronger relationships and vice versa.
The model 1 produced an R figure of 0.767, indicating that, the regression model between the
dependent variable and the set of independent variables is appropriate. The R Square figure of 0.589
indicates that, reliance on this model will account for 58.9% of the variations in the dependent
variable (ROE).
The model 2 produced an R figure of 0.537, indicating the appropriateness of the regression model
between the dependent variable and the set of independent variables. It also produced an R square
figure of 0.289.
Again, the model 3 also produced R figure and R square figure of 0.623 and 0.388 respectively. It
indicates that the model is appropriate and reliance can account for 38.8% of the variations in the
dependent variable (ROE).
Table 4 summarizes the results of an analysis of variance.
Table4. Analysis of Variance (ANOVA)
Model Sum of Squares Df Mean Square F Sig.
1 Regression 11497.64 3 3832.545 19.107 .000a
Residual 32293.51 161 200.581
Total 43791.15 164
2. Regression 13077.38 3 4359.125 18.609 .000a
Residual 37713.77 161 234.247
Total 50791.15 164
3. Regression 11820.74 3 3940.245 18.14 .000a
Residual 34970.41 161 217.207
Total 46791.15 164
a. Predictors: (Constant), CCC, ACP, APP, GROWTH, SIZE
a. Dependent Variable ROE
This table illustrates two sources of variation; regression and residual. The regression sources of
variation is the portion of the variation in the dependent variables (ROE) that is explained by relying
on the regression model while the residual variation is what the model could not explain. A model
which is reliable will have a higher regression mean sum of squares than the residual mean sum of
squares. The mean square of each sources of variation is obtained by dividing their respective sum of
squares by their degree of freedom. The F-value is obtained by dividing the regression mean square
by the residual mean square. Hence, a large F-value indicates that the model account is reliable.
Whenever the p-value is less than the selected 5%, it implies that, the F-value is large and vice versa.
The analysis resulted in F-values 19.107, 18.609 and 18.14 for model 1, 2 and 3 respectively with
corresponding p-values of 0.00. This confirms that, the models are significantly reliable. That means
one can rely on the models to predict ROE with high accuracy.
Having established that the models are appropriate and reliable, the next step is to estimate the
regression coefficients as indicated in the model on tables 5a, 5b and 5c.
Estimated Regression Coefficients
Table5a. Coefficientsa
Model
Unstandardized coefficients Standardized Coefficients
t Sig. B Std. Error Beta
1 (Constant) 5.77 11.006 0.524 0.601
CCC -0.025 0.017 -0.119 -1.521 0.13
GROWTH 1.898 2.128 0.07 0.892 0.374
SIZE 0.303 0.622 0.038 0.487 0.627
a. Dependent Variable: ROE

Emmanuel Opoku Ware “Liquidity Management and Its Effect on Profitability in a Tough Economy: (A
Case of Companies Listed on the Ghana Stock Exchange)”
51 International Journal of Research in Business Studies and Management V2 ● I11 ● November 2015
Table5b.
Coefficientsa
Model
Unstandardized Coefficients Standardized Coefficients
t Sig. B Std. Error Beta
1 (Constant) 5.288 11.865 0.446 0.656
ACP -0.006 0.034 -0.014 -0.176 0.861
GROWTH 1.913 2.16 0.07 0.886 0.377
SIZE 0.274 0.634 0.034 0.432 0.666
a. Dependent Variable: ROE
Table5c.
Coefficientsa
Model
Unstandardized Coefficients Standardized Coefficients
t Sig. B Std. Error Beta
1 (Constant) 8.752 11.424 0.766 0.445
APP -0.024 0.018 -0.107 -1.357 0.177
GROWTH 2.119 2.139 0.078 0.991 0.323
SIZE 0.187 0.628 0.023 0.299 0.766
a. Dependent Variable: ROE
Analysis of Results
This section evaluates the relationship between Liquidity and profitability of listed firms based on the
result of Table 5(a, b, c). The CCC, ACP and APP are the measures of liquidity whiles the GROWTH
and SIZE are control variables in the regression models.
From Table 5a: the Cash Conversion Cycle with a negative co-efficient of 0.025is statistically
insignificant (p-value = 0.130) on profitability. This implies that, the time lag that the firms convert its
activities into cash has no influence on the profitability of listed firms in Ghana. Although, this
finding contradicts with the findings of (Lyroudi&Lazaridis, 2000), which found that there is a
positive and significant relationship between cash conversion cycle and assets return ratio and also a
positive and significant relationship between cash conversion cycle and current and liquid ratios, it is
however consistent with the findings of (Lairodi and et.al (1999)) on similar research.
Also from the regression result (Table 5b), it is apparent that the Average Collection Period (ACP)
with co-efficient of -0.006 and a p-value of 0.861 has no statistical significance on profitability. This
indicates that, the number of days it takes a firm to collect its receivables has no impact on the profit
of the firm. This result contradicts the findings of (Wang, 2002), and (Deloof, 2003) who found a
positive and a negative relationship between ACP and profitability respectively.
Again in Table 5c, the Average Payment Period (APP) with a negative co-efficient of 0.024 and a p-
value of 0.177 has no statistical significance on profitability. This implies that the length of time the
companies take to pay its debts has no influence on profitability.
The results from the entire three tables suggest that, growth in sales (GROWTH) and the firm size
(SIZE) has no statistical significance on profitability. This may be attributed to the increase in cost on
advertising and promotional activities which are mostly associated with higher sales.
These finding are however consistent with the research conducted by (Samiloglu & Demirgunes,
2008), which found that, the size of a firm and the financial asset to total asset ratio have no statistical
significance on profitability.
Conclusion
The study made use of three measures of liquidity, thus, Cash Conversion Cycle (CCC), Average
Collection Period (ACP) and Average Payment Period (APP) and two Control variables, (Growth and
Size), to reveal whether liquidity management has any significant relationship with profitability. The
above findings indicate clearly that all the three measures have no significant relationship with
profitability of companies listed on the Ghana Stock Exchange.
SUMMARY, CONCLUSION AND RECOMMENDATION
Introduction
This chapter deals with summary, conclusions and recommendations based on the findings of the
study. It also reveals some limitations to the study and finally proposes topics for further studies
Emmanuel Opoku Ware “Liquidity Management and Its Effect on Profitability in a Tough Economy: (A
Case of Companies Listed on the Ghana Stock Exchange)”
International Journal of Research in Business Studies and Management V2 ● I11 ● November 2015 52
Summary
Effective cash optimization is critical to all organizations, especially in a tough economy. Cash is the
lifeblood of organizations. An organization having a proper set of liquidity management policies and
procedures will improve profits, reduce the risk of corporate failure and significantly improve its
chances of survival. It also provides a strategic advantage especially in difficult economic times.
Effective liquidity management will enable an organization to derive maximum
benefits at minimal cost.
In this study, the researchers examined the relationship between liquidity and profitability of
companies listed on the Ghana Stock Exchange. The study concluded that, management of liquidity
by companies as measured by Cash Conversion Cycle (CCC), Average Collection Period (ACP) and
Average Payment Period (APP) has no significant impact on profitability of Companies listed on
Ghana stock exchange.
Conclusion
The study made use of three measures of liquidity, thus, Cash Conversion Cycle (CCC), Average
Collection Period (ACP) and Average Payment Period (APP) and two Control variables, (Growth and
Size), to reveal whether liquidity management has any significant relationship with profitability. The
above findings indicate clearly that all the three measures have no significant relationship with
profitability of companies listed on the Ghana Stock Exchange. The research therefore accepts the
null hypothesis; that Liquidity Management has no significant positive relationship with profitability
of companies listed on the Ghana Stock Exchange.
However, this conclusion does not disagree with the fact that liquidity management practices are vital.
The conclusion is rather an indication of the fact that, using the above mentioned measures of
Liquidity Management has no significant impact on profitability.
Recommendations
After a careful study of the findings, the team of researchers came out with the following
recommendations:
Firm managers should concentrate on the reduction of cash convention cycle in order to improve
shareholders wealth.
Companies should endeavor to increase a higher current ratio to meet their day to day activities.
Companies should assume effective and efficient methods for managing and maintaining optimal
levels of liability.
Limitations of the Study
The research did not consider the organizational policies regarding the management of liquidity.
The study was limited to a five year period (2005-2009). An extension of the period might give a
slightly different result.
The researchers did not have access to current information on companies. The available date was
up to 2009.
The study did not include economic indicators (inflation, GDP) which also have a great impact on
profitability.
REFERENCES
AssafNeto, A. (2003). FinançasCorporativas e Valor. São Paulo: Atlas
Agarwal, N. P. and Mishra, B. K, (2007). Working Capital Management. ChauraRasta, RBSA
Publishers
Adelman P.J and Mark A.M, (2007) Entrepreneurial Finance.4th ed. Prentice Hall.
Arnold, G. (2008). Corporate Financial Management.4th edition.Prentice Hall. Essex..
Arthur, J. Keown, David,F. Scott, Jr., John, D. Martin, and J. William, Petty 7th ed.(1996)
Basic Financial Management, New Jersey: Prentice Hall

Emmanuel Opoku Ware “Liquidity Management and Its Effect on Profitability in a Tough Economy: (A
Case of Companies Listed on the Ghana Stock Exchange)”
53 International Journal of Research in Business Studies and Management V2 ● I11 ● November 2015
Bhunia, A. (2010). A trend analysis of liquidity management efficiency in selected private sector
Indian steel industry, International Journal of Research in Commerce and Management, Vol-1, 5,
pp 213.
Blatt, A. (2001) Análise de Balanços: Estrutura e Avaliação das Demonstrações
Financeiras. São Paulo: Makron Books.
Bodie, Z. & Merton, R. C. (2000).Finance. Upper Saddle River NJ: Prentice-Hall, Inc.
Damilola, D. A. (2006). Corporate Finance: Issues, Investigations, Innovations and Applications,
High Rise Publication, Lagos, Nigeria.
Eljelly, A. (200Deloof, M. (2003). Does working capital management affect profitability of Belgian
firms? Journalof Business Finance and Accounting, 30(3 – 4), 573–588
Eugene, F. Brigham, and Joel, F., Houston, 9th ed. (2001) Fundamentals of Financial Management,
Ohio: South-Western
Liquidity – profitability tradeoff: an empirical investigation in an emerging market. IJCM, 14 (2), 48-
61.
Gallinger, G. W. & Healey, P. B. (1991). Liquidity Analysis and Management (2nd ed.). Reading MA:
Addison-Wesley Publishing Company, Inc.
Garcia-Teruel, Juan & Martinez-Solano, Pedro (2007).Effects of working capital management on
SME profitability.International Journal of Managerial Finance.Vol 3 No 2. 164-177
Hall C (2002). "Total" Working Capital Management". AFP Exchange 22(6)
Harris A (2005), Working Capital Management; Difficult, but Rewarding. Financial
Executives 21(4)
Herbert, B., Mayo, (2003) Investments. Ohio: Thompson South-Western.
Kishore, R. M. (2008). Taxman's Financial Management. New Delhi: Taxman Allied
Services.Lamberson M (1995). Changes in Working Capital of Small Firms in relation to changes in
economic activities. Mid-American Journal of Business 10(2)
Lyroudi, K. and J. Lazaridis (2000). ‖The Cash Conversion Cycle and Liquidity Analysis of the Food
Industry in Greece.―[Electronic Version].EFMA 2000 Athens, from
http://ssrn.com/paper=236175. [Online] [7 September 2010].
Lyroudi, K.; Mc Carty D.; Lazaridis, J.; and T. Chatzigagios (1999). ‖An Empirical Investigation of
Liquidity: The Case of UK Firms.―Presented at the Annual Financial Management Association
Meeting in Orlando, October 1999
Marques, J. A. C., & Braga, R. (1995) Análisedinâmica do capital de giro: o ModeloFleuriet. RAE –
Revista de Administração de Empresas. 35 (3) 49-63.
Owolabi, S. A. and Obida, S. S, (August 2012), Business Management Dynamics, Vol.2,
No. 2, pp10-25
Pass, L.C., & Pike, H.R.,(1984). An Overview of Working Capital Management and
Corporate Financing, Managerial Finance 10;3, pp.1-11
Pandy I.M. (2005).Financial Management, New Delhi, India, Vikas Publishing House.
Pandy I.M. 8th ed. (2004).Financial Management, New Delhi, India, Vikas Publishing House.
Perobelli, F. F. C., Pereira, J. F. & David, M. V. (2006). Relação Liquidez-Retorno: Existiria também
uma ―Estrutura de Liquidez‖ Ideal para cada Perfil de Empresa? EnAMPAD.1-16. http:// ww
w.anpad.org.br/enanpad/2006/dwn/enanpad2006-ficb- 2510.pdf
Pimentel, R. C., Braga, R., & Casa Nova, S. P. C. (2005). Interação entre rentabilidade
eliquidez: um estudo exploratório. Revista de Contabilidade do Mestrado em Ciências Contábeis
da UERJ, Rio de Janeiro – 10 (2), PP. 83-98.
Raheman, A. & Nasr, M. (2007).Working Capital Management and Profitability: Case of Pakistani
Firms, International Review of Business Research Papers, Vol.3,No 1, PP279- 300
Sharma, A. K. and Satish Kumar (2011).‖Effect of Working Capital Management on Firm
Profitability: Empirical Evidence from India.― Global Business Review, 12,pp. 159–173.
Shim, J. K. and Siegel, J. G. (2000) Financial Management.2nd edition; Barron‘s.
Smith, M. Beaumont, Begemann, E. (1997) ―Measuring Association between Working Capital and
Return on Investment‖, South African Journal of Business management, Vol 28 No 1
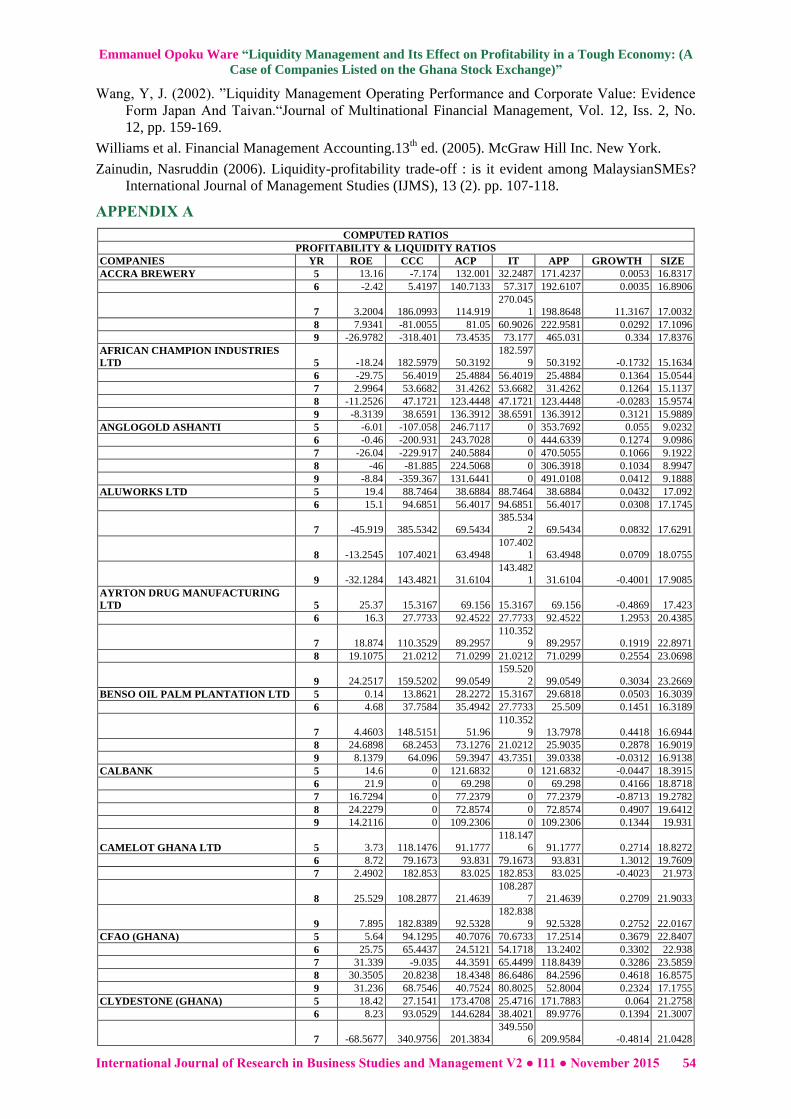
Emmanuel Opoku Ware “Liquidity Management and Its Effect on Profitability in a Tough Economy: (A
Case of Companies Listed on the Ghana Stock Exchange)”
International Journal of Research in Business Studies and Management V2 ● I11 ● November 2015 54
Wang, Y, J. (2002). ‖Liquidity Management Operating Performance and Corporate Value: Evidence
Form Japan And Taivan.―Journal of Multinational Financial Management, Vol. 12, Iss. 2, No.
12, pp. 159-169.
Williams et al. Financial Management Accounting.13th ed. (2005). McGraw Hill Inc. New York.
Zainudin, Nasruddin (2006). Liquidity-profitability trade-off : is it evident among MalaysianSMEs?
International Journal of Management Studies (IJMS), 13 (2). pp. 107-118.
APPENDIX A
COMPUTED RATIOS
PROFITABILITY & LIQUIDITY RATIOS
COMPANIES YR ROE CCC ACP IT APP GROWTH SIZE
ACCRA BREWERY 5 13.16 -7.174 132.001 32.2487 171.4237 0.0053 16.8317
6 -2.42 5.4197 140.7133 57.317 192.6107 0.0035 16.8906
7 3.2004 186.0993 114.919
270.045
1 198.8648 11.3167 17.0032
8 7.9341 -81.0055 81.05 60.9026 222.9581 0.0292 17.1096
9 -26.9782 -318.401 73.4535 73.177 465.031 0.334 17.8376
AFRICAN CHAMPION INDUSTRIES
LTD 5 -18.24 182.5979 50.3192
182.597
9 50.3192 -0.1732 15.1634
6 -29.75 56.4019 25.4884 56.4019 25.4884 0.1364 15.0544
7 2.9964 53.6682 31.4262 53.6682 31.4262 0.1264 15.1137
8 -11.2526 47.1721 123.4448 47.1721 123.4448 -0.0283 15.9574
9 -8.3139 38.6591 136.3912 38.6591 136.3912 0.3121 15.9889
ANGLOGOLD ASHANTI 5 -6.01 -107.058 246.7117 0 353.7692 0.055 9.0232
6 -0.46 -200.931 243.7028 0 444.6339 0.1274 9.0986
7 -26.04 -229.917 240.5884 0 470.5055 0.1066 9.1922
8 -46 -81.885 224.5068 0 306.3918 0.1034 8.9947
9 -8.84 -359.367 131.6441 0 491.0108 0.0412 9.1888
ALUWORKS LTD 5 19.4 88.7464 38.6884 88.7464 38.6884 0.0432 17.092
6 15.1 94.6851 56.4017 94.6851 56.4017 0.0308 17.1745
7 -45.919 385.5342 69.5434
385.534
2 69.5434 0.0832 17.6291
8 -13.2545 107.4021 63.4948
107.402
1 63.4948 0.0709 18.0755
9 -32.1284 143.4821 31.6104
143.482
1 31.6104 -0.4001 17.9085
AYRTON DRUG MANUFACTURING
LTD 5 25.37 15.3167 69.156 15.3167 69.156 -0.4869 17.423
6 16.3 27.7733 92.4522 27.7733 92.4522 1.2953 20.4385
7 18.874 110.3529 89.2957
110.352
9 89.2957 0.1919 22.8971
8 19.1075 21.0212 71.0299 21.0212 71.0299 0.2554 23.0698
9 24.2517 159.5202 99.0549
159.520
2 99.0549 0.3034 23.2669
BENSO OIL PALM PLANTATION LTD 5 0.14 13.8621 28.2272 15.3167 29.6818 0.0503 16.3039
6 4.68 37.7584 35.4942 27.7733 25.509 0.1451 16.3189
7 4.4603 148.5151 51.96
110.352
9 13.7978 0.4418 16.6944
8 24.6898 68.2453 73.1276 21.0212 25.9035 0.2878 16.9019
9 8.1379 64.096 59.3947 43.7351 39.0338 -0.0312 16.9138
CALBANK 5 14.6 0 121.6832 0 121.6832 -0.0447 18.3915
6 21.9 0 69.298 0 69.298 0.4166 18.8718
7 16.7294 0 77.2379 0 77.2379 -0.8713 19.2782
8 24.2279 0 72.8574 0 72.8574 0.4907 19.6412
9 14.2116 0 109.2306 0 109.2306 0.1344 19.931
CAMELOT GHANA LTD 5 3.73 118.1476 91.1777
118.147
6 91.1777 0.2714 18.8272
6 8.72 79.1673 93.831 79.1673 93.831 1.3012 19.7609
7 2.4902 182.853 83.025 182.853 83.025 -0.4023 21.973
8 25.529 108.2877 21.4639
108.287
7 21.4639 0.2709 21.9033
9 7.895 182.8389 92.5328
182.838
9 92.5328 0.2752 22.0167
CFAO (GHANA) 5 5.64 94.1295 40.7076 70.6733 17.2514 0.3679 22.8407
6 25.75 65.4437 24.5121 54.1718 13.2402 0.3302 22.938
7 31.339 -9.035 44.3591 65.4499 118.8439 0.3286 23.5859
8 30.3505 20.8238 18.4348 86.6486 84.2596 0.4618 16.8575
9 31.236 68.7546 40.7524 80.8025 52.8004 0.2324 17.1755
CLYDESTONE (GHANA) 5 18.42 27.1541 173.4708 25.4716 171.7883 0.064 21.2758
6 8.23 93.0529 144.6284 38.4021 89.9776 0.1394 21.3007
7 -68.5677 340.9756 201.3834
349.550
6 209.9584 -0.4814 21.0428

Emmanuel Opoku Ware “Liquidity Management and Its Effect on Profitability in a Tough Economy: (A
Case of Companies Listed on the Ghana Stock Exchange)”
55 International Journal of Research in Business Studies and Management V2 ● I11 ● November 2015
8 -82.6622 86.1578 123.8616 37.0576 74.7615 0.3308 21.0186
9 -4.9806 52.7077 116.7095 60.8829 124.8847 0.4409 21.4011
COCOA PROCESSING COMPANY
LTD 5 4.56 184.4215 134.538
184.421
5 134.538 -0.1829 18.0112
6 4.76 228.7459 68.0445
228.745
9 68.0445 0.0386 18.1906
7 2.0704 65.1588 184.6982 65.1588 184.6982 0.6602 25.3926
8 -21.204 103.1713 108.8119
103.171
3 108.8119 0.2291 25.8939
9 -67.5151 167.7132 178.8429
167.713
2 178.8429 -0.2316 26.0068
ECOBANK GHANA LTD 5 43.18 93.6306 108.275 0 14.6444 0.0226 19.2088
6 38.91 87.597 102.7813 0 15.1843 0.2708 19.6745
7 34.5607 56.4245 69.8077 0 13.3832 -0.8726 22.6028
8 39.628 -129.515 66.1349 0 195.6499 0.6764 22.8403
9 26.2169 -93.0021 105.1242 0 198.1263 0.5631 22.9212
ENTERPRISE INSURANCE 5 15.58 48.1673 211.5504 0 163.3831 0.0153 16.8117
6 11.58 -0.7464 172.6248 0 173.3712 0.0256 17.055
7 12.6108 -261.334 131.9009 0 393.2349 -0.0175 17.3977
8 10.0487 -110.465 174.8036 0 285.2683 0.8608 17.9096
9 4.1692 121.5681 359.16 0 237.5919 1.1383 18.118
FAN MILK 5 40.84 -25.5529 4.8501 33.6994 64.1025 0.0341 16.5754
6 29.8 -0.4512 9.1795 58.2168 67.8475 0.0361 16.7222
7 28.1012 177.1819 14.1581
239.481
8 76.4581 0.2685 16.9813
8 32.9472 -13.976 14.1183 48.7666 76.8608 0.3402 17.3077
9 43.2016 -24.4653 10.259 47.3465 82.0708 0.4984 17.7496
GCB 5 17.78 109.0226 119.8382 0 10.8156 -0.0305 20.194
6 28.31 93.9151 102.535 0 8.62 0.2806 20.4738
7 18.5899 44.9608 54.6785 0 9.7176 0.3237 20.8671
8 18.0956 43.4148 60.9934 0 17.5786 0.2706 21.2242
9 9.2678 37.801 76.7251 0 38.9241 0.0855 21.377
GUINNESS GHANA 5 24.7 -70.2131 36.6583 39.3109 146.1823 0.1269 18.4227
6 28.9 -102.233 53.8065 69.599 225.6386 0.3104 18.6053
7 21.8871 300.6339 54.6237
347.378
8 101.3686 0.1918 18.7031
8 22.0269 14.7711 46.0705
100.492
8 131.7922 0.0878 18.8927
9 17.9364 0.918 39.9893
102.825
2 141.8965 0.4798 19.1736
GOIL 5 16.12 -20.0717 110.7948 4.9899 135.8565 0.0696 18.039
6 25.46 10.0177 68.6344 7.5966 66.2133 0.3917 17.8866
7 18.3016 8.7391 56.9503 3.8521 52.0633 0.595 18.2144
8 16.5988 7.2732 50.2744 5.8014 48.8025 0.4319 18.4182
9 18.1569 -2.8611 47.0281 5.9115 55.8007 -0.0395 18.4178
GOLDEN STAR 5 -2.4 73.5125 25.0814 79.6906 31.2595 0.0265 11.7965
6 9.75 68.9099 25.0159 98.3803 54.4863 0.348 11.4135
7 4.59 64.0215 17.3943 97.4696 50.8424 0.3646 11.8902
8 -27.8637 17.3344 6.1071 64.1647 52.9374 0.4655 11.4293
9 3.1748 28.9486 6.3948 50.9409 28.3872 0.5571 12.2991
GOLDEN WEB LTD 5 -30.83 178.9015 55.4089
178.901
5 55.4089 -0.1381 13.9245
6 2.74 312.7989 7.5646
312.798
9 7.5646 0.224 14.2606
7 -20.8288 275.2042 14.1379
275.204
2 14.1379 -0.1383 14.3192
8 -19.7566 296.6339 29.2127
296.633
9 29.2127 -0.0876 14.3973
9 -15.32 295.7256 74.5077
295.725
6 74.5077 -0.4998 15.8384
HFC 5 7.41 60.1253 121.242 0 61.1168 0.2794 18.0788
6 11.11 -334.255 70.3492 0 404.6044 0.3437 18.4987
7 15.4048 21.8926 84.6184 0 62.7259 -0.8396 18.908
8 21.0915 16.4055 92.0325 0 75.627 0.6344 19.752
9 17.1164 29.9699 115.2214 0 85.2515 0.2535 19.3804
MECHANICAL LLOYD 5 10.35 -211.181 115.6219
401.303
8 728.107 0.1094 16.5187
6 9.1 150.9254 109.6383
686.058
6 644.7715 0.121 16.5656
7 13.053 445.7706 81.6357
488.982
6 124.8477 -0.8267 16.9178
8 10.9651 98.9262 78.1055 23.8626 3.042 0.193 17.1893
9 7.1663 78.6468 76.977 29.8138 28.1441 -0.1441 17.159
PIONEER KITCHEN LTD 5 -26.8 92.1898 90.5756 92.1898 90.5756 -0.1526 14.7827

Emmanuel Opoku Ware “Liquidity Management and Its Effect on Profitability in a Tough Economy: (A
Case of Companies Listed on the Ghana Stock Exchange)”
International Journal of Research in Business Studies and Management V2 ● I11 ● November 2015 56
6 -23.1 54.5003 20.4483 54.5003 20.4483 0.05 14.9155
7 -29.3238 137.9124 16.2629
137.912
4 16.2629 0.374 14.9325
8 -44.9838 138.1786 0.7289
138.178
6 0.7289 -0.099 14.6987
9 -2.4677 56.3042 209.3731 56.3042 209.3731 1.7341 14.6912
PRODUCE BUYING COMP 5 -57.99 26.8275 17.3565 11.746 2.275 0.1365 17.2242
6 -25.7 27.131 12.2792 16.0734 1.2215 0.0792 16.7595
7 2.4963 19.2484 15.8927 5.0678 1.7121 -0.2231 17.4082
8 28.7003 32.4732 18.5489 25.1627 11.2384 0.2707 18.0272
9 45.895 38.13 26.9246 21.4887 10.2832 0.7818 18.3857
PZ CUSSONS GHANA LTD 5 8.08 154.4013 44.1358
154.401
3 44.1358 -0.8873 16.7806
6 15.25 156.2358 40.1848
156.235
8 40.1848 0.1418 16.9962
7 18.9733 201.8284 65.3441
201.828
4 65.3441 0.3018 17.1852
8 16.7288 194.7064 59.8749
194.706
4 59.8749 0.4684 17.4625
9 3.9037 206.3663 46.3855
206.366
3 46.3855 0.0437 17.4643
SAM-WOODE LTD 5 63.5702 -42.4038 159.1041 95.8943 297.4022 0.2135 14.4256
6 54.1706 116.6328 27.345
150.900
8 61.6131 -0.0501 13.5056
7 27.0848 55.2825 90.3129 97.0904 132.1208 -0.9568 13.704
8 31.2775 184.617 187.5519 78.098 81.0329 2.0135 14.3181
9 39.7378 198.7941 215.9945 51.483 68.6834 0.1937 14.5381
SG-SSB 5 23.38 67.4385 83.521 0 16.0825 0.2992 19.4904
6 19.56 68.4883 81.4127 0 12.9244 0.1589 19.7167
7 19.836 49.3731 59.465 0 10.0919 0.0408 19.8506
8 22.2785 -11.5111 51.5252 0 63.0363 0.234 19.8949
9 17.5084 -58.7828 63.4148 0 122.1976 0.1994 20.1757
SIC INSURANCE COMP 5 7.82 -7.2008 60.8768 61.7717 129.8493 0.0642 17.7866
6 9.65 -80.2552 48.8249 45.5692 174.6492 0.5548 17.9758
7 13.1689 -84.3466 6.5407 37.1902 128.0775 -0.273 18.8822
8 13.3921 -156.044 6.1913 64.0845 226.3197 0.4304 19.1701
9 9.6127 4.0505 6.0104 95.2356 97.1955 -0.1759 19.0379
STANCHART 5 35.81 82.542 98.313 0 15.771 0.3916 13.1505
6 38.86 100.6715 115.7035 0 15.0319 0.1897 13.4581
7 37.3758 99.6498 120.6194 0 20.9696 -0.8903 13.559
8 37.0966 70.7528 87.5373 0 16.7844 0.2629 13.8003
9 36.0307 123.1165 138.9212 0 15.8047 0.5583 14.155
STARWIN PRODUCTS LTD 5 11.03 -593.5 90.7526
315.551
9 999.804 0.1326 14.8002
6 4.12 349.2447 131.844
320.046
6 102.6459 0.147 14.659
7 1.2544 234.5612 19.437
319.179
2 104.0551 -0.8926 15.0236
8 -6.829 246.9854 93.4077 244.881 91.3033 0.2119 15.0217
9 2.3214 195.5905 38.2647 224.122 66.7962 0.25 15.7517
TOTAL PETROLEUM LTD 5 26 -16.1016 41.1417 2.6187 59.862 0.0907 17.0972
6 7 -22.4084 106.5107 11.1294 140.0485 0.4543 18.6528
7 16.6799 25.9683 51.9172 46.0485 71.9974 1.274 18.7408
8 11.1909 -9.2234 37.7948 9.5774 56.5956 0.4009 18.8137
9 21.7948 -3.4027 39.6499 11.1031 54.1557 -0.0425 18.7842
TRANSACTIONS SOLUTIONS GH LTD 5 106.58 -0.1344 7.3316 5.6217 13.0877 0.0153 14.56
6 22.4 12.8944 12.2938 7.0418 6.4412 0.7118 15.2713
7 15.1584 15.7255 10.2792 6.0597 0.6134 0.1015 15.3983
8 -93.1244 9.5638 14.5864 8.5573 13.5798 -0.6667 15.0882
9 -47.2 -13.6779 17.1465 6.4767 37.301 -0.3947 14.7976
UNILEVER GHANA LTD 5 34.2 65.3451 59.3401 70.0386 64.0336 0.1657 17.9352
6 31 20.2161 41.6622 35.5745 57.0207 0.1467 17.9778
7 22.0499 28.1388 44.8119 53.5858 70.2589 0.1714 18.3755
8 39.4549 -98.6137 86.3974 88.2573 273.2684 0.1908 18.679
9 2.6766 -2.531 19.1071 93.1507 114.7888 -0.0104 18.5804
UT BANK LTD 5 61.3897 125.6838 184.0666 0 58.3828 0.0756 10.5581
6 47.0331 122.1693 192.2364 0 70.067 0.6656 10.9208
7 39.3732 180.8571 237.6511 0 56.794 0.5222 11.2378
8 31.4018 105.6458 162.0767 0 56.431 0.17 11.7584
9 26.5207 121.9015 203.0374 0 81.1359 0.5519 12.2686

Emmanuel Opoku Ware “Liquidity Management and Its Effect on Profitability in a Tough Economy: (A
Case of Companies Listed on the Ghana Stock Exchange)”
57 International Journal of Research in Business Studies and Management V2 ● I11 ● November 2015
APPENDIX B
CALCULATION OF ACP
ACCRA BREWERY
YEARS 2005 2006 2007 2008 2009
ACCOUNT RECEIVABLES 71695 76698 7715 5600 6770
SALES 198246 198949 24504 25219 33641
ACP 132.001 140.7133 114.919 81.05 73.45352
AFRICAN CHAMPION INDUSTRIES LIMITED
YEARS 2005 2006 2007 2008 2009
ACCOUNT RECEIVABLES 3334786 1916745 266596 1017612 1475271
SALES 24189489 27448262 3096382 3008861 3948012
ACP 50.31925 25.48839 31.42621 123.4448 136.3912
ANGLOGOLD ASHANTI
YEARS 2005 2006 2007 2008 2009
ACCOUNT RECEIVABLES 1777 1979 2162 2226 1359
SALES 2629 2964 3280 3619 3768
ACP 246.7117 243.7028 240.5884 224.5068 131.6441
ALUWORKS LIMITED
YEARS 2005 2006 2007 2008 2009
ACCOUNT RECEIVABLES 50637 76098 10164 10672 2968000
SALES 477,727 492,463 53,346 61,348 34271000
ACP 38.68842 56.40174 69.54336 63.49482 31.6104
AYRTON DRUG MANUFACTURING LIMITED
YEARS 2005 2006 2007 2008 2009
ACCOUNT RECEIVABLES 4444321 2014771 2319504 2316269 4210124
SALES 23456787 7954284 9481076 11902564 15513573
ACP 69.15598 92.45225 89.29566 71.02992 99.05489
BENSO OIL PALM PLANTATION LTD
YEARS 2005 2006 2007 2008 2009
ACCOUNT RECEIVABLES 5663 8829 1867 4125 2539
SALES 73227 90792 13115 20589 15603
ACP 28.22722 35.49415 51.95997 73.12764 59.39467
CALBANK
YEARS 2005 2006 2007 2008 2009
ACCOUNT RECEIVABLES 397,920 85680 113808 190938 214715
SALES 132658 16267 24083 38113 64256
ACP 121.6832 69.29803 77.23794 72.85739 109.2306
CAMELOT GHANA LIMITED
YEARS 2005 2006 2007 2008 2009
ACCOUNT RECEIVABLES 366924 868951 459563 150990 830080
SALES 1468860 3380196 2020362 2567625 3274288
ACP 91.17772 93.83095 83.02497 21.46394 92.53285
CFAO (GHANA)
YEARS 2005 2006 2007 2008 2009
ACCOUNT RECEIVABLES 21360347 17109736 4113723 2499 6808
SALES 191524853 2.55E+08 33848938 49479 60976
ACP 40.70765 24.51205 44.35911 18.43479 40.75243
CLYDESTONE (GHANA)
YEARS 2005 2006 2007 2008 2009
ACCOUNT RECEIVABLES 8778740 8339640 602229 492935 669268
SALES 18471352 21046830 1091518 1452599 2093084
ACP 173.4708 144.6284 201.3834 123.8616 116.7095
COCOA PROCESSING COMPANY LIMITED
YEARS 2005 2006 2007 2008 2009
ACCOUNT RECEIVABLES 103076 54144 24398993 17667707 22314412
SALES 279644 290436 48217223 59264796 45541422
ACP 134.538 68.04446 184.6982 108.8119 178.8429
ECOBANK GHANA LTD
YEARS 2005 2006 2007 2008 2009
ACCOUNT RECEIVABLES 1175251 162245 285772 401531 456159
SALES 348631 45687 54655 72754 131379
ACP 108.275 102.7813 69.80766 66.13489 105.1242
ENTERPRISE INSURANCE
YEARS 2005 2006 2007 2008 2009

Emmanuel Opoku Ware “Liquidity Management and Its Effect on Profitability in a Tough Economy: (A
Case of Companies Listed on the Ghana Stock Exchange)”
International Journal of Research in Business Studies and Management V2 ● I11 ● November 2015 58
ACCOUNT RECEIVABLES 24348294 30604 3935 5525 5750
SALES 14112029 14474 1422 2646 5658
ACP 211.5504 172.6248 131.9009 174.8036 359.16
FAN MILK
YEARS 2005 2006 2007 2008 2009
ACCOUNT RECEIVABLES 4152 8142 1593 2129 2318
SALES 312464 323747 41068 55041 82471
ACP 4.850095 9.179483 14.1581 14.11829 10.259
GCB
YEARS 2005 2006 2007 2008 2009
ACCOUNT RECEIVABLES 841026 1024054 750,663,543 1087118928 1265516727
SALES 2561574 3645385 112,452,442 181663097 266018982
ACP 119.8382 102.535 54.67847974 60.99335473 76.7251245 GUINNESS GHANA
YEARS 2005 2006 2007 2008 2009
ACCOUNT RECEIVABLES 80292 154432 18684 17142 22018
SALES 799452 1047599 124848 135810 200968
ACP 36.65834 53.80654 54.6237 46.07047 39.9893
GOIL
YEARS 2005 2006 2007 2008 2009
ACCOUNT RECEIVABLES 419136 361336 47821460 60448227 54313163
SALES 1380792 1921596 306492356 438863961 421542111
ACP 110.7948482 68.63443 56.95030417 50.27435564 47.02805242 GOLDEN STAR
YEARS 2005 2006 2007 2008 2009
ACCOUNT RECEIVABLES 6560 8820 8369 4306 7021
SALES 95465 128690 175614 257355 400739
ACP 25.08144 25.01593 17.39431 6.107089 6.394848
GOLDEN WEB LIMITED
YEARS 2005 2006 2007 2008 2009
ACCOUNT RECEIVABLES 839278714 140242500 22664 42582 54322
SALES 5,528,659,726 6,766,833,904 585,119 532,044 266,114
ACP 55.40885961 7.564617844 14.13791041 29.2126779 74.50765461 HFC
YEARS 2005 2006 2007 2008 2009
ACCOUNT RECEIVABLES 297,683,985 65934161 102465886 141506562 155869637
SALES 98881687 12707988 23754796 35680024 49204160
ACP 121.2420472 70.34920214 84.61841183 92.03254306 115.2214039 MECHANICAL LLOYD
YEARS 2005 2006 2007 2008 2009
ACCOUNT RECEIVABLES 35400486 37629039 4854832 5541197 4673930
SALES 111753711 1.25E+08 21706362 25894929 22162249
ACP 115.6219 109.6383 81.63568 78.10552 76.97705
PIONEER KITCHEN LIMITED
YEARS 2005 2006 2007 2008 2009
ACCOUNT RECEIVABLES 5491703 1301842 142266 5745 566543
SALES 22130367 23237764 3192970 2876993 987654
ACP 90.57561 20.44828 16.26294 0.72886 209.3731
PRODUCE BUYING COMP
YEARS 2005 2006 2007 2008 2009
ACCOUNT RECEIVABLES 109568 83654 8411516 12474943 32265614
SALES 2304175 2486622 193182770 245478455 437405123 ACP 17.35646 12.27919 15.89274 18.5489 26.92458
PZ CUSSONS GHANA LIMITED
YEARS 2005 2006 2007 2008 2009
ACCOUNT RECEIVABLES 23697853 24635112 5214946 7016899 5673417
SALES 195,979,806 223,761,509 29,129,720 42,775,342 44,643,160 ACP 44.13575 40.18482 65.3441 59.87487 46.38554
SAM-WOODE LTD
YEARS 2005 2006 2007 2008 2009
ACCOUNT RECEIVABLES 7936579 1295695 184963 1157523 1591317
SALES 18207272 17294893 747529 2252688 2689099
ACP 159.1041 27.34499 90.31288 187.5519 215.9945
SG-SSB

Emmanuel Opoku Ware “Liquidity Management and Its Effect on Profitability in a Tough Economy: (A
Case of Companies Listed on the Ghana Stock Exchange)”
59 International Journal of Research in Business Studies and Management V2 ● I11 ● November 2015
YEARS 2005 2006 2007 2008 2009
ACCOUNT RECEIVABLES 1,241,003 1,416,486 212,444,163 287,120,110 296,218,660
SALES 283,972 315,945 34,610,928 40,531,297 51,464,776
ACP 83.52097457 81.41268251 59.46498384 51.52520806 63.41478704 SIC INSURANCE COMP
YEARS 2005 2006 2007 2008 2009
ACCOUNT RECEIVABLES 88233 171044 92822030 140270390 119070176 SALES 14716 22880 1663356 2379323 1960721
ACP 60.87677 48.82486 6.540742 6.191277 6.010432
STANCHART
YEARS 2005 2006 2007 2008 2009
ACCOUNT RECEIVABLES 2,160,603 239,918 287069 460,338 408,538
SALES 581,960 76,053 94866 110,402 155,492
ACP 98.31302 115.7035 120.6194 87.53727 138.9212
STARWIN PRODUCTS LIMITED
YEARS 2005 2006 2007 2008 2009
ACCOUNT RECEIVABLES 153188 290989 230700 318517 166071
SALES 616109 805581 4332222 1244637 1584122
ACP 90.75258 131.844 19.43702 93.40772 38.26468
TOTAL PETROLEUM LTD
YEARS 2005 2006 2007 2008 2009
ACCOUNT RECEIVABLES 137833 518934 57520 58661 58925
SALES 1222824 1778327 404390 566514 542439
ACP 41.14169 106.5107 51.91721 37.79477 39.64985
TRANSACTIONS SOLUTIONS GH LTD
YEARS 2005 2006 2007 2008 2009
ACCOUNT RECEIVABLES 3877113 11128552 1024966 484826 344957
SALES 193020425 330403861 36394976 12131936 7343142
ACP 7.331588 12.29381 10.27924 14.58642 17.14652
UNILEVER GHANA LIMITED
YEARS 2005 2006 2007 2008 2009
ACCOUNT RECEIVABLES 168306 135502 17072 39196 8792
SALES 1035247 1187124 139054 165590 167952
ACP 59.34 41.662 44.812 86.397 19.107
UT BANK
YEARS 2005 2006 2007 2008 2009
ACCOUNT RECEIVABLES 29,124 46,448 57,191 98,116 121,546
SALES 14,687 24,463 37,237 43,568 67,612
ACP 184.0666 192.2364 237.6511 162.0767 203.0374
CALCULATION OF APP
ACCRA BREWERY
YEARS 2005 2006 2007 2008 2009
ACCOUNT PAYABLES 85439 108996 13191 14488 45968
COST OF SALES 181919 206549 24211 23718 36080
APP 171.423738 192.6106638 198.8647722 222.9580909 465.031042
AFRICAN CHAMPION INDUSTRIES LIMITED
YEARS 2005 2006 2007 2008 2009
ACCOUNT PAYABLES 3334786 1916745 266596 1017612 1475271
COST OF SALES 24189489 27448262 3096382 3008861 3948012
APP 50.31924775 25.48838702 31.42620646 123.4448451 136.391155
ANGLOGOLD ASHANTI
YEARS 2005 2006 2007 2008 2009
ACCOUNT PAYABLES 2583 3311 4794 4062 5350
COST OF SALE 2665 2718 3719 4839 3977
APP 353.7692308 444.633922 470.5055122 306.3918165 491.010812
ALUWORKS LIMITED
YEARS 2005 2006 2007 2008 2009
ACCOUNT PAYABLES 50637 76098 10164 10672 2968000
COST OF SALE 477,727 492,463 53,346 61,348 34271000
APP 38.68842456 56.40173983 69.54335845 63.49481646 31.6103995
AYRTON DRUG MANUFACTURING LIMITED
YEARS 2005 2006 2007 2008 2009
ACCOUNT PAYABLES 4444321 2014771 2319504 2316269 4210124
COST OF SALE 23456787 7954284 9481076 11902564 15513573

Emmanuel Opoku Ware “Liquidity Management and Its Effect on Profitability in a Tough Economy: (A
Case of Companies Listed on the Ghana Stock Exchange)”
International Journal of Research in Business Studies and Management V2 ● I11 ● November 2015 60
APP 69.15598308 92.45224523 89.29566222 71.02992137 99.0548895
BENSO OIL PALM PLANTATION LTD
YEARS 2005 2006 2007 2008 2009
ACCOUNT PAYABLES 6176 6078 474 1146 1673
SALES 75947 86968 12539 16148 15644
ACP 29.68175175 25.50903781 13.79775102 25.90351746 39.0338149
CALBANK
YEARS 2005 2006 2007 2008 2009
ACCOUNT PAYABLES 397,920 85680 113808 190938 214715
COST OF SALE 132658 16267 24083 38113 64256
APP 121.6831775 69.29802754 77.23793582 72.8573935 109.230561
CAMELOT GHANA LIMITED
YEARS 2005 2006 2007 2008 2009
ACCOUNT PAYABLES 366924 868951 459563 150990 830080
COST OF SALE 1468860 3380196 2020362 2567625 3274288
APP 91.177716 93.83095176 83.02497028 21.46394041 92.5328499
CFAO (GHANA)
YEARS 2005 2006 2007 2008 2009
ACCOUNT PAYABLES 8874033 9002953 10470024 10571 8042
COST OF SALE 187753985 248190162 32156112 45792 55593
APP 17.2514157 13.24016157 118.8439311 84.25958683 52.8003526
CLYDESTONE (GHANA)
YEARS 2005 2006 2007 2008 2009
ACCOUNT PAYABLES 4746066 3118059 393855 148786 353604
COST OF SALE 10084008 12648613 684693 726402 1033477
APP 171.7882503 89.9775758 209.9584412 74.76148193 124.884695
COCOA PROCESSING COMPANY LIMITED
YEARS 2005 2006 2007 2008 2009
ACCOUNT
RECEIVABLES 103076 54144 24398993 17667707 22314412
SALES 279644 290436 48217223 59264796 45541422
ACP 134.537984 68.0444573 184.6981616 108.8118662 178.842909
ECOBANK GHANA LTD
YEARS 2005 2006 2007 2008 2009
ACCOUNT PAYABLES 2510693 3356372 437951 14261 90127
COST OF SALE 100,733 139,628 16058 26605 48922
APP 14.64438105 15.18431807 13.38316387 195.6498778 198.126311
ENTERPRISE INSURANCE
YEARS 2005 2006 2007 2008 2009
ACCOUNT PAYABLES 6316896 6875 1532 2068 3683
COST OF SALE 14112029 14474 1422 2646 5658
APP 163.3830996 173.3712174 393.2348805 285.2683296 237.591905
FAN MILK
YEARS 2005 2006 2007 2008 2009
ACCOUNT PAYABLES 46632 52358 7398 9719 14272
COST OF SALE 265523 281671 35317 46154 63473
APP 64.10246947 67.84748874 76.45807968 76.86083546 82.0708018
GCB
YEARS 2005 2006 2007 2008 2009
ACCOUNT PAYABLES 4729940 6345727 839382573 1030106198 1259470137
COST OF SALE 140157 149863 22,347,443 49610404 134311684
APP 10.81563508 8.619972936 9.717638842 17.57857345 38.9241183
GUINNESS GHANA
YEARS 2005 2006 2007 2008 2009
ACCOUNT PAYABLES 266510 534588 30768 40349 68854
COST OF SALE 665444 864766 110787 111747 177113
APP 146.1823234 225.6386352 101.3685721 131.7922181 141.896473
GOIL
YEARS 2005 2006 2007 2008 2009
ACCOUNT PAYABLES 503154 340987 42736213 57845273 63154812
COST OF SALE 1351803 1879687 299610900 432631641 413104548
APP 135.8564894 66.21328711 52.06325185 48.80254388 55.8006599
GOLDEN STAR
YEARS 2005 2006 2007 2008 2009
ACCOUNT PAYABLES 9093 19012 26457 43355 28234
COST OF SALE 106174 127360 189936 298930 363030

Emmanuel Opoku Ware “Liquidity Management and Its Effect on Profitability in a Tough Economy: (A
Case of Companies Listed on the Ghana Stock Exchange)”
61 International Journal of Research in Business Studies and Management V2 ● I11 ● November 2015
APP 31.25948914 54.48633794 50.84241534 52.93739337 28.3872132
GOLDEN WEB LIMITED
YEARS 2005 2006 2007 2008 2009
ACCOUNT PAYABLES 839278714 140242500 22664 42582 54322
COST OF SALE 5,528,659,726 6,766,833,904 585,119 532,044 266,114
APP 55.40885961 7.564617844 14.13791041 29.2126779 74.5076546
HFC
YEARS 2005 2006 2007 2008 2009
ACCOUNT PAYABLES 280262315 55476168 63795343 85205063 117550877
COST OF SALE 46928007 61495626 10963336 17654263 27455873
APP 61.11675255 404.6044328 62.72585822 75.62703164 85.251543
MECHANICAL LLOYD
YEARS 2005 2006 2007 2008 2009
ACCOUNT PAYABLES 44335832 46298950 7162050 1005579 8195239
COST OF SALE 22225551 26209467 20938699 120658031 106283996
APP 728.1069738 644.771477 124.8476923 3.041955284 28.1440513
PIONEER KITCHEN LIMITED
YEARS 2005 2006 2007 2008 2009
ACCOUNT PAYABLES 5491703 1301842 142266 5745 566543
COST OF SALE 22130367 23237764 3192970 2876993 987654
APP 90.57561472 20.44828108 16.26294328 0.728859959 209.373115
PRODUCE BUYING COMP
YEARS 2005 2006 2007 2008 2009
ACCOUNT PAYABLES 14680 8419 913601 7527478 12172977
COST OF SALE 2355304 2515609 194764813 244477475 432077349
APP 2.274950495 1.221547148 1.712138655 11.2383747 10.2831972
PZ CUSSONS GHANA LIMITED
YEARS 2005 2006 2007 2008 2009
ACCOUNT PAYABLES 23697853 24635112 5214946 7016899 5673417
COST OF SALE 195,979,806 223,761,509 29,129,720 42,775,342 44,643,160
APP 44.13575318 40.18481963 65.3440984 59.87487219 46.3855427
SAM-WOODE LTD
YEARS 2005 2006 2007 2008 2009
ACCOUNT PAYABLES 13474483 2504484 220224 453808 440316
COST OF SALE 16537157 14836737 608396 2044107 2339943
APP 297.402165 61.61305279 132.1207897 81.03290092 68.6834423
SG-SSB
YEARS 2005 2006 2007 2008 2009
ACCOUNT PAYABLES 1787250 236604626 279940749 40543718 32319372
COST OF SALE 78749 8378026 7740083 7001987 10820137
APP 16.08246468 12.92442816 10.0918866 63.03628234 122.19761
SIC INSURANCE COMP
YEARS 2005 2006 2007 2008 2009
ACCOUNT PAYABLES 278340 289967 210484 40543718 32319372
COST OF SALE 782400 606003 599845 65387403 121369500
APP 129.8493098 174.6492262 128.07752 226.3196945 97.1955127
STANCHART
YEARS 2005 2006 2007 2008 2009
ACCOUNT PAYABLES 3,254,708 445,544 534840 742,290 833,084
COST OF SALE 140,630 18349 30727 34,134 36,073
APP 15.77098468 15.03192726 20.96955164 16.78442388 15.8047028
STARWIN PRODUCTS LIMITED
YEARS 2005 2006 2007 2008 2009
ACCOUNT PAYABLES 4530669 533511 580649 617439 564658
COST OF SALE 1654018 1897119 2036776 2468314 3085508
APP 999.8040439 102.6459363 104.0550777 91.30330866 66.7961872
TOTAL PETROLEUM LTD
YEARS 2005 2006 2007 2008 2009
ACCOUNT PAYABLES 200854 669559 78228 87070 79401
COST OF SALE 1224679 1745031 396587 561537 535149
APP 59.86198016 140.048535 71.99736754 56.5956473 54.1556931
TRANSACTIONS SOLUTIONS GH LTD
YEARS 2005 2006 2007 2008 2009
ACCOUNT PAYABLES 6336958 5462801 57871 442468 744482
COST OF SALE 176730518 309559294 34433540 11892697 7284942
APP 13.08766418 6.441164596 0.613440123 13.57983139 37.3010423

Emmanuel Opoku Ware “Liquidity Management and Its Effect on Profitability in a Tough Economy: (A
Case of Companies Listed on the Ghana Stock Exchange)”
International Journal of Research in Business Studies and Management V2 ● I11 ● November 2015 62
CALCULATION OF GROWTH
ACCRA BREWERY
YEARS 2005 2006 2007 2008 2009
SALES t 1982.46 1989.49 24504 25219 33641
SALESt-1 1,972 1982.46 1989.49 24504 25219
GROWTH 0.00530426 0.0035461 11.31672439 0.02917891 0.333954558
AFRICAN CHAMPION INDUSTRIES LIMITED
YEARS 2005 2006 2007 2008 2009
SALES t 2,418,949 2,748,826 3,096,382 3,008,861 3,948,012
SALESt-1 2,925,580 2,418,949 2,748,826 3,096,382 3,008,861
GROWTH -0.17317279 0.1363722 0.126437896 -0.028265569 0.31212841
ANGLOGOLD ASHANTI
YEARS 2005 2006 2007 2008 2009
SALES t 2629 2964 3280 3619 3768
SALESt-1 2492 2629 2964 3280 3619
GROWTH 0.054975923 0.1274249 0.106612686 0.103353659 0.041171594
ALUWORKS LIMITED
YEARS 2005 2006 2007 2008 2009
SALES t 47772700 49246300 53346000 57127000 34271000
SALESt-1 45796000 47772700 49246300 53346000 57127000
GROWTH 0.043163158 0.0308461 0.083248894 0.070876917 -0.400091025
AYRTON DRUG MANUFACTURING LIMITED
YEARS 2005 2006 2007 2008 2009
SALES t 3465433 7954284 9481076 11902564 15513573
SALESt-1 6754354 3465433 7954284 9481076 11902564
GROWTH -0.486933465 1.2953218 0.191945875 0.255402235 0.303380767
BENSO OIL PALM PLANTATION LTD
YEARS 2005 2006 2007 2008 2009
SALES t 7595 8697 12539 16148 15644
SALESt-1 7231 7594.7 8696.8 12539 16148
GROWTH 0.050297331 0.1451144 0.441794683 0.287821995 -0.031211296
CALBANK
YEARS 2005 2006 2007 2008 2009
SALES t 128,535 182,086 23,435 34,934 39,628
SALESt-1 134555 128,535 182,086 23,435 34,934
GROWTH -0.044740069 0.4166258 -0.871297079 0.490676339 0.134367665
CAMELOT GHANA LIMITED
YEARS 2005 2006 2007 2008 2009
SALES t 1468860 3380196 2020362 2567625 3274288
SALESt-1 1155333 1468860 3380196 2020362 2567625
GROWTH 0.271372962 1.3012383 -0.402294447 0.270873735 0.275220486
CFAO (GHANA)
YEARS 2005 2006 2007 2008 2009
SALES t 19152 25477 33848.938 49479 60976
SALESt-1 14001 19152 25477 33849 49479
GROWTH 0.367936955 0.330244 0.328582691 0.461759302 0.232361204
CLYDESTONE (GHANA)
YEARS 2005 2006 2007 2008 2009
SALES t 1847135 2104683 1091518 1452599 2093084
SALESt-1 1736024 1847135 2104683 1091518 1452599
GROWTH 0.064003263 0.1394309 -0.481386033 0.330806272 0.440923476
COCOA PROCESSING COMPANY LIMITED
YEARS 2005 2006 2007 2008 2009
SALES t 27964400 29043600 48217223 59264796 45541422
SALESt-1 34222091 27964400 29043600 48217223 59264796
UNILEVER GHANA LIMITED
YEARS 2005 2006 2007 2008 2009
ACCOUNT PAYABLES 139670 14011 20075 101703 41535
COST OF SALE 796137 89687 104291 135843 132071
APP 64.034 57.021 70.259 273.268 114.789
UT BANK
YEARS 2005 2006 2007 2008 2009
ACCOUNT PAYABLES 31,403 44,826 55,829 95,747 165,275
COST OF SALE 5,023 8,605 8,687 14,803 36,739
APP 58.38279782 70.06703699 56.79404969 56.43095867 81.1358947

Emmanuel Opoku Ware “Liquidity Management and Its Effect on Profitability in a Tough Economy: (A
Case of Companies Listed on the Ghana Stock Exchange)”
63 International Journal of Research in Business Studies and Management V2 ● I11 ● November 2015
GROWTH -0.182855308 0.0385919 0.660166887 0.229120889 -0.231560301
ECOBANK GHANA LTD
YEARS 2005 2006 2007 2008 2009
SALES t 497,186 631,836 80,472 134,902 210,862
SALESt-1 486186 497,186 631,836 80,472 134,902
GROWTH 0.022625086 0.2708242 -0.872637836 0.676384332 0.563075418
ENTERPRISE INSURANCE
YEARS 2005 2006 2007 2008 2009
SALES t 1411 1447 1422 2646 5658
SALESt-1 1390 1411 1447 1422 2646
GROWTH 0.015253885 0.0256498 -0.017548708 0.860759494 1.138321995
FAN MILK
YEARS 2005 2006 2007 2008 2009
SALES t 31246 32375 41068 55041 82471
SALESt-1 30215 31246 32375 41068 55041
GROWTH 0.034135363 0.0361098 0.268521407 0.340240577 0.498355771
GCB
YEARS 2005 2006 2007 2008 2009
SALES t 948,349 1,214,468 147,213,125 187,046,013 203,037,120
SALESt-1 978233 948,349 111,214,468 147,213,125 187,046,013
GROWTH -0.030548959 0.2806129 0.323686816 0.270579733 0.085492905
GUINNESS GHANA
YEARS 2005 2006 2007 2008 2009
SALES t 79945 104760 124848 135810 200968
SALESt-1 70,944 79945 104760 124848 135810
GROWTH 0.126877537 0.3103964 0.191753715 0.087802768 0.479773213
GOIL
YEARS 2005 2006 2007 2008 2009
SALES t 138079200 192159600 306492356 438863961 421542111
SALESt-1 129088908 138079200 192159600 306492356 438863961
GROWTH 0.069644187 0.3916622 0.59498852 0.431892027 -0.039469748
GOLDEN STAR
YEARS 2005 2006 2007 2008 2009
SALES t 95465 128690 175614 257355 400739
SALESt-1 92998 95465 128690 175614 257355
GROWTH 0.026527452 0.3480333 0.364628176 0.465458335 0.5571448
GOLDEN WEB LIMITED
YEARS 2005 2006 2007 2008 2009
SALES t 552866 676683 583119 532044 266114
SALESt-1 641415 552866 676683 583119 532044
GROWTH -0.138052587 0.2239548 -0.138268584 -0.087589326 -0.499827082
HFC
YEARS 2005 2006 2007 2008 2009
SALES t 64,719,148 86,964,679 13,949,828 22,799,830 28,580,277
SALESt-1 50,587,219 64,719,148 86,964,679 13,949,828 22,799,830
GROWTH 0.279357697 0.3437241 -0.839592026 0.634416568 0.253530268
MECHANICAL LLOYD
YEARS 2005 2006 2007 2008 2009
SALES t 111753711 125271873 21706362 25894929 22162249
SALESt-1 100735244 111753711 125271873 21706362 25894929
GROWTH 0.109380457 0.1209639 -0.826725972 0.192964947 -0.144147142
PIONEER KITCHEN LIMITED
YEARS 2005 2006 2007 2008 2009
SALES t 2213037 2323776 3192970 2876933 7865765
SALESt-1 2611700 2213037 2323776 3192970 2876933
GROWTH -0.15264502 0.0500394 0.374043798 -0.098979007 1.734080008
PRODUCE BUYING COMP
YEARS 2005 2006 2007 2008 2009
SALES t 230417500 248662200 193182770 245478455 437405123
SALESt-1 202736866 230417500 248662200 193182770 245478455
GROWTH 0.136534783 0.0791811 -0.223111635 0.270705742 0.781847303
PZ CUSSONS GHANA LIMITED
YEARS 2005 2006 2007 2008 2009
SALES t 19,597,981 22,376,151 29,129,720 42,775,342 44,643,160
SALESt-1 173,823,916 19,597,981 22,376,151 29,129,720 42,775,342
GROWTH -0.887253829 0.141758 0.30181996 0.468443294 0.043665764
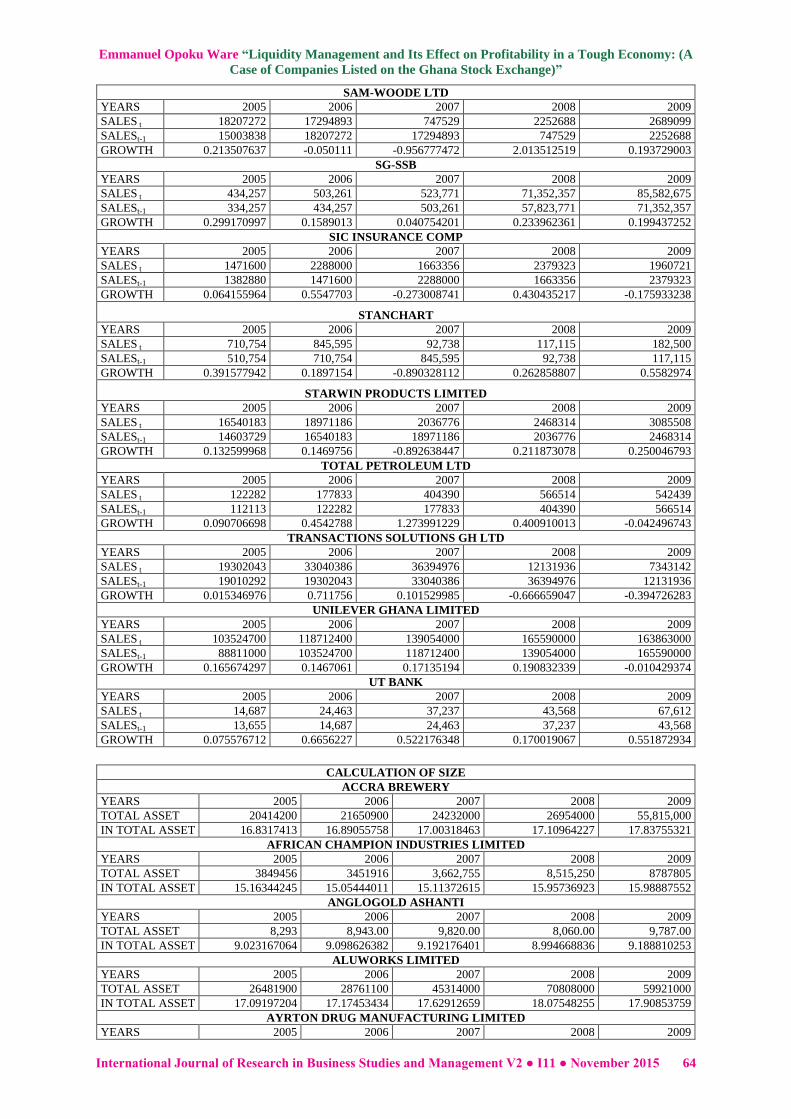
Emmanuel Opoku Ware “Liquidity Management and Its Effect on Profitability in a Tough Economy: (A
Case of Companies Listed on the Ghana Stock Exchange)”
International Journal of Research in Business Studies and Management V2 ● I11 ● November 2015 64
SAM-WOODE LTD
YEARS 2005 2006 2007 2008 2009
SALES t 18207272 17294893 747529 2252688 2689099
SALESt-1 15003838 18207272 17294893 747529 2252688
GROWTH 0.213507637 -0.050111 -0.956777472 2.013512519 0.193729003
SG-SSB
YEARS 2005 2006 2007 2008 2009
SALES t 434,257 503,261 523,771 71,352,357 85,582,675
SALESt-1 334,257 434,257 503,261 57,823,771 71,352,357
GROWTH 0.299170997 0.1589013 0.040754201 0.233962361 0.199437252
SIC INSURANCE COMP
YEARS 2005 2006 2007 2008 2009
SALES t 1471600 2288000 1663356 2379323 1960721
SALESt-1 1382880 1471600 2288000 1663356 2379323
GROWTH 0.064155964 0.5547703 -0.273008741 0.430435217 -0.175933238
STANCHART
YEARS 2005 2006 2007 2008 2009
SALES t 710,754 845,595 92,738 117,115 182,500
SALESt-1 510,754 710,754 845,595 92,738 117,115
GROWTH 0.391577942 0.1897154 -0.890328112 0.262858807 0.5582974
STARWIN PRODUCTS LIMITED
YEARS 2005 2006 2007 2008 2009
SALES t 16540183 18971186 2036776 2468314 3085508
SALESt-1 14603729 16540183 18971186 2036776 2468314
GROWTH 0.132599968 0.1469756 -0.892638447 0.211873078 0.250046793
TOTAL PETROLEUM LTD
YEARS 2005 2006 2007 2008 2009
SALES t 122282 177833 404390 566514 542439
SALESt-1 112113 122282 177833 404390 566514
GROWTH 0.090706698 0.4542788 1.273991229 0.400910013 -0.042496743
TRANSACTIONS SOLUTIONS GH LTD
YEARS 2005 2006 2007 2008 2009
SALES t 19302043 33040386 36394976 12131936 7343142
SALESt-1 19010292 19302043 33040386 36394976 12131936
GROWTH 0.015346976 0.711756 0.101529985 -0.666659047 -0.394726283
UNILEVER GHANA LIMITED
YEARS 2005 2006 2007 2008 2009
SALES t 103524700 118712400 139054000 165590000 163863000
SALESt-1 88811000 103524700 118712400 139054000 165590000
GROWTH 0.165674297 0.1467061 0.17135194 0.190832339 -0.010429374
UT BANK
YEARS 2005 2006 2007 2008 2009
SALES t 14,687 24,463 37,237 43,568 67,612
SALESt-1 13,655 14,687 24,463 37,237 43,568
GROWTH 0.075576712 0.6656227 0.522176348 0.170019067 0.551872934
CALCULATION OF SIZE
ACCRA BREWERY
YEARS 2005 2006 2007 2008 2009
TOTAL ASSET 20414200 21650900 24232000 26954000 55,815,000
IN TOTAL ASSET 16.8317413 16.89055758 17.00318463 17.10964227 17.83755321
AFRICAN CHAMPION INDUSTRIES LIMITED
YEARS 2005 2006 2007 2008 2009
TOTAL ASSET 3849456 3451916 3,662,755 8,515,250 8787805
IN TOTAL ASSET 15.16344245 15.05444011 15.11372615 15.95736923 15.98887552
ANGLOGOLD ASHANTI
YEARS 2005 2006 2007 2008 2009
TOTAL ASSET 8,293 8,943.00 9,820.00 8,060.00 9,787.00
IN TOTAL ASSET 9.023167064 9.098626382 9.192176401 8.994668836 9.188810253
ALUWORKS LIMITED
YEARS 2005 2006 2007 2008 2009
TOTAL ASSET 26481900 28761100 45314000 70808000 59921000
IN TOTAL ASSET 17.09197204 17.17453434 17.62912659 18.07548255 17.90853759
AYRTON DRUG MANUFACTURING LIMITED
YEARS 2005 2006 2007 2008 2009

Emmanuel Opoku Ware “Liquidity Management and Its Effect on Profitability in a Tough Economy: (A
Case of Companies Listed on the Ghana Stock Exchange)”
65 International Journal of Research in Business Studies and Management V2 ● I11 ● November 2015
TOTAL ASSET 36873700 752187100 8791826000 10448845000 12725548000
IN TOTAL ASSET 17.42300912 20.43849565 22.89708826 23.06975728 23.26687746
BENSO OIL PALM PLANTATION LTD
YEARS 2005 2006 2007 2008 2009
TOTAL ASSET 12041300 12223800 17794000 21898000 22160000
IN TOTAL ASSET 16.30385297 16.31889543 16.69437188 16.90190587 16.91379942
CALBANK
YEARS 2005 2006 2007 2008 2009
TOTAL ASSET 97128600 157008400 235727000 338,902,000 452,812,000
IN TOTAL ASSET 18.39154643 18.87180987 19.27818491 19.64122154 19.93098759
CAMELOT GHANA LIMITED
YEARS 2005 2006 2007 2008 2009
TOTAL ASSET 150155100 381983600 3489338000 3254572000 3645256000
IN TOTAL ASSET 18.82717932 19.76088823 21.97297787 21.90332661 22.01669243
CFAO (GHANA)
YEARS 2005 2006 2007 2008 2009
TOTAL ASSET 8309414400 9158719800 17508429000 20947000 28788000
IN TOTAL ASSET 22.84065497 22.93797225 23.58594826 16.857506 17.17546919
CLYDESTONE (GHANA)
YEARS 2005 2006 2007 2008 2009
TOTAL ASSET 1,737,638,500.00 1,781,505,200.00 1,376,456,000.00 1,343,528,000.00 1,969,627,000.00
IN TOTAL ASSET 21.27579284 21.30072446 21.04277792 21.01856483 21.40111002
COCOA PROCESSING COMPANY LIMITED
YEARS 2005 2006 2007 2008 2009
TOTAL ASSET 66402700 79443200 1.07E+11 1.76E+11 1.97E+11
IN TOTAL ASSET 18.01124828 18.19055286 25.39264831 25.89385697 26.00677192
ECOBANK GHANA LTD
YEARS 2005 2006 2007 2008 2009
TOTAL ASSET 219,923,000 350,373,900 6,550,224,000 8,306,186,000 9,006,523,000
IN TOTAL ASSET 19.20878804 19.67451143 22.60276508 22.84026638 22.92121493
ENTERPRISE INSURANCE
YEARS 2005 2006 2007 2008 2009
TOTAL ASSET 20009411.4 25519600 35951000 59986000 73884000
IN TOTAL ASSET 16.81171329 17.05495734 17.39766746 17.90962176 18.11800685
FAN MILK
YEARS 2005 2006 2007 2008 2009
TOTAL ASSET 15,798,300.00 18,297,000.00 23,707,000.00 32,858,000.00 51,114,000.00
IN TOTAL ASSET 16.5754129 16.72224767 16.98128092 17.3077058 17.74956899
GCB
YEARS 2005 2006 2007 2008 2009
TOTAL ASSET 589020100 779201600 1,154,719,385 1,650,220,348 1,922,666,249
IN TOTAL ASSET 20.19397087 20.47378036 20.86712319 21.22417466 21.37697873
GUINNESS GHANA
YEARS 2005 2006 2007 2008 2009
TOTAL ASSET 100,197,800.00 120,271,100.00 132,627,000.00 160,321,000.00 212,323,000.00
IN TOTAL ASSET 18.42265679 18.60525892 18.70305123 18.89268861 19.17361926
GOIL
YEARS 2005 2006 2007 2008 2009
TOTAL ASSET 68,269,700.00 58,620,900.00 81,358,068.00 99,756,446.00 99,710,535.00
IN TOTAL ASSET 18.0389766 17.88660185 18.21437056 18.41824223 18.4177819
GOLDEN STAR
YEARS 2005 2006 2007 2008 2009
TOTAL ASSET 132,789.00 90,534.00 145,826.00 91,973.00 219,496.00
IN TOTAL ASSET 11.79651668 11.41348075 11.89016941 11.42925033 12.29908929
GOLDEN WEB LIMITED
YEARS 2005 2006 2007 2008 2009
TOTAL ASSET 1115117 1560640 1654799 1789253 7,559,859
IN TOTAL ASSET 13.92446958 14.26060635 14.31919011 14.39730877 15.8383631
HFC
YEARS 2005 2006 2007 2008 2009
TOTAL ASSET 71042682.4 108116958.5 162794775 378,614,305 261,101,557
IN TOTAL ASSET 18.07879141 18.49872415 18.90800092 19.75202858 19.38042
MECHANICAL LLOYD
YEARS 2005 2006 2007 2008 2009
TOTAL ASSET 14,926,812.80 15,643,694.70 22,248,306.00 29,188,106.00 28,319,090.00
IN TOTAL ASSET 16.51866967 16.5655785 16.91777643 17.18927186 17.15904669

Emmanuel Opoku Ware “Liquidity Management and Its Effect on Profitability in a Tough Economy: (A
Case of Companies Listed on the Ghana Stock Exchange)”
International Journal of Research in Business Studies and Management V2 ● I11 ● November 2015 66
PIONEER KITCHEN LIMITED
YEARS 2005 2006 2007 2008 2009
TOTAL ASSET 2630534.9 3004165.8 3055776 2418619 2400444
IN TOTAL ASSET 14.78269777 14.91551048 14.93254413 14.69870727 14.69116428
PRODUCE BUYING COMP
YEARS 2005 2006 2007 2008 2009
TOTAL ASSET 30,224,600.00 18,991,600.00 36,332,585.00 67,467,661.00 96,559,981.00
IN TOTAL ASSET 17.22416672 16.75950733 17.40822555 18.02715894 18.38567494
PZ CUSSONS GHANA LIMITED
YEARS 2005 2006 2007 2008 2009
TOTAL ASSET 19397279 24063836 29,070,499 38,360,544 38426283
IN TOTAL ASSET 16.78064334 16.99622069 17.18523444 17.46253999 17.46425224
SAM-WOODE LTD
YEARS 2005 2006 2007 2008 2009
TOTAL ASSET 1,840,659.50 733,522.70 894,507.00 1,653,023.00 2,059,832
IN TOTAL ASSET 14.42563449 13.50561382 13.70402801 14.31811629 14.53813498
SG-SSB
YEARS 2005 2006 2007 2008 2009
TOTAL ASSET 291452600 365461000 417856827 436,765,130 578,365,858
IN TOTAL ASSET 19.49038794 19.71667013 19.85064941 19.89490615 20.1757172
SIC INSURANCE COMP
YEARS 2005 2006 2007 2008 2009
TOTAL ASSET 53042900 64091600 158645171 211573427 185374366
IN TOTAL ASSET 17.78661158 17.97582387 18.88218064 19.17008267 19.03788794
STANCHART
YEARS 2005 2006 2007 2008 2009
TOTAL ASSET 514245.7 699473.6 773737 984944 1404213
IN TOTAL ASSET 13.15045645 13.45808333 13.5589873 13.80034007 14.15498756
STARWIN PRODUCTS LIMITED
YEARS 2005 2006 2007 2008 2009
TOTAL ASSET 2676887.4 2324551 3347223 3340626 6932048
IN TOTAL ASSET 14.80016526 14.65903746 15.0236416 15.02166877 15.75166585
TOTAL PETROLEUM LTD
YEARS 2005 2006 2007 2008 2009
TOTAL ASSET 26619700 126122000 137727000 148151000 143835000
IN TOTAL ASSET 17.0971621 18.65276025 18.74078402 18.81374258 18.78417737
TRANSACTIONS SOLUTIONS GH LTD
YEARS 2005 2006 2007 2008 2009
TOTAL ASSET 2105285.1 4287818 4868363 3570443 2670017
IN TOTAL ASSET 14.55996146 15.27128854 15.3982683 15.08820024 14.7975954
UNILEVER GHANA LIMITED
YEARS 2005 2006 2007 2008 2009
TOTAL ASSET 61542100 64218500 95583000 129474000 117324000
IN TOTAL ASSET 17.93523205 17.97780189 18.37550554 18.67899065 18.5804499
UT BANK
YEARS 2005 2006 2007 2008 2009
TOTAL ASSET 38489 55316 75946 127823 212903
IN TOTAL ASSET 10.55812777 10.920817 11.23777784 11.75840177 12.26859194