liquidity regulation and financial intermediaries...liquidity regulation and financial...
TRANSCRIPT
Liquidity Regulation and Financial
Intermediaries∗
Marco Macchiavelli† Luke Pettit‡
July 24, 2019
Abstract
The Liquidity Coverage Ratio (LCR) requires banks to hold enough liquidity to with-stand a 30-day run. We study the effects of the LCR on broker-dealers, the financialintermediaries at the epicenter of the 2008-09 crisis. The LCR brings some financialstability benefits, including a significant maturity extension of triparty repos backed bylower-quality collateral, and the accumulation of larger liquidity pools. However, it alsoleads to less liquidity transformation by broker-dealers. We also discuss the liquidityrisks not addressed by the LCR. Finally, we show that a major source of fire-sale riskwas self-corrected before the introduction of post-crisis regulations.
JEL classification: G24, G28, E58.
Keywords: Broker-dealers, Repos, Liquidity coverage ratio, Basel III.
∗We are grateful to Laurence Ball for useful discussions. For their comments, we thank Hendrik Bessem-binder, Lamont Black (discussant), Darrell Duffie, Gabriele La Spada (discussant), Hong-Jen Lin (discus-sant), Patrick McCabe, Kumar Venkataraman, and participants at the Federal Reserve Board, FMA AppliedFinance 2019, MFA Chicago 2019, and New York Fed–Bank of Italy Post Crisis Financial Regulation con-ference. The views expressed in this paper are those of the authors and do not necessarily reflect those ofthe Board of Governors or the Federal Reserve System.
†Federal Reserve Board. Email: [email protected]‡Federal Reserve Board. Email: [email protected]
1 Introduction
At the peak of the cycle in 2006, broker-dealers (dealers hereafter) were involved in orig-
inating, distributing and financing mortgage-related instruments, which exposed them to
significant risks at the turn of the housing cycle in early 2007. To make things worse, they
were financing a significant portion of these risky mortgage-related assets by rolling over
overnight repos. Dealers faced severe runs once funding conditions deteriorated, resulting
in the demise of several of them, most famously Bear Stearns and Lehman Brothers. Ulti-
mately, as Diamond (2008) pointed out, “financial crises are everywhere and always due to
problems of short-term debt”, and that there needs to be a focus on “appropriate levels of
liquidity” (Diamond (2018)).
In the aftermath of the financial crisis, steps were taken by regulators and policymakers
worldwide to address several vulnerabilities in the banking system. Notably, the Basel
Committee introduced the Liquidity Coverage Ratio (LCR) which requires banks to hold
enough High Quality Liquid Assets (HQLA) that can be readily converted into cash to
meet the liquidity needs arising from a hypothetical 30-day run. After the Basel Committee
finalized the LCR rule, each constituent country was tasked with implementing their own
versions of the rule, with the U.S. implementation ending up as one of the most stringent.
Although the purpose of the LCR is clear, its effects (both intended and unintended)
are not yet fully understood: we do not yet know whether the LCR made the sytem more
resilient, and if so, along which dimensions; we also do not know whether the LCR created
any unintended source of instability. An even deeper question is whether, in the aftermath
of the crisis, financial institutions reduced their vulnerabilities before any new regulation
forced them to, or whether they did so only once required by new regulations.
This paper addresses these questions, focusing on the effect of the LCR on foreign and
domestic Primary Dealers, which are the largest broker-dealers operating in U.S. financial
1
markets.1 We estimate various LCR effects using a difference-in-differences approach, by
comparing the behavior of domestic dealers with that of foreign dealers–as domestic dealers
face the more stringent U.S. implementation–around LCR announcement, implementation
and compliance dates.
Using confidential data on dealers’ financing and inventories, together with detailed tri-
party repo transactions, we uncover three main effects of the LCR on dealers. First, the LCR
induces dealers to increase the maturity of triparty repos backed by lower-quality collateral,
while leaving the maturity structure of repos backed by high-quality collateral unchanged.
Second, the LCR leads dealers to reduce their reliance on repos as a way to finance inven-
tories of high-quality assets, resulting in more of these inventories counting towards HQLA,
thereby increasing their LCR.2 Third, the LCR incentivizes dealers to cut back on trades that
downgrade their own available collateral (from the client’s perspective a collateral upgrade);
as a result, dealers engage in less liquidity enhancements for their clients.
Each of these changes appear to de-risk dealers’ operations to various degrees. The
terming out of repos backed by lower-quality collateral seems to improve stability; repos are
used by a dealer for mainly two purposes: to finance its own inventories of securities, and
to finance a secured cash loan to clients (including reverse repos and securities borrowing).
Since a non-negligible portion of lower-quality securities are financed in the repo market,
access to longer-term repos backed by such collateral reduces rollover risk and possible fire-
sale losses in a stress event. Moreover, to the extent that these longer-term repos are used
to finance reverse repos, the dealer can pass some of these maturity extension benefits to
its clients. Unless otherwise noted, we refer to repos as all secured funding provided to the1 Domestic (or U.S.) dealers refer to the domestic broker-dealer subsidiaries of U.S. financial institutions
(for instance, J.P. Morgan Securities LLC); the term foreign dealers refers to domestic subsidiaries of foreignfinancial institutions (such as HSBC Securities (USA) Inc). For the list of Primary Dealers and otherinformation about them, see the FRBNY website.
2Securities count towards HQLA only if unencumbered; by repoing out a security, it becomes encumberedsince a third party now has a right on it.
2
dealer (including securities lending) and, similarly, to reverse repos as all the secured funding
provided by the dealer to its clients (including securities borrowing).
Next, the reduced reliance on repos to finance Treasury inventories improves dealers’
stability, but only indirectly. Reliance on overnight repos to fund Treasuries does not pose
direct fire-sale risk in case these repos do not roll, as Treasuries are the most liquid assets
and tend to appreciate during stress events. However, having more unencumbered Trea-
suries increases the size of dealers’ liquidity pools that can be monetized in case of a run.
The importance of maintaing large liquidity pools is highlighted in several occasions in the
Financial Crisis Inquiry Commission (FCIC) report; chief among them is the remark that in
June 2008, “regulators’ most recent stress test showed that Lehman would need $15 billion
more than the $54 billion in its liquidity pool to survive a loss of all unsecured borrowings
and varying amounts of secured borrowings.”3
Reliance on repos to finance inventories becomes a source of fire-sale risk only to the extent
that repos do not roll while the underlying collateral becomes illiquid (or loses significant
value). In this regard, we estimate that a significant reduction in the reliance on repos to
finance riskier and less liquid collateral occurred right after the 2007-09 crisis, and before
the LCR was even announced. In particular, domestic dealers significantly relied on repos to
finance inventories of corporate debt precrisis: about 40% of their corporate debt inventories
were financed with overnight (and open) repos.4 In the immediate aftermath of the crisis
(before the LCR is even announced) domestic dealers’ reliance on repos to finance corporate
debt inventories decreased from 40% to roughly 10%. This finding suggests an endogenous
de-risking that occurred right after the crisis: cash lenders and dealers identified this precrisis
practice as too risky and scaled it back autonomously.5 This finding also complements the3For instance, see the FCIC report on pages 284, 328, and 363. The citation above is from page 328.4Aside from the triparty repo data, the dataset covering the full spectrum of dealers’ secured financing
(FR2004) lumps together overnight and open financing transactions, as the latter can be terminated byeither party the following day (similar to an overnight transaction that is not rolled over the next day).
5It is worth noting that the LCR rule nevertheless penalizes this practice of financing lower-quality
3
observation that large dealers have been more reluctant to take inventory risk postcrisis
(Bessembinder et al. (2018), Goldstein and Hotchkiss (2017), and Schultz (2017)).
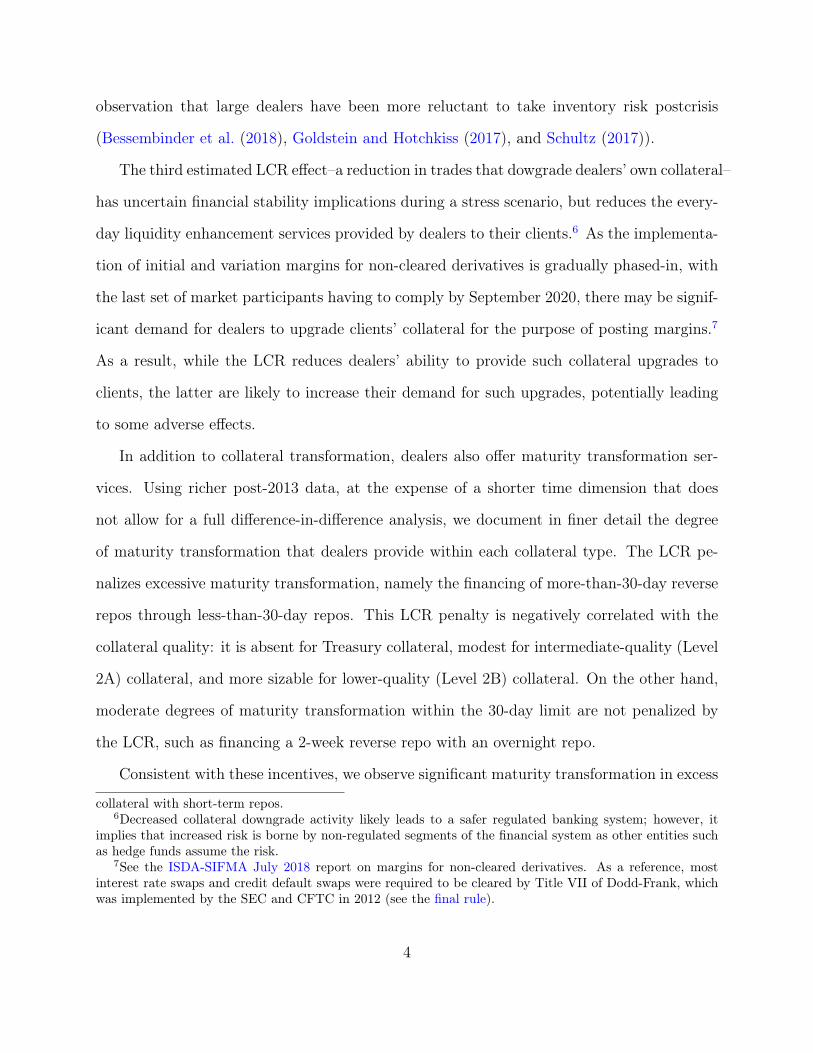
The third estimated LCR effect–a reduction in trades that dowgrade dealers’ own collateral–
has uncertain financial stability implications during a stress scenario, but reduces the every-
day liquidity enhancement services provided by dealers to their clients.6 As the implementa-
tion of initial and variation margins for non-cleared derivatives is gradually phased-in, with
the last set of market participants having to comply by September 2020, there may be signif-
icant demand for dealers to upgrade clients’ collateral for the purpose of posting margins.7
As a result, while the LCR reduces dealers’ ability to provide such collateral upgrades to
clients, the latter are likely to increase their demand for such upgrades, potentially leading
to some adverse effects.
In addition to collateral transformation, dealers also offer maturity transformation ser-
vices. Using richer post-2013 data, at the expense of a shorter time dimension that does
not allow for a full difference-in-difference analysis, we document in finer detail the degree
of maturity transformation that dealers provide within each collateral type. The LCR pe-
nalizes excessive maturity transformation, namely the financing of more-than-30-day reverse
repos through less-than-30-day repos. This LCR penalty is negatively correlated with the
collateral quality: it is absent for Treasury collateral, modest for intermediate-quality (Level
2A) collateral, and more sizable for lower-quality (Level 2B) collateral. On the other hand,
moderate degrees of maturity transformation within the 30-day limit are not penalized by
the LCR, such as financing a 2-week reverse repo with an overnight repo.
Consistent with these incentives, we observe significant maturity transformation in excess
collateral with short-term repos.6Decreased collateral downgrade activity likely leads to a safer regulated banking system; however, it
implies that increased risk is borne by non-regulated segments of the financial system as other entities suchas hedge funds assume the risk.
7See the ISDA-SIFMA July 2018 report on margins for non-cleared derivatives. As a reference, mostinterest rate swaps and credit default swaps were required to be cleared by Title VII of Dodd-Frank, whichwas implemented by the SEC and CFTC in 2012 (see the final rule).
4
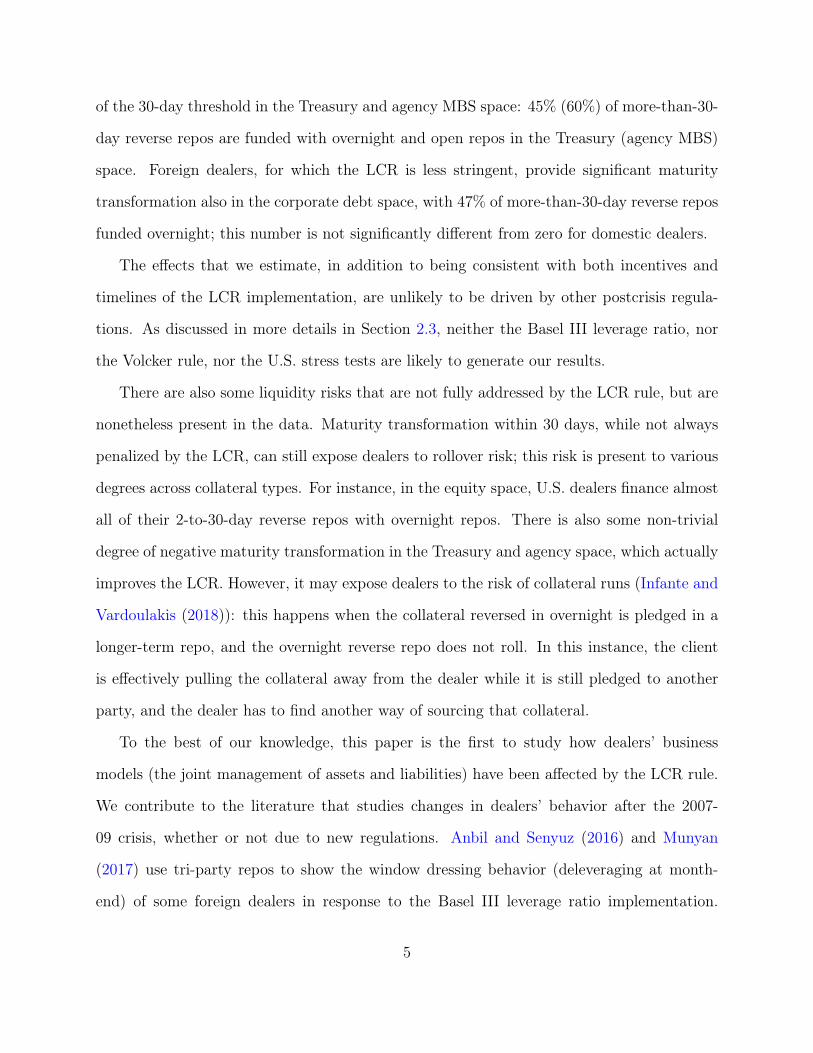
of the 30-day threshold in the Treasury and agency MBS space: 45% (60%) of more-than-30-
day reverse repos are funded with overnight and open repos in the Treasury (agency MBS)
space. Foreign dealers, for which the LCR is less stringent, provide significant maturity
transformation also in the corporate debt space, with 47% of more-than-30-day reverse repos
funded overnight; this number is not significantly different from zero for domestic dealers.
The effects that we estimate, in addition to being consistent with both incentives and
timelines of the LCR implementation, are unlikely to be driven by other postcrisis regula-
tions. As discussed in more details in Section 2.3, neither the Basel III leverage ratio, nor
the Volcker rule, nor the U.S. stress tests are likely to generate our results.
There are also some liquidity risks that are not fully addressed by the LCR rule, but are
nonetheless present in the data. Maturity transformation within 30 days, while not always
penalized by the LCR, can still expose dealers to rollover risk; this risk is present to various
degrees across collateral types. For instance, in the equity space, U.S. dealers finance almost
all of their 2-to-30-day reverse repos with overnight repos. There is also some non-trivial
degree of negative maturity transformation in the Treasury and agency space, which actually
improves the LCR. However, it may expose dealers to the risk of collateral runs (Infante and
Vardoulakis (2018)): this happens when the collateral reversed in overnight is pledged in a
longer-term repo, and the overnight reverse repo does not roll. In this instance, the client
is effectively pulling the collateral away from the dealer while it is still pledged to another
party, and the dealer has to find another way of sourcing that collateral.
To the best of our knowledge, this paper is the first to study how dealers’ business
models (the joint management of assets and liabilities) have been affected by the LCR rule.
We contribute to the literature that studies changes in dealers’ behavior after the 2007-
09 crisis, whether or not due to new regulations. Anbil and Senyuz (2016) and Munyan
(2017) use tri-party repos to show the window dressing behavior (deleveraging at month-
end) of some foreign dealers in response to the Basel III leverage ratio implementation.
5
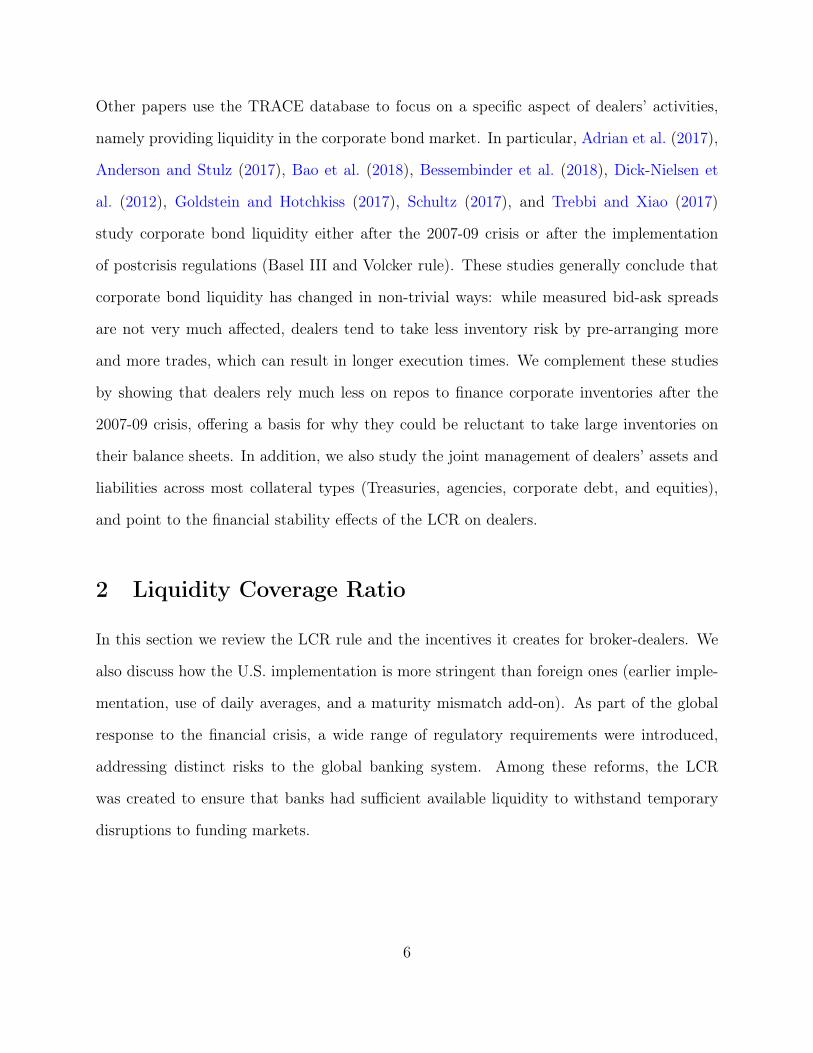
Other papers use the TRACE database to focus on a specific aspect of dealers’ activities,
namely providing liquidity in the corporate bond market. In particular, Adrian et al. (2017),
Anderson and Stulz (2017), Bao et al. (2018), Bessembinder et al. (2018), Dick-Nielsen et
al. (2012), Goldstein and Hotchkiss (2017), Schultz (2017), and Trebbi and Xiao (2017)
study corporate bond liquidity either after the 2007-09 crisis or after the implementation
of postcrisis regulations (Basel III and Volcker rule). These studies generally conclude that
corporate bond liquidity has changed in non-trivial ways: while measured bid-ask spreads
are not very much affected, dealers tend to take less inventory risk by pre-arranging more
and more trades, which can result in longer execution times. We complement these studies
by showing that dealers rely much less on repos to finance corporate inventories after the
2007-09 crisis, offering a basis for why they could be reluctant to take large inventories on
their balance sheets. In addition, we also study the joint management of dealers’ assets and
liabilities across most collateral types (Treasuries, agencies, corporate debt, and equities),
and point to the financial stability effects of the LCR on dealers.
2 Liquidity Coverage Ratio
In this section we review the LCR rule and the incentives it creates for broker-dealers. We
also discuss how the U.S. implementation is more stringent than foreign ones (earlier imple-
mentation, use of daily averages, and a maturity mismatch add-on). As part of the global
response to the financial crisis, a wide range of regulatory requirements were introduced,
addressing distinct risks to the global banking system. Among these reforms, the LCR
was created to ensure that banks had sufficient available liquidity to withstand temporary
disruptions to funding markets.
6
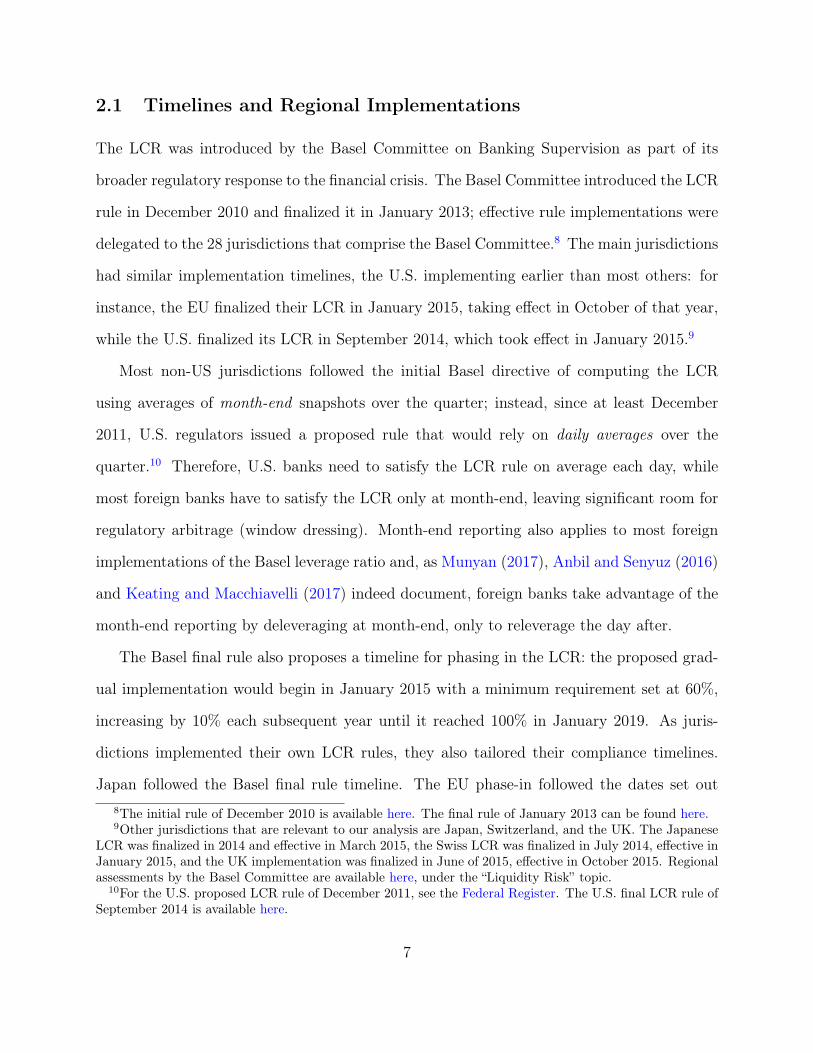
2.1 Timelines and Regional Implementations
The LCR was introduced by the Basel Committee on Banking Supervision as part of its
broader regulatory response to the financial crisis. The Basel Committee introduced the LCR
rule in December 2010 and finalized it in January 2013; effective rule implementations were
delegated to the 28 jurisdictions that comprise the Basel Committee.8 The main jurisdictions
had similar implementation timelines, the U.S. implementing earlier than most others: for
instance, the EU finalized their LCR in January 2015, taking effect in October of that year,
while the U.S. finalized its LCR in September 2014, which took effect in January 2015.9
Most non-US jurisdictions followed the initial Basel directive of computing the LCR
using averages of month-end snapshots over the quarter; instead, since at least December
2011, U.S. regulators issued a proposed rule that would rely on daily averages over the
quarter.10 Therefore, U.S. banks need to satisfy the LCR rule on average each day, while
most foreign banks have to satisfy the LCR only at month-end, leaving significant room for
regulatory arbitrage (window dressing). Month-end reporting also applies to most foreign
implementations of the Basel leverage ratio and, as Munyan (2017), Anbil and Senyuz (2016)
and Keating and Macchiavelli (2017) indeed document, foreign banks take advantage of the
month-end reporting by deleveraging at month-end, only to releverage the day after.
The Basel final rule also proposes a timeline for phasing in the LCR: the proposed grad-
ual implementation would begin in January 2015 with a minimum requirement set at 60%,
increasing by 10% each subsequent year until it reached 100% in January 2019. As juris-
dictions implemented their own LCR rules, they also tailored their compliance timelines.
Japan followed the Basel final rule timeline. The EU phase-in followed the dates set out8The initial rule of December 2010 is available here. The final rule of January 2013 can be found here.9Other jurisdictions that are relevant to our analysis are Japan, Switzerland, and the UK. The Japanese
LCR was finalized in 2014 and effective in March 2015, the Swiss LCR was finalized in July 2014, effective inJanuary 2015, and the UK implementation was finalized in June of 2015, effective in October 2015. Regionalassessments by the Basel Committee are available here, under the “Liquidity Risk” topic.
10For the U.S. proposed LCR rule of December 2011, see the Federal Register. The U.S. final LCR rule ofSeptember 2014 is available here.
7
in the Basel final rule, but with a jump to a 100% requirement in 2018, instead of 2019.
The U.S. Implementation was more accelerated, beginning in January 2015 at 80% with 10
percentage point increases over the following two years, reaching 100% in January 2017.11
Being subject to a quicker transition, U.S. banks faced a higher LCR requirement at each
point in time during the implementation phase.12 As noted above, in addition to the quicker
transition, the U.S. rule requires U.S. banks to comply with the LCR rule on a daily ba-
sis, while foreign banks need to comply just at month-ends. Finally, as we discuss in the
next section, the U.S. implementation also embeds an additional maturity mismatch penalty
(which makes the U.S. LCR more stringent) that is not present in foreign implementations.
Although the gradual phasing-in of the LCR was intended to ease the transition, many
banks appear to have pre-positioned significantly. As John Gerspach, Citigroup’s CFO noted,
“it’s not that dissimilar from how we’ve really reacted to almost every regulatory rule that’s
been put out there over the course of the last six, seven years. We make sure that we get
into compliance with that rule as quickly as possible. And then we approach optimization.”13
Since there was likely a significant anticipation effect between the announcement of the U.S.
proposed rule in December 2011 and its 80% phase-in date in January 2015, we estimate
dynamic adjustments to the LCR rule. In particular, we allow for anticipation effects (Dec
2011 to Jan 2015) as well as re-optimization effects (Jan 2015 onwards).
2.2 LCR Calculation
Quantifying liquidity resilience requires fixing a stress horizon over which assumed outflows
occur. As such, the scope of the LCR is confined to a 30-day window and is intended to11Switzerland followed the Basel final rule timeline; however the Swiss systemically important banks were
required to be at full compliance starting in 2016. There are two such banks in our sample, not driving ourresults.
12In most of the analysis, we end our sample in July 2016, when foreign banks operating in the U.S. startedto be required to form an Intermediate Holding Company (IHC) that would comply with U.S. regulations.
13See the transcripts of Citi 2017Q2 fixed income investor review.
8
capture risks on both the asset and liability sides of a bank’s balance sheet within this horizon.
At its core, the LCR requires a sufficient stock of High Quality Liquid Assets (HQLA) to
cover net cash outflows over a 30-day stressed period. More formally the following ratio is
expected to remain above 100%:14
Liquidity Coverage Ratio =HQLA
Total 30-Day Net Cash Outflow(1)
HQLA is comprised of three categories of eligible assets: Level 1 assets (0% haircut) count
for 100% of their value, and consist of cash, reserves and securities fully guaranteed by a
top-tier sovereign; Level 2A assets (15% haircut) count for 85% of their value, and consist
of agency MBS, lower-grade sovereigns and the upper portion of investment grade (IG)
corporate bonds; Level 2B assets (25-50% haircuts) count for 75-50% of their value, and
include select equities and the lower portion of IG corporate bonds.
Total Level 2 assets can make up no more than 40% of HQLA, and 2B assets specifically
cannot comprise more than 15%, insuring that there is not a concentration of lower-quality
assets. Net cash outflow (cash outflow minus cash inflow) is derived from a set of assumptions
that are intended to simulate funding stress, resulting in an estimated net cash outflow over
a 30-day period. The components within the denominator of the LCR cover a wide range of
potential outflows, including deposits, repos, and commercial paper. For example, if a bank
were to rely solely on very short-term and unstable funding (say one-week commercial paper),
this would be reflected in a significant net cash outflow value. There are a few important
caveats. The first is that a bank cannot have a net cash outflow of zero (a complete offset
by inflows) as total inflows cannot exceed 75% of total outflows. Additionally, the U.S.
implementation introduced a maturity mismatch add-on which is added to the denominator14Note that for the U.S. LCR, there is a sub-category of depository institutions that are only subject to the
“modified LCR” which is a simpler implementation, and has a 0.7 factor applied to the denominator. Theseinstitutions typically exist within the $50-250bn in assets range (as anything over $250 in total consolidatedassets is subject to the full LCR.
9
of the ratio, defined as:
max (0, peak daily outflow in 30-day window)−max (0, cumulative net outflow on day 30)
This was introduced in the U.S. implementation with the intent of addressing the potential
weakness in the LCR that would allow a major outflow to be only subsequently offset by an
equivalent future (still within the 30-day window) inflow.
The required reporting frequency also differs notably between the two regimes. The
Basel III LCR is reported to supervisors monthly, with the implicit requirement of capacity
to report daily during stressed situations. Under the U.S. LCR, banks must calculate the
LCR daily beginning January 1st of the year after the firm is subject to the rule. The LCR
applies to the holding companies of these institutions, as well as any top-tier depository
institutions subsidiaries that have more than $10 billion in assets.
2.3 Regulatory Incentives for Dealers
The LCR’s impact on repo activity stems from the importance placed on both the tenor
and collateral of a dealer’s repo books. In the LCR, repurchase agreements expiring within
30 days are assumed to not roll at rates (run-off rates) in line with their collateral’s HQLA
haircut. For example, 0% of Treasury repos (secured by Level 1 assets) are assumed to run,
even those with less-than-30-day maturity. On the other hand, 15% of repos secured by
agency MBS (Level 2A) and residual maturity of less than 30 days are assumed not to roll,
leading to a cash outflow when the repo matures. As a portion of the repos are assumed not
to roll at maturity, some cash will be returned to the lender and collateral to the borrower.
For the sake of simplicity, it can be boiled down to the distinction between repos that mature
before and after the 30 day threshold:15 only the former are assigned an outflow, as the latter15The Net Stable Funding Ratio is the applicable complement, and looks at a 1 year scenario, however
has yet to be implemented.
10
remain in place for the entire 30-day stress horizon. This translates to highly asymmetric
LCR treatments of less-than-30 and more-than-30-day repos, as only the former are assumed
to unwind in proportion to the assigned run-off rate. However, since a 31-day repo (that is
not evergreen16) becomes a less-than-30-day repo in one day, it eventually contributes to the
30-day outflows measure.
Incentive to term out lower-quality repos. Given what we just said, the LCR in-
centivizes dealers to lengthen the maturity structure of their repos significantly beyond the
30-day threshold, everything else equal. This incentive is stronger for repos collateralized by
lower-quality assets, since these repos are attached higher run-off rates once their residual
maturity crosses the 30-day threshold.
Matched book is mostly LCR neutral. It is not necessarily the case that an overnight
repo secured by Level 2 assets will deteriorate the LCR at the margin. Whether or not this
is the case depends on how the collateral underlying the repo was obtained. If it is sourced
through a overnight reverse repo, the symmetric application of run-off rates to both inflows
and outflows renders this “matched book” trade LCR neutral: both outflows and inflows
increase by the same amount, namely the run-off rate multiplied by the cash exchanged at
maturity, leaving the LCR denominator unchanged. This is only true for a marginal trade;
indeed, if outflows are fully matched by inflows the rule still requires the dealer to have
HQLA worth at least 25% of gross 30-day outflows. At the margin though, “matched book”
trades are generally LCR neutral; they improve the LCR only to the extent that reverse
repo haircuts are significantly larger than the associated repo haircuts, thus generating extra
HQLA, in the form of unencumbered rehypothecatable collateral.16A 31-day evergreen repo is a repo contract that is renewed every day as a 31-day repo.
11
Excessive maturity transformation is penalized. On the other hand, if the same
overnight repo secured by Level 2A assets serves the purpose of funding a more-than-30-day
reverse repo, the LCR denominator would increase: the assumed outflow would equal 15% of
the repo amount while the inflow would be zero, because the reverse repo returns cash only
after the 30-day threshold that matters for the LCR calculation. Therefore, intermediation of
credit is penalized by the LCR to the extent that cash is raised via less-than-30-day repos and
extended via more-than-30-day reverse repos. This penalty does not apply if the collateral
in question consists of Treasuries, since a zero run-off rate is applied. Significant maturity
transformation across the 30-day threshold in lower-quality assets is therefore costly under
the LCR.
Repo financing of lower-quality assets is penalized. The financing of securities with
more-than-30-day repos is mostly LCR neutral. However, financing a security with less-than-
30-day repos is penalized. Suppose that a Level 2B asset (with a 25% haircut or run-off rate)
is funded with overnight repos. The LCR assumes that 25% of the repo does not roll, leading
to an outflow equal to 25% of its value. The mirror image of the repo running is that 25% of
the collateral is returned as an unencumbered asset, which counts towards HQLA for 75%
of its value (since it has a 25% haircut). The end result is that, at the unwind of the repo,
the LCR numerator increases by 18.75% (75% of 25%) while the denominator increases by
25% of the transaction value. The marginal effect on the LCR is therefore negative.
Collateral downgrades are penalized. Part of a dealers’ business model involves up-
grading collateral for their clients, for instance, receiving low-quality collateral in exchange
for Treasuries. Some clients use upgrades to obtain eligible (high-quality) collateral for
margining of derivative trades at clearinghouses. If the collateral upgrade involves an ex-
change of clients’ securities for the dealer’s own securities, the dealer ends up lowering the
quality of the securities in its possession. Alternatively, dealers can engage in such trades for
12
arbitrage purposes. For example, suppose that Agency repos are trading at a considerable
spread above Treasury repos. A dealer may take advantage of the spread by entering into
an Agency reverse repo funded by the cash raised through a Treasury repo. In either case,
the dealer ends up taking possession of Agency MBS in exchange for Treasuries, effectively
downgrading its own collateral.
From the dealer’s perspective, a collateral downgrade trade is penalized by the LCR
rule. For example, consider an overnight trade where the dealer obtains Agency MBS (Level
2A) in exchange for Treasuries (Level 1). The LCR rule assumes a zero run-off rate on the
Treasury repo (100% expected to roll), and a 15% run-off rate for the Agency MBS reverse
repo (85% is assumed to roll). As a result, 100% of the Treasury collateral (Level 1) is locked
out while, on the other side, 85% of the Agency MBS (level 2A) is locked in, and only 15%
of it comes back as cash (Level 1). In practice, the HQLA pool deteriorates by 13% (85%
times 15%) of the value of the Treasuries provided. Were this a more-than-30-day swap, the
deterioration would be equal to 15% of the value.
Funding Treasuries internally to build HQLA. Finally, the LCR incentivizes banks
to rely less on repos to finance their inventories of high-quality assets. For an asset to count
towards HQLA, it needs to be unencumbered, namely not pledged as collateral to a third
party. Therefore, to the extent that a dealer needs to build up HQLA, it is incentivized to
finance its inventories of the highest quality assets (Treasuries) less via the repo market, and
more using internal sources of cash. Suppose that a dealer needs to increase its HQLA by
$1 million; the simplest way to do it is to use $1 million of internal cash to buy Treasuries
(or Ginnies), which fully count towards HQLA and generate a higher yield than holding
cash or reserves; purchasing any other asset would increase the stock of HQLA less than
proportionally.
Our results are unlikely to be driven by other postcrisis regulations. As it relates to repo
13
activity, the primary impact of the Supplementary Leverage Ratio (SLR) is via a downward
pressure on the volume of repos backed by the safest collateral (Duffie and Krishnamurthy
(2016)). This is because it applies the cost of capital directly to all repurchase agreements,
regardless of collateral type, making the lower-margin repo transactions the most eligible
for reduction. Similar to the LCR, the SLR applies to domestic dealers on a daily basis
while it applies to most foreign dealers only at month-ends or quarter-ends. Therefore, the
downward pressure on repo volumes is exercised daily on domestic dealers and only at month-
and quarter-ends on foreign dealers, as shown in Figure 1 (see also Anbil and Senyuz (2016)).
Additionally, the Volcker rule could have an impact on dealer inventories (Bao et al.
(2018)), but not on banks’ repo activity. This is due to the exemption for repo and reverse
repo from consideration as proprietary trading, and therefore is unlikely to have a material
impact on dealers’ repo activity.17 Moreover, the Volcker rule applies to the vast majority
of the Primary Dealers in our sample, and in particular to both domestic and foreign.18
Therefore, the U.S.-specific effects we estimate cannot be attributed to the Volcker rule,
since it also applies to the foreign dealers in our sample.
Finally, U.S. stress tests are also unlikely to drive our results for two reasons: the primary
effects have been on capital ratios, dividend payouts, and the composition of banks’ loans
portfolios (Acharya et al. (2018), Cortés et al. (2018), Bassett and Berrospide (2017)), and
not the broker-dealers’ activities discussed in this paper. Furthermore, U.S. stress tests
affected both domestic and foreign bank holding companies; as such, they are unlikely to
drive the differential (U.S.-specific) effects that we estimate.17The Volcker Rule was presented for public comment in October 2011, and implemented with several
exemptions in July 2015.18Bao et al. (2018) lists in Table 7 the Primary Dealers affected and not affected by the Volcker rule.
Two of the non-affected are domestic, and two are foreign. The seventeen affected dealers are split betweenforeign and domestic.
14
3 Data
We use two confidential datasets: the first one contains daily outstanding triparty repurchase
agreements (repo) for each dealer, tenor, and collateral type; the second contains weekly
positions and financing for each dealer, tenor and collateral type.
The first dataset contains tri-party repo information that is sent daily by the two tri-party
clearing banks to the Federal Reserve Bank of New York (FRBNY), and becomes available
in January 2011. For each day and each repo borrower (including both dealers and non-
dealers), we know the outstanding repo volumes broken down by residual maturity in days,
and collateral type. The types of collateral available include Treasuries, agency debt, agency
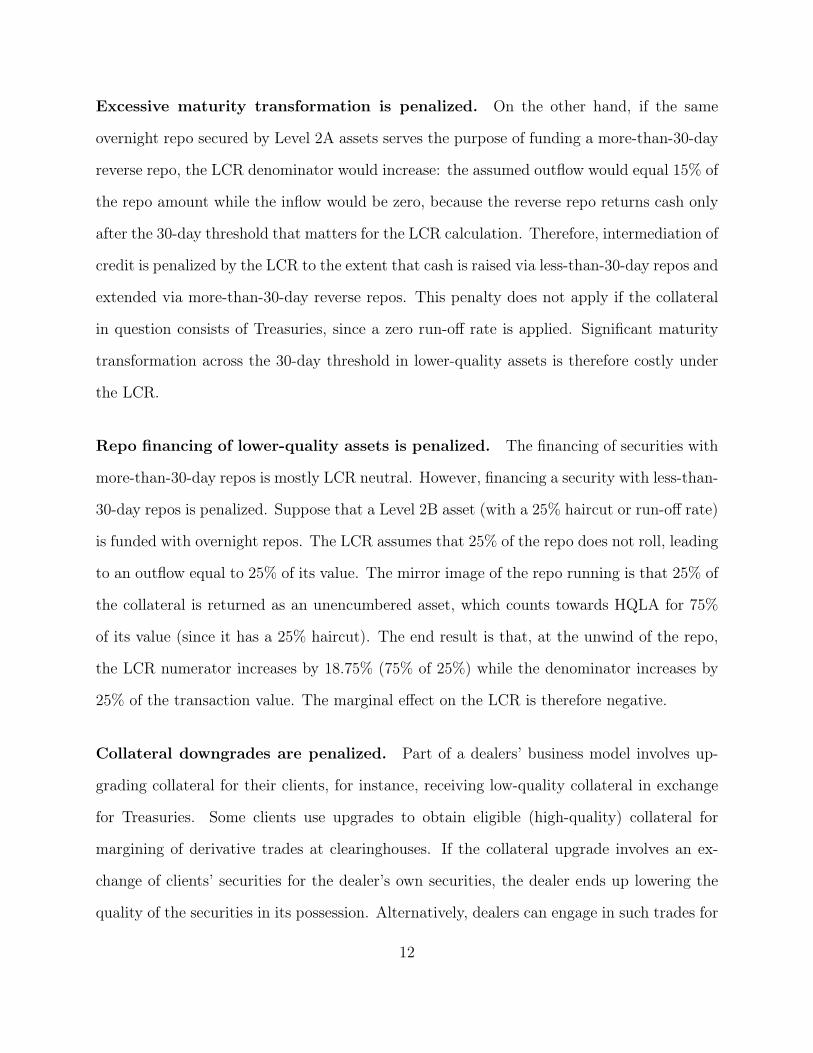
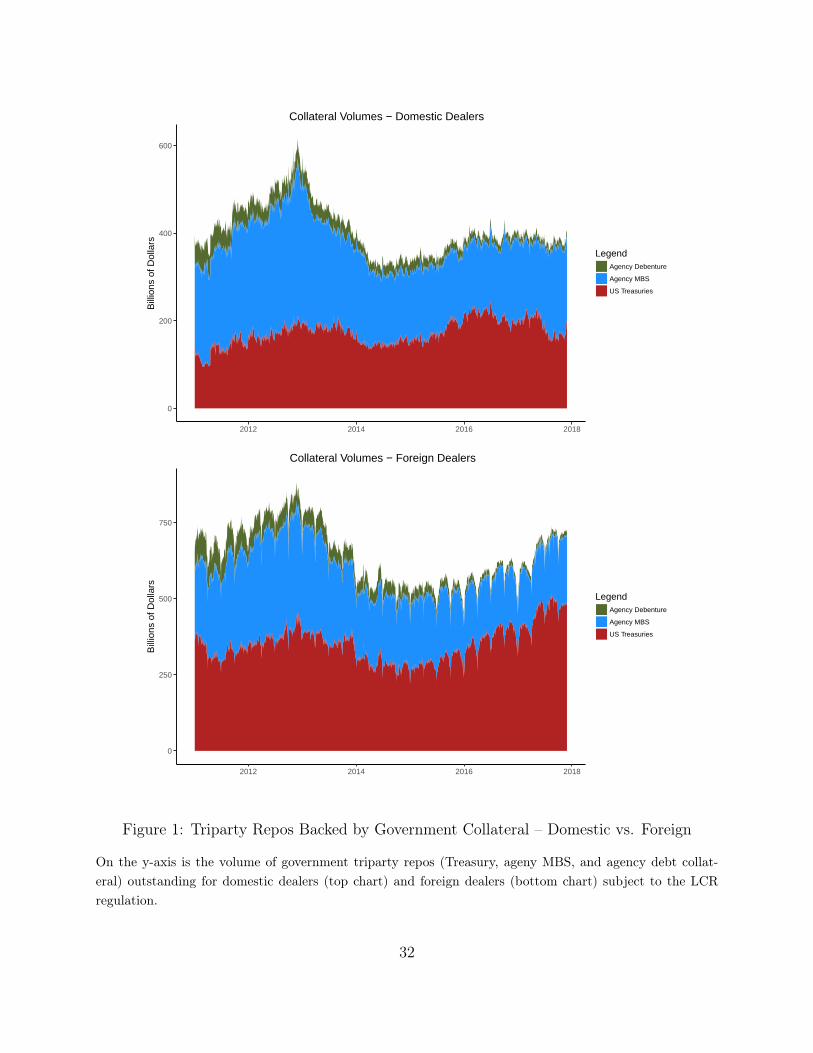
MBS, corporate debt, equities, and private label CMO. Figure 1 displays the evolution
of outstanding triparty repos backed by government collateral (Treasuries and agencies),
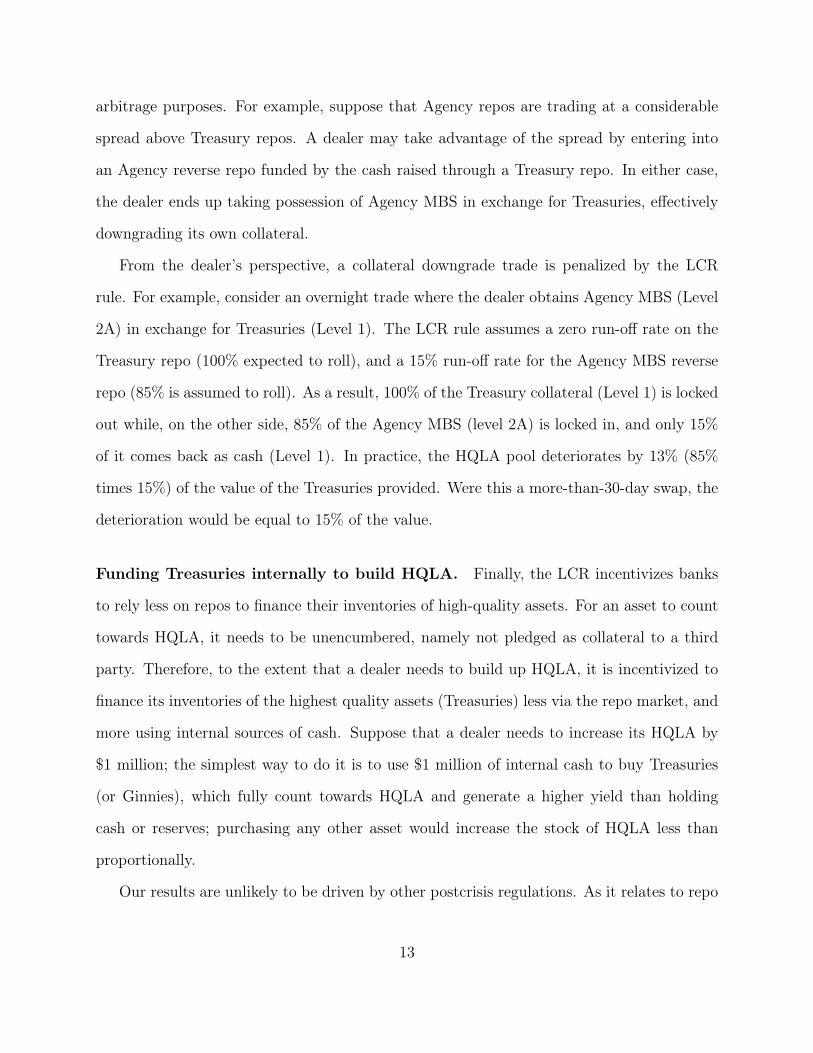
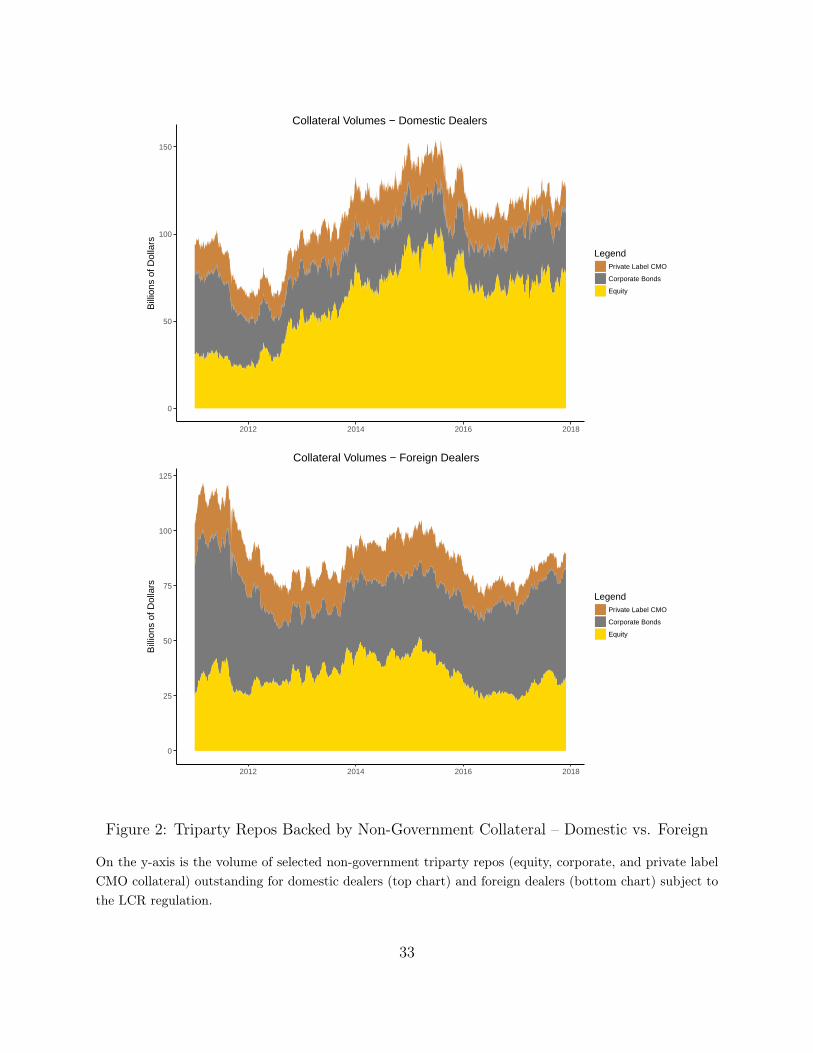
separately for domestic and foreign dealers subject to the LCR; similarly, Figure 2 shows
the time series of outstanding triparty repos backed by selected non-government collateral
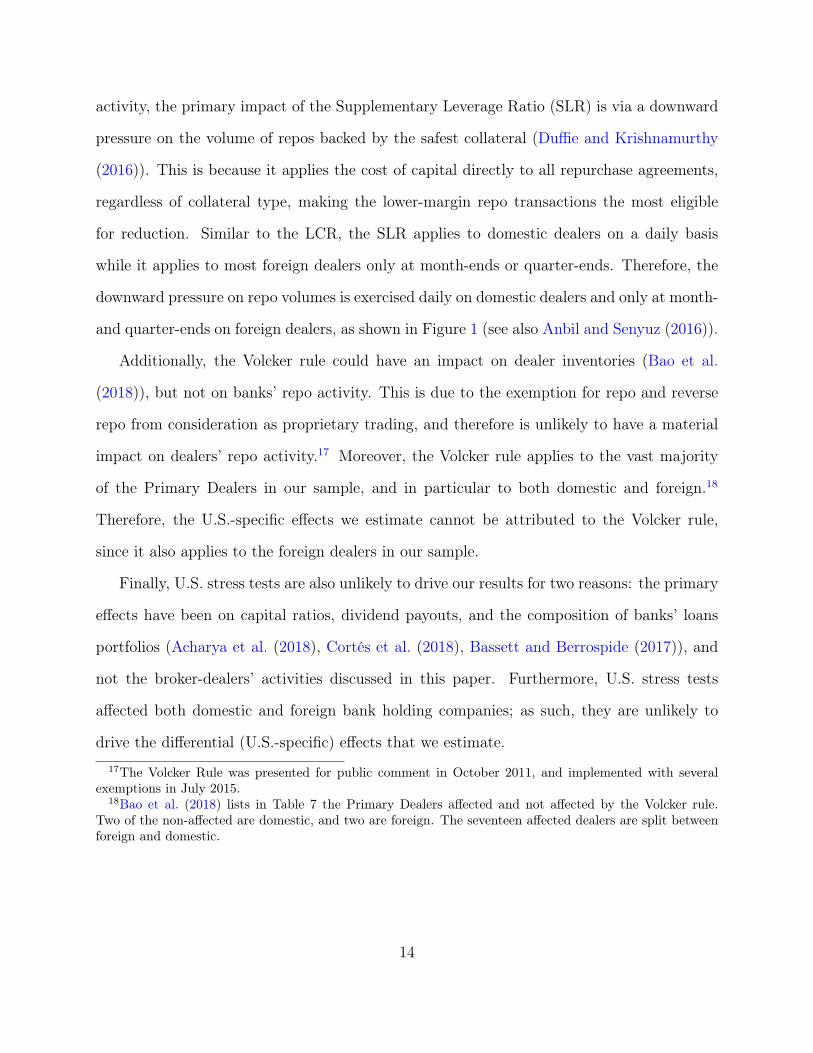
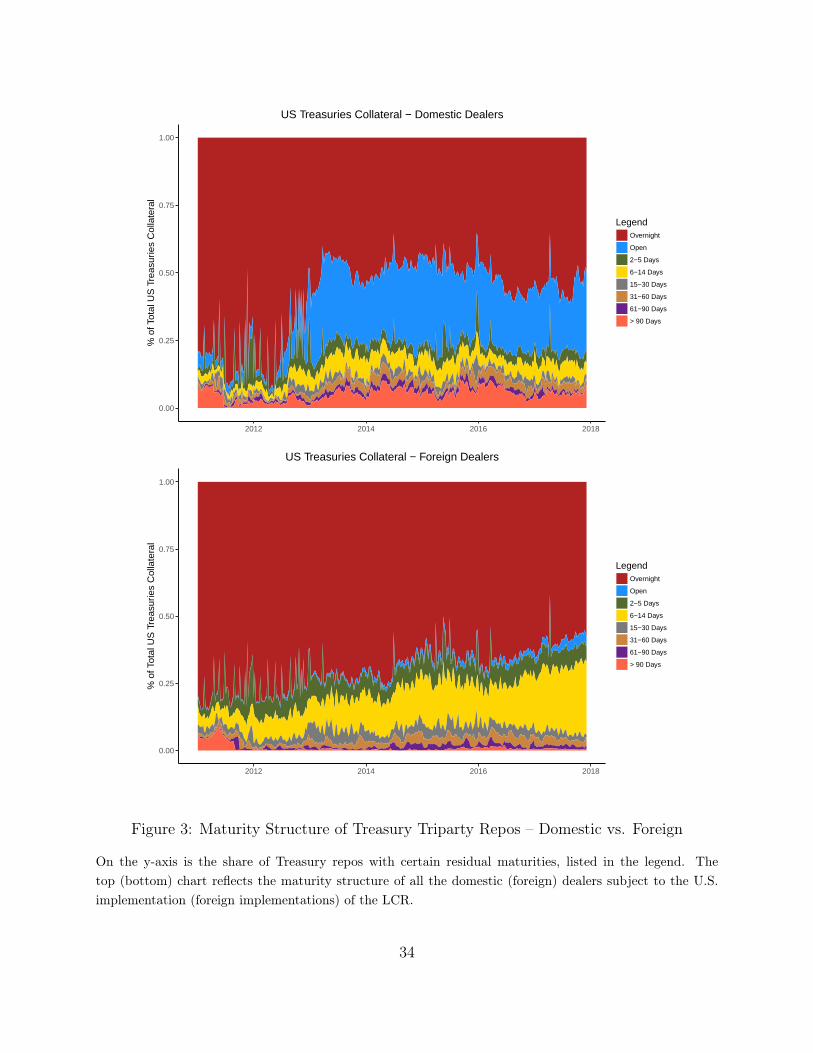
(equity, corporate, and private label CMO). Next, Figures 3 to 6 show the maturity structure
of outstanding triparty repos. Figure 3 displays, for domestic and foreign dealers separately,
the percentage of outstanding Treasury repos by residual maturity buckets (Overnight, Open,
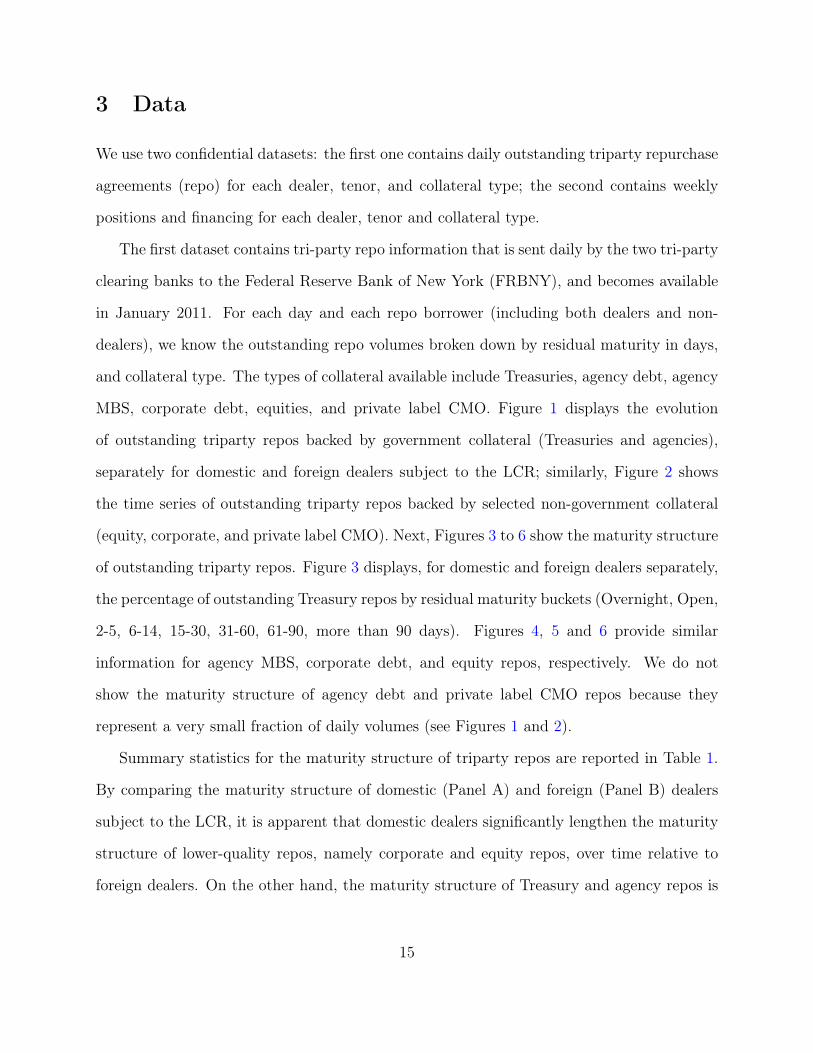
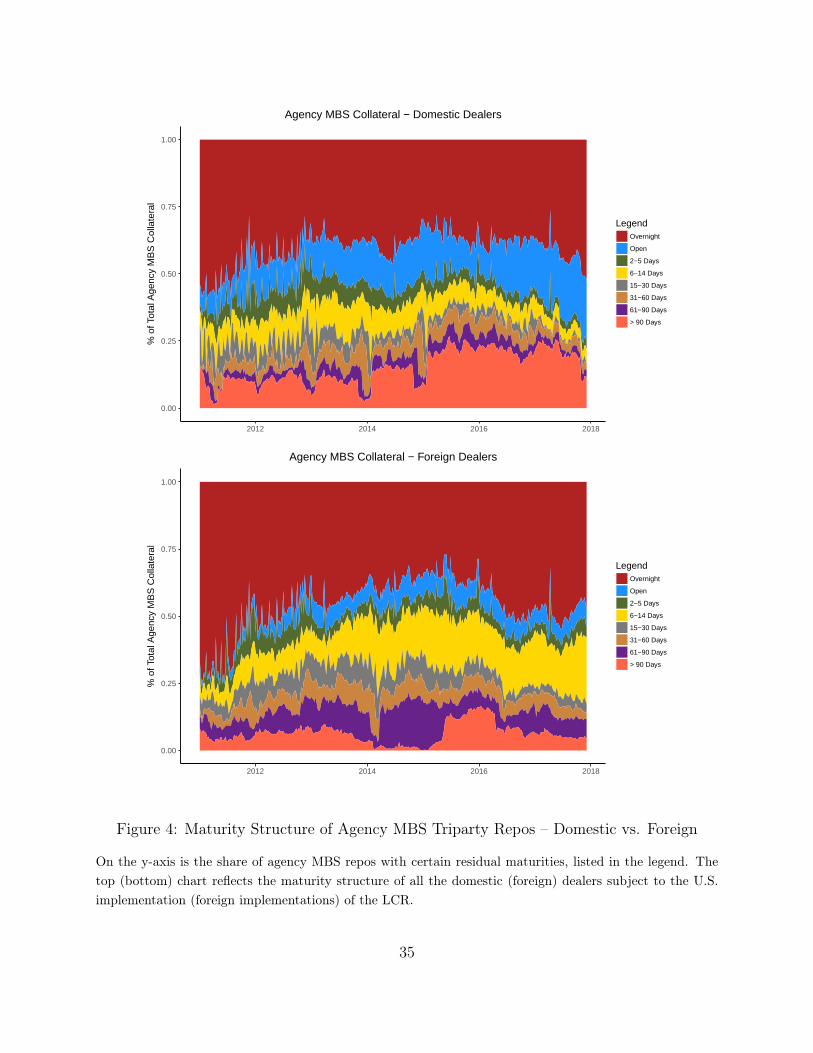
2-5, 6-14, 15-30, 31-60, 61-90, more than 90 days). Figures 4, 5 and 6 provide similar
information for agency MBS, corporate debt, and equity repos, respectively. We do not
show the maturity structure of agency debt and private label CMO repos because they
represent a very small fraction of daily volumes (see Figures 1 and 2).
Summary statistics for the maturity structure of triparty repos are reported in Table 1.
By comparing the maturity structure of domestic (Panel A) and foreign (Panel B) dealers
subject to the LCR, it is apparent that domestic dealers significantly lengthen the maturity
structure of lower-quality repos, namely corporate and equity repos, over time relative to
foreign dealers. On the other hand, the maturity structure of Treasury and agency repos is
15
less affected; one notable exception is the shift for domestic dealers from overnight to open
Treasury repos. From a regulatory standpoint, open repos are effectively overnight as either
party can terminate them at will. For simplicity, we exclude triparty repo borrowers that
are not subject to the LCR from Figures 1 to 6, and from the summary statistics (Table
1). However, they are included in the empirical analysis that relies on triparty repo data,
serving as the omitted group.
Our second dataset is the FR2004 Primary Government Securities Dealers Reports, from
which we use Primary Dealers’ positions and financing data (forms A and C).19 Form A
collects dealers long and short positions in different types of securities including Treasuries,
agency debt, agency MBS, and corporate debt. The latter category consists of dollar de-
nominated debt securities issued by companies incorporated in the U.S. including bonds,
notes, commercial paper, privately placed securities and private label MBS. We refer to the
inventories that a dealer has of a certain asset as the difference between its long and short
positions in that asset class. Next, Form C collects financing transactions, where financing
refers to the actual funds delivered or received and is divided in “Securities In” (funds are
delivered and collateral comes in) and “Securities Out” (funds are received and collateral
goes out). “Securities In” refers to agreements where securities are received, including re-
verse repos (dealer lends cash and receives a security as collateral) and securities borrowed
(reporting the cash that is lent or the fair value of the securities if securities are exchanged
or pledged as collateral). “Securities Out” similarly refers to agreements to deliver securities
to counterparties, including repos (dealer borrows cash and delivers securities as collateral)
and securities lent (reports the cash that is borrowed or the fair value of the securities if
securities are exchanged or pledged as collateral).
The granularity of this dataset evolves significantly over time along three dimensions.
First, financing transactions are collectively reported as Securities Out until April 2013,19See the Federal Reserve website.
16
when they start to be divided into repurchase and securities lending transactions. To keep
the dataset comparable over time, after April 2013 we add repos and sec lending together
into securities out. Similarly, we add reverse repos and sec borrowing together into securi-
ties in. Second, up until April 2013 dealers had to distinguish between overnight and term
financing only, while afterwards they are asked to separately report financing transactions
with overnight, 2-to-30, and more-than-30 day maturities. The last shift in data collection
occurs in January 2015, and has to do with the definition of certain collateral types: private
label MBS are removed from corporate debt collateral and added to a new category called
“Other Debt”; however, at the same time, Other Debt also includes state and municipal debt
securities, which were not reported before. In order to keep the corporate debt collateral
comparable over time, we can either exclude private label MBS or include state and munic-
ipal debt beginning in January 2015. We decide to stop tracking private label MBS from
our definition of corporate debt collateral, starting in January 2015. This gap in private
label MBS coverage is inconsequential due to its negligible post-crisis volumes. Results are
unchanged if we choose the alternative definition of corporate collateral.
Summary statistics are reported in Table 2. The first two panels display repo and reverse
repo books, together with inventories of securities (net positions), broken down by collateral
types and subperiods. The first panel refers to the U.S. dealers subject to the LCR, while
the second panel reflects the activities of foreign dealers subject to the LCR. The very few
Primary Dealers that are not subject to the LCR are excluded. Among the general decline
of dealers’ activities over time, Treasury inventories by U.S. dealers stand out for their
increasing trajectory. Of note, the decline in corporate inventories over time is partly due
to the change in classification of corporate debt securities across different vintages of data
(see above). We can better gauge the generalized decline in corporate inventories from the
bottom two panels of Table 2, which display variables in first difference (weekly changes),
dropping the dates in which the definition of corporate securities changes. As a result, we
17
exclude discrete jumps due to the reclassification of corporate securities.
4 Empirical Strategy and Results
4.1 LCR Effects on the Term Structure of Triparty Repos
In order to identify the effects of the LCR rule on the term structure of triparty repos, we
exploit the fact that the U.S. implementation of the LCR is stricter than any other foreign
implementation, as previously discussed in Section 2 (accelerated phase-in, mismatch add-
on, and daily averages). We therefore have three groups: U.S. LCR refers to the U.S.
dealers subject to the U.S. implementation of LCR; Basel LCR refers to all dealers, foreign
and domestic, that are subject to the LCR; the omitted group refers to non-Bank Holding
Company affiliated dealers that are therefore not subject to the LCR rule. We are then
interested in the additional effect of the more stringent U.S. implementation of the LCR on
the maturity structure of triparty repos.
The time variation is offered by the announcement of the U.S. implementation of the
LCR (Dec 01, 2011), and by the 80% LCR phase-in date (Jan 01, 2015 for the U.S.). In
unreported results, we also look at variation around the adoption of the final U.S. rule (Sep
01, 2014); due to its proximity to the 80% LCR phase-in date of Jan 2015, results using the
Sep 2014 threshold are very similar to the reported ones that use Jan 2015. The sample
ends in July 2016, a month before the G-SIBs affiliated foreign dealers become subject to
the U.S. implementation, in order not to bias our results towards zero. We run the following
panel regressions:
Share(m)i,c,t = α+β0Basel+β1US+β2PostLCR+β3Basel·PostLCR+β4US·PostLCR+εi,c,t
(2)
The dependent variables are the shares of triparty repos outstanding on day t for borrower i
18
at various maturitiesm (open, less than 30 days, more than 30 days, and more than 90 days),
separately for each collateral type c (Treasuries, agency MBS, corporate debt, and equities).
These collateral types represent the vast majority of triparty repo volumes. Basel equals one
for dealers subject to the LCR, and US equals one just for the U.S. dealers subject to the
U.S. LCR; the omitted group consists of any other triparty borrower that is not subject to
the LCR, mostly dealers not affiliated to a Bank Holding Company and large asset managers.
PostLCR is one of two dummy variables: PostLCR1 equals one after the announcement
of the U.S. implementation of the LCR (Dec 01, 2011), and PostLCR2 equals one after
the U.S. LCR is first phased-in (Jan 01, 2015). To capture dynamic adjustments and re-
optimization, in some specifications we use both time variations. We also check for parallel
trends prior to December 2011, by interacting an indicator for October 2011 with the Basel
and US dummies. Since the interaction between the Oct 2011 and the US dummies (called
Parallel in the regressions) is always insignificant, the parallel trend assumption seems to
hold in the data. Errors are two-way clustered at the borrower and day level.
Our results (Table 3) show that Treasury repos are not affected by the LCR, consistent
with the fact that the LCR treats Treasury repos of any maturity as equal to cash. The
only noticeable change is a reshuffling among domestic dealers from 1-to-30 day repos into
open repos (see also Figure 3). Open repos have an embedded put option, so that the cash
lender can terminate them on demand; therefore, the LCR treats them as having an effective
overnight maturity. On the other hand, we find some terming out of agency (MBS) repos
among domestic dealers (Table 4 and Figure 4); specifically, once the final rule is adopted,
U.S. dealers reduce the share of shorter-term agency repos (with maturities of less than 30
days) by 14% and increase the share of more-than-30 day repos by 8%, relative to foreign
dealers. The remainder goes to open repos (6%). The terming out of agency repos beyond
the 30 day threshold is consistent with the incentives laid out by the LCR.
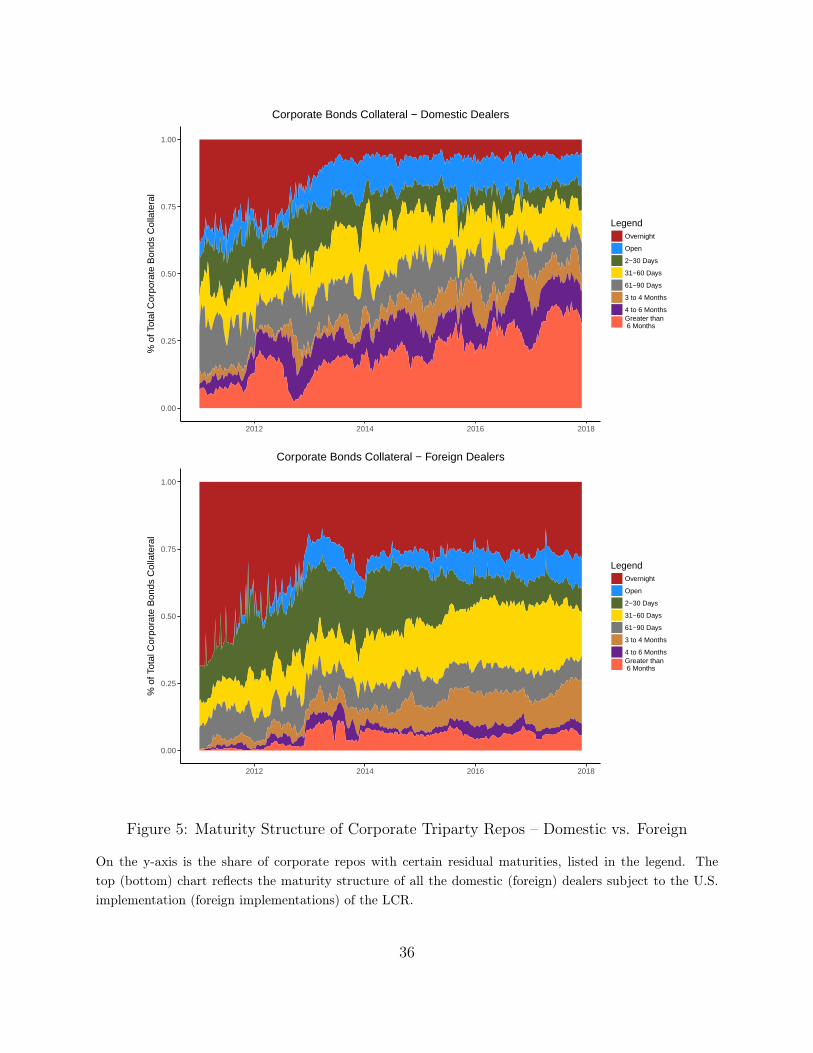
Furthermore, U.S. dealers significantly increase the share of corporate debt repos with
19
more than 30 day maturity by 15%, and the share of more-than-90-day repos by 11% relative
to foreign dealers, in line with the strong incentives to term out lower-quality assets beyond
the 30 day maturity threshold imposed by the LCR rule (Table 5 and Figure 5).20 Foreign
dealers, on the other hand, seem to mostly reshuffle part of their repos from 1-to-30 day
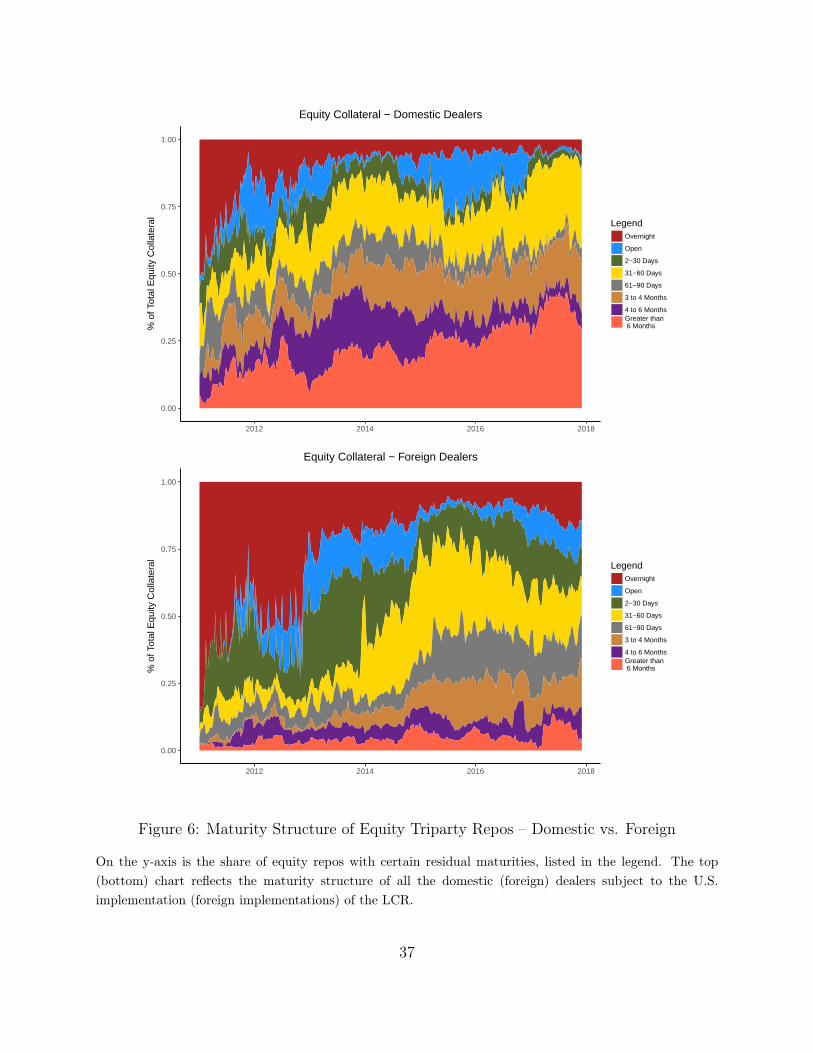
maturity to open. Finally, we analyze changes to the maturity structure of equity repos
(Table 6 and Figure 6). Similar to corporate debt, equities carry either 50% or 100% haircuts,
providing an incentive for dealers to term out equity repos beyond the 30 day threshold. U.S.
dealers initially responded to the announcement of the U.S. implementation by reducing 1-
to-30 day repos by 25% more than foreign dealers, while at the same time increasing the
share of more-than-30 day repos by 20% more than foreign dealers. It seems that U.S. dealers
overshot their LCR internal target early on, because they then proceed to reverse most of
the initial adjustment by dropping the share of more-than-30 day repos by 29% relative to
foreign dealers, while increasing the overnight share by 21% relative to foreign dealers.
4.2 LCR Effects on Financing and Intermediation of Securities
To determine the impact of the LCR on dealers’ financing and intermediation, we run a
set of panel regressions. Each regression estimates what the secured funding backed by a
certain collateral type is used for, namely to finance inventories, reverse repos, and collateral
transformation:20 Corporate debt carries a 15% haircut if Level 2A, 50% if Level 2B, and 100% if non-HQLA.
20
∆SecOuti,c,t = α0∆Invi,c,t + α1US ·∆Invi,c,t + α2PostLCR ·∆Invi,c,t
+ α3US · PostLCR ·∆Invi,c,t + β0∆SecIni,c,t + β1US ·∆SecIni,c,t
+ β2PostLCR ·∆SecIni,c,t + β3US · PostLCR ·∆SecIni,c,t + µi,c + µc,t + εi,c,t
(3)
where ∆SecOuti,c,t is the weekly dollar change in collateral of type c (Treasuries, agency
MBS, or corporate debt) repoed out by dealer i during week t. ∆Invi,c,t is the weekly change
in the dollar value of inventories of type c securities. The collateral type of the inventories
matches the collateral type of the securities going out, since one way to finance inventories
of securities is by repoing them out. ∆SecIni,c,t is a 3-by-1 vector, whose three elements are
the weekly dollar change in Treasuries, agency MBS and corporate debt securities coming
in. We allow for different collateral types coming in and going out to capture the extent to
which dealers engage in collateral upgrades or downgrades for their clients. When dealers
repo out the same security that is coming in, we refer to it as a “matched book” trade instead.
PostLCR is one of two dummy variables: PostLCR1 equals one after the announcement of
the U.S. implementation of the LCR (Dec 01, 2011), and PostLCR2 equals one after the U.S.
LCR is first phased-in (Jan 01, 2015). To capture dynamic adjustments and re-optimization,
in some specifications we use both time variations. Finally, µi,c and µc,t are dealer and time
fixed effects, respectively. Errors are two-way clustered at the dealer and week level.
The coefficients α3 and β3 represent the effect of a more stringent LCR rule on dealers’
activities; recall that U.S. dealers are subject to a more stringent Basel III implementation
than foreign ones (see the discussion in Section 2). The sample contains both domestic and
foreign dealers subject to Basel regulations. Very few domestic and foreign Primary Dealers
are not part of a Bank Holding Company, and as such not regulated by Basel III; we therefore
21
exclude them from the following analysis. We start the sample in August 2009, after the
crisis-era liquidity facilities targeted to Primary Dealers were unwound, and we end it in
July 2016. After that, many large foreign banks needed to form an Intermediate Holding
Company for their U.S. operations to be subject to the U.S. implementation of the LCR.
4.2.1 Financing Inventories
Table 7 displays some adjustments to the introduction of the LCR rule. U.S. dealers sig-
nificantly cut their reliance on the repo market to finance Treasuries after the U.S. LCR is
phased in at the 80% level. Relative to foreign dealers, U.S. dealers finance 28% less Treasury
inventories on the repo market.21 This move is consistent with a tendency of U.S. dealers
to finance high-quality assets with internal cash, so that such Treasuries remain unencum-
bered and count towards HQLA; had those Treasuries been financed in the repo market,
they would become encumbered and not qualify as HQLA. A similar adjustment occurs in
the financing of agency MBS right after the U.S. LCR is announced. This adjustment is
however only significant at the 10% level, suggesting that some heterogeneity in the way
U.S. dealers adjusted their financing of agency MBS inventories. In addition to the U.S.
dealers increasing the share of Treasury inventories that are considered unencumbered, they
also increase the average size of their Treasury inventories, as shown in Table 2. Both facts
indicate that U.S. dealers are building up liquidity pools.
4.2.2 Intermediation and Collateral Upgrades
In the pre-LCR world, U.S. dealers took advantage of the spread between agency MBS and
Treasury repos by reversing in agency MBS while repoing out Treasuries (not displayed in
Table 7); similar trades can also be used by dealers to provide collateral upgrades to their21Pre-LCR, both foreign and domestic dealers would finance between 30% and 40% of Treasury inventories
with overnight repos. As a reference point, 50% to 60% of Treasuries were financed in the repo market priorto the 2007-09 crisis – see Table 11.
22
clients. However, this collateral upgrade service becomes expensive from an LCR perspective,
because it involves delivering Level 1 assets (carrying 0% haircuts) in exchange for Level 2A
assets (carrying 15% haircuts); U.S. dealers therefore significantly scale down these trades
(Table 7, columns 1 and 2, row 5), while foreign dealers fill in this gap and increase the
amount of Agency MBS reverse repos associated with Treasury repos (not displayed in
Table 7).22 Table 8 (row 3, column 1) further shows that such cutback in collateral upgrades
occurred in the overnight tenor.
There are two additional adjustments occurring around the time of the U.S. LCR an-
nouncement. First, U.S. dealers slightly reduce the amount of Treasuries reversed in overnight
that are funded by repoing out agency MBS overnight, relative to foreign dealers (Table 8 –
row 1, column 3). This paring back by U.S. dealers has a small negative impact on LCR, but
is more than compensated by the previously-mentioned reduction in agency MBS swapped
for Treasuries. On the other hand, reducing such collateral swaps (receiving Treasuries and
delivering agency MBS) likely improves dealers’ net interest margins.
Another change in intermediation that is linked to LCR incentives is the increase by U.S.
dealers in the amount of term corporate reverse repos financed with term corporate repos
(Table 8 – column 6, row 6); this realignment of tenors towards a “matched book” model
reduces the liquidity risk associated with intermediation.
4.3 Endogenous De-risking
Prior to the crisis, a significant amount of corporate debt inventories, including private label
MBS, were financed in the repo market (Macchiavelli (2019)); the crisis exposed the weakness
of such strategy: when those repos did not roll, dealers may have had to sell those securities,
which they were not able to finance anymore, at fire-sale prices. The deleveraging induced22For the sake of presenting the main LCR effects in a self-contained way, Table 7 only displays the
interaction effects (post-LCR for U.S. dealers). However, the full set of coefficients is available in Table 9.
23
by the crisis, and the reassessment of several risks, led dealers to finance less corporate debt
inventories (private label MBS almost disappeared) and to rely less and less on the repo
market to finance them. This de-risking happened right after the crisis, and before the LCR
had been announced, as shown in the last two columns of Table 10: the baseline coefficients
pertain to the precrisis period (Jan 2004 to Jul 2007), the postcrisis coefficients capture
the additional postcrisis effect, and the post-LCR coefficients estimate the incremental LCR
effect on top of the postcrisis one. We focus on the last two columns that pertain to the repo
financing of corporate debt collateral. Precrisis, foreign dealers repoed out just 10% of their
corporate inventories, while U.S. dealers repoed out about 42% of them (or 32% more): U.S.
dealers took significantly more risk, which ultimately exposed them to larger fire-sale losses.
We purposefully drop the crisis period between August 2007, when BNP Paribas halts
redemptions from three affiliated funds, to July 2009, when the Federal Reserve unwinds both
of its liquidity programs to sustain Primary Dealers. Indeed, this period was very chaotic,
with a major deleveraging among dealers culminating with Lehman’s bankruptcy, followed
by a sizable liquidity intervention aimed at supporting dealers (Acharya et al. (2017)).
After these liquidity facilities unwound, U.S. dealers are more conservative than they
used to be prior to the crisis: in the postcrisis but pre-LCR period, U.S. dealers repo out
just about 10% of their corporate inventories, compared to about 40% precrisis. The last
two rows then show the additional LCR effects. Foreign dealers (captured in the baseline
effect) increase their reliance on the repo market to fund corporate inventories, while U.S.
dealers keep their behavior constant to the postcrisis period (undoing the increased reliance
by foreign dealers).
4.4 Maturity Mismatch: Cash and Collateral Rollover Risk
Tables 11 to 14 use the more granular post-2013 FR2004 data that breaks down securities
in and out by overnight, 2-to-30-day, and more-than-30-day tenors; this allows us to more
24
accurately trace the maturity mismatch in the dealers’ core function of intermediating secu-
rities and credit. These tables display the degree of maturity mismatch within each collateral
type; in particular, rows five to seven can be interpreted as an “input-output” matrix: the
diagonal elements (in bold font) estimate how much of the securities reversed in at a certain
tenor are repoed out at the same tenor. For instance, Table 11 shows that 79% of overnight
Treasury reverse repos are associated with overnight Treasury repos, 41% of Treasuries com-
ing in at 2-to-30 day maturity are repoed out at 2-to-30 day maturity, and finally 43% of
Treasuries reversed in at tenors greater than 30 days are repoed out at more-than-30-day
tenors. Therefore, large diagonal elements suggest a high degree of maturity matching in
the intermediation of securities (similar to the idea of a matched book). On the other hand,
off-diagonal elements suggest some degree of maturity mismatch. Rows eight to ten display
the additional pass-throughs for U.S. dealers.
4.4.1 Cash Rollover Risk
The lower-triangular elements (in the rows-five-to-seven block) involve financing longer-term
reverse repos with shorter term repos. Table 11 suggests that dealers take significant risk–
cash rollover risk–in intermediating Treasuries. Indeed, 45% of both Treasuries reversed in
at more than 30 days and between two and 30 days are repoed out (financed) overnight; in
these instances, dealers provide a cash loan for several days in exchange for collateral and
come up with the needed cash by repoing out the same collateral overnight, then rolling over
the overnight repo until the reverse repo matures. This service provided by dealers to clients
operates very smoothly in normal times, but could lead to significant rollover risks during
times of stress.
Table 12 replicates the same exercise for agency MBS collateral; dealers take as much
cash rollover risk in the agency MBS space as in the Treasury space. Noteworthy, about 60%
of reverse repos maturing in more than 30 days are funded via overnight (or open) repos.
25
Once again, while feasible in normal times, this strategy may expose dealers to significant
risk in the event of a sudden credit crunch.
Finally, Tables 13 and 14 reproduce the analysis for lower-quality collateral, namely
corporate debt and equities. Here the picture is a bit more complex. Among foreign dealers–
captured in the baseline coefficients–there is some degree of cash rollover risk in the corporate
debt space (47% of more-than-30-day reverse repos funded with overnight repos), and very
little cash rollover risk in the equity space. On the other hand, U.S. dealers take significantly
more cash rollover risk in the equity space. Of note, not penalized by the LCR but still
subject to cash rollove risk, U.S. dealers fund almost 100% of the 2-to-30-day reverse repos
with overnight repos in the equity space–Table 14, row 7, column 1.
4.4.2 Collateral Rollover Risk
A different type of risk arises by reversing in collateral at short tenors while repoing it out
at longer terms; in these trades, captured in the upper-triangular elements of rows 5 to 7
in Tables 11 to 14, collateral is locked in a term repo and needs to be sourced at higher
frequency by rolling over the associated reverse repo or sec borrowing trade (used to reverse
in the collateral). If the shorter-term reverse repo (or sec borrowing) does not roll during
the life of the longer-term repo, the dealer has to deliver the collateral back to the reverse
repo party while that collateral is still locked in the repo counterparty account; therefore,
the dealer has to borrow (or buy) the same collateral from a third party to deliver to the
reverse repo party for the remaining life of the repo, or else the dealer will fail to deliver the
collateral and pay the fails charge until the collateral is delivered.
The collateral rollover risk associated with a potential run by reverse repo counterparties
could materialize in a stress scenario where clients of a troubled dealer demand their collateral
back to potentially move their business to another dealer. There are some anecdotes of this
26
happening to Lehman Brothers prior to its bankruptcy.23
Tables 11 and 12 show a statistically significant albeit moderate collateral rollover risk in
both Treasury and agency MBS space: for instance, 16% of the agencies reversed in overnight
are funded by repos at 2-to-30-day tenors, while 8% of them are funded by repos at more-
than-30-day tenors. It is likely that these trades involve bilateral repos (or sec lending) where
the dealer’s client is interested in borrowing a certain security for a few weeks, and the dealer
sources (reverses in) that specific security overnight or via an open trade. Importantly, this
8% of overnight agency reverse repos funded by more-than-30-day repos is not penalized by
the LCR rule; on the contrary, it improves the LCR. Indeed, on the repo side, 100% of the
cash is locked in for more than 30 days while, on the reverse side, it is assumed that only
85% of the cash is locked out, leading to a net inflow over the 30-day horizon.
On the other hand, there is little or no collateral rollover risk in lower-quality-collateral
space (corporate debt and equities), as shown in Tables 13 and 14. There also no significant
difference between U.S. and foreign dealers in terms of collateral rollover risk. Since this
more granular data is not available prior to April 2013, we cannot establish whether these
types of cash and collateral rollover risks have been affected by the LCR rule. Instead we
provide a snapshot once LCR adjustments were already underway.
It is worth emphasizing once again that excessive collateral rollover risk, namely funding
overnight reverse repos with more-than-30-day repos, improves the LCR by reducing net
outflows. However, it exposes the dealer to the risk that the client pull its collateral away
from the dealer by not rolling over the overnight reverse repo. In this case, the dealer has
to find a way to source collateral, which can be difficult in a stress event where clients are
running from a specific dealer–as happened to Lehman Brothers.23See a July 2008 Reuters article. See also Infante and Vardoulakis (2018) for a theory of collateral runs.
27
5 Conclusion
This paper identifies and quantifies changes in the behavior of large broker-dealers as a
result of postcrisis liquidity regulation. We use the fact that the U.S. implementation of the
LCR is more stringent than that of foreign jurisdictions, to show the differential response
of U.S. dealers relative to foreign ones to the introduction of the LCR rule. We deliver
several new results. First, U.S. dealers – more strongly affected by the rule than foreign
ones – significantly increase the maturity of their lower-quality-collateral repos relative to
foreign dealers. On the other hand, no maturity structure effect is estimated for repos
backed by the highest-quality collateral, in line with the fact that the LCR treats these
repos as cash (0% haircuts). Second, the LCR induces dealers to reduce their reliance on
repos to finance inventories of high-quality liquid assets, specifically Treasuries; as a result,
additional Treasuries are considered unencumbered and count towards HQLA, improving the
LCR. Third, the LCR leads dealers to cut back on some trades that effectively downgrade
their own available collateral, and are thus penalized by the LCR rule.
Are these changes de-risking dealers’ operations? The reduced reliance on repos to finance
Treasuries improves dealers’ liquidity pools, which can be helpful to deal with a potential
liquidity crunch. On the other hand, relying on repos to finance illiquid inventories proved
extremely problematic during the crisis. To this end, we show that U.S. dealers greatly
reduce their reliance on repos to fund less-liquid assets right after the crisis, before the LCR
is even announced, suggesting some degree of endogenous de-risking. Next, the reduction in
collateral upgrades for clients may amount to a drop in the liquidity services provided by
dealers.
There are also some liquidity risks that are not fully addressed by the LCR rule, but
are nonetheless present in the data. Maturity transformation within 30 days, while not
always penalized by the LCR, can still expose dealers to rollover risk; this risk is present
28
to various degrees across collateral types. For instance, in the equity space U.S. dealers
finance almost all of their 2-to-30-day reverse repos overnight. There is also some non-trivial
degree of negative maturity transformation in the Treasury and agency space, which actually
improves the LCR. However, it may expose dealers to the risk of not being able to roll over
the collateral pledged in a longer term repo if the shorter-term reverse repo does not roll,
effectively pulling the collateral away from the dealer while it is still pledged to another
party.
29
References
Acharya, Viral V, Allen N Berger, and Raluca A Roman, “Lending implications of
US bank stress tests: Costs or benefits?,” Journal of Financial Intermediation, 2018, 34,
58–90.
, Michael J Fleming, Warren B Hrung, and Asani Sarkar, “Dealer financial condi-
tions and lender-of-last-resort facilities,” Journal of Financial Economics, 2017, 123 (1),
81–107.
Adrian, Tobias, Nina Boyarchenko, and Or Shachar, “Dealer balance sheets and bond
liquidity provision,” Journal of Monetary Economics, 2017, 89, 92–109.
Anbil, Sriya and Zeynep Senyuz, “Window-dressing and trading relationships in the
tri-party repo market,” working paper, 2016.
Anderson, Mike and René M Stulz, “Is post-crisis bond liquidity lower?,” working paper,
2017.
Bao, Jack, Maureen O’Hara, and Xing Alex Zhou, “The Volcker Rule and corporate
bond market making in times of stress,” Journal of Financial Economics, 2018.
Bassett, William and Jose Berrospide, “The impact of stress tests on bank lending,”
Working Paper, Board of Governors of the Federal Reserve System, 2017.
Bessembinder, Hendrik, Stacey Jacobsen, William Maxwell, and Kumar
Venkataraman, “Capital commitment and illiquidity in corporate bonds,” The Journal
of Finance, 2018.
Cortés, Kristle, Yuliya Demyanyk, Lei Li, Elena Loutskina, and Philip E Strahan,
“Stress tests and small business lending,” NBER working paper, 2018.
30
Diamond, Douglas, “The Current Financial Crisis, Other Recent Crises, and the Role of
Short-term Debt,” Unicredit Conference on Banking and Finance, Vienna, 2008.
, “Nobel Symposium: Liquidity Creation by Financial Intermediaries,” Swedish House of
Finance, 2018.
Dick-Nielsen, Jens, Peter Feldhütter, and David Lando, “Corporate bond liquidity
before and after the onset of the subprime crisis,” Journal of Financial Economics, 2012,
103 (3), 471–492.
Duffie, Darrell and Arvind Krishnamurthy, “Passthrough efficiency in the Fed’s new
monetary policy setting,” in “Designing Resilient Monetary Policy Frameworks for the
Future. Federal Reserve Bank of Kansas City, Jackson Hole Symposium” 2016, pp. 1815–
1847.
Goldstein, Michael A and Edith S Hotchkiss, “Providing liquidity in an illiquid market:
Dealer behavior in US corporate bonds,” working paper, 2017.
Infante, Sebastian and Alexandros Vardoulakis, “Collateral runs,” 2018.
Keating, Thomas and Marco Macchiavelli, “Interest on Reserves and Arbitrage in
Post-Crisis Money Markets,” working paper, 2017.
Macchiavelli, Marco, “Primary Dealers during the 2007-08 crisis: assessing risks and
vulnerabilities,” working paper, 2019.
Munyan, Benjamin, “Regulatory arbitrage in repo markets,” working paper, 2017.
Schultz, Paul, “Inventory management by corporate bond dealers,” working paper, 2017.
Trebbi, Francesco and Kairong Xiao, “Regulation and market liquidity,” Management
Science, 2017.
31
0
200
400
600
2012 2014 2016 2018
Bill
ions
of D
olla
rs
LegendAgency Debenture
Agency MBS
US Treasuries
Collateral Volumes − Domestic Dealers
0
250
500
750
2012 2014 2016 2018
Bill
ions
of D
olla
rs
LegendAgency Debenture
Agency MBS
US Treasuries
Collateral Volumes − Foreign Dealers
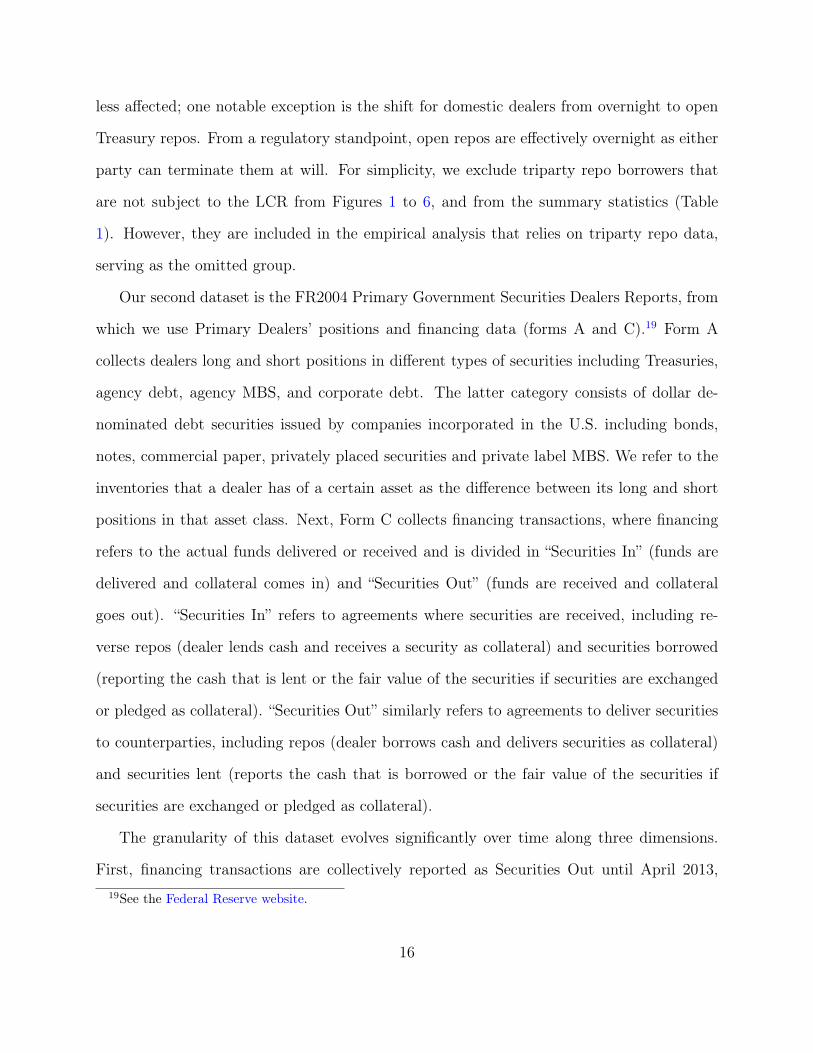
Figure 1: Triparty Repos Backed by Government Collateral – Domestic vs. Foreign
On the y-axis is the volume of government triparty repos (Treasury, ageny MBS, and agency debt collat-eral) outstanding for domestic dealers (top chart) and foreign dealers (bottom chart) subject to the LCRregulation.
32
0
50
100
150
2012 2014 2016 2018
Bill
ions
of D
olla
rs
LegendPrivate Label CMO
Corporate Bonds
Equity
Collateral Volumes − Domestic Dealers
0
25
50
75
100
125
2012 2014 2016 2018
Bill
ions
of D
olla
rs
LegendPrivate Label CMO
Corporate Bonds
Equity
Collateral Volumes − Foreign Dealers
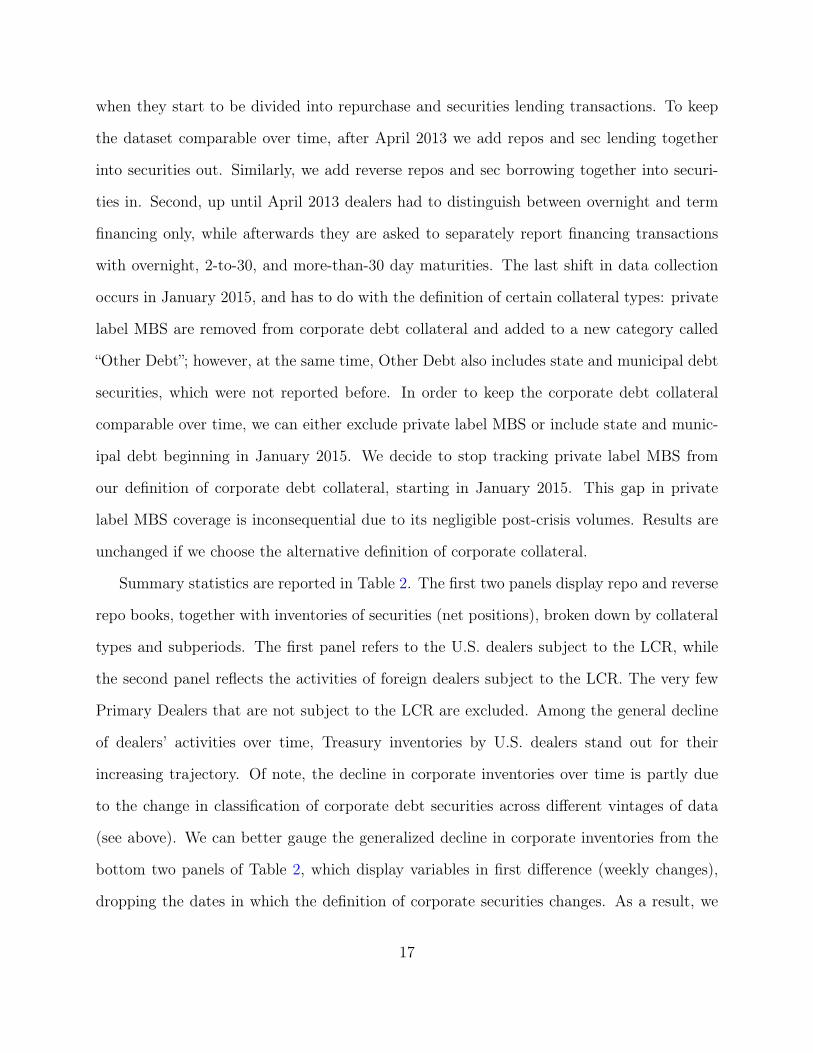
Figure 2: Triparty Repos Backed by Non-Government Collateral – Domestic vs. Foreign
On the y-axis is the volume of selected non-government triparty repos (equity, corporate, and private labelCMO collateral) outstanding for domestic dealers (top chart) and foreign dealers (bottom chart) subject tothe LCR regulation.
33
0.00
0.25
0.50
0.75
1.00
2012 2014 2016 2018
% o
f Tot
al U
S T
reas
urie
s C
olla
tera
l
LegendOvernight
Open
2−5 Days
6−14 Days
15−30 Days
31−60 Days
61−90 Days
> 90 Days
US Treasuries Collateral − Domestic Dealers
0.00
0.25
0.50
0.75
1.00
2012 2014 2016 2018
% o
f Tot
al U
S T
reas
urie
s C
olla
tera
l
LegendOvernight
Open
2−5 Days
6−14 Days
15−30 Days
31−60 Days
61−90 Days
> 90 Days
US Treasuries Collateral − Foreign Dealers
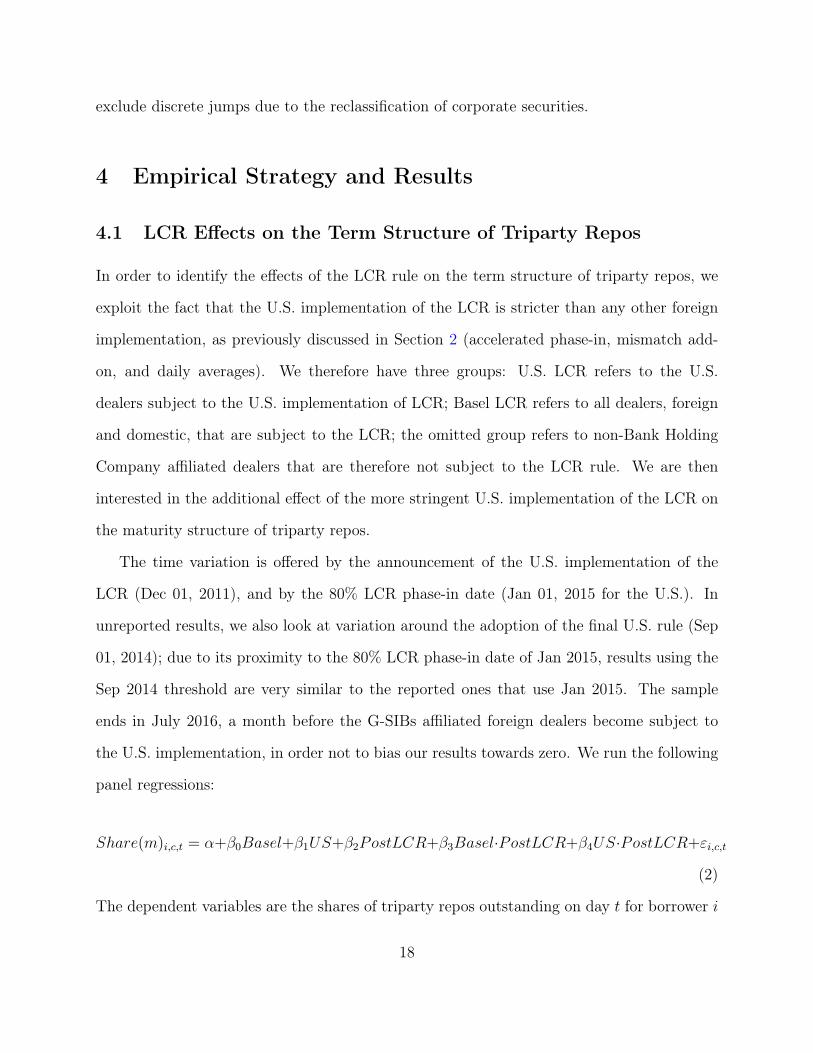
Figure 3: Maturity Structure of Treasury Triparty Repos – Domestic vs. Foreign
On the y-axis is the share of Treasury repos with certain residual maturities, listed in the legend. Thetop (bottom) chart reflects the maturity structure of all the domestic (foreign) dealers subject to the U.S.implementation (foreign implementations) of the LCR.
34
0.00
0.25
0.50
0.75
1.00
2012 2014 2016 2018
% o
f Tot
al A
genc
y M
BS
Col
late
ral
LegendOvernight
Open
2−5 Days
6−14 Days
15−30 Days
31−60 Days
61−90 Days
> 90 Days
Agency MBS Collateral − Domestic Dealers
0.00
0.25
0.50
0.75
1.00
2012 2014 2016 2018
% o
f Tot
al A
genc
y M
BS
Col
late
ral
LegendOvernight
Open
2−5 Days
6−14 Days
15−30 Days
31−60 Days
61−90 Days
> 90 Days
Agency MBS Collateral − Foreign Dealers
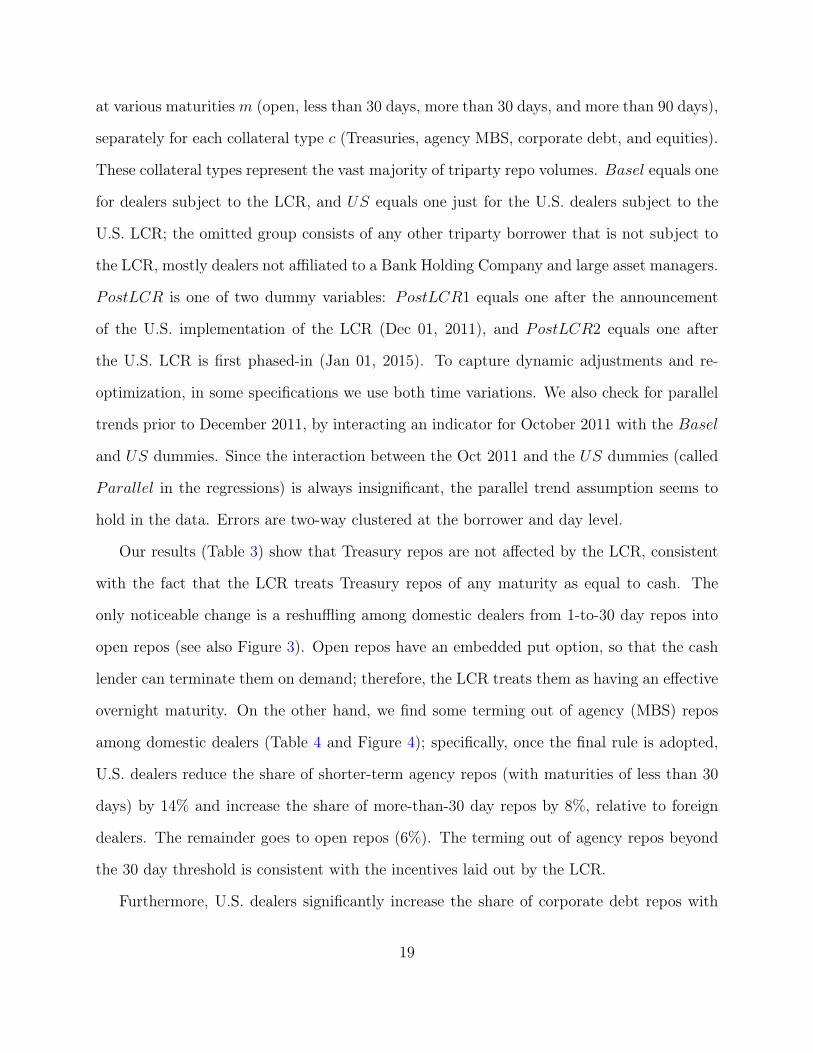
Figure 4: Maturity Structure of Agency MBS Triparty Repos – Domestic vs. Foreign
On the y-axis is the share of agency MBS repos with certain residual maturities, listed in the legend. Thetop (bottom) chart reflects the maturity structure of all the domestic (foreign) dealers subject to the U.S.implementation (foreign implementations) of the LCR.
35
0.00
0.25
0.50
0.75
1.00
2012 2014 2016 2018
% o
f Tot
al C
orpo
rate
Bon
ds C
olla
tera
l
LegendOvernight
Open
2−30 Days
31−60 Days
61−90 Days
3 to 4 Months
4 to 6 MonthsGreater than 6 Months
Corporate Bonds Collateral − Domestic Dealers
0.00
0.25
0.50
0.75
1.00
2012 2014 2016 2018
% o
f Tot
al C
orpo
rate
Bon
ds C
olla
tera
l
LegendOvernight
Open
2−30 Days
31−60 Days
61−90 Days
3 to 4 Months
4 to 6 MonthsGreater than 6 Months
Corporate Bonds Collateral − Foreign Dealers
Figure 5: Maturity Structure of Corporate Triparty Repos – Domestic vs. Foreign
On the y-axis is the share of corporate repos with certain residual maturities, listed in the legend. Thetop (bottom) chart reflects the maturity structure of all the domestic (foreign) dealers subject to the U.S.implementation (foreign implementations) of the LCR.
36
0.00
0.25
0.50
0.75
1.00
2012 2014 2016 2018
% o
f Tot
al E
quity
Col
late
ral
LegendOvernight
Open
2−30 Days
31−60 Days
61−90 Days
3 to 4 Months
4 to 6 MonthsGreater than 6 Months
Equity Collateral − Domestic Dealers
0.00
0.25
0.50
0.75
1.00
2012 2014 2016 2018
% o
f Tot
al E
quity
Col
late
ral
LegendOvernight
Open
2−30 Days
31−60 Days
61−90 Days
3 to 4 Months
4 to 6 MonthsGreater than 6 Months
Equity Collateral − Foreign Dealers
Figure 6: Maturity Structure of Equity Triparty Repos – Domestic vs. Foreign
On the y-axis is the share of equity repos with certain residual maturities, listed in the legend. The top(bottom) chart reflects the maturity structure of all the domestic (foreign) dealers subject to the U.S.implementation (foreign implementations) of the LCR.
37
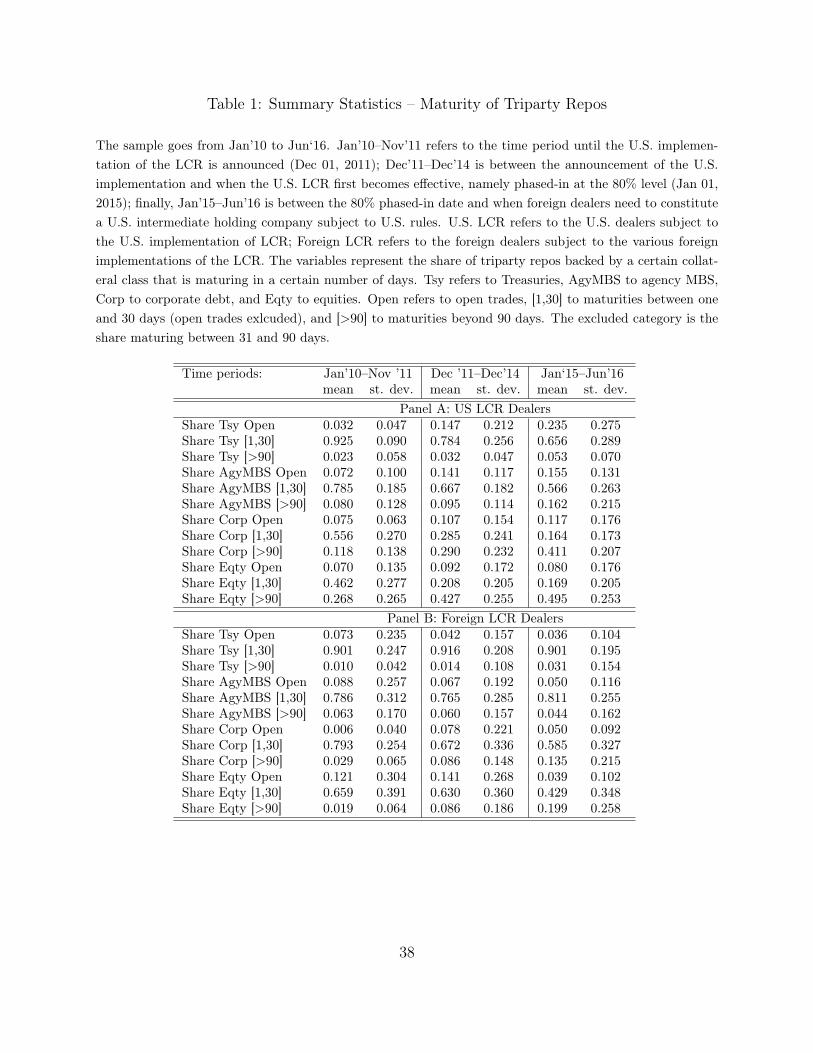
Table 1: Summary Statistics – Maturity of Triparty Repos
The sample goes from Jan’10 to Jun‘16. Jan’10–Nov’11 refers to the time period until the U.S. implemen-tation of the LCR is announced (Dec 01, 2011); Dec’11–Dec’14 is between the announcement of the U.S.implementation and when the U.S. LCR first becomes effective, namely phased-in at the 80% level (Jan 01,2015); finally, Jan’15–Jun’16 is between the 80% phased-in date and when foreign dealers need to constitutea U.S. intermediate holding company subject to U.S. rules. U.S. LCR refers to the U.S. dealers subject tothe U.S. implementation of LCR; Foreign LCR refers to the foreign dealers subject to the various foreignimplementations of the LCR. The variables represent the share of triparty repos backed by a certain collat-eral class that is maturing in a certain number of days. Tsy refers to Treasuries, AgyMBS to agency MBS,Corp to corporate debt, and Eqty to equities. Open refers to open trades, [1,30] to maturities between oneand 30 days (open trades exlcuded), and [>90] to maturities beyond 90 days. The excluded category is theshare maturing between 31 and 90 days.
Time periods: Jan’10–Nov ’11 Dec ’11–Dec’14 Jan‘15–Jun’16mean st. dev. mean st. dev. mean st. dev.
Panel A: US LCR DealersShare Tsy Open 0.032 0.047 0.147 0.212 0.235 0.275Share Tsy [1,30] 0.925 0.090 0.784 0.256 0.656 0.289Share Tsy [>90] 0.023 0.058 0.032 0.047 0.053 0.070Share AgyMBS Open 0.072 0.100 0.141 0.117 0.155 0.131Share AgyMBS [1,30] 0.785 0.185 0.667 0.182 0.566 0.263Share AgyMBS [>90] 0.080 0.128 0.095 0.114 0.162 0.215Share Corp Open 0.075 0.063 0.107 0.154 0.117 0.176Share Corp [1,30] 0.556 0.270 0.285 0.241 0.164 0.173Share Corp [>90] 0.118 0.138 0.290 0.232 0.411 0.207Share Eqty Open 0.070 0.135 0.092 0.172 0.080 0.176Share Eqty [1,30] 0.462 0.277 0.208 0.205 0.169 0.205Share Eqty [>90] 0.268 0.265 0.427 0.255 0.495 0.253
Panel B: Foreign LCR DealersShare Tsy Open 0.073 0.235 0.042 0.157 0.036 0.104Share Tsy [1,30] 0.901 0.247 0.916 0.208 0.901 0.195Share Tsy [>90] 0.010 0.042 0.014 0.108 0.031 0.154Share AgyMBS Open 0.088 0.257 0.067 0.192 0.050 0.116Share AgyMBS [1,30] 0.786 0.312 0.765 0.285 0.811 0.255Share AgyMBS [>90] 0.063 0.170 0.060 0.157 0.044 0.162Share Corp Open 0.006 0.040 0.078 0.221 0.050 0.092Share Corp [1,30] 0.793 0.254 0.672 0.336 0.585 0.327Share Corp [>90] 0.029 0.065 0.086 0.148 0.135 0.215Share Eqty Open 0.121 0.304 0.141 0.268 0.039 0.102Share Eqty [1,30] 0.659 0.391 0.630 0.360 0.429 0.348Share Eqty [>90] 0.019 0.064 0.086 0.186 0.199 0.258
38
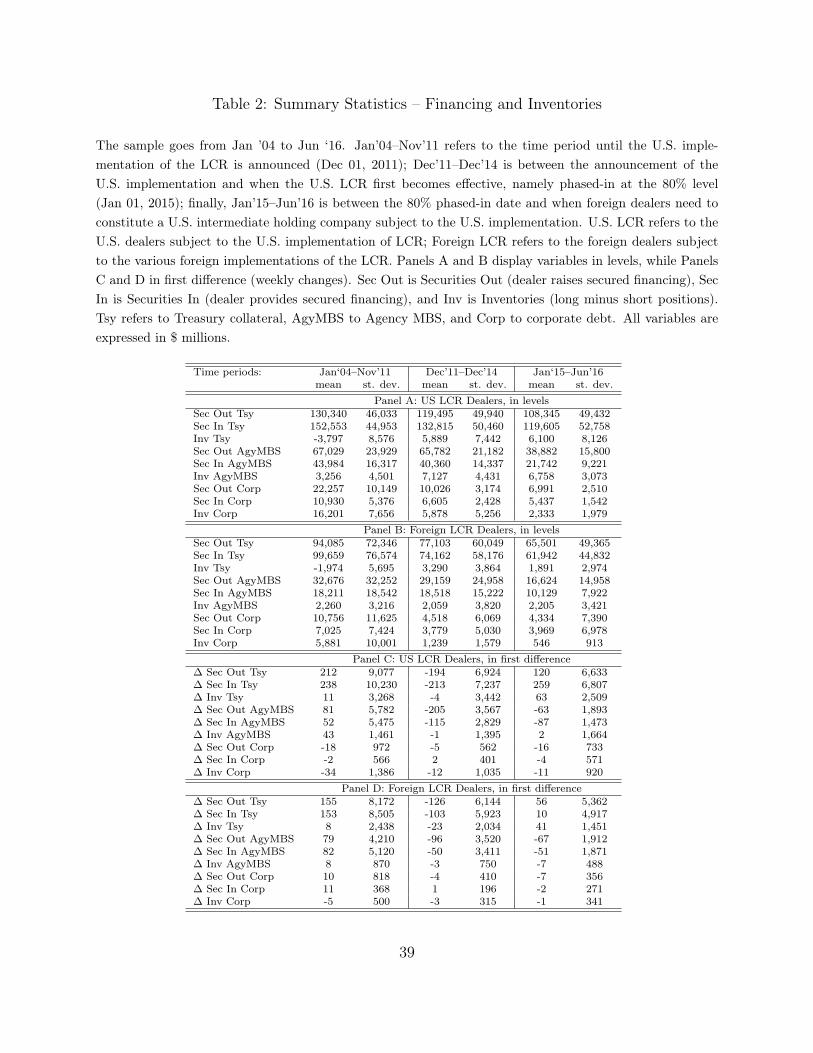
Table 2: Summary Statistics – Financing and Inventories
The sample goes from Jan ’04 to Jun ‘16. Jan’04–Nov’11 refers to the time period until the U.S. imple-mentation of the LCR is announced (Dec 01, 2011); Dec’11–Dec’14 is between the announcement of theU.S. implementation and when the U.S. LCR first becomes effective, namely phased-in at the 80% level(Jan 01, 2015); finally, Jan’15–Jun’16 is between the 80% phased-in date and when foreign dealers need toconstitute a U.S. intermediate holding company subject to the U.S. implementation. U.S. LCR refers to theU.S. dealers subject to the U.S. implementation of LCR; Foreign LCR refers to the foreign dealers subjectto the various foreign implementations of the LCR. Panels A and B display variables in levels, while PanelsC and D in first difference (weekly changes). Sec Out is Securities Out (dealer raises secured financing), SecIn is Securities In (dealer provides secured financing), and Inv is Inventories (long minus short positions).Tsy refers to Treasury collateral, AgyMBS to Agency MBS, and Corp to corporate debt. All variables areexpressed in $ millions.
Time periods: Jan‘04–Nov’11 Dec’11–Dec’14 Jan‘15–Jun’16mean st. dev. mean st. dev. mean st. dev.
Panel A: US LCR Dealers, in levelsSec Out Tsy 130,340 46,033 119,495 49,940 108,345 49,432Sec In Tsy 152,553 44,953 132,815 50,460 119,605 52,758Inv Tsy -3,797 8,576 5,889 7,442 6,100 8,126Sec Out AgyMBS 67,029 23,929 65,782 21,182 38,882 15,800Sec In AgyMBS 43,984 16,317 40,360 14,337 21,742 9,221Inv AgyMBS 3,256 4,501 7,127 4,431 6,758 3,073Sec Out Corp 22,257 10,149 10,026 3,174 6,991 2,510Sec In Corp 10,930 5,376 6,605 2,428 5,437 1,542Inv Corp 16,201 7,656 5,878 5,256 2,333 1,979
Panel B: Foreign LCR Dealers, in levelsSec Out Tsy 94,085 72,346 77,103 60,049 65,501 49,365Sec In Tsy 99,659 76,574 74,162 58,176 61,942 44,832Inv Tsy -1,974 5,695 3,290 3,864 1,891 2,974Sec Out AgyMBS 32,676 32,252 29,159 24,958 16,624 14,958Sec In AgyMBS 18,211 18,542 18,518 15,222 10,129 7,922Inv AgyMBS 2,260 3,216 2,059 3,820 2,205 3,421Sec Out Corp 10,756 11,625 4,518 6,069 4,334 7,390Sec In Corp 7,025 7,424 3,779 5,030 3,969 6,978Inv Corp 5,881 10,001 1,239 1,579 546 913
Panel C: US LCR Dealers, in first difference∆ Sec Out Tsy 212 9,077 -194 6,924 120 6,633∆ Sec In Tsy 238 10,230 -213 7,237 259 6,807∆ Inv Tsy 11 3,268 -4 3,442 63 2,509∆ Sec Out AgyMBS 81 5,782 -205 3,567 -63 1,893∆ Sec In AgyMBS 52 5,475 -115 2,829 -87 1,473∆ Inv AgyMBS 43 1,461 -1 1,395 2 1,664∆ Sec Out Corp -18 972 -5 562 -16 733∆ Sec In Corp -2 566 2 401 -4 571∆ Inv Corp -34 1,386 -12 1,035 -11 920
Panel D: Foreign LCR Dealers, in first difference∆ Sec Out Tsy 155 8,172 -126 6,144 56 5,362∆ Sec In Tsy 153 8,505 -103 5,923 10 4,917∆ Inv Tsy 8 2,438 -23 2,034 41 1,451∆ Sec Out AgyMBS 79 4,210 -96 3,520 -67 1,912∆ Sec In AgyMBS 82 5,120 -50 3,411 -51 1,871∆ Inv AgyMBS 8 870 -3 750 -7 488∆ Sec Out Corp 10 818 -4 410 -7 356∆ Sec In Corp 11 368 1 196 -2 271∆ Inv Corp -5 500 -3 315 -1 341
39
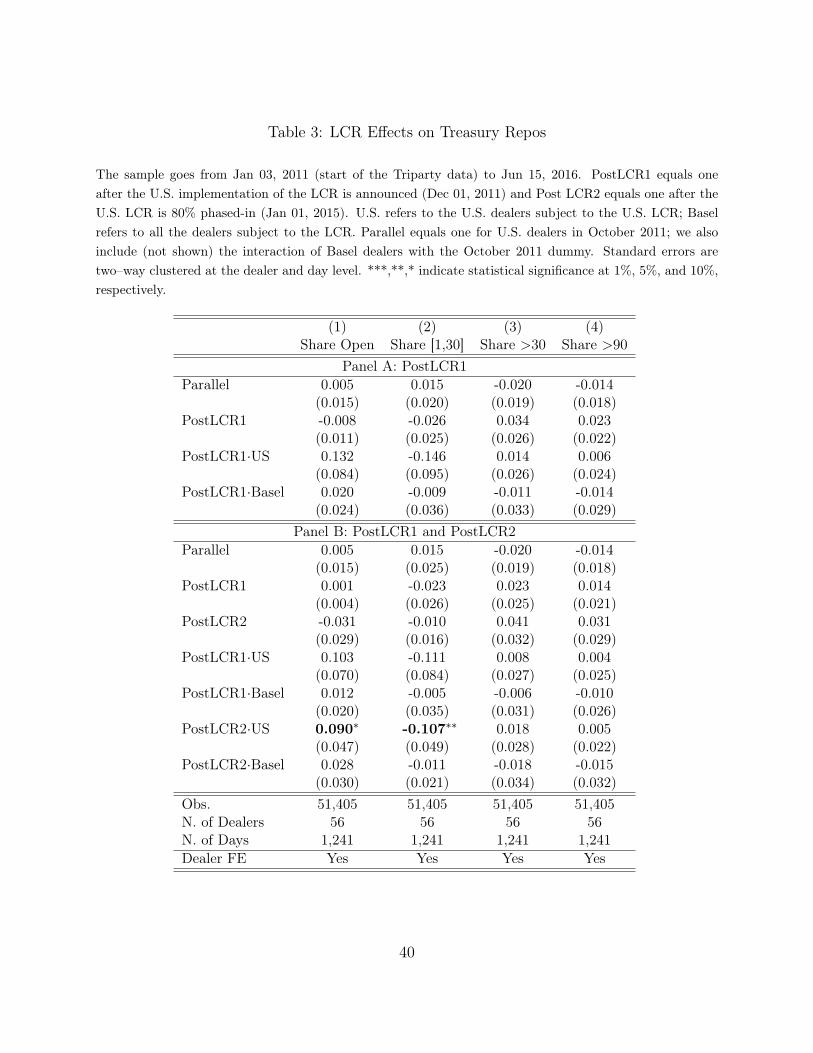
Table 3: LCR Effects on Treasury Repos
The sample goes from Jan 03, 2011 (start of the Triparty data) to Jun 15, 2016. PostLCR1 equals oneafter the U.S. implementation of the LCR is announced (Dec 01, 2011) and Post LCR2 equals one after theU.S. LCR is 80% phased-in (Jan 01, 2015). U.S. refers to the U.S. dealers subject to the U.S. LCR; Baselrefers to all the dealers subject to the LCR. Parallel equals one for U.S. dealers in October 2011; we alsoinclude (not shown) the interaction of Basel dealers with the October 2011 dummy. Standard errors aretwo–way clustered at the dealer and day level. ***,**,* indicate statistical significance at 1%, 5%, and 10%,respectively.
(1) (2) (3) (4)Share Open Share [1,30] Share >30 Share >90
Panel A: PostLCR1Parallel 0.005 0.015 -0.020 -0.014
(0.015) (0.020) (0.019) (0.018)PostLCR1 -0.008 -0.026 0.034 0.023
(0.011) (0.025) (0.026) (0.022)PostLCR1·US 0.132 -0.146 0.014 0.006
(0.084) (0.095) (0.026) (0.024)PostLCR1·Basel 0.020 -0.009 -0.011 -0.014
(0.024) (0.036) (0.033) (0.029)Panel B: PostLCR1 and PostLCR2
Parallel 0.005 0.015 -0.020 -0.014(0.015) (0.025) (0.019) (0.018)
PostLCR1 0.001 -0.023 0.023 0.014(0.004) (0.026) (0.025) (0.021)
PostLCR2 -0.031 -0.010 0.041 0.031(0.029) (0.016) (0.032) (0.029)
PostLCR1·US 0.103 -0.111 0.008 0.004(0.070) (0.084) (0.027) (0.025)
PostLCR1·Basel 0.012 -0.005 -0.006 -0.010(0.020) (0.035) (0.031) (0.026)
PostLCR2·US 0.090∗ -0.107∗∗ 0.018 0.005(0.047) (0.049) (0.028) (0.022)
PostLCR2·Basel 0.028 -0.011 -0.018 -0.015(0.030) (0.021) (0.034) (0.032)
Obs. 51,405 51,405 51,405 51,405N. of Dealers 56 56 56 56N. of Days 1,241 1,241 1,241 1,241Dealer FE Yes Yes Yes Yes
40
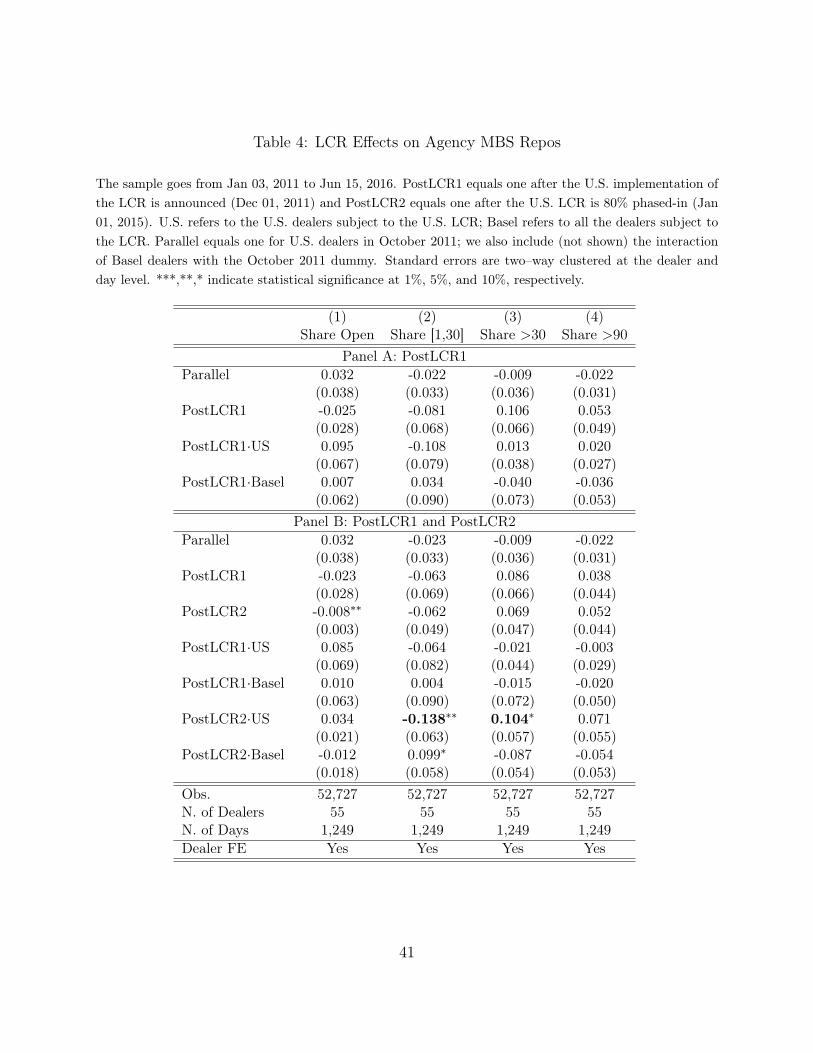
Table 4: LCR Effects on Agency MBS Repos
The sample goes from Jan 03, 2011 to Jun 15, 2016. PostLCR1 equals one after the U.S. implementation ofthe LCR is announced (Dec 01, 2011) and PostLCR2 equals one after the U.S. LCR is 80% phased-in (Jan01, 2015). U.S. refers to the U.S. dealers subject to the U.S. LCR; Basel refers to all the dealers subject tothe LCR. Parallel equals one for U.S. dealers in October 2011; we also include (not shown) the interactionof Basel dealers with the October 2011 dummy. Standard errors are two–way clustered at the dealer andday level. ***,**,* indicate statistical significance at 1%, 5%, and 10%, respectively.
(1) (2) (3) (4)Share Open Share [1,30] Share >30 Share >90
Panel A: PostLCR1Parallel 0.032 -0.022 -0.009 -0.022
(0.038) (0.033) (0.036) (0.031)PostLCR1 -0.025 -0.081 0.106 0.053
(0.028) (0.068) (0.066) (0.049)PostLCR1·US 0.095 -0.108 0.013 0.020
(0.067) (0.079) (0.038) (0.027)PostLCR1·Basel 0.007 0.034 -0.040 -0.036
(0.062) (0.090) (0.073) (0.053)Panel B: PostLCR1 and PostLCR2
Parallel 0.032 -0.023 -0.009 -0.022(0.038) (0.033) (0.036) (0.031)
PostLCR1 -0.023 -0.063 0.086 0.038(0.028) (0.069) (0.066) (0.044)
PostLCR2 -0.008∗∗ -0.062 0.069 0.052(0.003) (0.049) (0.047) (0.044)
PostLCR1·US 0.085 -0.064 -0.021 -0.003(0.069) (0.082) (0.044) (0.029)
PostLCR1·Basel 0.010 0.004 -0.015 -0.020(0.063) (0.090) (0.072) (0.050)
PostLCR2·US 0.034 -0.138∗∗ 0.104∗ 0.071(0.021) (0.063) (0.057) (0.055)
PostLCR2·Basel -0.012 0.099∗ -0.087 -0.054(0.018) (0.058) (0.054) (0.053)
Obs. 52,727 52,727 52,727 52,727N. of Dealers 55 55 55 55N. of Days 1,249 1,249 1,249 1,249Dealer FE Yes Yes Yes Yes
41
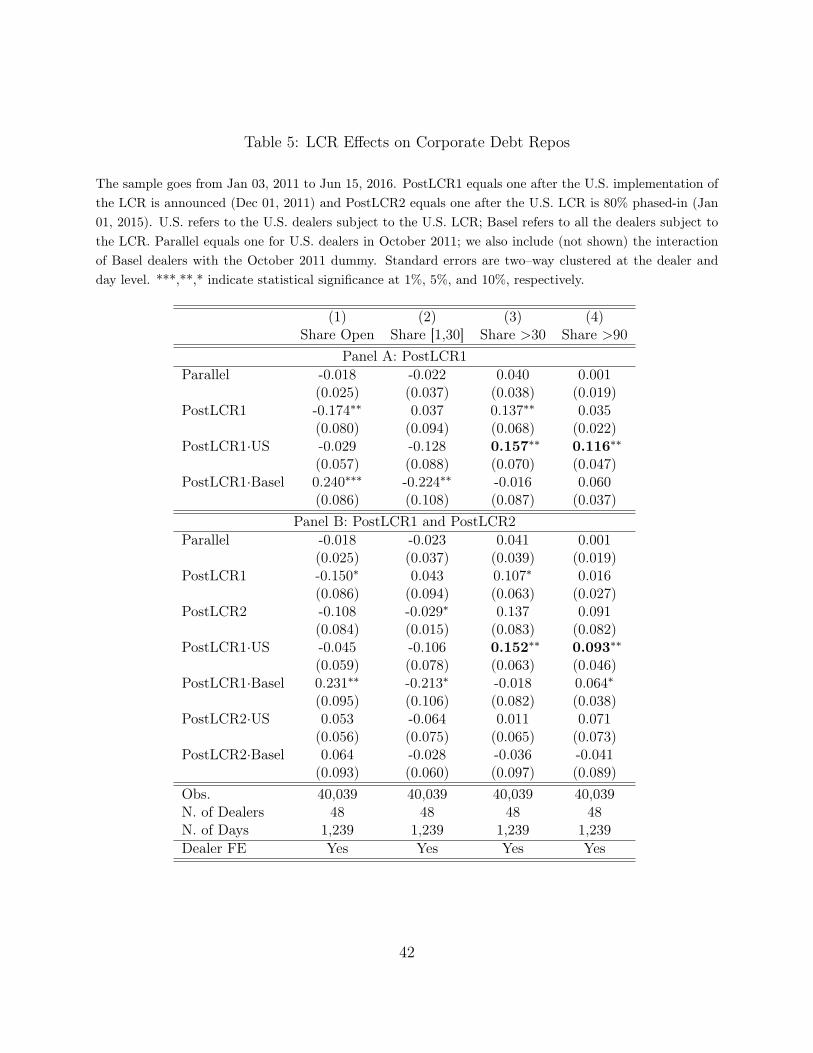
Table 5: LCR Effects on Corporate Debt Repos
The sample goes from Jan 03, 2011 to Jun 15, 2016. PostLCR1 equals one after the U.S. implementation ofthe LCR is announced (Dec 01, 2011) and PostLCR2 equals one after the U.S. LCR is 80% phased-in (Jan01, 2015). U.S. refers to the U.S. dealers subject to the U.S. LCR; Basel refers to all the dealers subject tothe LCR. Parallel equals one for U.S. dealers in October 2011; we also include (not shown) the interactionof Basel dealers with the October 2011 dummy. Standard errors are two–way clustered at the dealer andday level. ***,**,* indicate statistical significance at 1%, 5%, and 10%, respectively.
(1) (2) (3) (4)Share Open Share [1,30] Share >30 Share >90
Panel A: PostLCR1Parallel -0.018 -0.022 0.040 0.001
(0.025) (0.037) (0.038) (0.019)PostLCR1 -0.174∗∗ 0.037 0.137∗∗ 0.035
(0.080) (0.094) (0.068) (0.022)PostLCR1·US -0.029 -0.128 0.157∗∗ 0.116∗∗
(0.057) (0.088) (0.070) (0.047)PostLCR1·Basel 0.240∗∗∗ -0.224∗∗ -0.016 0.060
(0.086) (0.108) (0.087) (0.037)Panel B: PostLCR1 and PostLCR2
Parallel -0.018 -0.023 0.041 0.001(0.025) (0.037) (0.039) (0.019)
PostLCR1 -0.150∗ 0.043 0.107∗ 0.016(0.086) (0.094) (0.063) (0.027)
PostLCR2 -0.108 -0.029∗ 0.137 0.091(0.084) (0.015) (0.083) (0.082)
PostLCR1·US -0.045 -0.106 0.152∗∗ 0.093∗∗
(0.059) (0.078) (0.063) (0.046)PostLCR1·Basel 0.231∗∗ -0.213∗ -0.018 0.064∗
(0.095) (0.106) (0.082) (0.038)PostLCR2·US 0.053 -0.064 0.011 0.071
(0.056) (0.075) (0.065) (0.073)PostLCR2·Basel 0.064 -0.028 -0.036 -0.041
(0.093) (0.060) (0.097) (0.089)Obs. 40,039 40,039 40,039 40,039N. of Dealers 48 48 48 48N. of Days 1,239 1,239 1,239 1,239Dealer FE Yes Yes Yes Yes
42
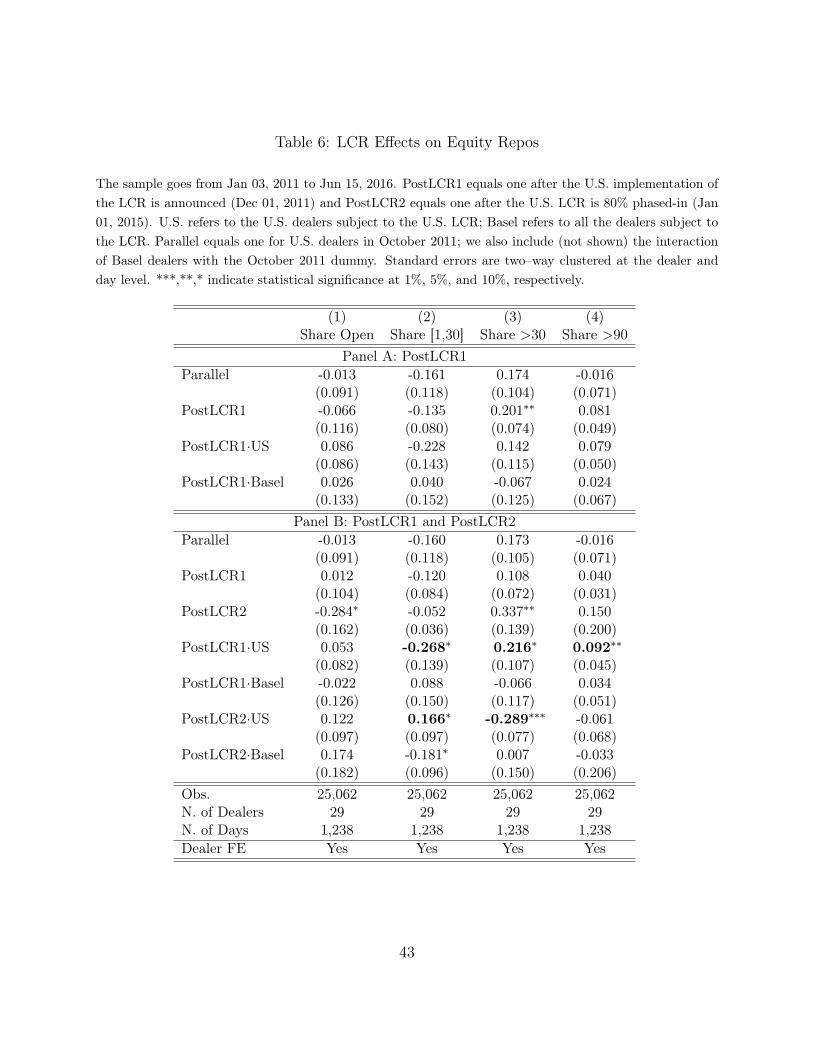
Table 6: LCR Effects on Equity Repos
The sample goes from Jan 03, 2011 to Jun 15, 2016. PostLCR1 equals one after the U.S. implementation ofthe LCR is announced (Dec 01, 2011) and PostLCR2 equals one after the U.S. LCR is 80% phased-in (Jan01, 2015). U.S. refers to the U.S. dealers subject to the U.S. LCR; Basel refers to all the dealers subject tothe LCR. Parallel equals one for U.S. dealers in October 2011; we also include (not shown) the interactionof Basel dealers with the October 2011 dummy. Standard errors are two–way clustered at the dealer andday level. ***,**,* indicate statistical significance at 1%, 5%, and 10%, respectively.
(1) (2) (3) (4)Share Open Share [1,30] Share >30 Share >90
Panel A: PostLCR1Parallel -0.013 -0.161 0.174 -0.016
(0.091) (0.118) (0.104) (0.071)PostLCR1 -0.066 -0.135 0.201∗∗ 0.081
(0.116) (0.080) (0.074) (0.049)PostLCR1·US 0.086 -0.228 0.142 0.079
(0.086) (0.143) (0.115) (0.050)PostLCR1·Basel 0.026 0.040 -0.067 0.024
(0.133) (0.152) (0.125) (0.067)Panel B: PostLCR1 and PostLCR2
Parallel -0.013 -0.160 0.173 -0.016(0.091) (0.118) (0.105) (0.071)
PostLCR1 0.012 -0.120 0.108 0.040(0.104) (0.084) (0.072) (0.031)
PostLCR2 -0.284∗ -0.052 0.337∗∗ 0.150(0.162) (0.036) (0.139) (0.200)
PostLCR1·US 0.053 -0.268∗ 0.216∗ 0.092∗∗
(0.082) (0.139) (0.107) (0.045)PostLCR1·Basel -0.022 0.088 -0.066 0.034
(0.126) (0.150) (0.117) (0.051)PostLCR2·US 0.122 0.166∗ -0.289∗∗∗ -0.061
(0.097) (0.097) (0.077) (0.068)PostLCR2·Basel 0.174 -0.181∗ 0.007 -0.033
(0.182) (0.096) (0.150) (0.206)Obs. 25,062 25,062 25,062 25,062N. of Dealers 29 29 29 29N. of Days 1,238 1,238 1,238 1,238Dealer FE Yes Yes Yes Yes
43
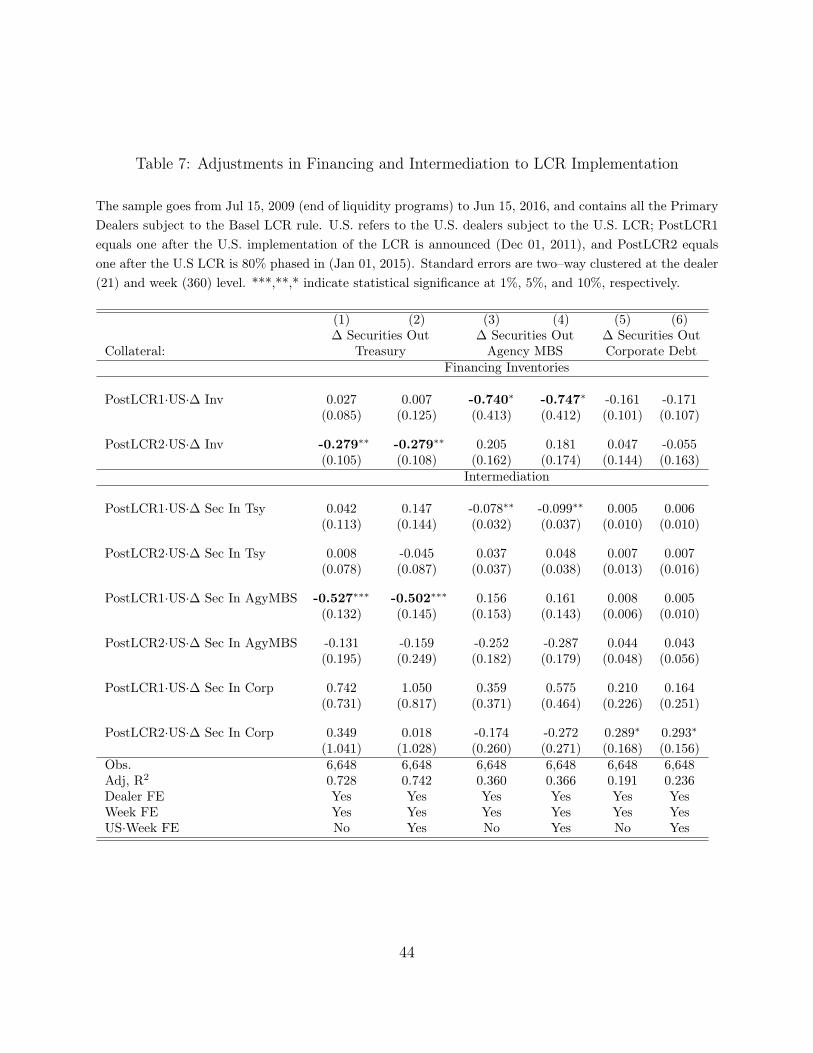
Table 7: Adjustments in Financing and Intermediation to LCR Implementation
The sample goes from Jul 15, 2009 (end of liquidity programs) to Jun 15, 2016, and contains all the PrimaryDealers subject to the Basel LCR rule. U.S. refers to the U.S. dealers subject to the U.S. LCR; PostLCR1equals one after the U.S. implementation of the LCR is announced (Dec 01, 2011), and PostLCR2 equalsone after the U.S LCR is 80% phased in (Jan 01, 2015). Standard errors are two–way clustered at the dealer(21) and week (360) level. ***,**,* indicate statistical significance at 1%, 5%, and 10%, respectively.
(1) (2) (3) (4) (5) (6)∆ Securities Out ∆ Securities Out ∆ Securities Out
Collateral: Treasury Agency MBS Corporate DebtFinancing Inventories
PostLCR1·US·∆ Inv 0.027 0.007 -0.740∗ -0.747∗ -0.161 -0.171(0.085) (0.125) (0.413) (0.412) (0.101) (0.107)
PostLCR2·US·∆ Inv -0.279∗∗ -0.279∗∗ 0.205 0.181 0.047 -0.055(0.105) (0.108) (0.162) (0.174) (0.144) (0.163)
Intermediation
PostLCR1·US·∆ Sec In Tsy 0.042 0.147 -0.078∗∗ -0.099∗∗ 0.005 0.006(0.113) (0.144) (0.032) (0.037) (0.010) (0.010)
PostLCR2·US·∆ Sec In Tsy 0.008 -0.045 0.037 0.048 0.007 0.007(0.078) (0.087) (0.037) (0.038) (0.013) (0.016)
PostLCR1·US·∆ Sec In AgyMBS -0.527∗∗∗ -0.502∗∗∗ 0.156 0.161 0.008 0.005(0.132) (0.145) (0.153) (0.143) (0.006) (0.010)
PostLCR2·US·∆ Sec In AgyMBS -0.131 -0.159 -0.252 -0.287 0.044 0.043(0.195) (0.249) (0.182) (0.179) (0.048) (0.056)
PostLCR1·US·∆ Sec In Corp 0.742 1.050 0.359 0.575 0.210 0.164(0.731) (0.817) (0.371) (0.464) (0.226) (0.251)
PostLCR2·US·∆ Sec In Corp 0.349 0.018 -0.174 -0.272 0.289∗ 0.293∗(1.041) (1.028) (0.260) (0.271) (0.168) (0.156)
Obs. 6,648 6,648 6,648 6,648 6,648 6,648Adj, R2 0.728 0.742 0.360 0.366 0.191 0.236Dealer FE Yes Yes Yes Yes Yes YesWeek FE Yes Yes Yes Yes Yes YesUS·Week FE No Yes No Yes No Yes
44
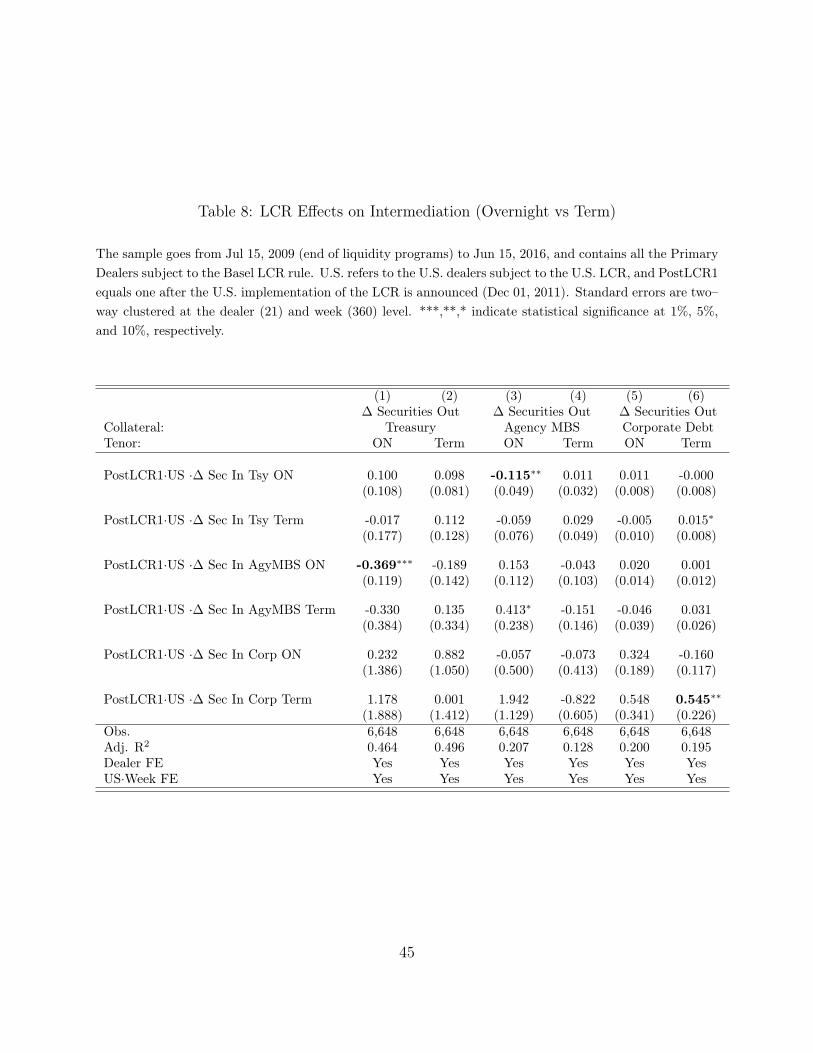
Table 8: LCR Effects on Intermediation (Overnight vs Term)
The sample goes from Jul 15, 2009 (end of liquidity programs) to Jun 15, 2016, and contains all the PrimaryDealers subject to the Basel LCR rule. U.S. refers to the U.S. dealers subject to the U.S. LCR, and PostLCR1equals one after the U.S. implementation of the LCR is announced (Dec 01, 2011). Standard errors are two–way clustered at the dealer (21) and week (360) level. ***,**,* indicate statistical significance at 1%, 5%,and 10%, respectively.
(1) (2) (3) (4) (5) (6)∆ Securities Out ∆ Securities Out ∆ Securities Out
Collateral: Treasury Agency MBS Corporate DebtTenor: ON Term ON Term ON Term
PostLCR1·US ·∆ Sec In Tsy ON 0.100 0.098 -0.115∗∗ 0.011 0.011 -0.000(0.108) (0.081) (0.049) (0.032) (0.008) (0.008)
PostLCR1·US ·∆ Sec In Tsy Term -0.017 0.112 -0.059 0.029 -0.005 0.015∗(0.177) (0.128) (0.076) (0.049) (0.010) (0.008)
PostLCR1·US ·∆ Sec In AgyMBS ON -0.369∗∗∗ -0.189 0.153 -0.043 0.020 0.001(0.119) (0.142) (0.112) (0.103) (0.014) (0.012)
PostLCR1·US ·∆ Sec In AgyMBS Term -0.330 0.135 0.413∗ -0.151 -0.046 0.031(0.384) (0.334) (0.238) (0.146) (0.039) (0.026)
PostLCR1·US ·∆ Sec In Corp ON 0.232 0.882 -0.057 -0.073 0.324 -0.160(1.386) (1.050) (0.500) (0.413) (0.189) (0.117)
PostLCR1·US ·∆ Sec In Corp Term 1.178 0.001 1.942 -0.822 0.548 0.545∗∗(1.888) (1.412) (1.129) (0.605) (0.341) (0.226)
Obs. 6,648 6,648 6,648 6,648 6,648 6,648Adj. R2 0.464 0.496 0.207 0.128 0.200 0.195Dealer FE Yes Yes Yes Yes Yes YesUS·Week FE Yes Yes Yes Yes Yes Yes
45
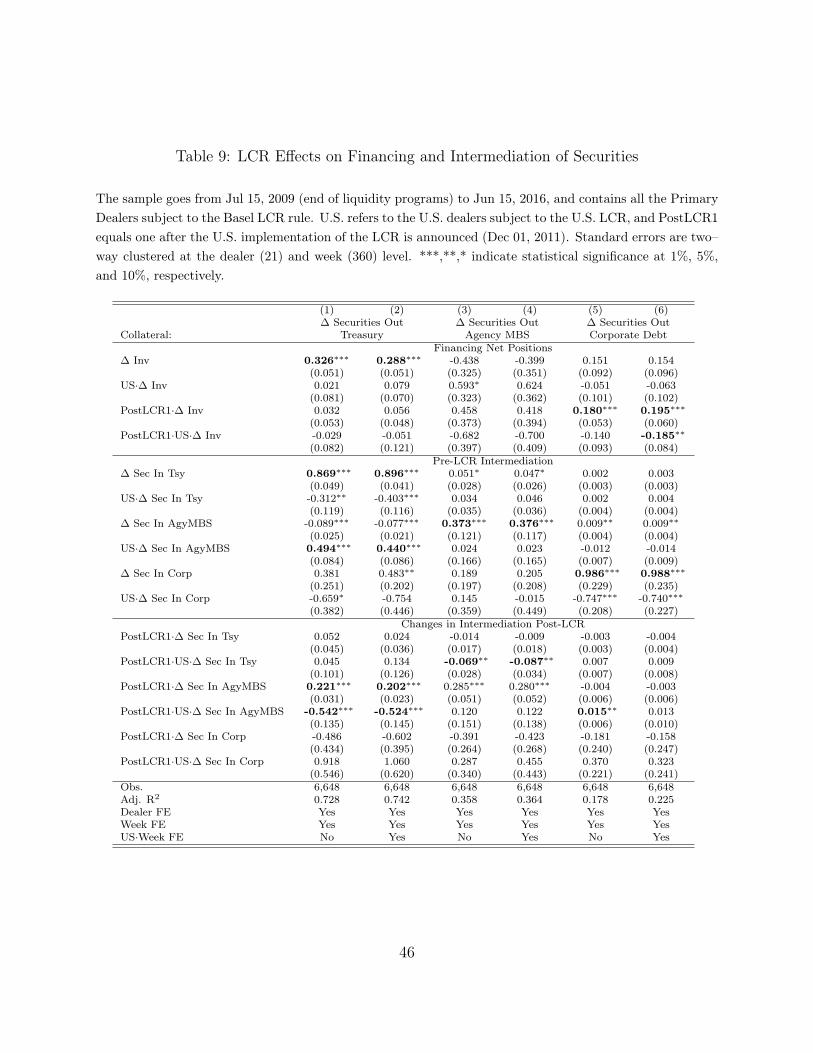
Table 9: LCR Effects on Financing and Intermediation of Securities
The sample goes from Jul 15, 2009 (end of liquidity programs) to Jun 15, 2016, and contains all the PrimaryDealers subject to the Basel LCR rule. U.S. refers to the U.S. dealers subject to the U.S. LCR, and PostLCR1equals one after the U.S. implementation of the LCR is announced (Dec 01, 2011). Standard errors are two–way clustered at the dealer (21) and week (360) level. ***,**,* indicate statistical significance at 1%, 5%,and 10%, respectively.
(1) (2) (3) (4) (5) (6)∆ Securities Out ∆ Securities Out ∆ Securities Out
Collateral: Treasury Agency MBS Corporate DebtFinancing Net Positions
∆ Inv 0.326∗∗∗ 0.288∗∗∗ -0.438 -0.399 0.151 0.154(0.051) (0.051) (0.325) (0.351) (0.092) (0.096)
US·∆ Inv 0.021 0.079 0.593∗ 0.624 -0.051 -0.063(0.081) (0.070) (0.323) (0.362) (0.101) (0.102)
PostLCR1·∆ Inv 0.032 0.056 0.458 0.418 0.180∗∗∗ 0.195∗∗∗
(0.053) (0.048) (0.373) (0.394) (0.053) (0.060)PostLCR1·US·∆ Inv -0.029 -0.051 -0.682 -0.700 -0.140 -0.185∗∗
(0.082) (0.121) (0.397) (0.409) (0.093) (0.084)Pre-LCR Intermediation
∆ Sec In Tsy 0.869∗∗∗ 0.896∗∗∗ 0.051∗ 0.047∗ 0.002 0.003(0.049) (0.041) (0.028) (0.026) (0.003) (0.003)
US·∆ Sec In Tsy -0.312∗∗ -0.403∗∗∗ 0.034 0.046 0.002 0.004(0.119) (0.116) (0.035) (0.036) (0.004) (0.004)
∆ Sec In AgyMBS -0.089∗∗∗ -0.077∗∗∗ 0.373∗∗∗ 0.376∗∗∗ 0.009∗∗ 0.009∗∗(0.025) (0.021) (0.121) (0.117) (0.004) (0.004)
US·∆ Sec In AgyMBS 0.494∗∗∗ 0.440∗∗∗ 0.024 0.023 -0.012 -0.014(0.084) (0.086) (0.166) (0.165) (0.007) (0.009)
∆ Sec In Corp 0.381 0.483∗∗ 0.189 0.205 0.986∗∗∗ 0.988∗∗∗
(0.251) (0.202) (0.197) (0.208) (0.229) (0.235)US·∆ Sec In Corp -0.659∗ -0.754 0.145 -0.015 -0.747∗∗∗ -0.740∗∗∗
(0.382) (0.446) (0.359) (0.449) (0.208) (0.227)Changes in Intermediation Post-LCR
PostLCR1·∆ Sec In Tsy 0.052 0.024 -0.014 -0.009 -0.003 -0.004(0.045) (0.036) (0.017) (0.018) (0.003) (0.004)
PostLCR1·US·∆ Sec In Tsy 0.045 0.134 -0.069∗∗ -0.087∗∗ 0.007 0.009(0.101) (0.126) (0.028) (0.034) (0.007) (0.008)
PostLCR1·∆ Sec In AgyMBS 0.221∗∗∗ 0.202∗∗∗ 0.285∗∗∗ 0.280∗∗∗ -0.004 -0.003(0.031) (0.023) (0.051) (0.052) (0.006) (0.006)
PostLCR1·US·∆ Sec In AgyMBS -0.542∗∗∗ -0.524∗∗∗ 0.120 0.122 0.015∗∗ 0.013(0.135) (0.145) (0.151) (0.138) (0.006) (0.010)
PostLCR1·∆ Sec In Corp -0.486 -0.602 -0.391 -0.423 -0.181 -0.158(0.434) (0.395) (0.264) (0.268) (0.240) (0.247)
PostLCR1·US·∆ Sec In Corp 0.918 1.060 0.287 0.455 0.370 0.323(0.546) (0.620) (0.340) (0.443) (0.221) (0.241)
Obs. 6,648 6,648 6,648 6,648 6,648 6,648Adj. R2 0.728 0.742 0.358 0.364 0.178 0.225Dealer FE Yes Yes Yes Yes Yes YesWeek FE Yes Yes Yes Yes Yes YesUS·Week FE No Yes No Yes No Yes
46
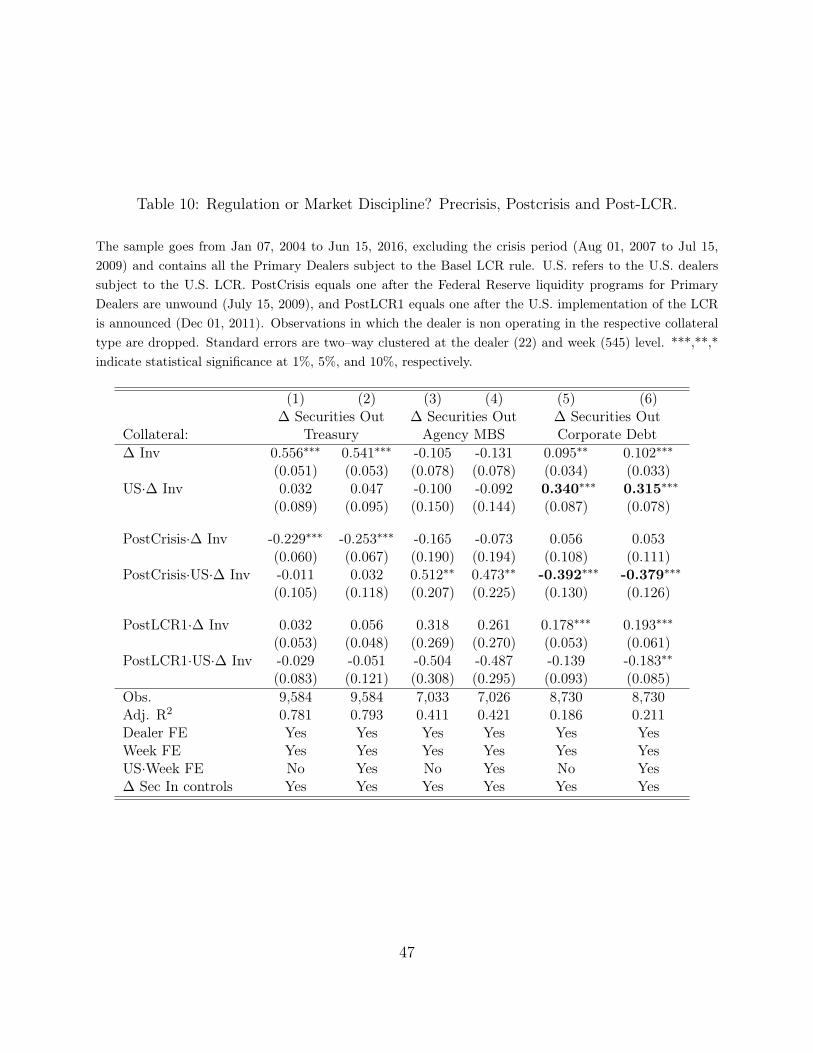
Table 10: Regulation or Market Discipline? Precrisis, Postcrisis and Post-LCR.
The sample goes from Jan 07, 2004 to Jun 15, 2016, excluding the crisis period (Aug 01, 2007 to Jul 15,2009) and contains all the Primary Dealers subject to the Basel LCR rule. U.S. refers to the U.S. dealerssubject to the U.S. LCR. PostCrisis equals one after the Federal Reserve liquidity programs for PrimaryDealers are unwound (July 15, 2009), and PostLCR1 equals one after the U.S. implementation of the LCRis announced (Dec 01, 2011). Observations in which the dealer is non operating in the respective collateraltype are dropped. Standard errors are two–way clustered at the dealer (22) and week (545) level. ***,**,*indicate statistical significance at 1%, 5%, and 10%, respectively.
(1) (2) (3) (4) (5) (6)∆ Securities Out ∆ Securities Out ∆ Securities Out
Collateral: Treasury Agency MBS Corporate Debt∆ Inv 0.556∗∗∗ 0.541∗∗∗ -0.105 -0.131 0.095∗∗ 0.102∗∗∗
(0.051) (0.053) (0.078) (0.078) (0.034) (0.033)US·∆ Inv 0.032 0.047 -0.100 -0.092 0.340∗∗∗ 0.315∗∗∗
(0.089) (0.095) (0.150) (0.144) (0.087) (0.078)
PostCrisis·∆ Inv -0.229∗∗∗ -0.253∗∗∗ -0.165 -0.073 0.056 0.053(0.060) (0.067) (0.190) (0.194) (0.108) (0.111)
PostCrisis·US·∆ Inv -0.011 0.032 0.512∗∗ 0.473∗∗ -0.392∗∗∗ -0.379∗∗∗
(0.105) (0.118) (0.207) (0.225) (0.130) (0.126)
PostLCR1·∆ Inv 0.032 0.056 0.318 0.261 0.178∗∗∗ 0.193∗∗∗
(0.053) (0.048) (0.269) (0.270) (0.053) (0.061)PostLCR1·US·∆ Inv -0.029 -0.051 -0.504 -0.487 -0.139 -0.183∗∗
(0.083) (0.121) (0.308) (0.295) (0.093) (0.085)Obs. 9,584 9,584 7,033 7,026 8,730 8,730Adj. R2 0.781 0.793 0.411 0.421 0.186 0.211Dealer FE Yes Yes Yes Yes Yes YesWeek FE Yes Yes Yes Yes Yes YesUS·Week FE No Yes No Yes No Yes∆ Sec In controls Yes Yes Yes Yes Yes Yes
47
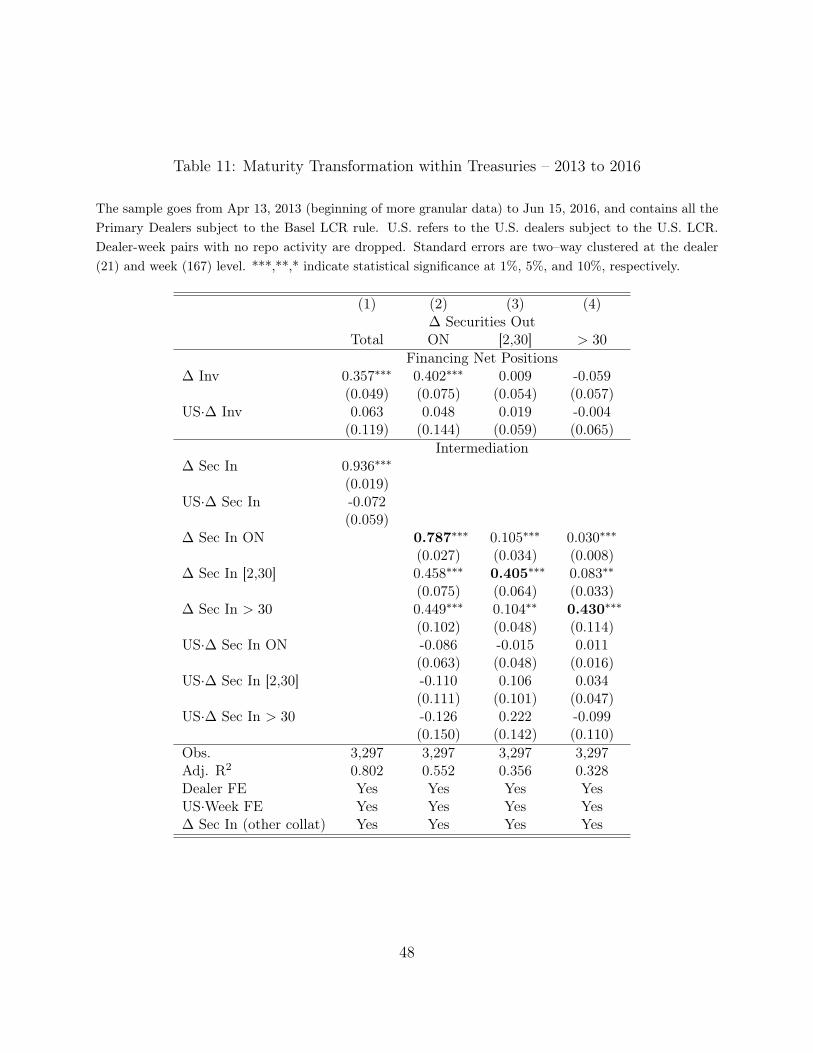
Table 11: Maturity Transformation within Treasuries – 2013 to 2016
The sample goes from Apr 13, 2013 (beginning of more granular data) to Jun 15, 2016, and contains all thePrimary Dealers subject to the Basel LCR rule. U.S. refers to the U.S. dealers subject to the U.S. LCR.Dealer-week pairs with no repo activity are dropped. Standard errors are two–way clustered at the dealer(21) and week (167) level. ***,**,* indicate statistical significance at 1%, 5%, and 10%, respectively.
(1) (2) (3) (4)∆ Securities Out
Total ON [2,30] > 30
Financing Net Positions∆ Inv 0.357∗∗∗ 0.402∗∗∗ 0.009 -0.059
(0.049) (0.075) (0.054) (0.057)US·∆ Inv 0.063 0.048 0.019 -0.004
(0.119) (0.144) (0.059) (0.065)Intermediation
∆ Sec In 0.936∗∗∗
(0.019)US·∆ Sec In -0.072
(0.059)∆ Sec In ON 0.787∗∗∗ 0.105∗∗∗ 0.030∗∗∗
(0.027) (0.034) (0.008)∆ Sec In [2,30] 0.458∗∗∗ 0.405∗∗∗ 0.083∗∗
(0.075) (0.064) (0.033)∆ Sec In > 30 0.449∗∗∗ 0.104∗∗ 0.430∗∗∗
(0.102) (0.048) (0.114)US·∆ Sec In ON -0.086 -0.015 0.011
(0.063) (0.048) (0.016)US·∆ Sec In [2,30] -0.110 0.106 0.034
(0.111) (0.101) (0.047)US·∆ Sec In > 30 -0.126 0.222 -0.099
(0.150) (0.142) (0.110)Obs. 3,297 3,297 3,297 3,297Adj. R2 0.802 0.552 0.356 0.328Dealer FE Yes Yes Yes YesUS·Week FE Yes Yes Yes Yes∆ Sec In (other collat) Yes Yes Yes Yes
48
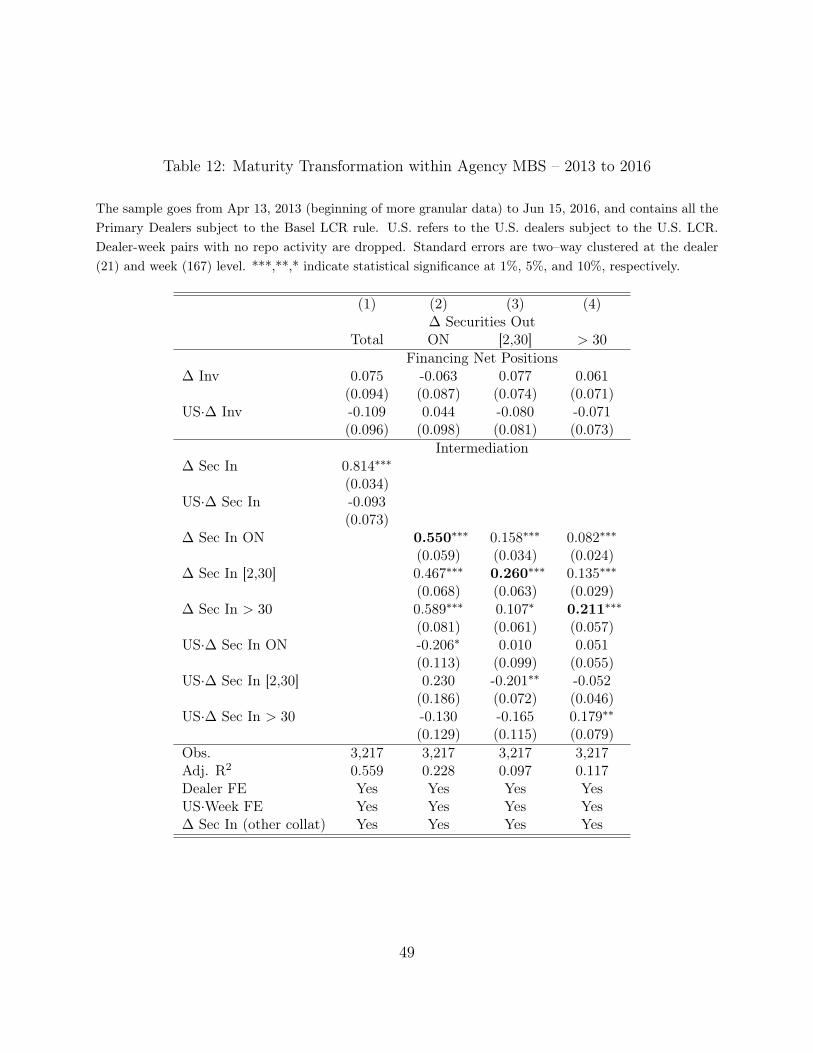
Table 12: Maturity Transformation within Agency MBS – 2013 to 2016
The sample goes from Apr 13, 2013 (beginning of more granular data) to Jun 15, 2016, and contains all thePrimary Dealers subject to the Basel LCR rule. U.S. refers to the U.S. dealers subject to the U.S. LCR.Dealer-week pairs with no repo activity are dropped. Standard errors are two–way clustered at the dealer(21) and week (167) level. ***,**,* indicate statistical significance at 1%, 5%, and 10%, respectively.
(1) (2) (3) (4)∆ Securities Out
Total ON [2,30] > 30
Financing Net Positions∆ Inv 0.075 -0.063 0.077 0.061
(0.094) (0.087) (0.074) (0.071)US·∆ Inv -0.109 0.044 -0.080 -0.071
(0.096) (0.098) (0.081) (0.073)Intermediation
∆ Sec In 0.814∗∗∗
(0.034)US·∆ Sec In -0.093
(0.073)∆ Sec In ON 0.550∗∗∗ 0.158∗∗∗ 0.082∗∗∗
(0.059) (0.034) (0.024)∆ Sec In [2,30] 0.467∗∗∗ 0.260∗∗∗ 0.135∗∗∗
(0.068) (0.063) (0.029)∆ Sec In > 30 0.589∗∗∗ 0.107∗ 0.211∗∗∗
(0.081) (0.061) (0.057)US·∆ Sec In ON -0.206∗ 0.010 0.051
(0.113) (0.099) (0.055)US·∆ Sec In [2,30] 0.230 -0.201∗∗ -0.052
(0.186) (0.072) (0.046)US·∆ Sec In > 30 -0.130 -0.165 0.179∗∗
(0.129) (0.115) (0.079)Obs. 3,217 3,217 3,217 3,217Adj. R2 0.559 0.228 0.097 0.117Dealer FE Yes Yes Yes YesUS·Week FE Yes Yes Yes Yes∆ Sec In (other collat) Yes Yes Yes Yes
49
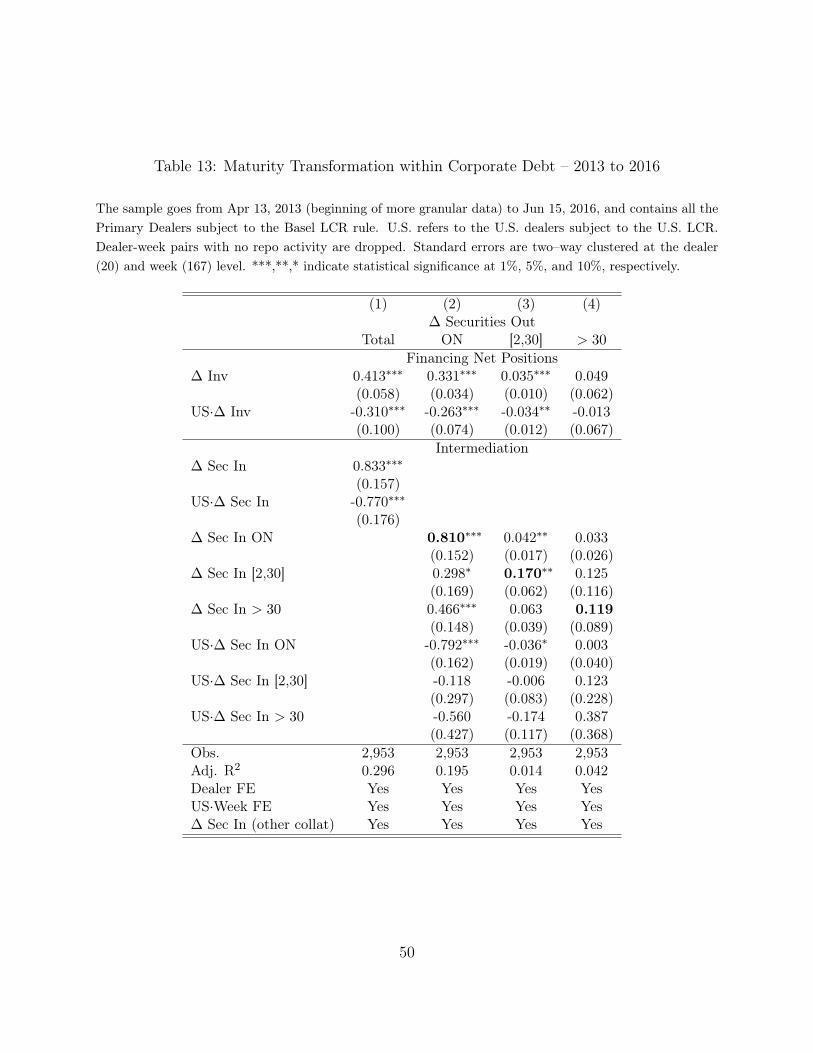
Table 13: Maturity Transformation within Corporate Debt – 2013 to 2016
The sample goes from Apr 13, 2013 (beginning of more granular data) to Jun 15, 2016, and contains all thePrimary Dealers subject to the Basel LCR rule. U.S. refers to the U.S. dealers subject to the U.S. LCR.Dealer-week pairs with no repo activity are dropped. Standard errors are two–way clustered at the dealer(20) and week (167) level. ***,**,* indicate statistical significance at 1%, 5%, and 10%, respectively.
(1) (2) (3) (4)∆ Securities Out
Total ON [2,30] > 30
Financing Net Positions∆ Inv 0.413∗∗∗ 0.331∗∗∗ 0.035∗∗∗ 0.049
(0.058) (0.034) (0.010) (0.062)US·∆ Inv -0.310∗∗∗ -0.263∗∗∗ -0.034∗∗ -0.013
(0.100) (0.074) (0.012) (0.067)Intermediation
∆ Sec In 0.833∗∗∗
(0.157)US·∆ Sec In -0.770∗∗∗
(0.176)∆ Sec In ON 0.810∗∗∗ 0.042∗∗ 0.033
(0.152) (0.017) (0.026)∆ Sec In [2,30] 0.298∗ 0.170∗∗ 0.125
(0.169) (0.062) (0.116)∆ Sec In > 30 0.466∗∗∗ 0.063 0.119
(0.148) (0.039) (0.089)US·∆ Sec In ON -0.792∗∗∗ -0.036∗ 0.003
(0.162) (0.019) (0.040)US·∆ Sec In [2,30] -0.118 -0.006 0.123
(0.297) (0.083) (0.228)US·∆ Sec In > 30 -0.560 -0.174 0.387
(0.427) (0.117) (0.368)Obs. 2,953 2,953 2,953 2,953Adj. R2 0.296 0.195 0.014 0.042Dealer FE Yes Yes Yes YesUS·Week FE Yes Yes Yes Yes∆ Sec In (other collat) Yes Yes Yes Yes
50
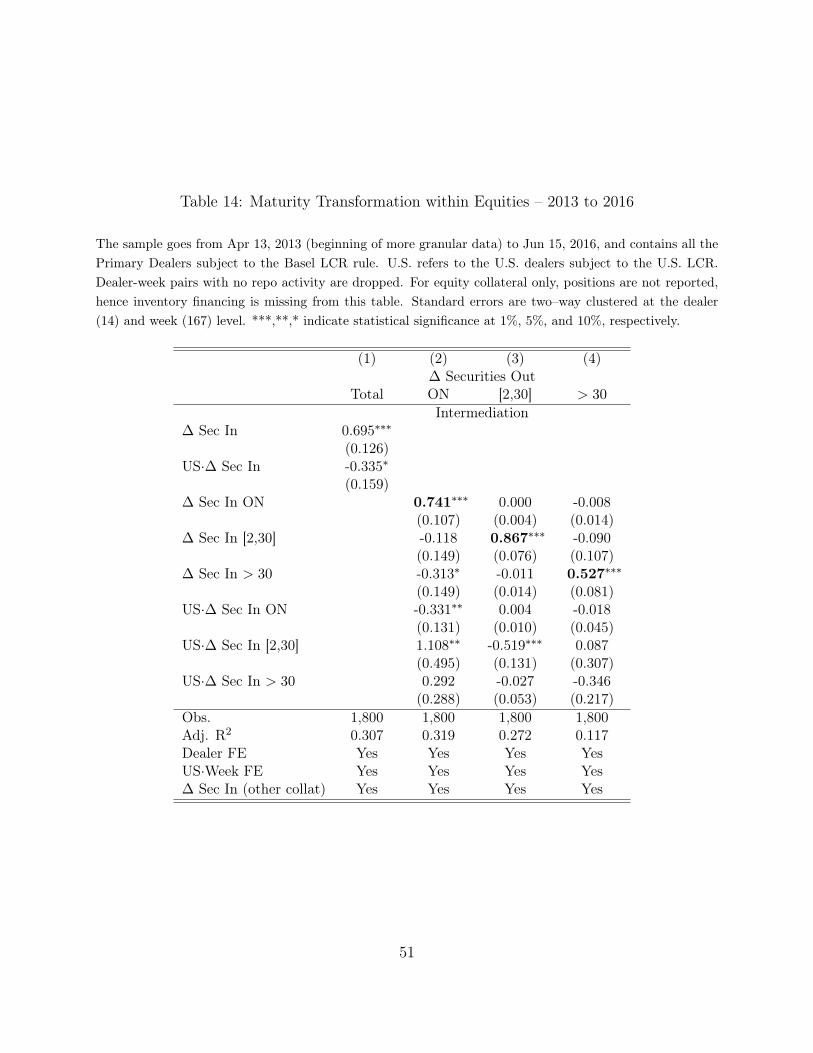
Table 14: Maturity Transformation within Equities – 2013 to 2016
The sample goes from Apr 13, 2013 (beginning of more granular data) to Jun 15, 2016, and contains all thePrimary Dealers subject to the Basel LCR rule. U.S. refers to the U.S. dealers subject to the U.S. LCR.Dealer-week pairs with no repo activity are dropped. For equity collateral only, positions are not reported,hence inventory financing is missing from this table. Standard errors are two–way clustered at the dealer(14) and week (167) level. ***,**,* indicate statistical significance at 1%, 5%, and 10%, respectively.
(1) (2) (3) (4)∆ Securities Out
Total ON [2,30] > 30
Intermediation∆ Sec In 0.695∗∗∗
(0.126)US·∆ Sec In -0.335∗
(0.159)∆ Sec In ON 0.741∗∗∗ 0.000 -0.008
(0.107) (0.004) (0.014)∆ Sec In [2,30] -0.118 0.867∗∗∗ -0.090
(0.149) (0.076) (0.107)∆ Sec In > 30 -0.313∗ -0.011 0.527∗∗∗
(0.149) (0.014) (0.081)US·∆ Sec In ON -0.331∗∗ 0.004 -0.018
(0.131) (0.010) (0.045)US·∆ Sec In [2,30] 1.108∗∗ -0.519∗∗∗ 0.087
(0.495) (0.131) (0.307)US·∆ Sec In > 30 0.292 -0.027 -0.346
(0.288) (0.053) (0.217)Obs. 1,800 1,800 1,800 1,800Adj. R2 0.307 0.319 0.272 0.117Dealer FE Yes Yes Yes YesUS·Week FE Yes Yes Yes Yes∆ Sec In (other collat) Yes Yes Yes Yes
51