liquids: influence of cation structure towards designing ... · towards designing environmentally...
TRANSCRIPT
Towards designing environmentally safe ionic liquids: Influence of cation structure
Supplementary material 1.
Anita Sosnowska1, Maciej Barycki1, Monika Zaborowska1, Anna Rybinska1, and Tomasz Puzyn1*
1 Laboratory of Environmental Chemometrics, Institute for Environmental and Human Health Protection, Faculty of Chemistry, University of Gdańsk, Wita Stwosza 63, 80-308 Gdańsk Poland
*Corresponding author: Prof. Tomasz Puzyn, Laboratory of Environmental Chemometrics, Faculty of Chemistry, University of Gdańsk, ul. Wita Stwosza 63, 80-308 Gdańsk, Poland. Tel.: +48 58 523 52 48; E-mail address: [email protected]
Electronic Supplementary Material (ESI) for Green Chemistry.This journal is © The Royal Society of Chemistry 2014
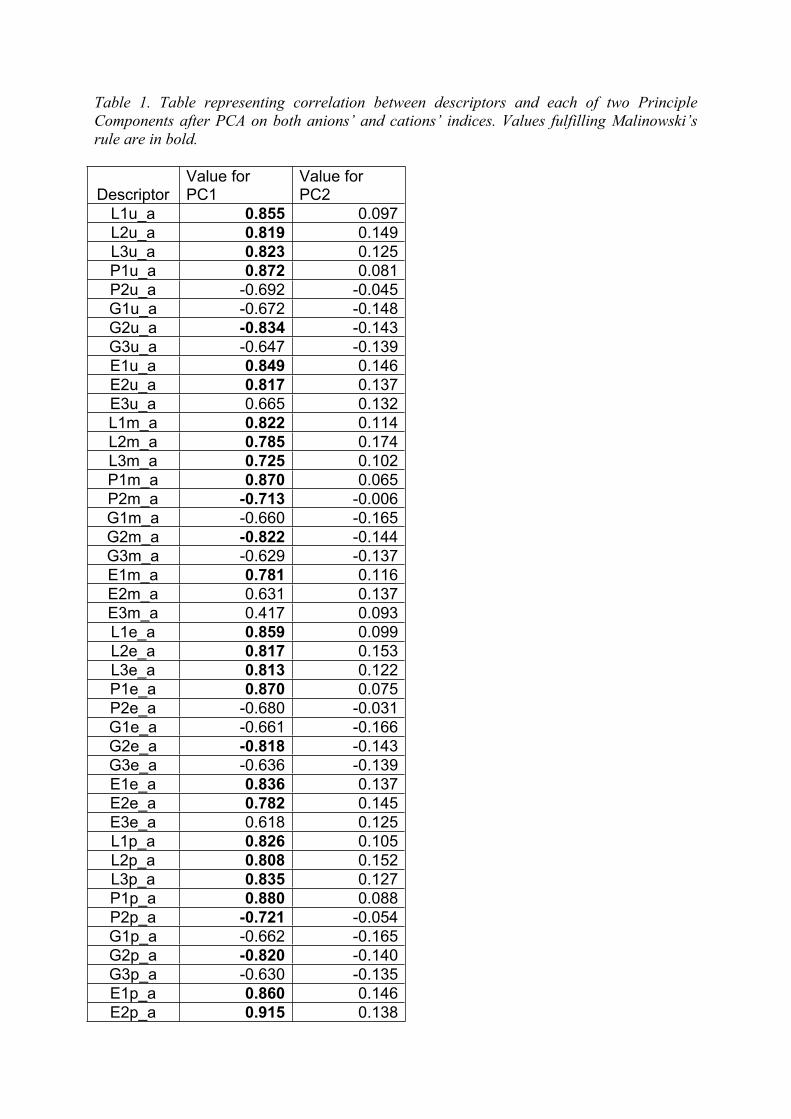
Table 1. Table representing correlation between descriptors and each of two Principle Components after PCA on both anions’ and cations’ indices. Values fulfilling Malinowski’s rule are in bold.
DescriptorValue for PC1
Value for PC2
L1u_a 0.855 0.097L2u_a 0.819 0.149L3u_a 0.823 0.125P1u_a 0.872 0.081P2u_a -0.692 -0.045G1u_a -0.672 -0.148G2u_a -0.834 -0.143G3u_a -0.647 -0.139E1u_a 0.849 0.146E2u_a 0.817 0.137E3u_a 0.665 0.132L1m_a 0.822 0.114L2m_a 0.785 0.174L3m_a 0.725 0.102P1m_a 0.870 0.065P2m_a -0.713 -0.006G1m_a -0.660 -0.165G2m_a -0.822 -0.144G3m_a -0.629 -0.137E1m_a 0.781 0.116E2m_a 0.631 0.137E3m_a 0.417 0.093L1e_a 0.859 0.099L2e_a 0.817 0.153L3e_a 0.813 0.122P1e_a 0.870 0.075P2e_a -0.680 -0.031G1e_a -0.661 -0.166G2e_a -0.818 -0.143G3e_a -0.636 -0.139E1e_a 0.836 0.137E2e_a 0.782 0.145E3e_a 0.618 0.125L1p_a 0.826 0.105L2p_a 0.808 0.152L3p_a 0.835 0.127P1p_a 0.880 0.088P2p_a -0.721 -0.054G1p_a -0.662 -0.165G2p_a -0.820 -0.140G3p_a -0.630 -0.135E1p_a 0.860 0.146E2p_a 0.915 0.138
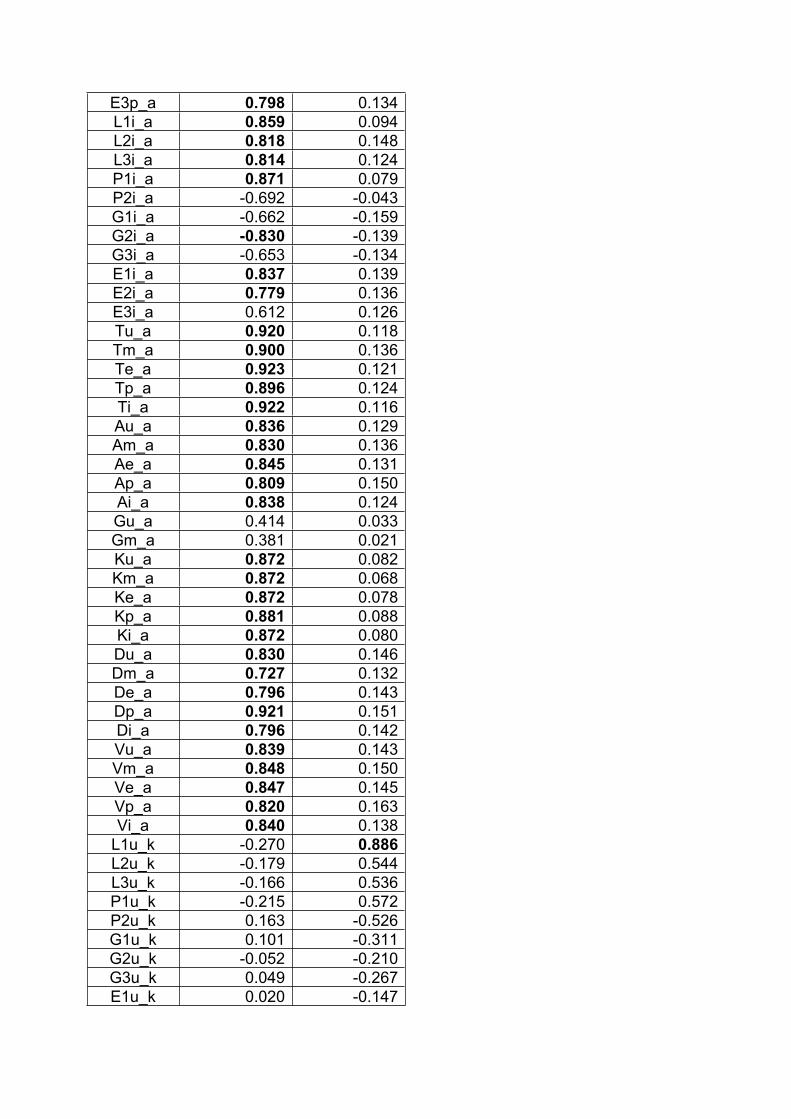
E3p_a 0.798 0.134L1i_a 0.859 0.094L2i_a 0.818 0.148L3i_a 0.814 0.124P1i_a 0.871 0.079P2i_a -0.692 -0.043G1i_a -0.662 -0.159G2i_a -0.830 -0.139G3i_a -0.653 -0.134E1i_a 0.837 0.139E2i_a 0.779 0.136E3i_a 0.612 0.126Tu_a 0.920 0.118Tm_a 0.900 0.136Te_a 0.923 0.121Tp_a 0.896 0.124Ti_a 0.922 0.116Au_a 0.836 0.129Am_a 0.830 0.136Ae_a 0.845 0.131Ap_a 0.809 0.150Ai_a 0.838 0.124Gu_a 0.414 0.033Gm_a 0.381 0.021Ku_a 0.872 0.082Km_a 0.872 0.068Ke_a 0.872 0.078Kp_a 0.881 0.088Ki_a 0.872 0.080Du_a 0.830 0.146Dm_a 0.727 0.132De_a 0.796 0.143Dp_a 0.921 0.151Di_a 0.796 0.142Vu_a 0.839 0.143Vm_a 0.848 0.150Ve_a 0.847 0.145Vp_a 0.820 0.163Vi_a 0.840 0.138
L1u_k -0.270 0.886L2u_k -0.179 0.544L3u_k -0.166 0.536P1u_k -0.215 0.572P2u_k 0.163 -0.526G1u_k 0.101 -0.311G2u_k -0.052 -0.210G3u_k 0.049 -0.267E1u_k 0.020 -0.147
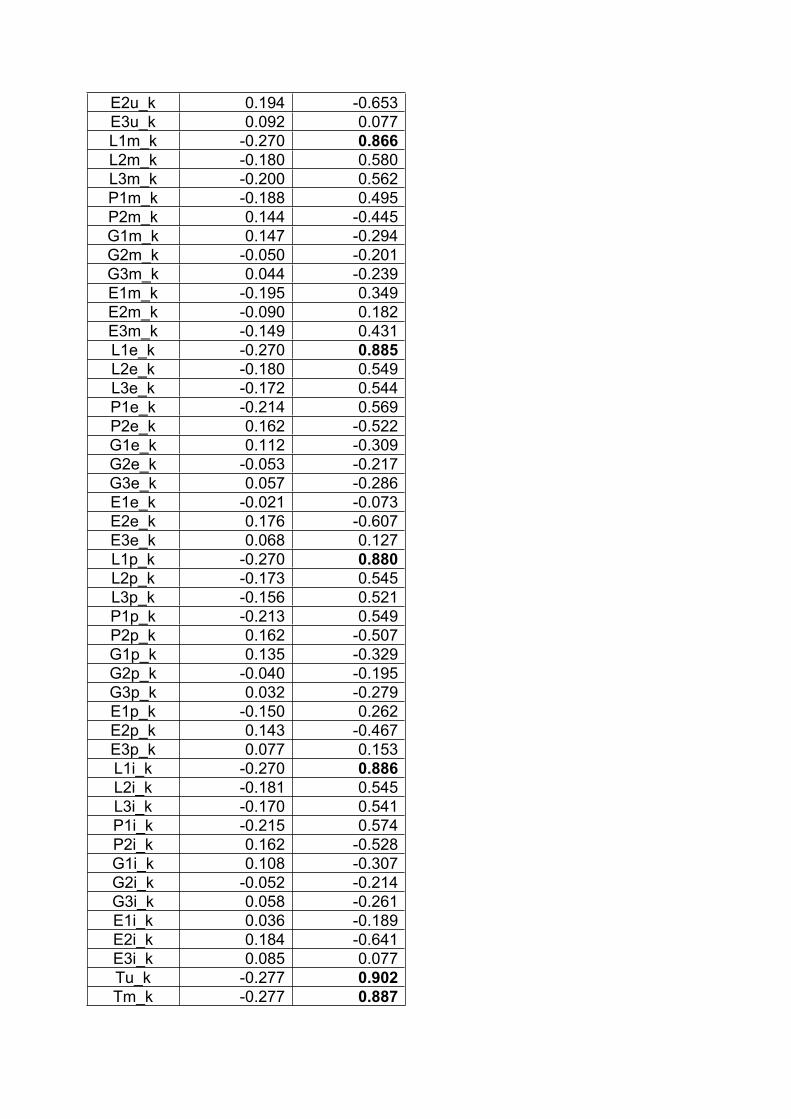
E2u_k 0.194 -0.653E3u_k 0.092 0.077L1m_k -0.270 0.866L2m_k -0.180 0.580L3m_k -0.200 0.562P1m_k -0.188 0.495P2m_k 0.144 -0.445G1m_k 0.147 -0.294G2m_k -0.050 -0.201G3m_k 0.044 -0.239E1m_k -0.195 0.349E2m_k -0.090 0.182E3m_k -0.149 0.431L1e_k -0.270 0.885L2e_k -0.180 0.549L3e_k -0.172 0.544P1e_k -0.214 0.569P2e_k 0.162 -0.522G1e_k 0.112 -0.309G2e_k -0.053 -0.217G3e_k 0.057 -0.286E1e_k -0.021 -0.073E2e_k 0.176 -0.607E3e_k 0.068 0.127L1p_k -0.270 0.880L2p_k -0.173 0.545L3p_k -0.156 0.521P1p_k -0.213 0.549P2p_k 0.162 -0.507G1p_k 0.135 -0.329G2p_k -0.040 -0.195G3p_k 0.032 -0.279E1p_k -0.150 0.262E2p_k 0.143 -0.467E3p_k 0.077 0.153L1i_k -0.270 0.886L2i_k -0.181 0.545L3i_k -0.170 0.541P1i_k -0.215 0.574P2i_k 0.162 -0.528G1i_k 0.108 -0.307G2i_k -0.052 -0.214G3i_k 0.058 -0.261E1i_k 0.036 -0.189E2i_k 0.184 -0.641E3i_k 0.085 0.077Tu_k -0.277 0.902Tm_k -0.277 0.887
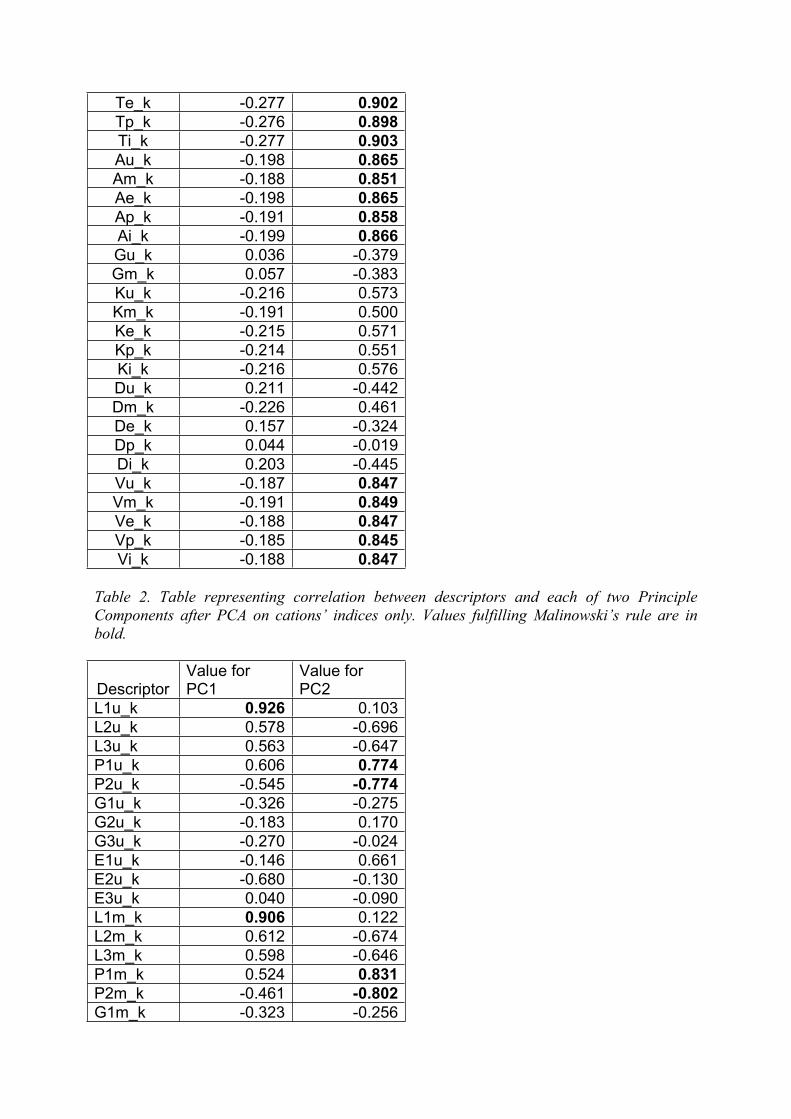
Te_k -0.277 0.902Tp_k -0.276 0.898Ti_k -0.277 0.903Au_k -0.198 0.865Am_k -0.188 0.851Ae_k -0.198 0.865Ap_k -0.191 0.858Ai_k -0.199 0.866Gu_k 0.036 -0.379Gm_k 0.057 -0.383Ku_k -0.216 0.573Km_k -0.191 0.500Ke_k -0.215 0.571Kp_k -0.214 0.551Ki_k -0.216 0.576Du_k 0.211 -0.442Dm_k -0.226 0.461De_k 0.157 -0.324Dp_k 0.044 -0.019Di_k 0.203 -0.445Vu_k -0.187 0.847Vm_k -0.191 0.849Ve_k -0.188 0.847Vp_k -0.185 0.845Vi_k -0.188 0.847
Table 2. Table representing correlation between descriptors and each of two Principle Components after PCA on cations’ indices only. Values fulfilling Malinowski’s rule are in bold.
DescriptorValue for PC1
Value for PC2
L1u_k 0.926 0.103L2u_k 0.578 -0.696L3u_k 0.563 -0.647P1u_k 0.606 0.774P2u_k -0.545 -0.774G1u_k -0.326 -0.275G2u_k -0.183 0.170G3u_k -0.270 -0.024E1u_k -0.146 0.661E2u_k -0.680 -0.130E3u_k 0.040 -0.090L1m_k 0.906 0.122L2m_k 0.612 -0.674L3m_k 0.598 -0.646P1m_k 0.524 0.831P2m_k -0.461 -0.802G1m_k -0.323 -0.256
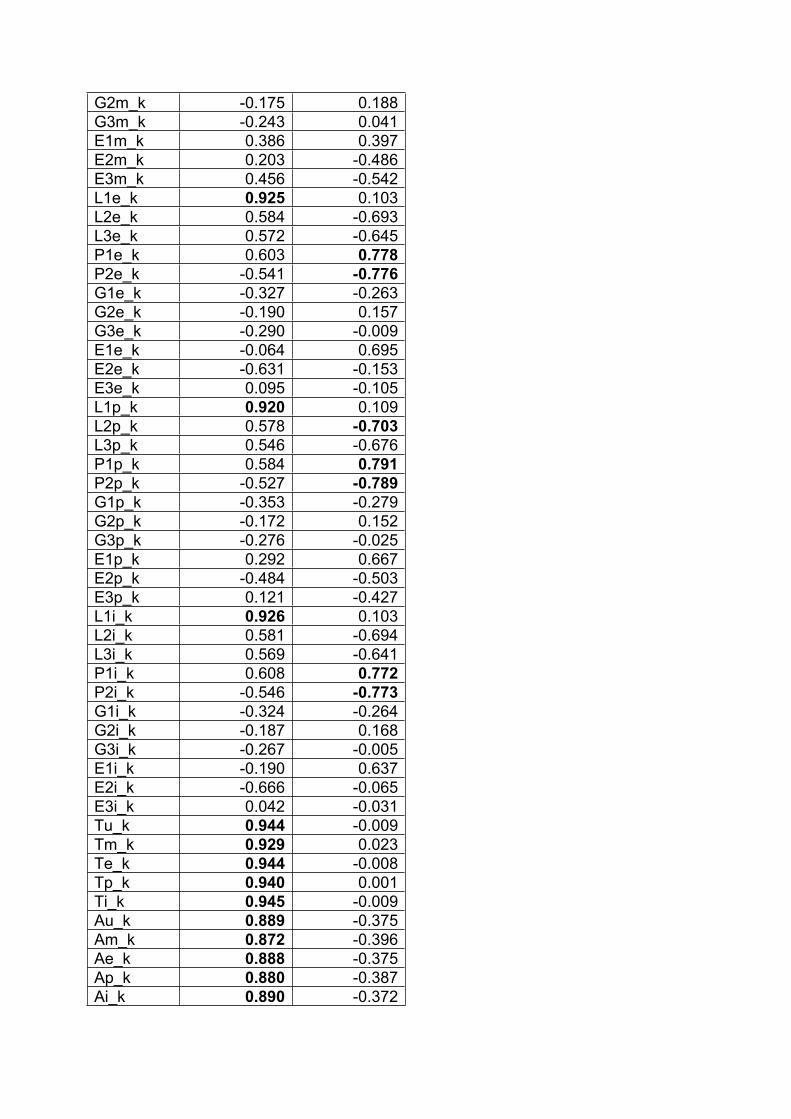
G2m_k -0.175 0.188G3m_k -0.243 0.041E1m_k 0.386 0.397E2m_k 0.203 -0.486E3m_k 0.456 -0.542L1e_k 0.925 0.103L2e_k 0.584 -0.693L3e_k 0.572 -0.645P1e_k 0.603 0.778P2e_k -0.541 -0.776G1e_k -0.327 -0.263G2e_k -0.190 0.157G3e_k -0.290 -0.009E1e_k -0.064 0.695E2e_k -0.631 -0.153E3e_k 0.095 -0.105L1p_k 0.920 0.109L2p_k 0.578 -0.703L3p_k 0.546 -0.676P1p_k 0.584 0.791P2p_k -0.527 -0.789G1p_k -0.353 -0.279G2p_k -0.172 0.152G3p_k -0.276 -0.025E1p_k 0.292 0.667E2p_k -0.484 -0.503E3p_k 0.121 -0.427L1i_k 0.926 0.103L2i_k 0.581 -0.694L3i_k 0.569 -0.641P1i_k 0.608 0.772P2i_k -0.546 -0.773G1i_k -0.324 -0.264G2i_k -0.187 0.168G3i_k -0.267 -0.005E1i_k -0.190 0.637E2i_k -0.666 -0.065E3i_k 0.042 -0.031Tu_k 0.944 -0.009Tm_k 0.929 0.023Te_k 0.944 -0.008Tp_k 0.940 0.001Ti_k 0.945 -0.009Au_k 0.889 -0.375Am_k 0.872 -0.396Ae_k 0.888 -0.375Ap_k 0.880 -0.387Ai_k 0.890 -0.372
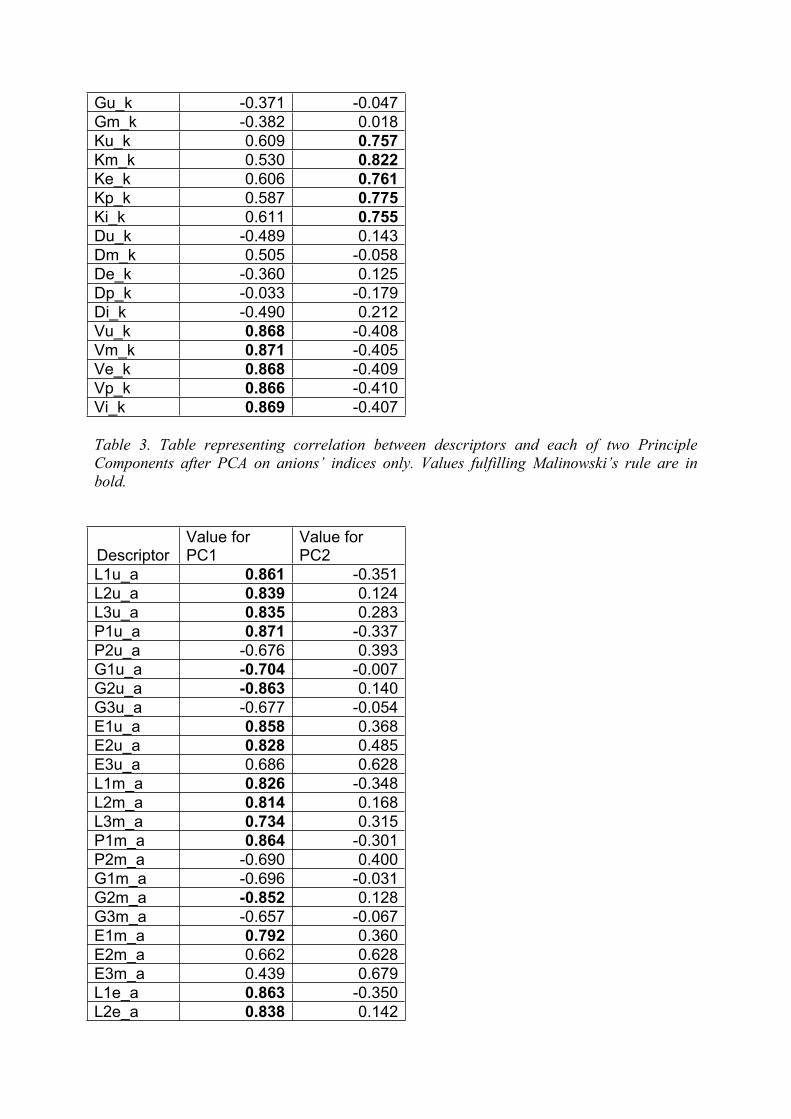
Gu_k -0.371 -0.047Gm_k -0.382 0.018Ku_k 0.609 0.757Km_k 0.530 0.822Ke_k 0.606 0.761Kp_k 0.587 0.775Ki_k 0.611 0.755Du_k -0.489 0.143Dm_k 0.505 -0.058De_k -0.360 0.125Dp_k -0.033 -0.179Di_k -0.490 0.212Vu_k 0.868 -0.408Vm_k 0.871 -0.405Ve_k 0.868 -0.409Vp_k 0.866 -0.410Vi_k 0.869 -0.407
Table 3. Table representing correlation between descriptors and each of two Principle Components after PCA on anions’ indices only. Values fulfilling Malinowski’s rule are in bold.
DescriptorValue for PC1
Value for PC2
L1u_a 0.861 -0.351L2u_a 0.839 0.124L3u_a 0.835 0.283P1u_a 0.871 -0.337P2u_a -0.676 0.393G1u_a -0.704 -0.007G2u_a -0.863 0.140G3u_a -0.677 -0.054E1u_a 0.858 0.368E2u_a 0.828 0.485E3u_a 0.686 0.628L1m_a 0.826 -0.348L2m_a 0.814 0.168L3m_a 0.734 0.315P1m_a 0.864 -0.301P2m_a -0.690 0.400G1m_a -0.696 -0.031G2m_a -0.852 0.128G3m_a -0.657 -0.067E1m_a 0.792 0.360E2m_a 0.662 0.628E3m_a 0.439 0.679L1e_a 0.863 -0.350L2e_a 0.838 0.142
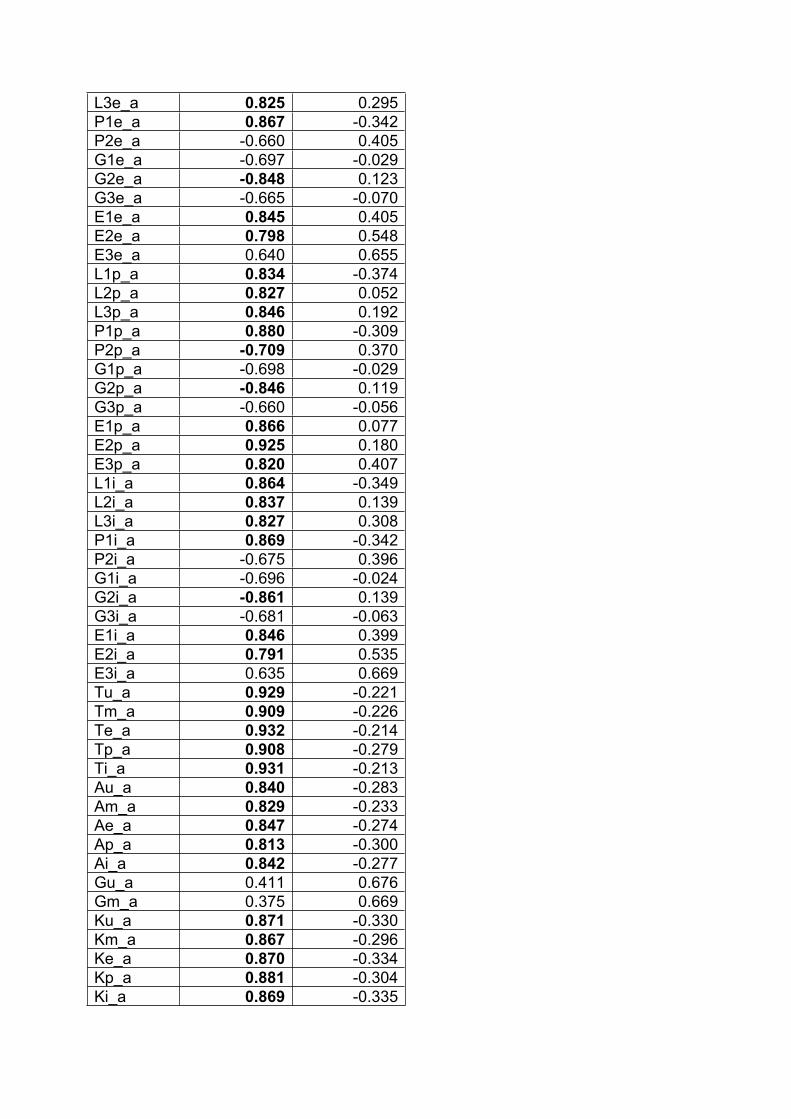
L3e_a 0.825 0.295P1e_a 0.867 -0.342P2e_a -0.660 0.405G1e_a -0.697 -0.029G2e_a -0.848 0.123G3e_a -0.665 -0.070E1e_a 0.845 0.405E2e_a 0.798 0.548E3e_a 0.640 0.655L1p_a 0.834 -0.374L2p_a 0.827 0.052L3p_a 0.846 0.192P1p_a 0.880 -0.309P2p_a -0.709 0.370G1p_a -0.698 -0.029G2p_a -0.846 0.119G3p_a -0.660 -0.056E1p_a 0.866 0.077E2p_a 0.925 0.180E3p_a 0.820 0.407L1i_a 0.864 -0.349L2i_a 0.837 0.139L3i_a 0.827 0.308P1i_a 0.869 -0.342P2i_a -0.675 0.396G1i_a -0.696 -0.024G2i_a -0.861 0.139G3i_a -0.681 -0.063E1i_a 0.846 0.399E2i_a 0.791 0.535E3i_a 0.635 0.669Tu_a 0.929 -0.221Tm_a 0.909 -0.226Te_a 0.932 -0.214Tp_a 0.908 -0.279Ti_a 0.931 -0.213Au_a 0.840 -0.283Am_a 0.829 -0.233Ae_a 0.847 -0.274Ap_a 0.813 -0.300Ai_a 0.842 -0.277Gu_a 0.411 0.676Gm_a 0.375 0.669Ku_a 0.871 -0.330Km_a 0.867 -0.296Ke_a 0.870 -0.334Kp_a 0.881 -0.304Ki_a 0.869 -0.335
Du_a 0.843 0.501Dm_a 0.752 0.596De_a 0.811 0.547Dp_a 0.931 0.183Di_a 0.810 0.547Vu_a 0.843 -0.262Vm_a 0.845 -0.227Ve_a 0.849 -0.254Vp_a 0.826 -0.286Vi_a 0.843 -0.257
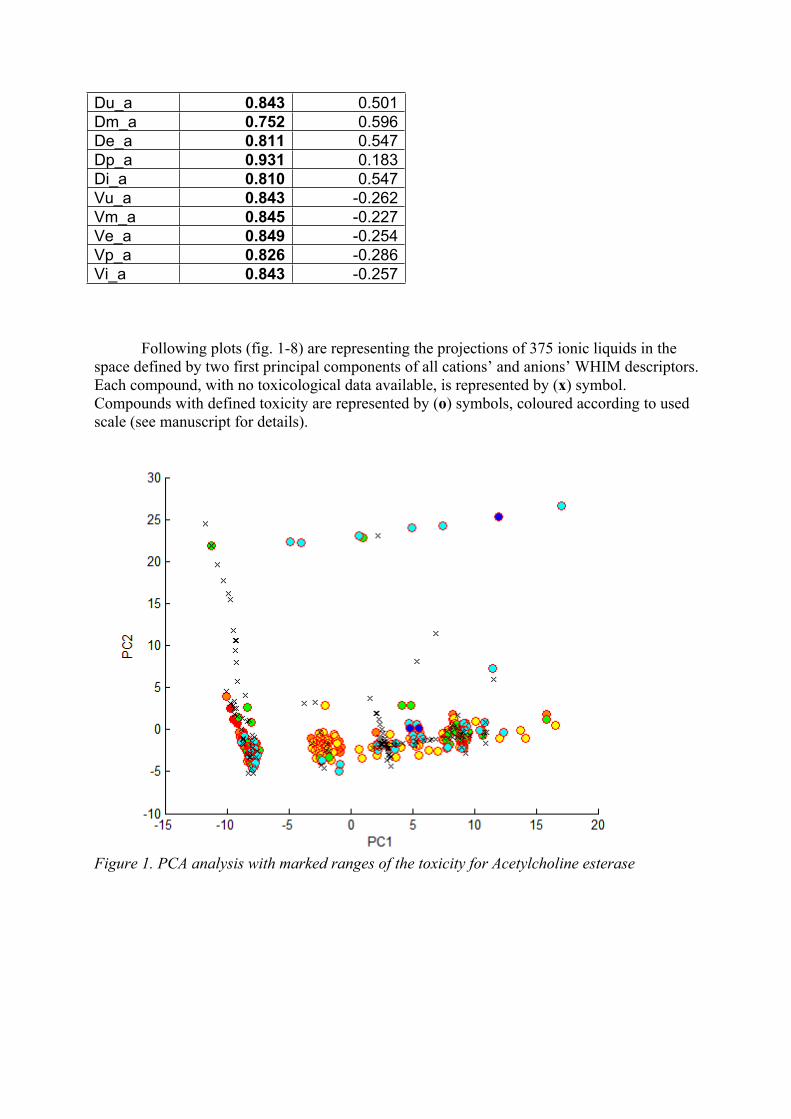
Following plots (fig. 1-8) are representing the projections of 375 ionic liquids in the space defined by two first principal components of all cations’ and anions’ WHIM descriptors. Each compound, with no toxicological data available, is represented by (x) symbol. Compounds with defined toxicity are represented by (o) symbols, coloured according to used scale (see manuscript for details).
Figure 1. PCA analysis with marked ranges of the toxicity for Acetylcholine esterase
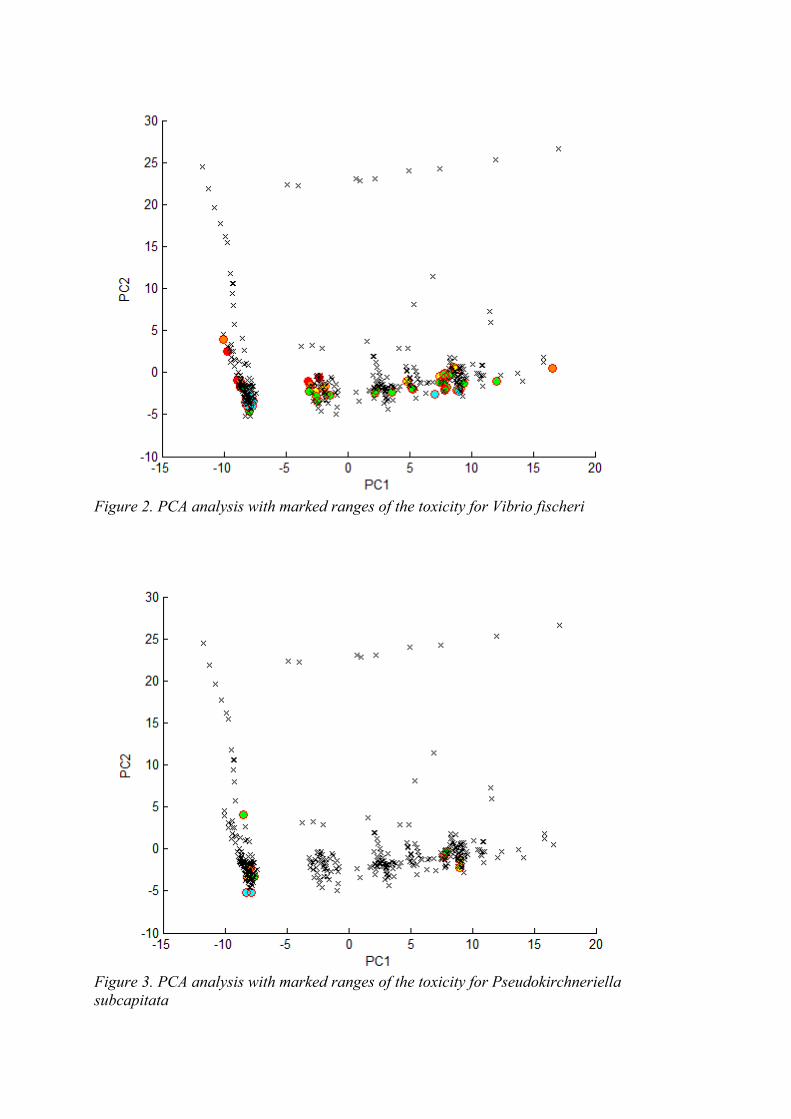
Figure 2. PCA analysis with marked ranges of the toxicity for Vibrio fischeri
Figure 3. PCA analysis with marked ranges of the toxicity for Pseudokirchneriella subcapitata
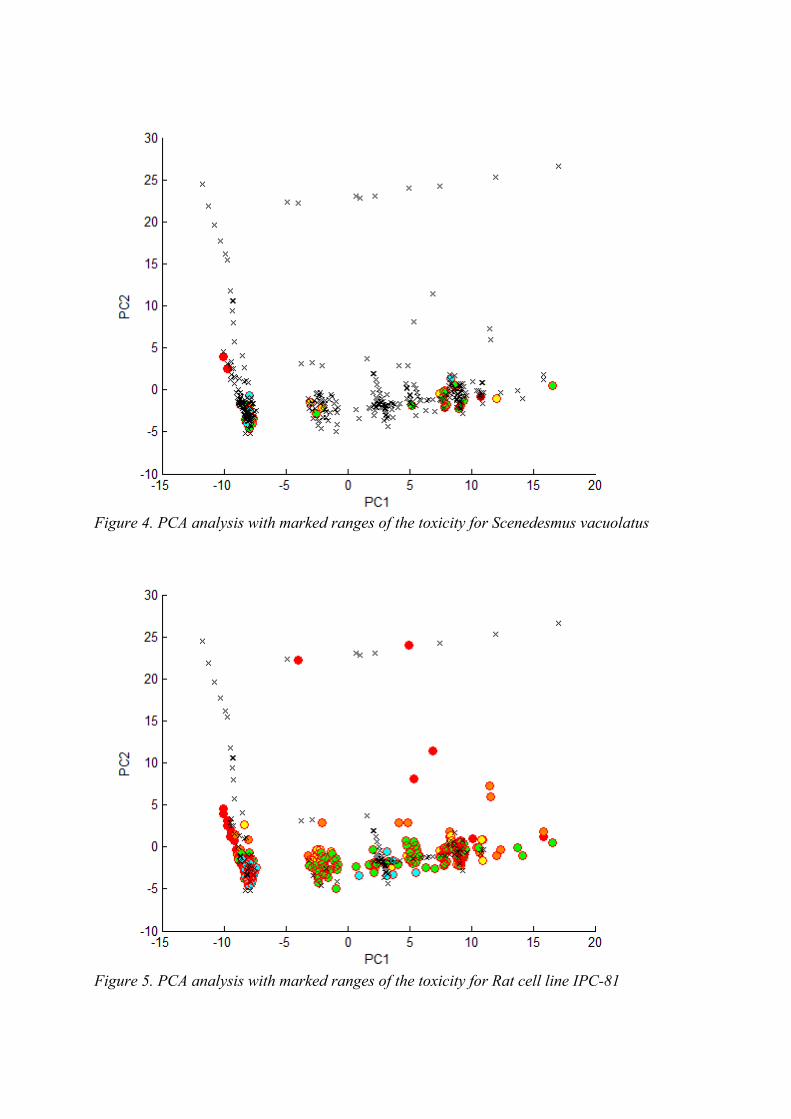
Figure 4. PCA analysis with marked ranges of the toxicity for Scenedesmus vacuolatus
Figure 5. PCA analysis with marked ranges of the toxicity for Rat cell line IPC-81
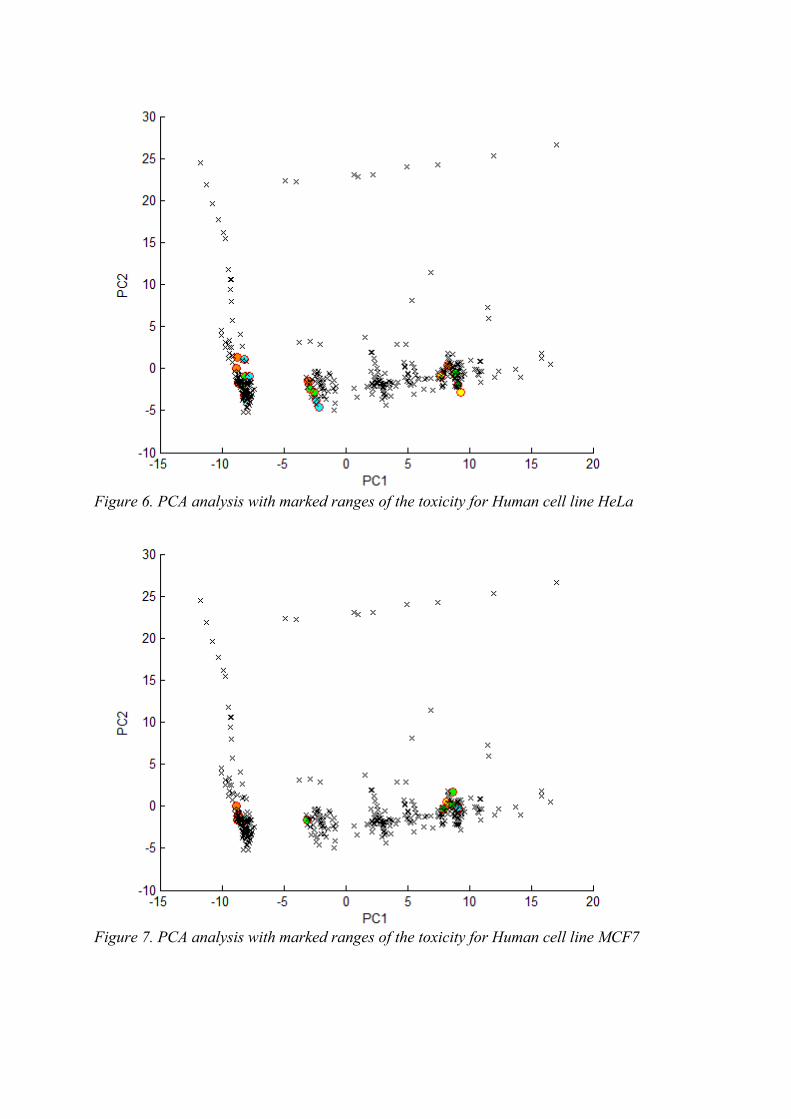
Figure 6. PCA analysis with marked ranges of the toxicity for Human cell line HeLa
Figure 7. PCA analysis with marked ranges of the toxicity for Human cell line MCF7
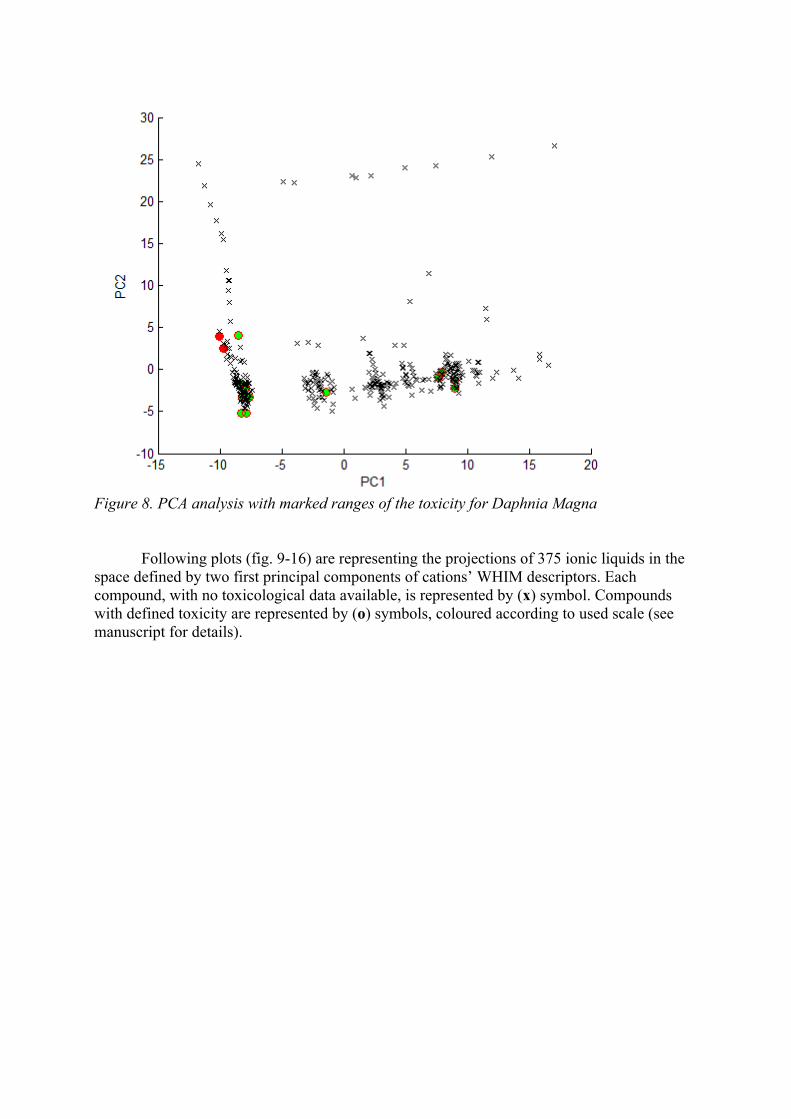
Figure 8. PCA analysis with marked ranges of the toxicity for Daphnia Magna
Following plots (fig. 9-16) are representing the projections of 375 ionic liquids in the space defined by two first principal components of cations’ WHIM descriptors. Each compound, with no toxicological data available, is represented by (x) symbol. Compounds with defined toxicity are represented by (o) symbols, coloured according to used scale (see manuscript for details).
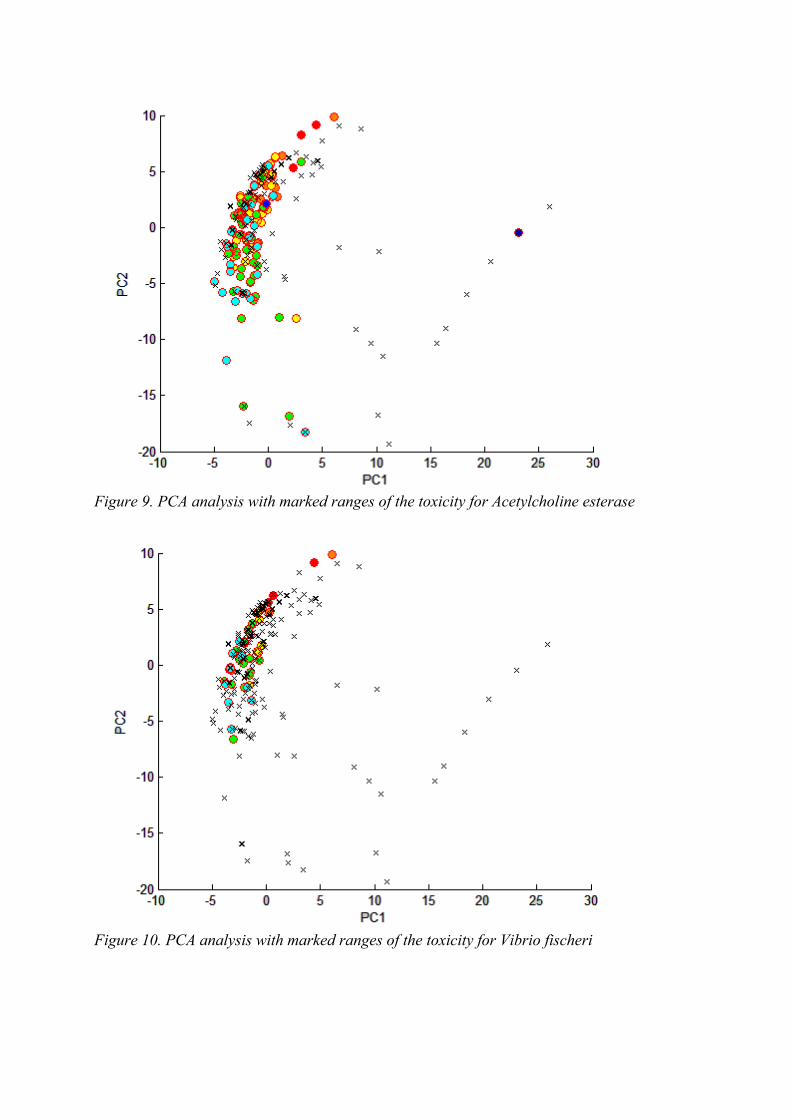
Figure 9. PCA analysis with marked ranges of the toxicity for Acetylcholine esterase
Figure 10. PCA analysis with marked ranges of the toxicity for Vibrio fischeri
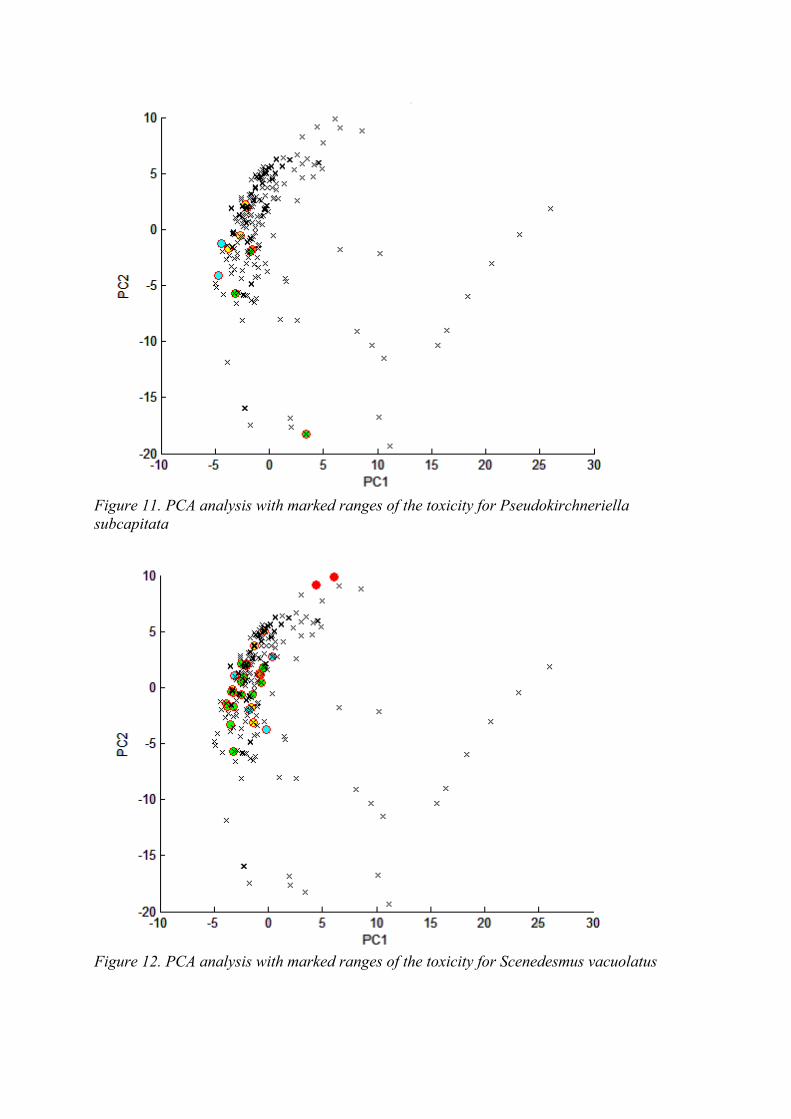
Figure 11. PCA analysis with marked ranges of the toxicity for Pseudokirchneriella subcapitata
Figure 12. PCA analysis with marked ranges of the toxicity for Scenedesmus vacuolatus
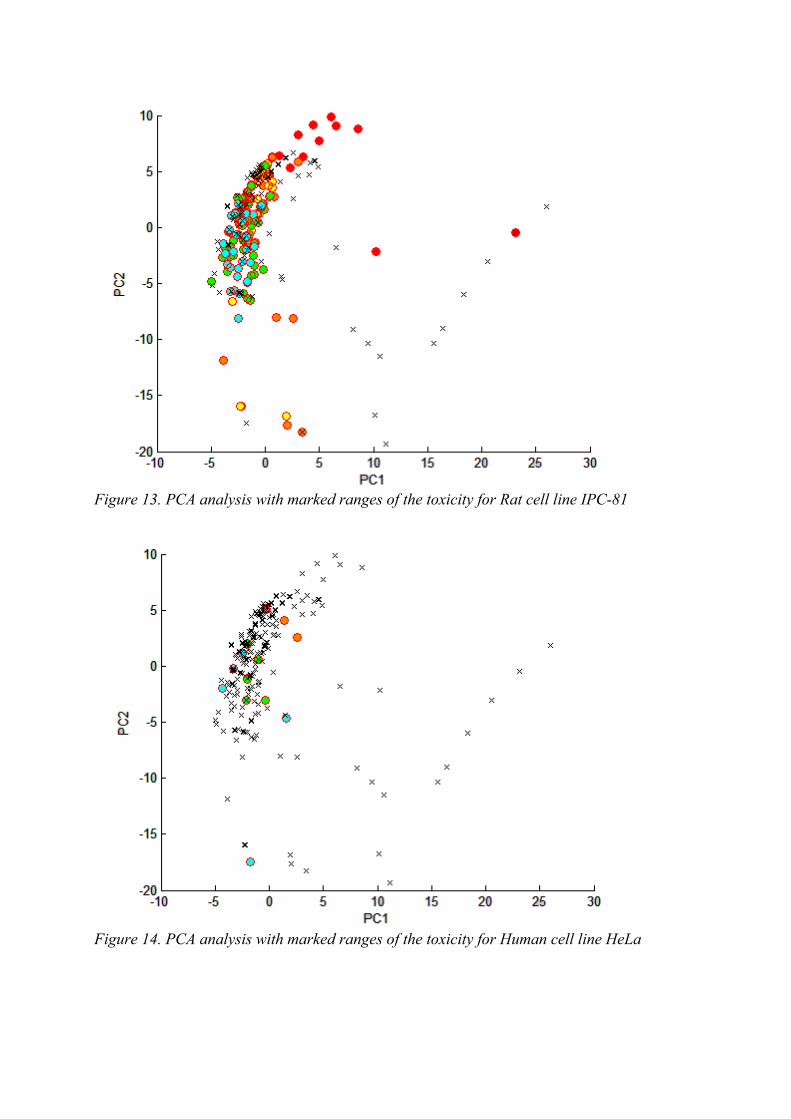
Figure 13. PCA analysis with marked ranges of the toxicity for Rat cell line IPC-81
Figure 14. PCA analysis with marked ranges of the toxicity for Human cell line HeLa
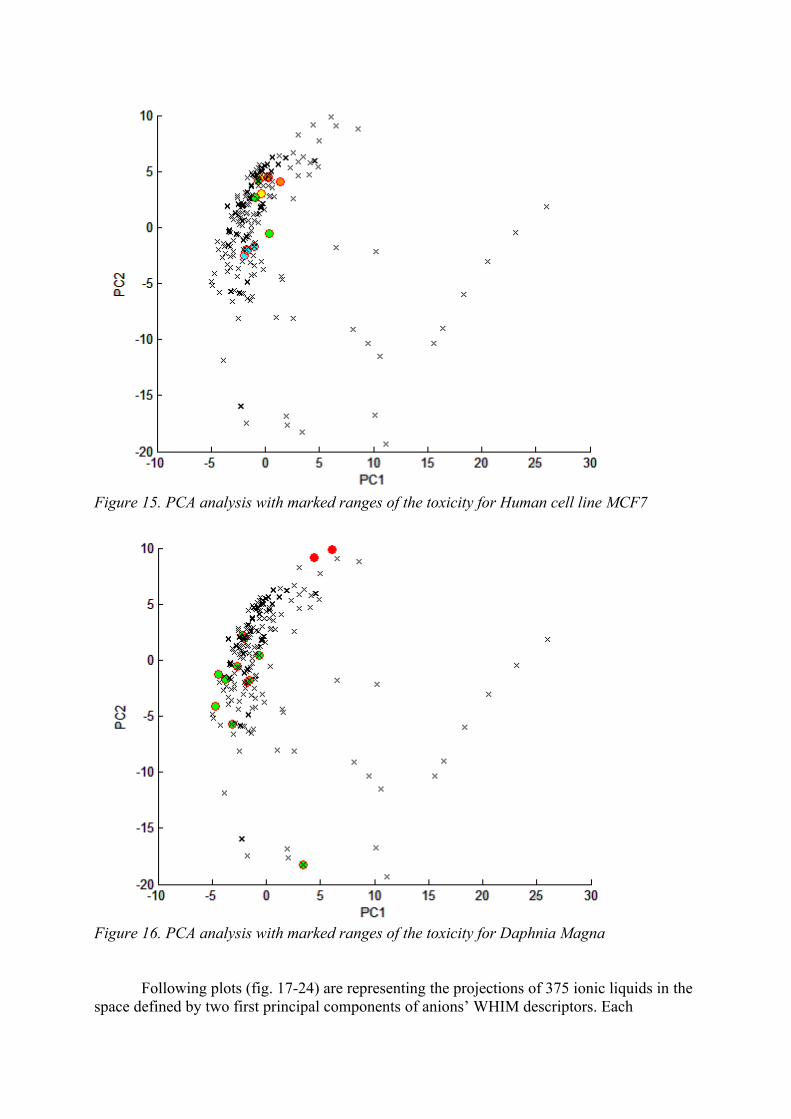
Figure 15. PCA analysis with marked ranges of the toxicity for Human cell line MCF7
Figure 16. PCA analysis with marked ranges of the toxicity for Daphnia Magna
Following plots (fig. 17-24) are representing the projections of 375 ionic liquids in the space defined by two first principal components of anions’ WHIM descriptors. Each
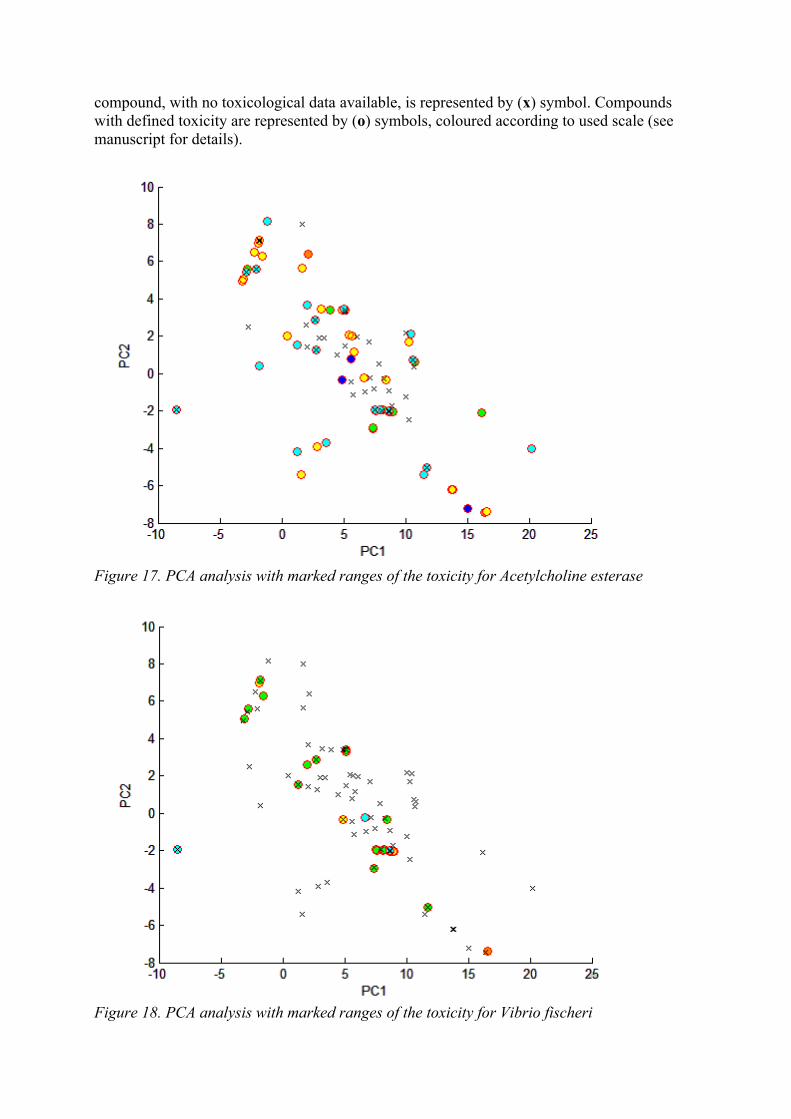
compound, with no toxicological data available, is represented by (x) symbol. Compounds with defined toxicity are represented by (o) symbols, coloured according to used scale (see manuscript for details).
Figure 17. PCA analysis with marked ranges of the toxicity for Acetylcholine esterase
Figure 18. PCA analysis with marked ranges of the toxicity for Vibrio fischeri
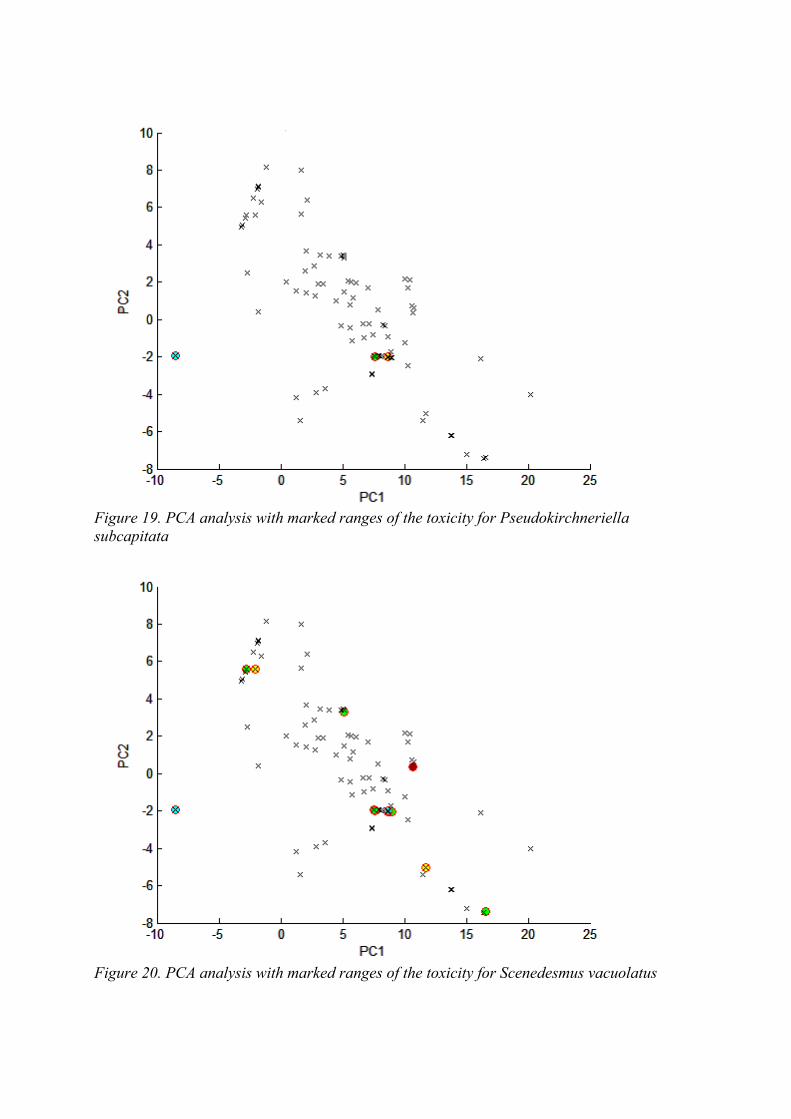
Figure 19. PCA analysis with marked ranges of the toxicity for Pseudokirchneriella subcapitata
Figure 20. PCA analysis with marked ranges of the toxicity for Scenedesmus vacuolatus
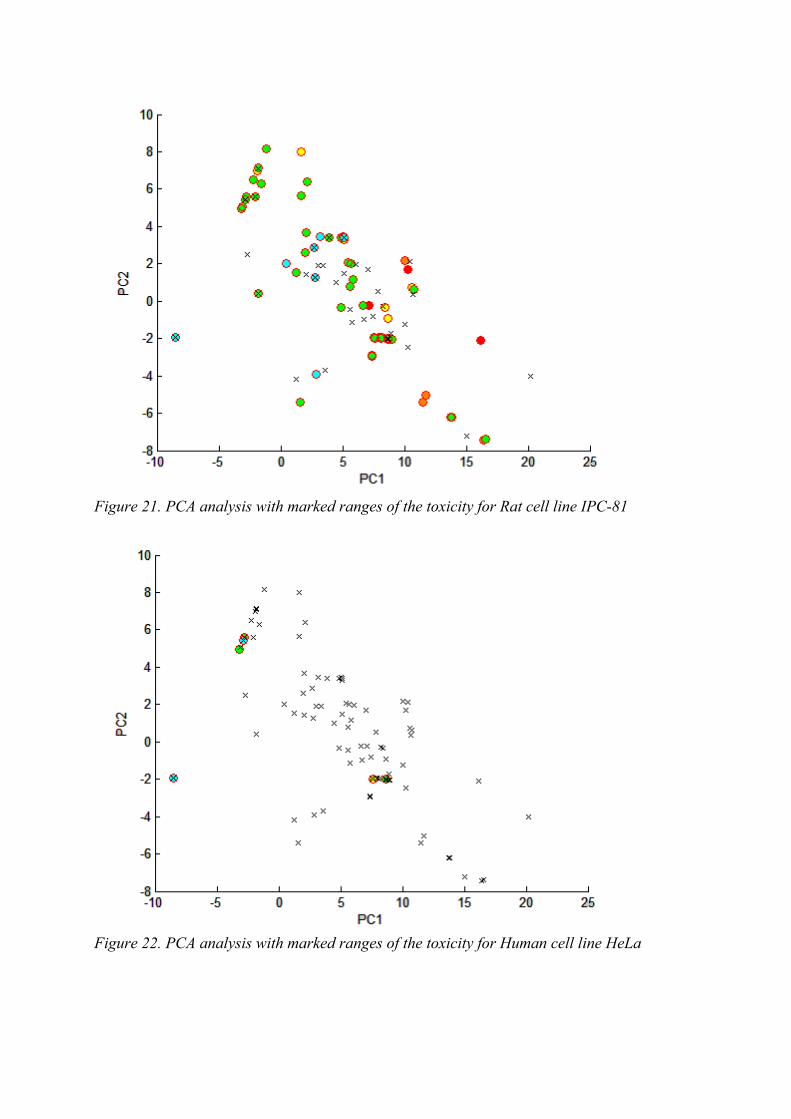
Figure 21. PCA analysis with marked ranges of the toxicity for Rat cell line IPC-81
Figure 22. PCA analysis with marked ranges of the toxicity for Human cell line HeLa
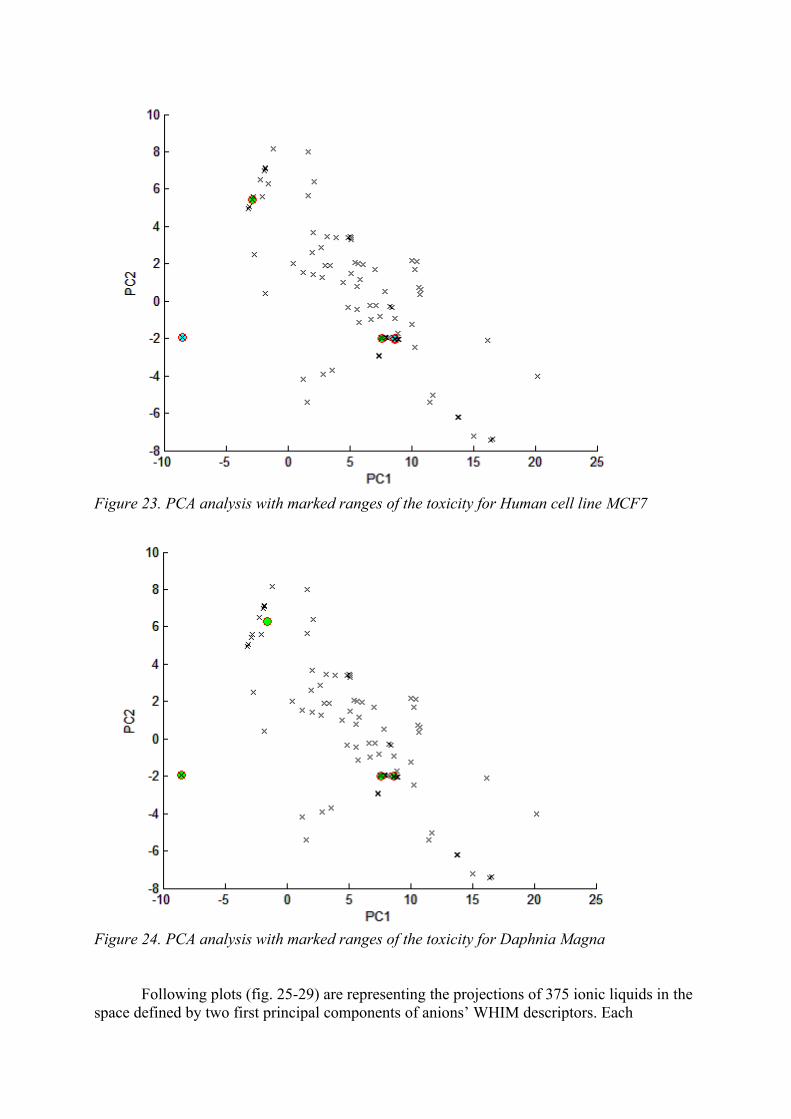
Figure 23. PCA analysis with marked ranges of the toxicity for Human cell line MCF7
Figure 24. PCA analysis with marked ranges of the toxicity for Daphnia Magna
Following plots (fig. 25-29) are representing the projections of 375 ionic liquids in the space defined by two first principal components of anions’ WHIM descriptors. Each
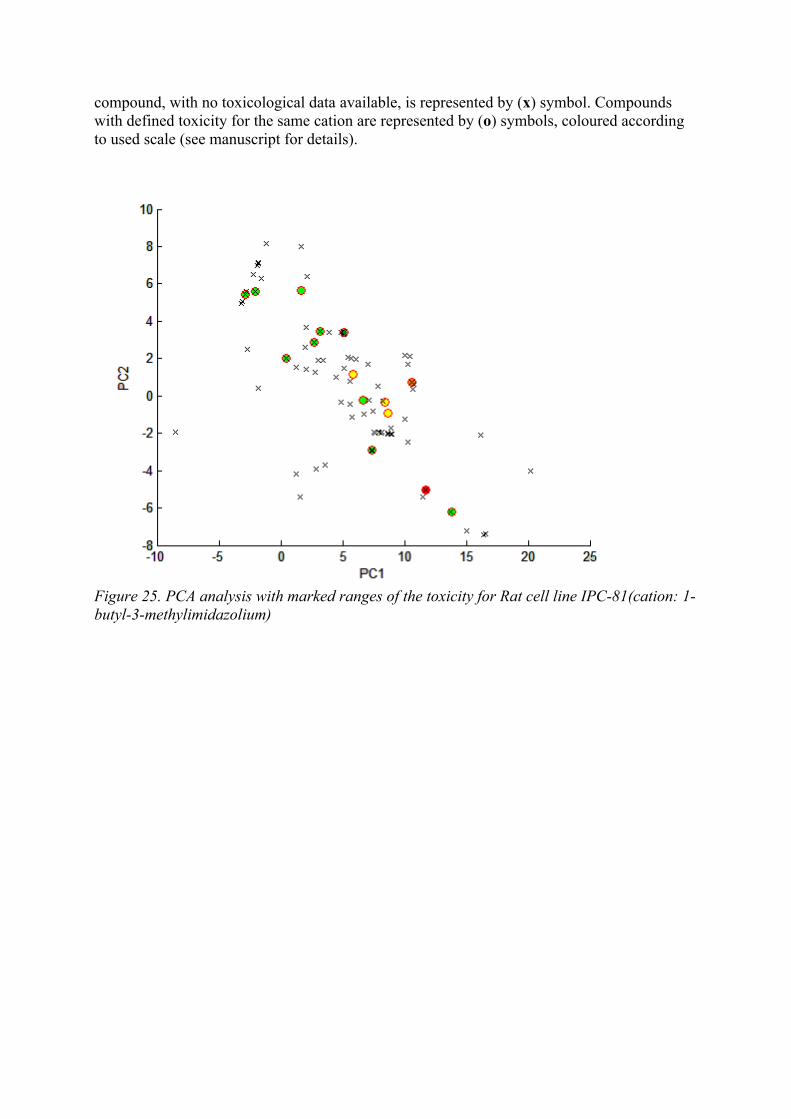
compound, with no toxicological data available, is represented by (x) symbol. Compounds with defined toxicity for the same cation are represented by (o) symbols, coloured according to used scale (see manuscript for details).
Figure 25. PCA analysis with marked ranges of the toxicity for Rat cell line IPC-81(cation: 1-butyl-3-methylimidazolium)
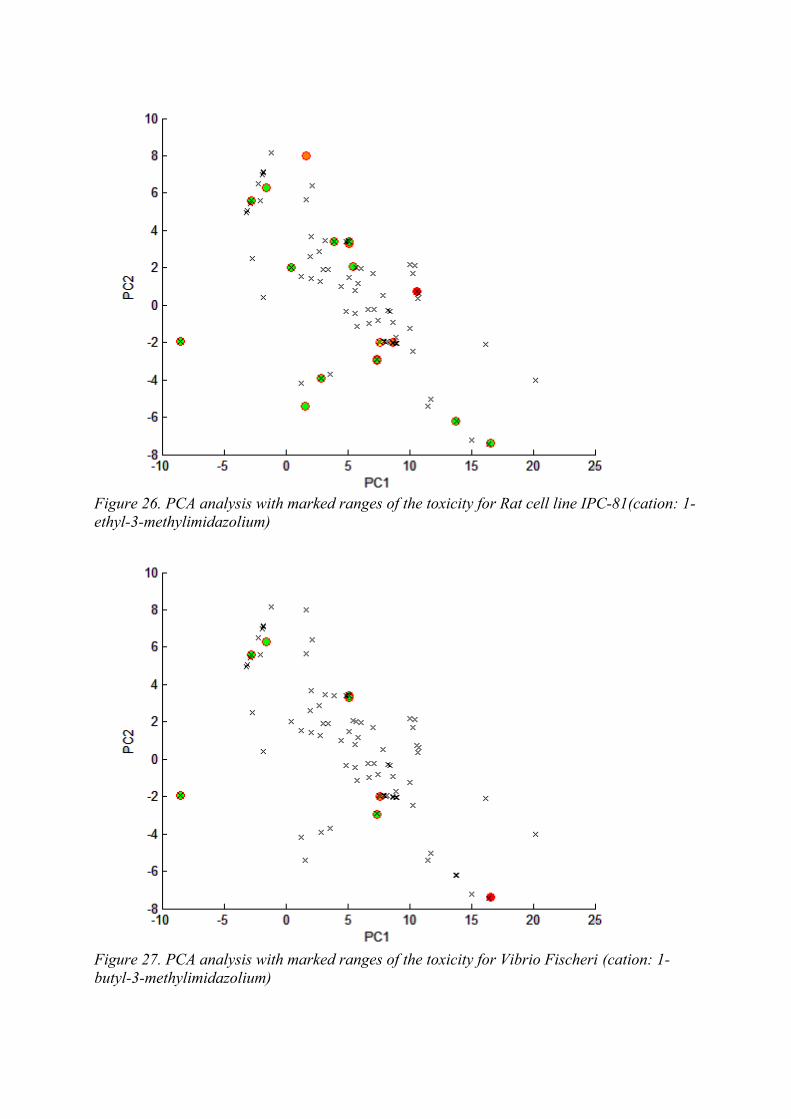
Figure 26. PCA analysis with marked ranges of the toxicity for Rat cell line IPC-81(cation: 1-ethyl-3-methylimidazolium)
Figure 27. PCA analysis with marked ranges of the toxicity for Vibrio Fischeri (cation: 1-butyl-3-methylimidazolium)
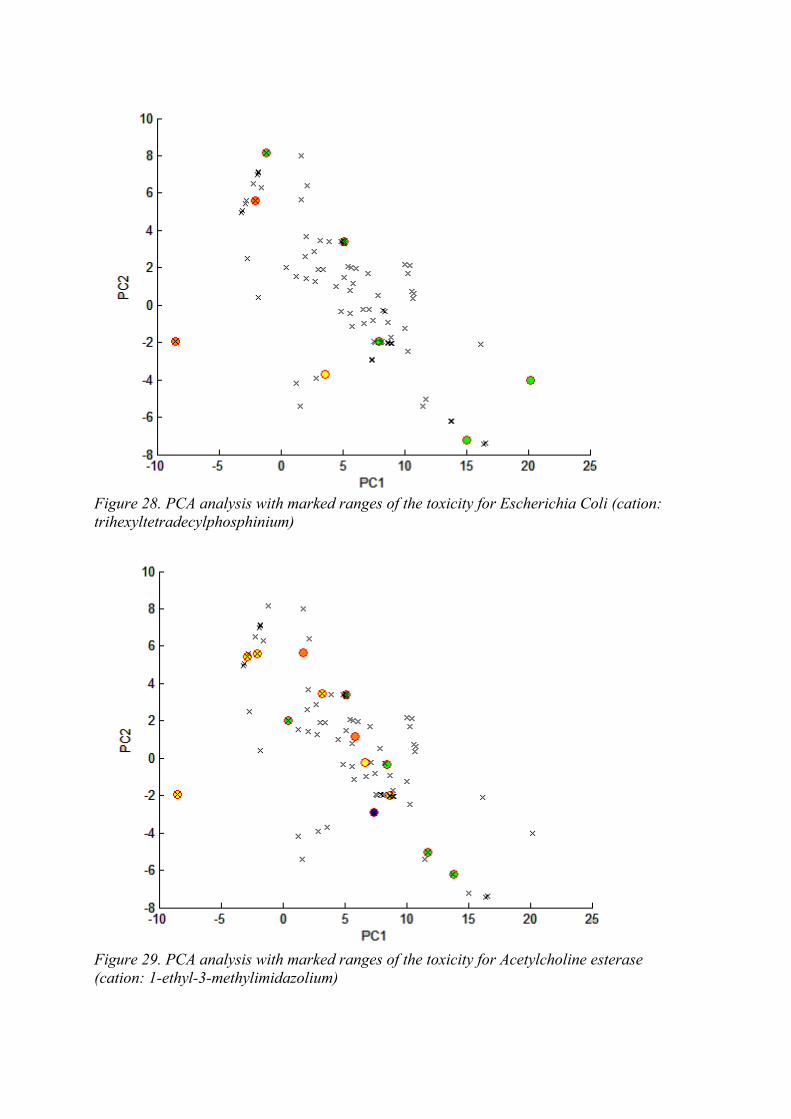
Figure 28. PCA analysis with marked ranges of the toxicity for Escherichia Coli (cation: trihexyltetradecylphosphinium)
Figure 29. PCA analysis with marked ranges of the toxicity for Acetylcholine esterase(cation: 1-ethyl-3-methylimidazolium)