list of appendices - leeds beckett university · figure 1.2 temporary sealing prior to...
TRANSCRIPT

Stamford Brook – Deliverable 6: APPENDICES Web version - July 2007
Page 1 of 125
List of Appendices Appendix 1: Pressurisation Test of Bryant Plot 116..................................................................................... 2 Appendix 2: Pressurisation Test of Bryant Plot 117..................................................................................... 9 Appendix 3: Pressurisation Test of Redrow Plot 110................................................................................. 15 Appendix 4: Pressurisation Test of Redrow Plot 111................................................................................. 22 Appendix 5: Pressurisation Test of Redrow Plot 116................................................................................. 29 Appendix 6: Pressurisation Re-test of Redrow Plot 116 ............................................................................ 39 Appendix 7: Pressurisation Test of Redrow Plot 117................................................................................. 42 Appendix 8: Pressurisation Re-test of Bryant Plot 116 .............................................................................. 54 Appendix 9: Pressurisation Test of Bryant Plot 119................................................................................... 62 Appendix 10: Pressurisation Test of Redrow Plot 120............................................................................... 74 Appendix 11: Pressurisation Test of Bryant Plot 121................................................................................. 84 Appendix 12: Pressurisation Re-test of Redrow Plot 110 .......................................................................... 96 Appendix 13: Pressurisation Re-test of Redrow Plot 111 ........................................................................ 104 Appendix 14: Pressurisation Re-test of Bryant Plot 121 .......................................................................... 113

Stamford Brook – Deliverable 6: APPENDIX 1 Web version - July 2007
Page 2 of 125
Appendix 1: Pressurisation Test of Bryant Plot 116
Figure 1.1 Bryant Plot 116
Dwelling Details 1. Plot 116 (figure 1.1) was originally selected for the second phase coheating tests investigation
(Deliverable 7, Wingfield et al. 2007), but has also been included in the detailed airtightness study. It is a Chatsworth house type, 3-bedroom, semi-detached dwelling, built to the standard specification for Bryant at Stamford Brook. This pressurisation test was conducted immediately prior to the coheating test being carried out.
2. The pressure test was conducted in accordance with ATTMA’s Technical Standard 1: Measuring Air Permeability of Building Envelopes (ATTMA, 2006) with the dwelling not yet fully completed; hence a number of details required temporary sealing prior to the test being performed. Although much of the air barrier was complete at the time of the test, the patio doors had no handles fitted and was not fully draught-stripped, the loft hatch and MEV system had not been fully installed (figure 1.2), there were also many open ends of plumbing pipework; all of which had to be temporarily sealed for the pressure test to take place.
Figure 1.2 Temporary sealing prior to pressurisation test
Pressure Test Results 3. The pressurisation test was performed on Bryant Plot 116 by the Leeds Met research team on 22nd
January 2007. The fan system used for the test was an Energy Conservatory Minneapolis Model 3 Blower Door equipped with a DG700 digital pressure gauge. A summary of the results are contained within Table 1.1.

Stamford Brook – Deliverable 6: APPENDIX 1 Web version - July 2007
Table 1.1 Pressure test results for Bryant plot 116, 22nd January 2007.
Pressurisation Depressurisation Plot ACH50 Equivalent leakage area
(m2 @ 10Pa)
Mean Air Permeability
(m3/(h.m2) @ 50Pa) r2 coefficient of determination
r2 coefficient of determination
Permeability (m3/(h.m2) @ 50Pa)
Permeability (m3/(h.m2) @ 50Pa)
B116 2.84 0.975 2.67 0.992 2.75 3.04 0.022
4. The calculated mean air permeability for the dwelling was 2.75 m3/(h.m2) @ 50 Pa, comfortably
below the target of 5 m3/(h.m2) @ 50 Pa. This compares favourably with recent test data from the site and is comparable with results obtained from similar dwellings tested in February 2005.
Leakage Detection 5. Leakage detection was performed under dwelling pressurisation, at approximately 75 Pa above the
external pressure, using a handheld smoke puffer and recorded photographically. The main leakage paths observed during the test are listed below.
6. Direct leakage paths were observed at the bay window in the lounge. A number of these paths are expected to be sealed by the subsequent application of the decorators’ caulking, however there were also leakage paths through gaps between individual elements of the bay window and at the sills and threshold which may still remain upon dwelling completion (figure 1.3).
7. Additional leakage paths were detected around other windows, mainly at or around the window sills. Figure 1.4 illustrates air leakage at the sill of the bathroom window, which again may get sealed internally when it is tiled, similar typical leakage points observed around other window sills may also get sealed internally upon decoration.
8. Air leakage was detected into a number of interconnected voids around the stairs. Some of these points of leakage are expected to be sealed when as the dwelling is finished, but the linking of these voids will allow movement of air between voids creating complex leakage paths (figure 1.5).
9. Ground floor electrical service penetrations generally performed well, but some still provided further points of air leakage which varied greatly in severity; from minor air flows through gaps around sockets and switches to more substantial flows through open pattress boxes and holes for concealed lighting in the kitchen, most severe was the air movement around the electrical consumer unit (figure 1.6). Once again many of these leakage points will be sealed at the surface when decorating or in the snagging process. Significantly, no air leakage was detected around ground floor ceiling-mounted light fixings.
10. Ground floor plumbing penetrations were not well sealed and allowed air movement around them. As these are more likely to be hidden from view than the electrical penetrations it is more likely that sealing around them may remain omitted upon dwelling completion. With the examples in Figure 1.7, pipework for the boiler will subsequently be boxed in, radiator pipes are not in direct view and the soil pipe will be obscured by the WC.
11. Minor air movement was observed around electrical penetrations in all of the first floor rooms (figure 1.8), the only two areas of more significant leakage were through the open pattress in the cylinder cupboard and through a hole made above the shaver socket (presumably for access) which had not been filled.
12. First floor plumbing penetrations were amongst the worst performing details in this plot (figure 1.9). None of these appeared to be sealed around satisfactorily; comparatively large amounts of airflow were observed in the bathroom and en-suite where the penetrations led into boxed-in voids for the soil/ventilation pipes.
13. Very little air movement was observed at junctions between the floors and walls as beads of sealant had be applied effectively, air leakage was only detected around a number of unfinished or inadequately sealed junctions (figure 1.10).
Page 3 of 125

Stamford Brook – Deliverable 6: APPENDIX 1 Web version - July 2007
Figure 1.3 Air leakage around the bay window.
Figure 1.4 Bathroom, bedroom and kitchen sills.
Page 4 of 125

Stamford Brook – Deliverable 6: APPENDIX 1 Web version - July 2007
Figure 1.5 Air leakage around the staircase.
Figure 1.6 Ground floor electrical service penetrations.
Figure 1.7 Ground floor plumbing penetrations.
Page 5 of 125

Stamford Brook – Deliverable 6: APPENDIX 1 Web version - July 2007
Figure 1.8 First floor electrical penetrations in all 3 bedrooms, landing, en-suite, cylinder cupboard and
bathroom.
Figure 1.9 First floor plumbing penetrations in the bathroom, cylinder cupboard and en-suite.
Page 6 of 125

Stamford Brook – Deliverable 6: APPENDIX 1 Web version - July 2007
Figure 1.10 Air movement around skirting boards in the downstairs WC and landing, around architrave on
the first floor in bedrooms and bathroom, and around the cylinder cupboard floor.
Page 7 of 125

Stamford Brook – Deliverable 6: APPENDIX 1 Web version - July 2007
Page 8 of 125
Pressure Test Details 0.705643636 3.506049307
0.031450959 0.110974815
0.99211649 0.037406406
0.641231592 3.8182235070.05146285 0.179191833
0.974882855 0.0616709560.705643636
date: Version 15a 13 October 2006
RESULTS:Mean Flow AT 50Pa = 552.61 m3/h
ACH50 = 3.04 achAir Permeability at 50 Pa = 2.75 m/hEquivalent Leakage Area = 0.022 m2 at 10 Pa
OK 534.92 2.67 2.95OKOKOKOKOK
OK 570.30 2.84 3.14OKOKOKOKOK
Note: ENSURE THAT FLOW SETTINGS ARE IN M3/HR - When using the DG700 gauge you do not need to input a baseline pressure difference as this is calculated by the gauge and the readings adjusted automatically
3.506049307 33.31638462test house address: 0.641231592company: 3.818223507 45.52326468house type: 6tester: 6test reference number:outdoor temp (°C) 7.8 °Cindoor temp (°C) 7.5 °Coutdoor humidity (%rh) 55.8 %rhindoor humidity (%rh) 64 %rhoutdoor barometric pressure 1020 mbar or hPa kg/m3indoor barometric pressure 1020 mbar or hPa kg/m3temperature corr. fact. depress. 1.001temperature corr. fact. press. 0.999wind speed (m/s):baseline pressure diff (Pa) (+/-) Pahouse width: 4.61 mhouse depth: 7.738 mhouse height: 5 mfloor area: 37.02 m2volume: 181.53 m3envelope area including floor: 200.69 m2Pressure Difference for ELA 10 Pa
DEPRESSURISATION RING (O=open or A,B,C,D,E)
MEASURED FAN PRESSURE (Pa)
MEASURED FLOW (m3/h)
FLOW RANGE OK FOR SELECTED RING?
Adjusted Pressure (Pa)
Ln delta P Ln Q Q50 Calculated Flow at 50Pa (m3/h)
Permeability Depress Only (m3/hr/m2)
ACH Depress Only (ach)
Approx 60 Pa b 63.7 613 63.7 4.154185 6.419434Approx 50 Pa b 51.3 522 51.3 3.937691 6.258737 r2 0.992Approx 40 Pa c 38.5 447 38.5 3.650658 6.103628 C 0.009 m3/sApprox 30 Pa c 30 388 30 3.401197 5.962074 n 0.706Approx 20 Pa c 22.3 297 22.3 3.104587 5.694801 C (corrected) 0.009 m3/sApprox 10 Pa c 15.2 220 15.2 2.721295 5.394696PRESSURISATION
RING (O=open or A,B,C,D,E)
MEASURED FAN PRESSURE (Pa)
MEASURED FLOW (m3/h)
FLOW RANGE OK FOR SELECTED RING?
Adjusted Pressure (Pa)
Ln P Ln Q Q50 Calculated Flow at 50Pa (m3/h)
Permeability Press Only (m3/hr/m2)
ACH Press Only (ach)
Approx 60 Pa b 60.7 619 60.7 4.105944 6.427036Approx 50 Pa b 49.5 528 49.5 3.901973 6.268027 r2 0.975Approx 40 Pa c 38.2 502 38.2 3.642836 6.217531 C 0.013 m3/sApprox 30 Pa c 28.2 407 28.2 3.339322 6.007744 n 0.641Approx 20 Pa c 19.3 314 19.3 2.960105 5.748324 C (corrected) 0.013 m3/sApprox 10 Pa c 15.4 246 15.4 2.734368 5.504263
Calculated Outdoor Air DensityCalculated Indoor Air Density
description of main construction details:
1.271.27
Model 3 with DG700Blower Door & Gauge Used
MINNEAPOLIS BLOWER DOOR DATA INPUT AND CALCULATION22/01/2007plot 116 stamford brookbryantchatsworthdm-s jw
DEPRESSURISATION
5.2
5.4
5.6
5.8
6
6.2
6.4
6.6
2 3 4 5
Ln delta P
Ln Q
PRESSURISATION
5.4
5.6
5.8
6
6.2
6.4
6.6
2 3 4 5
Ln delta P
Ln Q
Depressurisation
0100200300400500600700
0 25 50 75 100delta P
Q
Pressurisation
0100200300400500600700
0 25 50 75 100delta P
Q

Stamford Brook – Deliverable 6: APPENDIX 2 Web version - July 2007
Page 9 of 125
Appendix 2: Pressurisation Test of Bryant Plot 117
Figure 2.1 Bryant Plot 117
Dwelling Details 1. Plot 117 (figure 2.1) was originally selected for the second phase coheating test investigation
(Deliverable 7, Wingfield et al. 2007), but has also been included in the detailed airtightness study. It is a Chatsworth house type, 3-bedroom, semi-detached dwelling, built to the standard specification for Bryant at Stamford Brook. This pressurisation test was conducted immediately prior to the coheating test being carried out.
2. The pressure test was conducted in accordance with ATTMA’s Technical Standard 1: Measuring Air Permeability of Building Envelopes (ATTMA, 2006) with the dwelling not yet fully completed; temporary sealing prior to the test being performed was required around the ends of open pipework and where the patio door handle and lock had yet to be fitted, much of the secondary internal sealing (around penetrations, at junctions and caulking) had yet to be applied.
Pressure Test Results 3. The pressurisation test was performed on Bryant Plot 117 by the Leeds Met research team on 25th
January 2007. The fan system used for the test was an Energy Conservatory Minneapolis Model 3 Blower Door equipped with a DG700 digital pressure gauge. The results are contained within Table 2.1.
Table 2.1 Pressure test results for Bryant plot 117, 25th January 2007.
Pressurisation Depressurisation Mean Air Permeability
(m3/(h.m2) @ 50Pa)
Plot ACH50 Equivalent leakage area
(m2 @ 10Pa) r2 coefficient of determination
r2 coefficient of determination
Permeability (m3/(h.m2) @ 50Pa)
Permeability (m3/(h.m2) @ 50Pa)
B117 3.39 1.000 3.57 1.000 3.31 3.66 0.026
4. The calculated mean air permeability for the dwelling was 3.31 m3/(h.m2) @ 50 Pa, well inside the
target figure for the site of 5 m3/(h.m2) @ 50 Pa. This is a similar level of airtightness to that of plot B116, comparing favourably with recent test data from the site and also comparable with results obtained from similar dwellings tested in February 2005.

Stamford Brook – Deliverable 6: APPENDIX 2 Web version - July 2007
Leakage Detection 5. Leakage detection was performed under dwelling pressurisation, at approximately 75 Pa above the
external pressure, using a handheld smoke puffer and recorded photographically. The main leakage paths observed during the test are listed below.
6. As in plot B116, direct leakage paths were observed at the bay window in the lounge. A number of these paths are expected to be sealed by the subsequent application of the decorators’ caulking, however there were also leakage paths through gaps between individual elements of the bay window and at the sills and threshold which may still remain upon dwelling completion (figure 2.2).
7. Air leakage was detected into a number of interconnected voids around the stairs. Some of these points of leakage are expected to be sealed when as the dwelling is finished, but the linking of these voids will allow movement of air between voids creating complex leakage paths (figure 2.3).
8. Ground floor electrical service penetrations again generally performed well, with air leakage observed through open pattress boxes and holes for concealed lighting in the kitchen and around the electrical consumer unit (figure 2.4).
9. As with plot B116, ground floor plumbing penetrations were generally not well sealed and allowed air movement around them (figure 2.5).
10. Minor air movement was observed around many electrical penetrations on the first floor, more significant leakage was detected through the open pattress in the cylinder cupboard and around the en-suite shaver socket (figure 2.6). Air leakage into the loft space was identified around a number of electrical penetrations through the ceiling, paths which were not observed in plot B116.
11. First floor plumbing penetrations were again amongst the worst performing details in this plot (figure 2.7). None of these appeared to be sealed around satisfactorily, air movement being observed around radiator pattress boxes, soil and waste pipes, and in the cylinder cupboard both through the floor and directly into the loft space around the ventilation ducting.
12. Unlike plot B116, air movement was observed at junctions between the ground floor and walls around the top of the skirting boards (figure 2.8), this was most noticeable at the corners of external walls.
13. The first floor room perimeters had no sealant applied and air movement was detected underneath the skirting boards and also over the skirting in room corners. This was distinctly more severe on external and party walls than on internal partitions (figure 2.9).
14. Air leakage was also detected around a number of unfinished or inadequately sealed junctions on the first floor (figure 2.10).
Page 10 of 125

Stamford Brook – Deliverable 6: APPENDIX 2 Web version - July 2007
Figure 2.3 Air leakage around the staircase.
Figure 2.4 Ground floor electrical penetrations.
Page 11 of 125

Stamford Brook – Deliverable 6: APPENDIX 2 Web version - July 2007
Figure 2.5 Ground floor plumbing penetrations.
Figure 2.6 First floor electrical penetrations.
Figure 2.7 First floor plumbing penetrations
Figure 2.8 Ground floor external wall corners.
Page 12 of 125

Stamford Brook – Deliverable 6: APPENDIX 2 Web version - July 2007
Figure 2.9 First floor wall junctions
Figure 2.10 Air movement through unsealed junctions on the first floor
Page 13 of 125

Stamford Brook – Deliverable 6: APPENDIX 2 Web version - July 2007
Page 14 of 125
Pressure Test Details 0.675465475 3.803276603
0.007269986 0.0255026
0.999536852 0.009483942
0.693764411 3.7840686420.004792337 0.0167106410.999809169 0.0065361790.675465475
date: Version 15a 13 October 2006
RESULTS:Mean Flow AT 50Pa = 663.83 m3/h
ACH50 = 3.66 achAir Permeability at 50 Pa = 3.31 m/hEquivalent Leakage Area = 0.026 m2 at 10 Pa
OK 647.73 3.23 3.57OKOK
OUT OF RANGEOKOK
OK 679.93 3.39 3.75OKOK
OUT OF RANGEOKOK
Note: ENSURE THAT FLOW SETTINGS ARE IN M3/HR - When using the DG700 gauge you do not need to input a baseline pressure difference as this is calculated by the gauge and the readings adjusted automatically
3.803276603 44.84789275test house address: 0.693764411company: 3.784068642 43.99467668house type: 6tester: 6test reference number:outdoor temp (°C) 2 °Cindoor temp (°C) 4 °Coutdoor humidity (%rh) 50 %rhindoor humidity (%rh) 65 %rhoutdoor barometric pressure 1030 mbar or hPa kg/m3indoor barometric pressure 1030 mbar or hPa kg/m3temperature corr. fact. depress. 0.993temperature corr. fact. press. 1.007wind speed (m/s): 0baseline pressure diff (Pa) (+/-) Pahouse width: 4.61 mhouse depth: 7.738 mhouse height: 5 mfloor area: 37.02 m2volume: 181.53 m3envelope area including floor: 200.69 m2Pressure Difference for ELA 10 Pa
DEPRESSURISATION RING (O=open or A,B,C,D,E)
MEASURED FAN PRESSURE (Pa)
MEASURED FLOW (m3/h)
FLOW RANGE OK FOR SELECTED RING?
Adjusted Pressure (Pa)
Ln delta P Ln Q Q50 Calculated Flow at 50Pa (m3/h)
Permeability Depress Only (m3/hr/m2)
ACH Depress Only (ach)
Approx 60 Pa b 60.4 714 60.4 4.100989 6.563637Approx 50 Pa b 49.9 633 49.9 3.910021 6.443224 r2 1.000Approx 40 Pa b 41.1 559 41.1 3.716008 6.318903 C 0.012 m3/sApprox 30 Pa b 32.4 480 32.4 3.478158 6.16654 n 0.675Approx 20 Pa c 21.6 358 21.6 3.072693 5.873287 C (corrected) 0.013 m3/sApprox 10 Pa c 12.5 248 12.5 2.525729 5.506182PRESSURISATION
RING (O=open or A,B,C,D,E)
MEASURED FAN PRESSURE (Pa)
MEASURED FLOW (m3/h)
FLOW RANGE OK FOR SELECTED RING?
Adjusted Pressure (Pa)
Ln P Ln Q Q50 Calculated Flow at 50Pa (m3/h)
Permeability Press Only (m3/hr/m2)
ACH Press Only (ach)
Approx 60 Pa b 60.3 753 60.3 4.099332 6.631312Approx 50 Pa b 50.8 661 50.8 3.927896 6.501 r2 1.000Approx 40 Pa b 41.2 575 41.2 3.718438 6.361616 C 0.012 m3/sApprox 30 Pa b 30.1 467 30.1 3.404525 6.153576 n 0.694Approx 20 Pa c 20.8 360 20.8 3.034953 5.89335 C (corrected) 0.013 m3/sApprox 10 Pa c 11.8 241 11.8 2.4681 5.492043
full skirting around kitchen, patio door threshjold unsealed, vents into loft unsealed
Calculated Outdoor Air DensityCalculated Indoor Air Density
description of main construction details:
1.311.30
Model 3 with DG700Blower Door & Gauge Used
MINNEAPOLIS BLOWER DOOR DATA INPUT AND CALCULATION25/01/2007plot 117 stamford brookbryantchatsworthdm-s jw
DEPRESSURISATION
5.4
5.6
5.8
6
6.2
6.4
6.6
6.8
2 3 4 5
Ln delta P
Ln Q
PRESSURISATION
0
1
2
3
4
5
6
7
2 3 4 5
Ln delta P
Ln Q
Depressurisation
0
200
400
600
800
0 25 50 75 100delta P
Q
Pressurisation
0
200
400
600
800
0 25 50 75 100delta P
Q

Stamford Brook – Deliverable 6: APPENDIX 3 Web version - July 2007
Page 15 of 125
Appendix 3: Pressurisation Test of Redrow Plot 110
Figure 3.1 Redrow Plot 110
Dwelling Details 1. Plot 110 (figure 3.1) was originally selected for the second phase coheating tests investigation
(Deliverable 7, Wingfield et al. 2007), but has also been included in the detailed airtightness study. It is a Mendip house type, 4-bedroom, mid-terraced dwelling, built to the standard specification for Redrow at Stamford Brook. This pressurisation test was conducted immediately prior to the coheating test being carried out.
2. The pressure test was conducted in accordance with ATTMA’s Technical Standard 1: Measuring Air Permeability of Building Envelopes (ATTMA, 2006) with the dwelling virtually completed; the only remaining work to be performed on the property was some snagging and finishing involved painting and sealing of the floors.
Pressure Test Results 3. The pressurisation test was performed on Redrow Plot 110 by the Leeds Met research team on 27th
February 2007. The fan system used for the test was an Energy Conservatory Minneapolis Model 3 Blower Door equipped with a DG700 digital pressure gauge. A summary of the results are contained within Table 3.1.
Table 3.1 Pressure test results for Redrow plot 110, 27th February 2007.
Pressurisation Depressurisation Plot Mean Air Permeability
(m3/(h.m2) @ 50Pa)
ACH50 Equivalent leakage area
(m2 @ 10Pa) r2 coefficient of determination
r2 coefficient of determination
Permeability (m3/(h.m2) @ 50Pa)
Permeability (m3/(h.m2) @ 50Pa)
R110 4.22 0.990 3.85 0.981 4.03 3.85 0.049
4. The calculated mean air permeability for the dwelling was 4.03 m3/(h.m2) @ 50 Pa, below the target
of 5 m3/(h.m2) @ 50 Pa. This compares favourably with recent test data from the site and also with the result obtained from a similar dwelling (4.85 m3/(h.m2) @ 50 Pa for plot 101) tested in December 2005.

Stamford Brook – Deliverable 6: APPENDIX 3 Web version - July 2007
Leakage Detection 5. Leakage detection was performed under dwelling pressurisation, at approximately 75 Pa above the
external pressure, using a handheld smoke puffer and recorded photographically. The main leakage paths observed during the test are listed below.
6. The floor/wall junctions on the ground floor generally performed well, although some air leakage was detected in room corners and areas where no sealant had been applied, such as around door frames (figure 3.2).
7. Despite a sealant having been applied, air leakage was still detected at the threshold on the ground floor (figure 3.3).
8. Air leakage into the voids surrounding the stairs was observed on both staircases, this appeared most severe around the risers (figure 3.4).
9. Although the floor/wall junctions on the first floor had been sealed, air movement was detected at various places where the sealing was either absent or the seal had failed (figure 3.5).
10. Where patio doors had been fitted on the first floor, in both the lounge and master bedroom, sealant had been applied around the frame/floor and frame/skirting junctions but sizeable air flow was still observed (figure 3.6).
11. Air movement was detected around a number of joints between flooring panels on both intermediate floors, this was particularly through the closest joints running between flooring panels directly parallel to both patio doors sited on the first floor (figure 3.7).
12. Floor/wall junctions on the second floor performed worse than similar junctions on the first floor. Particular areas of concern were room corners, less visible areas such as inside the built-in wardrobe, and around the door frames (figure 3.8).
13. Although the service penetrations had been sealed well in general, no sealant had been applied to junctions in the cylinder cupboard on the second floor around the platform floor perimeter and the door frame. Again, these are less conspicuous areas and appear to be easily missed when applying the sealant and also become less accessible once all the plumbing fittings have been installed (figure 3.9).
14. Direct air leakage into the loft was detected around and through the loft hatch on the second floor (figure 3.10).
15. Plumbing penetrations were generally well sealed and relatively airtight, the exception to this being radiators, particularly those sited on the partition walls of both intermediate floors (figure 3.11).
16. Electrical service penetrations were also generally good, although some leakage was detected around the electrical consumer unit and various other electrical installations. The only areas where significant leakage was observed around electrical fixings was with the ceiling lights fitted in the bathroom, en-suite and WC; this is of particular concern in the second floor bathroom where air movement around the light fixing is directly into the ventilated loft space above (figure 3.12).
Figure 3.2 Leakage at the ground floor perimeter in the kitchen and utility room.
Page 16 of 125

Stamford Brook – Deliverable 6: APPENDIX 3 Web version - July 2007
Figure 3.3 Air movement around the patio door threshold in the kitchen.
Figure 3.4 Air leakage detected around steps and risers of both staircases.
Figure 3.5 Air leakage at the first floor room perimeters in the landing and master bedroom.
Figure 3.6 Leakage detected around the first floor patio doors in the master bedroom.
Page 17 of 125

Stamford Brook – Deliverable 6: APPENDIX 3 Web version - July 2007
Figure 3.7 Air movement into the intermediate floor voids on the first floor landing and en-suite, on the
second floor landing, and close to the patio doors in the lounge and master bedroom.
Figure 3.8 Air leakage around the wall/floor junctions on the second floor.
Page 18 of 125

Stamford Brook – Deliverable 6: APPENDIX 3 Web version - July 2007
Figure 3.9 Air leakage in the cylinder cupboard.
Figure 3.10 Direct air leakage around the loft hatch.
Figure 3.11 Air movement around the radiator pipework.
Page 19 of 125

Stamford Brook – Deliverable 6: APPENDIX 3 Web version - July 2007
Figure 3.12 Air leakage around electrical penetrations around the consumer unit, electrical fixings in the
kitchen and the bathroom/en-suite/WC light fixings
Page 20 of 125

Stamford Brook – Deliverable 6: APPENDIX 3 Web version - July 2007
Page 21 of 125
Pressure Test Details 0.673251895 4.431405005
0.047333679 0.169264329
0.980611583 0.049254101
0.624340192 4.7180261970.032050624 0.114274034
0.98956875 0.0355720680.673251895
date: Version 15a 13 October 2006
RESULTS:Mean Flow AT 50Pa = 1229.96 m3/h
ACH50 = 3.45 achAir Permeability at 50 Pa = 4.03 m/hEquivalent Leakage Area = 0.049 m2 at 10 Pa
OK 1172.88 3.85 3.29OKOKOKOKOK
OK 1287.04 4.22 3.62OKOKOKOKOK
Note: ENSURE THAT FLOW SETTINGS ARE IN M3/HR - When using the DG700 gauge you do not need to input a baseline pressure difference as this is calculated by the gauge and the readings adjusted automatically
4.431405005 84.04942385test house address: 0.624340192company: 4.718026197 111.947073house type: 6tester: 6test reference number:outdoor temp (°C) 12.9 °Cindoor temp (°C) 15 °Coutdoor humidity (%rh) 79.8 %rhindoor humidity (%rh) 72.7 %rhoutdoor barometric pressure 994 mbar or hPa kg/m3indoor barometric pressure 995 mbar or hPa kg/m3temperature corr. fact. depress. 0.993temperature corr. fact. press. 1.007wind speed (m/s): 0.4baseline pressure diff (Pa) (+/-) Pahouse width: mhouse depth: mhouse height: mfloor area: m2volume: 356 m3envelope area including floor: 305 m2Pressure Difference for ELA 10 Pa
DEPRESSURISATION RING (O=open or A,B,C,D,E)
MEASURED FAN PRESSURE (Pa)
MEASURED FLOW (m3/h)
FLOW RANGE OK FOR SELECTED RING?
Adjusted Pressure (Pa)
Ln delta P Ln Q Q50 Calculated Flow at 50Pa (m3/h)
Permeability Depress Only (m3/hr/m2)
ACH Depress Only (ach)
Approx 60 Pa b 62.7 1353 62.7 4.138361 7.202761Approx 50 Pa b 50.9 1190 50.9 3.929863 7.07439 r2 0.981Approx 40 Pa b 40.6 1048 40.6 3.703768 6.94732 C 0.023 m3/sApprox 30 Pa b 31.9 848 31.9 3.462606 6.735562 n 0.673Approx 20 Pa b 23.5 764 23.5 3.157 6.631249 C (corrected) 0.023 m3/sApprox 10 Pa b 18.4 571 18.4 2.912351 6.340071PRESSURISATION
RING (O=open or A,B,C,D,E)
MEASURED FAN PRESSURE (Pa)
MEASURED FLOW (m3/h)
FLOW RANGE OK FOR SELECTED RING?
Adjusted Pressure (Pa)
Ln P Ln Q Q50 Calculated Flow at 50Pa (m3/h)
Permeability Press Only (m3/hr/m2)
ACH Press Only (ach)
Approx 60 Pa b 62.3 1466 62.3 4.131961 7.297611Approx 50 Pa b 51 1316 51 3.931826 7.18967 r2 0.990Approx 40 Pa b 40.6 1140 40.6 3.703768 7.046102 C 0.031 m3/sApprox 30 Pa b 32.6 961 32.6 3.484312 6.875293 n 0.624Approx 20 Pa b 24.1 769 24.1 3.182212 6.652409 C (corrected) 0.031 m3/sApprox 10 Pa b 16.2 657 16.2 2.785011 6.495002
Calculated Outdoor Air DensityCalculated Indoor Air Density
description of main construction details:
1.211.20
Model 3 with DG700Blower Door & Gauge Used
MINNEAPOLIS BLOWER DOOR DATA INPUT AND CALCULATION27/02/2007Plot 110, Stamford BrookRedrowMendipJW, DM-S
DEPRESSURISATION
6.26.36.46.56.66.76.86.9
77.17.27.3
2 3 4 5
Ln delta P
Ln Q
PRESSURISATION
6.46.56.66.76.86.9
77.17.27.37.4
2 3 4 5
Ln delta P
Ln Q
Depressurisation
0
500
1000
1500
0 25 50 75 100delta P
Q
Pressurisation
0
500
1000
1500
2000
0 25 50 75 100delta P
Q

Stamford Brook – Deliverable 6: APPENDIX 4 Web version - July 2007
Page 22 of 125
Appendix 4: Pressurisation Test of Redrow Plot 111
Figure 4.1 Redrow Plot 111
Dwelling Details 1. Plot 111 (figure 4.1) was originally selected for the second phase coheating tests investigation
(Deliverable 7, Wingfield et al. 2007), but has also been included in the detailed airtightness study. It is a Mendip house type, 4-bedroom, end-terraced dwelling, built to the standard specification for Redrow at Stamford Brook. This pressurisation test was conducted immediately prior to the coheating test being carried out.
2. The pressure test was conducted in accordance with ATTMA’s Technical Standard 1: Measuring Air Permeability of Building Envelopes (ATTMA, 2006) with the dwelling almost fully completed, the only remaining work to be performed on the property was some snagging and finishing involved painting and sealing of the floors. A faulty trickle vent in a second floor bedroom was temporarily sealed with tape for the purposes of this test.
Pressure Test Results 3. The pressurisation test was performed on Redrow Plot 111 by the Leeds Met research team on 27th
February 2007. The fan system used for the test was an Energy Conservatory Minneapolis Model 3 Blower Door equipped with a DG700 digital pressure gauge. The results are contained within Table 4.1.
Table 4.1 Pressure test results for Redrow plot 111, 27th February 2007.
Pressurisation Depressurisation Mean Air Permeability
(m3/(h.m2) @ 50Pa)
Plot ACH50 Equivalent leakage area
(m2 @ 10Pa) r2 coefficient of determination
r2 coefficient of determination
Permeability (m3/(h.m2) @ 50Pa)
Permeability (m3/(h.m2) @ 50Pa)
R111 2.99 0.980 2.68 1.000 2.84 2.46 0.034
4. The calculated mean air permeability for the dwelling was 2.84 m3/(h.m2) @ 50 Pa, well inside the
target figure for the site of 5 m3/(h.m2) @ 50 Pa.. This result shows an improvement over plot R110 (4.03 m3/(h.m2) @ 50 Pa), comparing favourably with recent test data from site and also with the result obtained from a similar dwelling (4.85 m3/(h.m2) @ 50 Pa for plot 101) tested in December 2005.

Stamford Brook – Deliverable 6: APPENDIX 4 Web version - July 2007
Leakage Detection 5. Leakage detection was performed under dwelling pressurisation, at approximately 75 Pa above the
external pressure, using a handheld smoke puffer and recorded photographically. The main detectable leakage paths observed during the test are listed below.
6. As in plot R110 air leakage was detected at the floor/wall junctions on the ground floor, but in fewer places and at a reduced rate (figure 4.2).
7. As in plot R110, despite a sealant having been applied, air leakage was still detected at the threshold on the ground floor (figure 4.3).
8. Air leakage into voids around the stairs was much reduced in this dwelling compared to plot R110, with the only leakage being detected at junctions of the stairs with walls and intermediate floors (figure 4.4).
9. Although the floor/wall junctions on the first floor had been sealed, air movement was detected at various places where the sealing was either absent, such as inside the built-in wardrobe, or where the seal had failed (figure 4.5).
10. As in plot R110, sealant had been applied around the frame/floor and frame/skirting junctions of both patio doors placed on intermediate floors, but noticeable air movement was still observed (figure 4.6).
11. Air movement was detected around a number of joints between flooring panels on both intermediate floors, this was particularly severe around the patio doors in the first floor lounge and second floor front bedroom (figure 4.7).
12. Air leakage at the floor/wall junctions on the second floor appeared less than in plot R110, but was still detectable on a number of walls where gaps in the sealant occurred (figure 4.8).
13. Gaps around the platform floor and internal door frame of the cylinder cupboard on the second floor allowed significant air leakage, as was observed in plot R110 (figure 4.9).
14. Although most aspects of the windows, including the window casements and trickle vents, appeared to be airtight, some direct air leakage was detected through gaps between individual elements of the bay window on the first floor and around the patio door frame in the kitchen (figure 4.10)
15. Leakage was detected at the loft hatch through the keyhole and around the door (figure 4.11), although only minor air movement was detected at the hatch/ceiling junction.
16. Plumbing penetrations were generally well sealed and relatively airtight, the exception to this being behind radiators, particularly those on the internal walls of intermediate floors (figure 4.12).
17. No detectable leakage was observed around electrical service penetrations apart from some minor leakage around the lights fitted in the bathroom, en-suite and WC, as observed in plot R110 but at a reduced rate.
Figure 4.2 Ground floor perimeter in the utility room.
Page 23 of 125

Stamford Brook – Deliverable 6: APPENDIX 4 Web version - July 2007
Figure 4.3 Leakage through gaps around the patio door threshold in the kitchen.
Figure 4.4 Gaps around the staircases.
Figure 4.5 Missing or failed sealing at the wall/floor junctions in the landing, lounge, master bedroom and
built-in wardrobe on the first floor.
Page 24 of 125

Stamford Brook – Deliverable 6: APPENDIX 4 Web version - July 2007
Figure 4.6 Leakage around the patio doors on both the first and second floors.
Figure 4.7 As in R110 leakage was observed into both intermediate floor voids through gaps between
flooring panels, again this appeared most severe just in front of the patio doors.
Figure 4.8 Air leakage at internal, separating and external wall/floor junctions on the second floor where
gaps existed in the sealant.
Page 25 of 125

Stamford Brook – Deliverable 6: APPENDIX 4 Web version - July 2007
Figure 4.9 Cylinder cupboard air leakage.
Figure 4.10 Leakage detected between elements of the first floor bay window and around the frame of the
patio door in the kitchen.
Figure 4.11 Air movement through the loft hatch.
Page 26 of 125

Stamford Brook – Deliverable 6: APPENDIX 4 Web version - July 2007
Figure 4.12 Air movement observed around plumbing elements in the kitchen, downstairs WC, en-suite
and bathroom, and behind radiators on the 1st and 2nd floors.
Page 27 of 125

Stamford Brook – Deliverable 6: APPENDIX 4 Web version - July 2007
Page 28 of 125
Pressure Test Details 0.741502317 3.838864273
0.007583522 0.027575361
0.999581789 0.007166939
0.628613207 4.3916477890.045100083 0.1623607970.97982579 0.045722062
0.741502317
date: Version 15a 13 October 2006
RESULTS:Mean Flow AT 50Pa = 896.08 m3/h
ACH50 = 2.46 achAir Permeability at 50 Pa = 2.84 m/hEquivalent Leakage Area = 0.034 m2 at 10 Pa
OK 846.61 2.68 2.32OKOKOKOKOK
OK 945.55 2.99 2.59OKOKOKOKOK
Note: ENSURE THAT FLOW SETTINGS ARE IN M3/HR - When using the DG700 gauge you do not need to input a baseline pressure difference as this is calculated by the gauge and the readings adjusted automatically
3.838864273 46.47266418test house address: 0.628613207company: 4.391647789 80.77340693house type: 6tester: 6test reference number:outdoor temp (°C) 12.9 °Cindoor temp (°C) 14.2 °Coutdoor humidity (%rh) 80.1 %rhindoor humidity (%rh) 87.1 %rhoutdoor barometric pressure 994 mbar or hPa kg/m3indoor barometric pressure 996 mbar or hPa kg/m3temperature corr. fact. depress. 0.995temperature corr. fact. press. 1.005wind speed (m/s): 0baseline pressure diff (Pa) (+/-) Pahouse width: mhouse depth: mhouse height: mfloor area: m2volume: 365 m3envelope area including floor: 316 m2Pressure Difference for ELA 10 Pa
DEPRESSURISATION RING (O=open or A,B,C,D,E)
MEASURED FAN PRESSURE (Pa)
MEASURED FLOW (m3/h)
FLOW RANGE OK FOR SELECTED RING?
Adjusted Pressure (Pa)
Ln delta P Ln Q Q50 Calculated Flow at 50Pa (m3/h)
Permeability Depress Only (m3/hr/m2)
ACH Depress Only (ach)
Approx 60 Pa b 63.5 1017 63.5 4.15104 6.920076Approx 50 Pa b 50.9 864 50.9 3.929863 6.757036 r2 1.000Approx 40 Pa b 41.3 737 41.3 3.720862 6.598051 C 0.013 m3/sApprox 30 Pa b 35.9 658 35.9 3.580737 6.484668 n 0.742Approx 20 Pa b 28.4 555 28.4 3.346389 6.314431 C (corrected) 0.013 m3/sApprox 10 Pa c 19.4 424 19.4 2.965273 6.045197PRESSURISATION
RING (O=open or A,B,C,D,E)
MEASURED FAN PRESSURE (Pa)
MEASURED FLOW (m3/h)
FLOW RANGE OK FOR SELECTED RING?
Adjusted Pressure (Pa)
Ln P Ln Q Q50 Calculated Flow at 50Pa (m3/h)
Permeability Press Only (m3/hr/m2)
ACH Press Only (ach)
Approx 60 Pa b 62.8 1103 62.8 4.139955 7.010326Approx 50 Pa b 51.3 979 51.3 3.937691 6.891068 r2 0.980Approx 40 Pa b 42.9 837 42.9 3.758872 6.734361 C 0.022 m3/sApprox 30 Pa b 32.2 695 32.2 3.471966 6.548449 n 0.629Approx 20 Pa b 24.5 569 24.5 3.198673 6.348417 C (corrected) 0.022 m3/sApprox 10 Pa c 19.1 545 19.1 2.949688 6.305323
Calculated Outdoor Air DensityCalculated Indoor Air Density
description of main construction details:
1.211.20
Model 3 with DG700Blower Door & Gauge Used
MINNEAPOLIS BLOWER DOOR DATA INPUT AND CALCULATION27/02/2007Plot 111, Stamford BrookRedrowMendipJW, DM-S
DEPRESSURISATION
5.96
6.16.26.36.46.56.66.76.86.9
7
2 3 4 5
Ln delta P
Ln Q
PRESSURISATION
6.26.36.46.56.66.76.86.9
77.1
2 3 4 5
Ln delta P
Ln Q
Depressurisation
0200400600800
10001200
0 25 50 75 100delta P
Q
Pressurisation
0200400600800
10001200
0 25 50 75 100delta P
Q

Stamford Brook – Deliverable 6: APPENDIX 5 Web version - July 2007
Page 29 of 125
Appendix 5: Pressurisation Test of Redrow Plot 116
Figure 5.1 Redrow Plot 116
Dwelling Details 1. Plot 116 (figure 5.1) was selected for this investigation as the house design incorporates a number
of details known to have been problematic in previous airtightness tests performed at Stamford Brook. It is an Avondale house type, 2½ storey, 4-bedroom, semi-detached dwelling, built to the standard specification for Redrow at Stamford Brook.
2. The pressure test was conducted in accordance with ATTMA’s Technical Standard 1: Measuring Air Permeability of Building Envelopes (ATTMA, 2006) with the dwelling almost fully completed; the only remaining work to be performed on the property was some snagging and finishing involved painting of the floors and sealing of the wall/floor junctions. Temporary sealing of the washing machine waste pipe was performed prior to the pressurisation test (figure 5.2). The dwelling was planned to be re-tested later in the week after additional secondary sealing has been carried out.
Figure 5.2 Temporary sealing of the washing machine waste pipe.

Stamford Brook – Deliverable 6: APPENDIX 5 Web version - July 2007
Pressure Test Results 3. The pressurisation test was performed on Redrow Plot 116 by the Leeds Met research team on 27th
February 2007. The fan system used for the test was an Energy Conservatory Minneapolis Model 3 Blower Door equipped with a DG700 digital pressure gauge. The results are contained within Table 5.1.
Table 5.1 Pressure test results for Redrow plot 116, 5th March 2007.
Pressurisation Depressurisation Plot ACH50 Equivalent leakage area
(m2 @ 10Pa)
Mean Air Permeability
(m3/(h.m2) @ 50Pa) r2 coefficient of determination
r2 coefficient of determination
Permeability (m3/(h.m2) @ 50Pa)
Permeability (m3/(h.m2) @ 50Pa)
R116 5.43 0.997 5.25 0.988 5.34 4.85 0.074
4. The calculated mean air permeability for the dwelling was 5.34 m3/(h.m2) @ 50 Pa, outside the
target figure for the site of 5 m3/(h.m2) @ 50 Pa. This result shows an improvement over the average results obtained for finished 2½ storey dwellings tested at Stamford Brook, but compares unfavourably with the result obtained from a similar dwelling (2.27 m3/(h.m2) @ 50 Pa for plot 803) tested in September 2006 which also had unsealed wall/floor junctions at the time of the test.
Leakage Detection 5. Leakage detection was performed under dwelling pressurisation, at approximately 65 Pa above the
external pressure, using a handheld smoke puffer and recorded photographically. The main leakage paths observed during the test are listed below.
6. Some unsealed gaps around the front door and threshold were unable to be examined using leakage detection due to the position of the blower door during dwelling pressurisation, it is expected that some air leakage will have occurred through these gaps (figure 5.3).
Figure 5.3 Gaps around the front entrance which were inaccessible during the test.
7. At the ground floor junction with external, internal and separating walls leakage was commonplace,
this appeared to be most severe in the room corners (figure 5.4).
8. Significant air leakage was observed at the thresholds in the kitchen/diner, at the back door and patio doors and at the similar detail at the gallery window (figure 5.5).
9. Also in the kitchen, some air movement was detected through gaps around the rear door hinges (figure 5.6).
10. Both staircases allowed air to move into the voids behind them through gaps around the risers, there were also a number of points of air leakage at junctions of the stairs with both walls and intermediate floors (figure 5.7).
11. First floor junctions with external, internal and separating walls all allowed air movement at varying rates, with no apparent pattern between severity of airflow and location (figure 5.8).
Page 30 of 125

Stamford Brook – Deliverable 6: APPENDIX 5 Web version - July 2007
12. Unsealed holes and gaps between flooring panels let air move into the first floor void (figure 5.9).
13. Second floor junctions with external, internal and separating walls performed badly, particularly along the external wall of the rear-facing bedroom which backed onto the sloping roof void (figure 5.10).
14. As with the first floor, gaps remaining between flooring panels allowed air to move into the intermediate floor void at the second floor (figure 5.11).
15. Air leakage was detected around the bath panel and shower fascia panels in the first and second floor bathrooms and en-suite (figure 5.12).
16. The loft hatch had been sealed around, but there was still some air movement between the trap and door directly into the loft (figure 5.13).
17. Air leakage around both rooflights in the second floor bedroom occurred around the casements and around the frames (figure 5.14).
18. Air movement through the pattress boxes behind the radiators appeared to get worse the further up the dwelling, particularly poor was in the second floor rear bedroom where the radiator backed on to a roof void (figure 5.15).
19. Many plumbing penetrations had not been sealed around effectively, especially those which were not easily accessible or obscured from view (figure 5.16).
20. Electrical penetrations were generally well sealed with notable exceptions being the electrical consumer unit and the ceiling lights fitted in the bathrooms, en-suite and downstairs WC (figure 5.17).
Figure 5.4 Air movement detected around the ground floor perimeter; on external walls in the kitchen,
lounge and downstairs WC, and on internal walls in the lounge
Page 31 of 125

Stamford Brook – Deliverable 6: APPENDIX 5 Web version - July 2007
Figure 5.5 Air leakage at the rear door and patio door thresholds, and around the base of the gallery
window in the kitchen
Figure 5.6 Air leakage around external door hinges in the kitchen.
Page 32 of 125

Stamford Brook – Deliverable 6: APPENDIX 5 Web version - July 2007
Figure 5.7 Air movement around both sets of stairs.
Figure 5.8 Leakage was observed at almost all points around the first floor perimeter, on internal,
separating and external walls.
Page 33 of 125

Stamford Brook – Deliverable 6: APPENDIX 5 Web version - July 2007
Figure 5.9 Air leakage into the first intermediate floor void through an unsealed hole in the bathroom and
gaps between flooring panels in the front bedroom.
Figure 5.10 Air movement around the second floor perimeter, in the bathroom and both bedrooms, on
internal, external and separating walls.
Page 34 of 125

Stamford Brook – Deliverable 6: APPENDIX 5 Web version - July 2007
Figure 5.11 Movement of air through gaps in the second intermediate floor on the landing and in the rear
bedroom cupboard.
Figure 5.12 Air leakage around the bath panel in the first floor bathroom and around the shower tray
fascias in the second floor bathroom and first floor en-suite.
Figure 5.13 Leakage between the loft trap and door.
Page 35 of 125

Stamford Brook – Deliverable 6: APPENDIX 5 Web version - July 2007
Figure 5.14 Air movement detected around the rooflight casements and frames.
Figure 5.15 Leakage behind the radiators on the first and second floors.
Page 36 of 125

Stamford Brook – Deliverable 6: APPENDIX 5 Web version - July 2007
Figure 5.16 Air leakage into voids behind units, plasterboard and ceiling in the kitchen, and into the boxing
in the downstairs WC around various plumbing penetrations.
Figure 5.17 Air movement around the bathroom, en-suite and downstairs WC light fixings, around and
through the electrical consumer unit and around an electrical penetration on a second floor internal wall.
Page 37 of 125

Stamford Brook – Deliverable 6: APPENDIX 5 Web version - July 2007
Page 38 of 125
Pressure Test Details 0.55307048 5.19579221
0.031091402 0.110165279
0.987516851 0.034198509
0.568671453 5.1739469090.016718423 0.0595496350.996554685 0.01502195
0.55307048
date: Version 15a 13 October 2006
RESULTS:Mean Flow AT 50Pa = 1615.58 m3/h
ACH50 = 4.85 achAir Permeability at 50 Pa = 5.34 m/hEquivalent Leakage Area = 0.074 m2 at 10 Pa
OUT OF RANGE 1588.19 5.25 4.77OKOKOKOKOK
OUT OF RANGE 1642.96 5.43 4.93OKOKOKOKOK
Note: ENSURE THAT FLOW SETTINGS ARE IN M3/HR - When using the DG700 gauge you do not need to input a baseline pressure difference as this is calculated by the gauge and the readings adjusted automatically
5.19579221 180.5110889test house address: 0.568671453company: 5.173946909 176.6105293house type: 6tester: 6test reference number:outdoor temp (°C) 9.7 °Cindoor temp (°C) 12.8 °Coutdoor humidity (%rh) 69.8 %rhindoor humidity (%rh) 66.6 %rhoutdoor barometric pressure 999 mbar or hPa kg/m3indoor barometric pressure 1000 mbar or hPa kg/m3temperature corr. fact. depress. 0.989temperature corr. fact. press. 1.011wind speed (m/s): 2.9baseline pressure diff (Pa) (+/-) Pahouse width: 5.51 mhouse depth: 8.19 mhouse height: 7.26 mfloor area: m2volume: 333.2 m3envelope area including floor: 302.3 m2Pressure Difference for ELA 10 Pa
DEPRESSURISATION RING (O=open or A,B,C,D,E)
MEASURED FAN PRESSURE (Pa)
MEASURED FLOW (m3/h)
FLOW RANGE OK FOR SELECTED RING?
Adjusted Pressure (Pa)
Ln delta P Ln Q Q50 Calculated Flow at 50Pa (m3/h)
Permeability Depress Only (m3/hr/m2)
ACH Depress Only (ach)
Approx 60 Pa b 60.8 1805 60.8 4.10759 7.48741Approx 50 Pa b 49.9 1624 49.9 3.910021 7.381742 r2 0.988Approx 40 Pa b 41.8 1372 41.8 3.732896 7.213119 C 0.050 m3/sApprox 30 Pa b 29.1 1182 29.1 3.370738 7.064057 n 0.553Approx 20 Pa b 23.8 1025 23.8 3.169686 6.921542 C (corrected) 0.051 m3/sApprox 10 Pa b 16.4 881 16.4 2.797281 6.770152PRESSURISATION
RING (O=open or A,B,C,D,E)
MEASURED FAN PRESSURE (Pa)
MEASURED FLOW (m3/h)
FLOW RANGE OK FOR SELECTED RING?
Adjusted Pressure (Pa)
Ln P Ln Q Q50 Calculated Flow at 50Pa (m3/h)
Permeability Press Only (m3/hr/m2)
ACH Press Only (ach)
Approx 60 Pa b 55.9 1729 55.9 4.023564 7.466204Approx 50 Pa b 48.1 1575 48.1 3.873282 7.372917 r2 0.997Approx 40 Pa b 40.1 1430 40.1 3.691376 7.276336 C 0.049 m3/sApprox 30 Pa b 33.1 1258 33.1 3.499533 7.148184 n 0.569Approx 20 Pa b 24.4 1099 24.4 3.194583 7.013062 C (corrected) 0.049 m3/sApprox 10 Pa b 19.6 939 19.6 2.97553 6.855721
Calculated Outdoor Air DensityCalculated Indoor Air Density
description of main construction details:
1.231.22
Model 3 with DG700Blower Door & Gauge Used
MINNEAPOLIS BLOWER DOOR DATA INPUT AND CALCULATION05/03/2007
R116
Plot 116 Stamford BrookRedrowAvondaleJW, DMS
DEPRESSURISATION
6.7
6.8
6.9
7
7.1
7.2
7.3
7.4
7.5
7.6
2 3 4 5
Ln delta P
Ln Q
PRESSURISATION
6.8
6.9
7
7.1
7.2
7.3
7.4
7.5
2 3 4 5
Ln delta P
Ln Q
Depressurisation
0
500
1000
1500
2000
0 25 50 75 100delta P
Q
Pressurisation
0
500
1000
1500
2000
0 25 50 75 100delta P
Q

Stamford Brook – Deliverable 6: APPENDIX 6 Web version - July 2007
Page 39 of 125
Appendix 6: Pressurisation Re-test of Redrow Plot 116
Figure 6.1 Redrow Plot 116
Dwelling Details 1. Plot 116 (figure 6.1) was selected for this investigation as the house design incorporates a number
of details known to have been problematic in previous airtightness tests performed at Stamford Brook. It is an Avondale house type, 2½ storey, 4-bedroom, semi-detached dwelling, built to the standard specification for Redrow at Stamford Brook.
2. The pressure test was conducted in accordance with ATTMA’s Technical Standard 1: Measuring Air Permeability of Building Envelopes (ATTMA, 2006) with the dwelling almost completed, the only remaining work to be performed on the property was the painting of the floors and some snagging work to repair damage caused during the security system installation. The dwelling was previously tested on 5th March 2007 before much additional secondary sealing had been carried out. Temporary sealing applied for the purpose of this test is shown in Figure 6.2.
Figure 6.2 Temporary sealing to the washing machine waste pipe and to holes created during the
installation of the security system.
Pressure Test Results 3. The pressurisation re-test was performed on Redrow Plot 116 by the Leeds Met research team on
8th March 2007. The fan system used for the test was an Energy Conservatory Minneapolis Model 3 Blower Door equipped with a DG700 digital pressure gauge. The results are contained within Table 6.1.

Stamford Brook – Deliverable 6: APPENDIX 6 Web version - July 2007
Table 6.1 Pressure test results for Redrow plot 116.
Pressurisation Depressurisation Date ACH50 Equivalent leakage area
(m2 @ 10Pa)
Mean Air Permeability
(m3/(h.m2) @ 50Pa) r2 coefficient of determination
r2 coefficient of determination
Permeability (m3/(h.m2) @ 50Pa)
Permeability (m3/(h.m2) @ 50Pa)
05 Mar 2007 5.43 0.997 5.25 0.988 5.34 4.85 0.074
08 Mar 2007 4.58 0.998 4.32 0.997 4.45 4.04 0.056
4. The calculated mean air permeability for the re-tested dwelling was 4.45 m3/(h.m2) @ 50 Pa, inside
the target figure for the site of 5 m3/(h.m2) @ 50 Pa. This result shows an improvement over the previous result obtained for this dwelling (5.34 m3/(h.m2) @ 50 Pa) tested 3 days previously; the only actions undertaken between the tests was the sealing of the wall/floor junctions and the installation of the security system.
5. Although sealing of the junctions between the walls and floor had been performed successfully in many areas of the dwelling, many gaps still remained. These gaps appeared to persist for a number of reasons. In inaccessible or obscured areas the sealant had often been missed out altogether, such as in the built-in wardrobe; in some areas the sealant had been applied over debris rather than the debris first being removed; and in other areas the sealant appeared to have already failed (figure 6.3).
Figure 6.3 Examples of floor/wall junctions; well-sealed, with debris beneath the sealant, and failed joints.
6. Leakage detection using hand-held smoke puffers revealed that air movement was occurring
through most of the observed gaps in the sealant at the wall/floor junctions (figure 6.4).
Figure 6.4 Air leakage detected where the sealing of the floor/wall junctions was impaired, either through
the presence of debris, insufficient sealant or the sealant had already failed.
Page 40 of 125

Stamford Brook – Deliverable 6: APPENDIX 6 Web version - July 2007
Page 41 of 125
Pressure Test Details 0.637387386 4.669594934
0.018190775 0.064653103
0.996752547 0.021002206
0.610178569 4.8415756640.012190971 0.0430555750.998405848 0.0141603180.637387386
date: Version 15a 13 October 2006
RESULTS:Mean Flow AT 50Pa = 1345.98 m3/h
ACH50 = 4.04 achAir Permeability at 50 Pa = 4.45 m/hEquivalent Leakage Area = 0.056 m2 at 10 Pa
OK 1306.01 4.32 3.92OKOKOKOKOK
OK 1385.95 4.58 4.16OKOKOKOKOK
Note: ENSURE THAT FLOW SETTINGS ARE IN M3/HR - When using the DG700 gauge you do not need to input a baseline pressure difference as this is calculated by the gauge and the readings adjusted automatically
4.669594934 106.6545316test house address: 0.610178569company: 4.841575664 126.668782house type: 6tester: 6test reference number:outdoor temp (°C) 11.8 °Cindoor temp (°C) 16.7 °Coutdoor humidity (%rh) 60.2 %rhindoor humidity (%rh) 57.2 %rhoutdoor barometric pressure 1015 mbar or hPa kg/m3indoor barometric pressure 1016 mbar or hPa kg/m3temperature corr. fact. depress. 0.983temperature corr. fact. press. 1.017wind speed (m/s): 2.2baseline pressure diff (Pa) (+/-) Pahouse width: 5.51 mhouse depth: 8.19 mhouse height: 7.26 mfloor area: m2volume: 333.2 m3envelope area including floor: 302.3 m2Pressure Difference for ELA 10 Pa
DEPRESSURISATION RING (O=open or A,B,C,D,E)
MEASURED FAN PRESSURE (Pa)
MEASURED FLOW (m3/h)
FLOW RANGE OK FOR SELECTED RING?
Adjusted Pressure (Pa)
Ln delta P Ln Q Q50 Calculated Flow at 50Pa (m3/h)
Permeability Depress Only (m3/hr/m2)
ACH Depress Only (ach)
Approx 60 Pa b 62.2 1513 62.2 4.130355 7.304791Approx 50 Pa b 50.5 1322 50.5 3.921973 7.169842 r2 0.997Approx 40 Pa b 41.2 1170 41.2 3.718438 7.0477 C 0.030 m3/sApprox 30 Pa b 32.7 1005 32.7 3.487375 6.895684 n 0.637Approx 20 Pa b 23.2 777 23.2 3.144152 6.638382 C (corrected) 0.030 m3/sApprox 10 Pa b 15.4 633 15.4 2.734368 6.433412PRESSURISATION
RING (O=open or A,B,C,D,E)
MEASURED FAN PRESSURE (Pa)
MEASURED FLOW (m3/h)
FLOW RANGE OK FOR SELECTED RING?
Adjusted Pressure (Pa)
Ln P Ln Q Q50 Calculated Flow at 50Pa (m3/h)
Permeability Press Only (m3/hr/m2)
ACH Press Only (ach)
Approx 60 Pa b 61.6 1551 61.6 4.120662 7.363714Approx 50 Pa b 51 1343 51 3.931826 7.21972 r2 0.998Approx 40 Pa b 40.2 1195 40.2 3.693867 7.10296 C 0.035 m3/sApprox 30 Pa b 30.7 1012 30.7 3.424263 6.936743 n 0.610Approx 20 Pa b 21.5 818 21.5 3.068053 6.723921 C (corrected) 0.035 m3/sApprox 10 Pa b 15.8 664 15.8 2.76001 6.515341
Model 3 with DG700Blower Door & Gauge Used
MINNEAPOLIS BLOWER DOOR DATA INPUT AND CALCULATION08/03/2007
R116
Plot 116 Stamford BrookRedrowAvondaleJW, DMS
skirting sealed
Calculated Outdoor Air DensityCalculated Indoor Air Density
description of main construction details:
1.241.22
DEPRESSURISATION
6.36.46.56.66.76.86.9
77.17.27.37.4
2 3 4 5
Ln delta P
Ln Q
PRESSURISATION
6.46.56.66.76.86.9
77.17.27.37.47.5
2 3 4 5
Ln delta P
Ln Q
Depressurisation
0
500
1000
1500
2000
0 25 50 75 100delta P
Q
Pressurisation
0
500
1000
1500
2000
0 25 50 75 100delta P
Q

Stamford Brook – Deliverable 6: APPENDIX 7 Web version - July 2007
Page 42 of 125
Appendix 7: Pressurisation Test of Redrow Plot 117
Figure 7.1 Redrow Plot 117
Dwelling Details 1. Plot 117 (figure 7.1) was selected for this investigation as the house design incorporates a number
of details known to have been problematic in previous airtightness tests performed at Stamford Brook. It is an Avondale house type, 2½ storey, 4-bedroom, semi-detached dwelling, built to the standard specification for Redrow at Stamford Brook.
2. The pressure test was conducted in accordance with ATTMA’s Technical Standard 1: Measuring Air Permeability of Building Envelopes (ATTMA, 2006) with the dwelling almost fully completed, the only remaining work to be performed on the property was some minor snagging and finishing involving painting of the floors. The only temporary sealing required was to the washing machine waste pipe (figure 7.2).
Figure 7.2 Temporary sealing to the washing machine waste pipe.
Pressure Test Results 3. The pressurisation test was performed on Redrow Plot 117 by the Leeds Met research team on 8th
March 2007. The fan system used for the test was an Energy Conservatory Minneapolis Model 3 Blower Door equipped with a DG700 digital pressure gauge. The summary of the results are contained within Table 7.1.

Stamford Brook – Deliverable 6: APPENDIX 7 Web version - July 2007
Table 7.1 Pressure test results for Redrow plot 117, 8th March 2007.
Pressurisation Depressurisation Plot ACH50 Equivalent leakage area
(m2 @ 10Pa)
Mean Air Permeability
(m3/(h.m2) @ 50Pa) r2 coefficient of determination
r2 coefficient of determination
Permeability (m3/(h.m2) @ 50Pa)
Permeability (m3/(h.m2) @ 50Pa)
R117 5.81 0.998 5.45 0.999 5.63 5.10 0.069
4. The calculated mean air permeability for the dwelling was 5.63 m3/(h.m2) @ 50 Pa, outside the
target figure for the site of 5 m3/(h.m2) @ 50 Pa. This result shows an improvement over the average results obtained for finished 2½ storey dwellings tested at Stamford Brook, but compares unfavourably with the results obtained for plot R116 (4.45 m3/(h.m2) @ 50 Pa.) tested on the same day after its wall/floor junctions had also been sealed.
Leakage Detection 5. Leakage detection was performed using 2 methods. Firstly, under dwelling depressurisation (at
approximately 60 Pa below the external pressure) using a FLIR Thermacam B4 infrared camera prior to the pressurisation test being performed. With an internal air temperature of 17 to 20 C (ground floor to second floor) and external air temperature of 10.5 C, the temperature difference was large enough to determine certain areas where colder air was being drawn into the dwelling using infrared imaging. Secondly, under dwelling pressurisation (at approximately 60 Pa above the external pressure) immediately after the pressurisation test, a handheld smoke puffer was used to identify previously observed and additional points of air leakage from within the dwelling. In both cases any identified areas were also recorded photographically.
Leakage Detection using Thermal Imaging
6. There were restrictions as to which areas could be accurately identified using thermal imaging. The heating system had been running immediately prior to the test so radiators and pipework within walls and floors complicated matters and bright sunshine outside affected surface temperatures of many rooms with rear-facing windows. Taking this into consideration, the main areas of infiltration identified during the thermal imaging are listed below.
7. Infiltration at the ground floor junction with the external wall was only accurately determined in the lounge which faced the front of the dwelling and was not exposed to direct sun, however it was still possible to observed some effects at the rear of the property including leakage around the base of the gallery window in the kitchen/diner (figure 7.3).
8. Air leakage was detected around both staircases, at the edges of the risers and along the wall stringer (figure 7.4).
9. Movement of both warmer and colder air was detected around the first floor perimeter where the junctions were not effectively sealed. Colder air was observed entering through gaps around the skirting boards on external walls, whereas warm air could be seen at certain internal wall/floor junctions (figure 7.5).
10. Similar patterns of air movement were observed at the second floor perimeter (figure 7.6).
11. Colder air could be seen entering around the rooflights in both the kitchen/diner and the second floor bedroom (figure 7.7).
12. Air movement was detected around the bath panel and shower tray fascias (figure 7.8).
13. Infiltration of cooler air was detected around plumbing penetrations for waste pipes in the kitchen (figure 7.9).
14. Air leakage was observed around the electrical consumer unit situated in the downstairs WC (figure 7.10).
15. Colder air could be seen entering from the loft around the loft hatch (figure 7.11).
Page 43 of 125

Stamford Brook – Deliverable 6: APPENDIX 7 Web version - July 2007
Figure 7.3 Infiltration at the ground floor junction with the external wall in the lounge and around the base
of the gallery window in the kitchen/diner.
Figure 7.4 Air movement around the staircases.
Page 44 of 125

Stamford Brook – Deliverable 6: APPENDIX 7 Web version - July 2007
Figure 7.5 Air movement around the first floor perimeter; colder air entering at an external wall in the
bathroom, and warm and cold air entering the rear bedroom on internal and external walls respectively.
Figure 7.6 Air leakage at the second floor perimeter; at an external wall in the bathroom and at the junction
of the separating and wall in front of a warm sloping roof void in the rear bedroom.
Figure 7.7 Air movement around a rooflight in the bedroom.
Page 45 of 125

Stamford Brook – Deliverable 6: APPENDIX 7 Web version - July 2007
Figure 7.8 Colder air entering around the bath panel in the first floor bathroom.
Figure 7.9 Air leakage around waste pipe for the washing machine and kitchen sink.
Figure 7.10 Infiltration around the electrical consumer unit
Figure 7.11 Cooler air entering the bedroom from the loft via gaps around the loft hatch.
Page 46 of 125

Stamford Brook – Deliverable 6: APPENDIX 7 Web version - July 2007
Leakage Detection using Smoke Puffers
16. Using smoke puffers under dwelling pressurisation illustrates points of air leakage from the dwelling, confirming many of the leakage paths identified through thermal imaging and distinguishing others where the temperature differential was insufficient to be displayed thermographically. The main points of air leakage identified by this technique are listed below.
17. Air leakage around the ground floor perimeter was most severe at room corners and around the voids created by the boxing-in of soil/vent pipes (figure 7.12).
18. Quite significant air leakage was observed at the patio door and rear door thresholds, even though they appeared to be well sealed apart from one small hole at the base of the glazed panel next to the back door (figure 7.13).
19. As shown in figure 7.3, air leakage was detected around the frame at the base of the gallery window in the kitchen (figure 7.14).
20. Air leakage was detected around an incorrectly adjusted patio door casement (figure 7.15).
21. The movement of air into the voids surrounding both staircases, as indicated in figure 7.4, was particularly bad around the sides of the risers where the stairs turned corners, air leakage was also observed at unsealed junctions between the staircases and intermediate floors (figure 7.16).
22. The first floor room perimeter had sealant applied at most junctions with the skirting boards. However, air movement was detected underneath the skirting boards where the sealant was insufficient or had failed as was shown in Figure 7.5 (figure 7.17).
23. As in figure 7.6, air leakage was also detected around a number of unfinished or inadequately sealed junctions on the second floor (figure 7.18).
24. Air movement was comparatively severe in the cylinder cupboard on the first floor, where the junction between the walls and the platform floor had not been sealed (figure 7.19).
25. Air leakage around the radiator pipework appeared to be limited to radiators on first and second floor partition walls (figure 7.20).
26. As in all the previous dwellings tested, air leakage was detected around the bath panel, as in figure 7.8, and through gaps around the shower tray fascia panels (figure 7.21).
27. Air leakage was detected around a number of plumbing service penetrations in the kitchen as illustrated in figure 7.9 (figure 7.22).
28. The movement of air around electrical service penetrations appeared to be limited to a few poorly sealed penetrations, these were the electrical consumer unit and the light fittings used in the bathrooms, en-suite and downstairs WC (figure 7.23)
29. Air leakage was detected around the loft hatch and between the trap and door (figure 7.24).
30. Air leakage was detected around the rooflights in the kitchen/diner and the second floor rear bedroom, as shown figure 7.7, both around the casements and the frames (figure 7.25).
Figure 7.12 Air leakage in the lounge at the wall/floor junctions.
Page 47 of 125

Stamford Brook – Deliverable 6: APPENDIX 7 Web version - July 2007
Figure 7.13 Air leakage through gaps around the patio door and rear door thresholds in the kitchen.
Figure 7.14 Leakage around the frame of the kitchen gallery window.
Figure 7.15 Air leakage about an incorrectly set patio door.
Page 48 of 125

Stamford Brook – Deliverable 6: APPENDIX 7 Web version - July 2007
Figure 7.16 Air leakage into the voids surrounding both sets of stairs.
Figure 7.17 Air leakage around the first floor perimeter, where the sealing was ineffective, missing or had
failed. The areas where the leakage appeared most severe were at corners and in less visible places such as inside the built-in wardrobe and under radiators.
Page 49 of 125

Stamford Brook – Deliverable 6: APPENDIX 7 Web version - July 2007
Figure 7.18 Air leakage around the second floor perimeter through gaps in the sealant in both bedrooms.
Figure 7.19 Air movement through unsealed gaps around the platform floor of the cylinder cupboard.
Figure 7.20 Leakage through the pipework penetrations for the radiator in the first floor bathroom.
Page 50 of 125

Stamford Brook – Deliverable 6: APPENDIX 7 Web version - July 2007
Figure 7.21 Points of air leakage around the bath panel and around the shower tray fascias.
Figure 7.22 Gaps around plumbing penetrations in the kitchen allowing air leakage into intermediate floor
void, the void behind the plasterboard and the void behind the kitchen units.
Figure 7.23 Air leakage around inadequately sealed electrical penetrations, including all the bathroom, en-
suite and downstairs WC ceiling-mounted light fittings.
Page 51 of 125

Stamford Brook – Deliverable 6: APPENDIX 7 Web version - July 2007
Figure 7.24 Air movement into the loft between the loft trap and door and at the junction of the loft hatch
and bedroom ceiling.
Figure 7.25 Air leakage at the rooflights in both the kitchen/diner and in the second floor rear bedroom.
Page 52 of 125

Stamford Brook – Deliverable 6: APPENDIX 7 Web version - July 2007
Page 53 of 125
Pressure Test Details 0.627482676 4.93741946
0.01174223 0.041635381
0.998601219 0.011810276
0.63750771 4.9703434040.014586822 0.0514757580.997910213 0.0147899590.627482676
date: Version 15a 13 October 2006
RESULTS:Mean Flow AT 50Pa = 1700.72 m3/h
ACH50 = 5.10 achAir Permeability at 50 Pa = 5.63 m/hEquivalent Leakage Area = 0.069 m2 at 10 Pa
OUT OF RANGE 1646.17 5.45 4.94OKOKOKOKOK
OUT OF RANGE 1755.27 5.81 5.27OUT OF RANGE
OKOKOKOK
Note: ENSURE THAT FLOW SETTINGS ARE IN M3/HR - When using the DG700 gauge you do not need to input a baseline pressure difference as this is calculated by the gauge and the readings adjusted automatically
4.93741946 139.4100318test house address: 0.63750771company: 4.970343404 144.0763553house type: 6tester: 6test reference number:outdoor temp (°C) 10.6 °Cindoor temp (°C) 16 °Coutdoor humidity (%rh) 69.1 %rhindoor humidity (%rh) 58.7 %rhoutdoor barometric pressure 1016 mbar or hPa kg/m3indoor barometric pressure 1016 mbar or hPa kg/m3temperature corr. fact. depress. 0.981temperature corr. fact. press. 1.019wind speed (m/s): 0.8baseline pressure diff (Pa) (+/-) Pahouse width: 5.51 mhouse depth: 8.19 mhouse height: 7.26 mfloor area: m2volume: 333.2 m3envelope area including floor: 302.3 m2Pressure Difference for ELA 10 Pa
DEPRESSURISATION RING (O=open or A,B,C,D,E)
MEASURED FAN PRESSURE (Pa)
MEASURED FLOW (m3/h)
FLOW RANGE OK FOR SELECTED RING?
Adjusted Pressure (Pa)
Ln delta P Ln Q Q50 Calculated Flow at 50Pa (m3/h)
Permeability Depress Only (m3/hr/m2)
ACH Depress Only (ach)
Approx 60 Pa b 58.6 1801 58.6 4.070735 7.477235Approx 50 Pa b 49.2 1644 49.2 3.895894 7.386026 r2 0.999Approx 40 Pa b 39.1 1442 39.1 3.666122 7.254924 C 0.039 m3/sApprox 30 Pa b 31.9 1250 31.9 3.462606 7.112037 n 0.627Approx 20 Pa b 23.5 1025 23.5 3.157 6.913586 C (corrected) 0.039 m3/sApprox 10 Pa b 17.8 862 17.8 2.879198 6.740393PRESSURISATION
RING (O=open or A,B,C,D,E)
MEASURED FAN PRESSURE (Pa)
MEASURED FLOW (m3/h)
FLOW RANGE OK FOR SELECTED RING?
Adjusted Pressure (Pa)
Ln P Ln Q Q50 Calculated Flow at 50Pa (m3/h)
Permeability Press Only (m3/hr/m2)
ACH Press Only (ach)
Approx 60 Pa b 54.4 1801 54.4 3.996364 7.514959Approx 50 Pa b 49 1705 49 3.89182 7.460182 r2 0.998Approx 40 Pa b 41.8 1508 41.8 3.732896 7.337401 C 0.040 m3/sApprox 30 Pa b 30.5 1273 30.5 3.417727 7.167993 n 0.638Approx 20 Pa b 23.6 1044 23.6 3.161247 6.969677 C (corrected) 0.040 m3/sApprox 10 Pa b 16.9 861 16.9 2.827314 6.776956
skirting sealed
Calculated Outdoor Air DensityCalculated Indoor Air Density
description of main construction details:
1.251.22
Model 3 with DG700Blower Door & Gauge Used
MINNEAPOLIS BLOWER DOOR DATA INPUT AND CALCULATION08/03/2007
R117
Plot 117 Stamford BrookRedrowAvondaleJW, DMS
DEPRESSURISATION
6.7
6.8
6.9
7
7.1
7.2
7.3
7.4
7.5
7.6
2 3 4 5
Ln delta P
Ln Q
PRESSURISATION
6.76.86.9
77.17.27.37.47.57.6
2 3 4 5
Ln delta P
Ln Q
Depressurisation
0
500
1000
1500
2000
0 25 50 75 100delta P
Q
Pressurisation
0
500
1000
1500
2000
0 25 50 75 100delta P
Q

Stamford Brook – Deliverable 6: APPENDIX 8 Web version - July 2007
Page 54 of 125
Appendix 8: Pressurisation Re-test of Bryant Plot 116
Figure 8.1 Bryant Plot 116
Dwelling Details 1. Plot 116 (figure 8.1) was originally selected for the second phase coheating test investigation
(Deliverable 7, Wingfield et al. 2007), but has also been included in the detailed airtightness study. It is a Chatsworth house type, 3-bedroom, semi-detached dwelling, built to the standard specification for Bryant at Stamford Brook. This pressurisation test was conducted after the coheating test being carried out and additional work had been performed in the dwelling (including the fitting of the kitchen and most of the 2nd fix plumbing work).
2. The pressure test was conducted in accordance with ATTMA’s Technical Standard 1: Measuring Air Permeability of Building Envelopes (ATTMA, 2006) with the dwelling not yet fully completed; hence a number of details required temporary sealing prior to the test being performed. Although generally the air barrier was complete at the time of the test, temporary sealing had to be applied where the handle was missing from the patio doors and a bedroom window mechanism was faulty (figure 1.2), there were also many open ends of soil and waste pipes which had to be temporarily sealed for the pressure test to take place.
Figure 1.2 Temporary sealing prior to pressurisation test

Stamford Brook – Deliverable 6: APPENDIX 8 Web version - July 2007
Pressure Test Results 3. The pressurisation re-test was performed on Bryant Plot 116 by the Leeds Met research team on
22nd March 2007, 3 months after the original test on the dwelling. Once again, the fan system used for the test was an Energy Conservatory Minneapolis Model 3 Blower Door equipped with a DG700 digital pressure gauge. A summary of the results are contained within Table 1.1.
Table 1.1 Pressure test results for Bryant plot 116.
Pressurisation Depressurisation Date ACH50 Equivalent leakage area
(m2 @ 10Pa)
Mean Air Permeability
(m3/(h.m2) @ 50Pa) r2 coefficient of determination
r2 coefficient of determination
Permeability (m3/(h.m2) @ 50Pa)
Permeability (m3/(h.m2) @ 50Pa)
22 Jan 2007 2.84 0.975 2.67 0.992 2.75 3.04 0.022
22 Mar 2007 3.55 0.998 5.59 0.999 3.57 3.95 0.030
4. The calculated mean air permeability for the dwelling was 3.57 m3/(h.m2) @ 50 Pa, still comfortably
below the target of 5 m3/(h.m2) @ 50 Pa. This compares favourably with recent test data from site and is comparable with results obtained from similar dwellings tested in February 2005.
Leakage Detection 5. Leakage detection was performed under dwelling pressurisation, at approximately 75 Pa above the
external pressure, using a handheld smoke puffer and recorded photographically. The main leakage paths observed during the test are listed below.
6. A number of direct leakage paths were observed at the bay window in the lounge. Shrinkage cracks at junctions around the frames, and gaps around sealants and decorators’ caulking, allowed air movement. Gaps between individual elements of the bay window were still present and the previously detected air leakage around the threshold still remained upon dwelling completion (figure 8.3).
7. Additional leakage paths were again detected around other windows. Figure 8.4 illustrates air leakage at the sill of the bathroom window, which was also observed in the initial pressure test and may become sealed upon tiling, and through shrinkage cracks beneath a bedroom window sill which may also improve (at least temporarily) upon decoration.
8. During the initial test air leakage was detected into a number of interconnected voids around the stairs. Some of these points of leakage were expected to be sealed when the dwelling is finished but this had not happened at the time of this re-test (figure 8.5).
9. As in the initial test, electrical service penetrations generally performed well, but some still provided points of air leakage which varied greatly in severity; from minor air flows through gaps around sockets, lights and switches to more substantive flows through some (but not all) open pattress boxes and holes for lighting under wall units in the kitchen, most severe was air movement around the electrical consumer unit (figure 8.6).
10. Many heating, plumbing and ventilation penetrations were not yet fully sealed and allowed air movement around them. As many of these are more likely to be hidden from view than the electrical penetrations it is more likely that sealing around them may be omitted. With the examples in figure 8.7, pipework for the boiler will subsequently be boxed in, radiator pipes are not in direct view and the soil, waste and supply pipes are often obscured sanitary ware and boxing-in. Penetrations and fixings beneath baths and shower trays will be obscured by fascia panels and may also not get fully sealed upon completion.
11. Significant examples of air leakage around electrical, plumbing and structural elements were all observed in the cylinder cupboard. Air movement through the open pattress in the partition wall, through gaps around pipework penetration the platform floor and around the platform floor perimeter were all consistently severe in comparison to similar air points of air leakage located elsewhere in the dwelling (figure 8.8).
12. Damage to a section of the intermediate floor in the master bedroom allowed air to enter the floor void as point of air leakage into an indirect leakage path. It is envisaged that this will be repaired
Page 55 of 125

Stamford Brook – Deliverable 6: APPENDIX 8 Web version - July 2007
prior to completion, and does not form part of the primary air barrier, but it is indicative of some of the more complex air leakage paths that exist in the dwelling (figure 8.9).
13. In the initial test, very little air movement was observed at junctions between the ground floors and walls as beads of sealant had be applied effectively, air leakage was only detected around a number of unfinished or inadequately sealed junctions. However in the re-test, leakage around the ground floor perimeter was commonplace, not only where the sealing had failed but also around the top of the skirting boards and at junctions of skirting boards in room corners (figure 8.10).
14. Air leakage at junctions of the walls and the intermediate floor had also deteriorated (figure 8.11).
15. When the dwelling was initially tested no air movement was observed at the opening for the loft hatch as it had been temporarily sealed. With the loft hatch now in position, air leakage was detected both around and through the loft hatch directly into the ventilated roof space (figure 8.12).
Figure 8.3 Air leakage at various places around the ground floor bay window.
Figure 8.4 Air leakage at window sills.
Page 56 of 125

Stamford Brook – Deliverable 6: APPENDIX 8 Web version - July 2007
Figure 8.5 Gaps around the stairs remaining unsealed.
Figure 8.6 Detected air movement at electrical service penetrations:
Page 57 of 125

Stamford Brook – Deliverable 6: APPENDIX 8 Web version - July 2007
Figure 8.7 Air leakage around various penetrations for heating, plumbing and ventilation services.
Figure 8.8 Air movement in the cylinder cupboard on the first floor.
Page 58 of 125

Stamford Brook – Deliverable 6: APPENDIX 8 Web version - July 2007
Figure 8.9 Damage to the intermediate floor in the front bedroom.
Figure 8.10 Junctions of the ground floor with external and separating walls displayed points of air leakage,
this was particularly noticeable at room corners.
Page 59 of 125

Stamford Brook – Deliverable 6: APPENDIX 8 Web version - July 2007
Figure 8.11 Air leakage detected at junctions of the intermediate floor with internal, external and separating
walls where the sealant had failed and at shrinkage cracks above the skirting boards.
Figure 8.12 The temporary sealing of the loft hatch when the dwelling was previously tested compared with
leakage around and through the loft hatch observed during the re-test.
Page 60 of 125

Stamford Brook – Deliverable 6: APPENDIX 8 Web version - July 2007
Page 61 of 125
Pressure Test Details 0.626784388 4.115892703
0.008892428 0.031305005
0.999195521 0.010632889
0.607167519 4.1801501890.011933011 0.042159640.998457332 0.0149700880.626784388
date: Version 15a 13 October 2006
RESULTS:Mean Flow AT 50Pa = 716.94 m3/h
ACH50 = 3.95 achAir Permeability at 50 Pa = 3.57 m/hEquivalent Leakage Area = 0.030 m2 at 10 Pa
OK 720.61 3.59 3.97OKOKOKOKOK
OK 713.27 3.55 3.93OKOKOKOKOK
Note: ENSURE THAT FLOW SETTINGS ARE IN M3/HR - When using the DG700 gauge you do not need to input a baseline pressure difference as this is calculated by the gauge and the readings adjusted automatically
4.115892703 61.30691869test house address: 0.607167519company: 4.180150189 65.3756712house type: 6tester: 6test reference number:outdoor temp (°C) 11.6 °Cindoor temp (°C) 10.6 °Coutdoor humidity (%rh) 70 %rhindoor humidity (%rh) 66 %rhoutdoor barometric pressure 1015 mbar or hPa kg/m3indoor barometric pressure 1015 mbar or hPa kg/m3temperature corr. fact. depress. 1.004temperature corr. fact. press. 0.996wind speed (m/s): 0.15baseline pressure diff (Pa) (+/-) Pahouse width: 4.61 mhouse depth: 7.738 mhouse height: 5 mfloor area: 37.02 m2volume: 181.53 m3envelope area including floor: 200.69 m2Pressure Difference for ELA 10 Pa
DEPRESSURISATION RING (O=open or A,B,C,D,E)
MEASURED FAN PRESSURE (Pa)
MEASURED FLOW (m3/h)
FLOW RANGE OK FOR SELECTED RING?
Adjusted Pressure (Pa)
Ln delta P Ln Q Q50 Calculated Flow at 50Pa (m3/h)
Permeability Depress Only (m3/hr/m2)
ACH Depress Only (ach)
Approx 60 Pa b 60.5 805 60.5 4.102643 6.694362Approx 50 Pa b 50.7 718 50.7 3.925926 6.579989 r2 0.999Approx 40 Pa b 40.1 614 40.1 3.691376 6.423515 C 0.017 m3/sApprox 30 Pa b 30.5 512 30.5 3.417727 6.241845 n 0.627Approx 20 Pa c 22.5 434 22.5 3.113515 6.076564 C (corrected) 0.017 m3/sApprox 10 Pa c 14.4 326 14.4 2.667228 5.790417PRESSURISATION
RING (O=open or A,B,C,D,E)
MEASURED FAN PRESSURE (Pa)
MEASURED FLOW (m3/h)
FLOW RANGE OK FOR SELECTED RING?
Adjusted Pressure (Pa)
Ln P Ln Q Q50 Calculated Flow at 50Pa (m3/h)
Permeability Press Only (m3/hr/m2)
ACH Press Only (ach)
Approx 60 Pa b 63.7 824 63.7 4.154185 6.710651Approx 50 Pa b 50 701 50 3.912023 6.548988 r2 0.998Approx 40 Pa b 42.7 640 42.7 3.754199 6.457948 C 0.018 m3/sApprox 30 Pa b 31.1 521 31.1 3.437208 6.25223 n 0.607Approx 20 Pa c 21.4 431 21.4 3.063391 6.062588 C (corrected) 0.018 m3/sApprox 10 Pa c 14.2 326 14.2 2.653242 5.783377
Model 3 with DG700Blower Door & Gauge Used
MINNEAPOLIS BLOWER DOOR DATA INPUT AND CALCULATION22/03/2007plot 116 stamford brookbryantchatsworthdm-s jw
retest after coheating - some further work done - e.g tiling, painting, radiators, boiler & vent - baseline pressure difference inside -0.3Pa lower than outside - had to seal around broken window in back bedroom
Calculated Outdoor Air DensityCalculated Indoor Air Density
description of main construction details:
1.241.24
DEPRESSURISATION
5.75.85.9
66.16.26.36.46.56.66.76.8
2 3 4 5
Ln delta P
Ln Q
PRESSURISATION
5.6
5.8
6
6.2
6.4
6.6
6.8
2 3 4 5
Ln delta P
Ln Q
Depressurisation
0
200
400
600
800
1000
0 25 50 75 100delta P
Q
Pressurisation
0
200
400
600
800
1000
0 25 50 75 100delta P
Q

Stamford Brook – Deliverable 6: APPENDIX 9 Web version - July 2007
Page 62 of 125
Appendix 9: Pressurisation Test of Bryant Plot 119
Figure 9.1 Bryant Plot 119
Dwelling Details 1. Plot 119 (figure 9.1) was selected for this investigation as the house design incorporates a number
of details known to have been problematic in previous airtightness tests performed at Stamford Brook. It is an XT2 house type, 2½ storey, 4-bedroom, semi-detached dwelling, built to the standard specification for Bryant at Stamford Brook.
2. The pressure test was conducted in accordance with ATTMA’s Technical Standard 1: Measuring Air Permeability of Building Envelopes (ATTMA, 2006) with the dwelling almost fully completed, the only remaining work to be performed on the property was some snagging, decorating and fitting of the back door furniture (figure 9.2). Although not comprehensive, the secondary sealing of many service penetrations into the intermediate floors and room perimeters on all 3 floors appeared to have been performed to a standard possibly superior to any other dwelling observed on this site to date (figure 9.3).
Figure 9.2 Temporary sealing to rear door.

Stamford Brook – Deliverable 6: APPENDIX 9 Web version - July 2007
Figure 9.3 A high standard of secondary sealing of many service penetrations and wall/floor junctions was
observed throughout most of plot B119.
Pressure Test Results 3. The pressurisation test was performed on Bryant Plot 119 by the Leeds Met research team on 17th
May 2007. The fan system used for the test was an Energy Conservatory Minneapolis Model 3 Blower Door equipped with a DG700 digital pressure gauge. The results are contained within Table 9.1.
Table 9.1 Pressure test results for Bryant plot 119, 17th May 2007.
Pressurisation Depressurisation Plot ACH50 Equivalent leakage area
(m2 @ 10Pa)
Mean Air Permeability
(m3/(h.m2) @ 50Pa) r2 coefficient of determination
r2 coefficient of determination
Permeability (m3/(h.m2) @ 50Pa)
Permeability (m3/(h.m2) @ 50Pa)
B119 2.87 0.994 2.90 0.998 2.89 2.50 0.034
4. The calculated mean air permeability for the dwelling was 2.89 m3/(h.m2) @ 50 Pa, well inside the
target figure for the site of 5 m3/(h.m2) @ 50 Pa. This result shows an improvement over the average results obtained for finished 2½ storey dwellings tested at Stamford Brook, and compares favourably with the result obtained from a similar 2½ storey end–terrace dwelling (3.7 m3/(h.m2) @ 50 Pa. for plot 78) tested in August 2006 by the Bryant site team.
Leakage Detection 5. With an internal/external temperature differential of 0.4 C° it was not possible to use thermal
imaging for leakage detection. Leakage detection was performed under dwelling pressurisation, at approximately 70 Pa above the external pressure, using a handheld smoke puffer and recorded photographically. The main leakage paths observed during the test are listed below.
6. Where sealant was applied at the ground floor/wall junctions it was done well with only a minor amount of air leakage detected in room corners under the intumescent strip in the door frames where no sealant was applied. More substantial leakage was observed in the utility room where the wall/floor junctions remained unfinished at areas which will be obscured by the kitchen units and soon to be installed white goods (figure 9.4).
7. The junctions between the 1st floor and the walls were particularly well sealed with air leakage only detected through a small number of slight gaps in the sealant and on the internal door frames
Page 63 of 125

Stamford Brook – Deliverable 6: APPENDIX 9 Web version - July 2007
where no sealant was applied at the bottom of the intumescent strips on the doors surrounding the protected stairwell (figure 9.5).
8. Air leakage into the 2nd intermediate floor through gaps between damaged flooring panels was detected in the front bedroom (figure 9.6).
9. As on the ground floor and 1st floor, the wall/floor junctions around the 2nd floor perimeter were generally very well sealed with air leakage only detected in less visible areas such as inside the cylinder cupboard and built-in wardrobe (figure 9.7).
10. In another example of air leakage through out-of-sight areas, a gap above the 2nd floor internal door frame in rear bedroom allowed notable air movement into the partition wall void (figure 9.8).
11. It was only possible to detect any air leakage at the top set of stairs, because the location of the blower door directly in front of the lower set made the air too turbulent for smoke puffers to be of use (figure 9.9).
12. The back door furniture had yet to be fitted, which resulted in the door not closing tightly enough to compress the draught-stripping adequately with some air leakage between the door and frame a consequence of this (figure 9.10).
13. A flexible sealant had been very well applied around the ground floor preventing air movement under the threshold and the skirting boards on the reveals, but the junction between the skirting boards and door frame had not been sealed and airflow through these remaining gaps was quite substantial compared to the leakage detected throughout the rest of the dwelling (figure 9.11).
14. In general the windows performed very well with no air leakage detected around trickle vents or the window casements. Some air movement was observed around a gap under the dining room window sill on the ground floor (figure 9.12) and a crack under a window sill in the lounge on the 1st floor.
15. Air leakage was detected around ground floor electrical penetrations in the dining room, kitchen and utility room on both internal and external walls, and around wiring for the security system in the kitchen and utility room (figure 9.13). It was not possible to detect air leakage around the electrical consumer unit with smoke puffers during dwelling pressurisation because of the close proximity of the blower door fan, however, under depressurisation some air movement could be felt emerging from there with the back of a hand.
16. Air was detected moving through wall mounted 1st floor electrical penetrations (both power and TV aerials) and through a number of central light fixings (figure 9.14).
17. Only a small amount of air movement was observed around 2nd floor electrical penetrations into the walls, at an apparent reduced rate to that observed on the 1st floor. However, there were a number of leakage points directly into the loft where a steady airflow, seemingly greater than for the 1st floor ceiling penetrations, was detected (figure 9.15). As well as airflow around cables penetrating the ceiling in the cylinder cupboard, air leakage was detected to varying extents around every ceiling mounted light fixing on the 2nd floor which appeared to range from slight leakage in the rear bedroom to more significant airflow in the front bedroom and en-suite.
18. Indirect air leakage was detected around ground floor plumbing penetrations; in the utility room around penetrations for the boiler into the void behind the plasterboard, under the kitchen sink and into the pipework boxing in the downstairs toilet. A possible direct air leakage path was also observed underneath the units in the utility room around the cold water supply pipe into the ground floor itself (figure 9.16).
19. In the 1st floor bathroom comparatively significant air movement was detected around the bath panel into the void beneath the bath where presumably penetrations had not been fully sealed as they were out of view. Additional leakage was detected around unsealed plumbing penetrations into the service void on the external wall (figure 9.17).
20. Air leakage around 2nd floor plumbing penetrations was observed in both en-suite bathrooms at unsealed penetrations into boxed in voids, walls and the intermediate floor (figure 9.18), the airflow through which appeared to be at a lesser intensity than that observed into the same floor void through the gap between the flooring panels at the front of the dwelling in figure 9.6. Unfortunately, without the necessary temperature difference required for the use of thermal imaging it was not possible to investigate further the movement of air within the floor void. In both showers sealant had been applied around the shower fittings around the top only, and air leakage was detected
Page 64 of 125

Stamford Brook – Deliverable 6: APPENDIX 9 Web version - July 2007
between the fitting and the tiles on the underside of each. Secondary sealing around the fascia panels for the shower trays in both en-suite bathrooms had been performed to a particularly high standard with virtual no air movement detected in what has previously been considered a problem detail.
21. In the cylinder cupboard indirect leakage was detected into the floor around unsealed or inappropriately sealed pipework, but of more concern were the gaps around the ventilation ducting providing a direct leakage path into the ventilated loft space (figure 9.19). The sealant had been applied around the ducting inappropriately, with no concerted attempt made to seal the less accessible areas around the back of the ducting.
22. All the radiators in the dwelling had pipework emerging from pattress boxes fitted with plastic covers but no sealing around the pipes. Air leakage was observed behind all radiators to varying extents (figure 9.20), but no pattern could be established between different floors or internal/external walls.
23. Infiltration was detected around all 3 rooflights located in the rear 2nd floor bedroom. The majority of the air movement was between the rooflights and frames (figure 9.21), with little air movement around the frames themselves – a leakage path which had been common in previously tested properties.
24. Gaps both through and around the loft hatch allowed air movement directly into the roof space (figure 9.22).
Figure 9.4 Minor air leakages at gaps in the sealant on the ground floor perimeter and at unfinished
junctions in the utility room.
Page 65 of 125

Stamford Brook – Deliverable 6: APPENDIX 9 Web version - July 2007
Figure 9.5 Air leakage was detected at gaps in the secondary sealing at the 1st floor bedroom perimeters
and the door between the lounge and landing.
Figure 9.6 Air leakage through a gap in the 2nd intermediate floor in the front bedroom.
Figure 9.7 The 2nd floor/wall junctions performed very well apart from a few small gaps around the rear
bedroom perimeter and in less visible areas, such as inside the cylinder cupboard and front bedroom built-in wardrobe.
Figure 9.8 Air leakage was detected above a 2nd floor internal door frame in the rear bedroom, where the
unsealed gap was hidden by the architrave.
Page 66 of 125

Stamford Brook – Deliverable 6: APPENDIX 9 Web version - July 2007
Figure 9.9 leakage at the stairs between the 1st and 2nd floors
Figure 9.10 Air leakage around the back door
Figure 9.11 Air leakage around the back door threshold.
Figure 9.12 Very little air movement was detected around the windows, this small hole at the sill in the dining room was one of the few examples observed.
Page 67 of 125

Stamford Brook – Deliverable 6: APPENDIX 9 Web version - July 2007
Figure 9.13 Air leakage through ground floor electrical penetrations in the dining room, kitchen and utility
room.
Figure 9.14 Air leakage at 1st floor electrical penetrations at a bedroom aerial socket and through a power
socket and lighting rose in the lounge.
Figure 9.15 Air movement through 2nd floor electrical sockets in the front bedroom, and into the loft via
cables in the cylinder cupboard and light fixings in the landing, en-suite and rear bedroom.
Page 68 of 125

Stamford Brook – Deliverable 6: APPENDIX 9 Web version - July 2007
Figure 9.16 Air leakage around ground floor plumbing penetrations in the utility room, kitchen and WC.
Figure 9.17 Air movement in the 1st floor bathroom was detected into the void under the bath and around
plumbing penetrations into the service void.
Page 69 of 125

Stamford Brook – Deliverable 6: APPENDIX 9 Web version - July 2007
Figure 9.18 Air leakage around 2nd floor plumbing penetrations in both en-suite bathrooms, with no sealant applied to the underside of the shower control unit. Air leakage around the shower tray fascia panels was
far less than expected due to capably applied sealant.
Page 70 of 125

Stamford Brook – Deliverable 6: APPENDIX 9 Web version - July 2007
Figure 9.19 Air leakage around penetrations into the cylinder cupboard floor and ceiling, and photographs
showing where the sealant was not applied comprehensively.
Figure 9.20 At all radiator pipework some air leakage was observed, with no apparent patterns between
rate of leakage and position of radiator.
Figure 9.21 All 3 rooflights allowed some direct infiltration.
Page 71 of 125

Stamford Brook – Deliverable 6: APPENDIX 9 Web version - July 2007
Figure 9.22 Air movement directly into the roof space through and around the loft hatch.
Page 72 of 125

Stamford Brook – Deliverable 6: APPENDIX 9 Web version - July 2007
Page 73 of 125
Pressure Test Details 0.704123888 4.006875377
0.015285341 0.05350982
0.998118543 0.019421959
0.599793837 4.4009026610.02313153 0.080292799
0.994085901 0.030348790.704123888
date: Version 15a 13 October 2006
RESULTS:Mean Flow AT 50Pa = 858.33 m3/h
ACH50 = 2.50 achAir Permeability at 50 Pa = 2.89 m/hEquivalent Leakage Area = 0.034 m2 at 10 Pa
OK 864.07 2.90 2.52OKOKOKOKOK
OK 852.59 2.87 2.48OKOKOKOKOK
Note: ENSURE THAT FLOW SETTINGS ARE IN M3/HR - When using the DG700 gauge you do not need to input a baseline pressure difference as this is calculated by the gauge and the readings adjusted automatically
4.006875377 54.97482632test house address: 0.599793837company: 4.400902661 81.52442441house type: 6tester: 6test reference number:outdoor temp (°C) 17.2 °Cindoor temp (°C) 16.8 °Coutdoor humidity (%rh) 81 %rhindoor humidity (%rh) 80.4 %rhoutdoor barometric pressure 1006 mbar or hPa kg/m3indoor barometric pressure 1006 mbar or hPa kg/m3temperature corr. fact. depress. 1.001temperature corr. fact. press. 0.999wind speed (m/s): 2.6baseline pressure diff (Pa) (+/-) Pahouse width: 5.18 mhouse depth: 9.31 mhouse height: 7.29 mfloor area: 48.2 m2volume: 343.4 m3envelope area including floor: 297.5 m2Pressure Difference for ELA 10 Pa
DEPRESSURISATION RING (O=open or A,B,C,D,E)
MEASURED FAN PRESSURE (Pa)
MEASURED FLOW (m3/h)
FLOW RANGE OK FOR SELECTED RING?
Adjusted Pressure (Pa)
Ln delta P Ln Q Q50 Calculated Flow at 50Pa (m3/h)
Permeability Depress Only (m3/hr/m2)
ACH Depress Only (ach)
Approx 60 Pa b 59.7 978 59.7 4.089332 6.886889Approx 50 Pa b 51.2 870 51.2 3.93574 6.769873 r2 0.998Approx 40 Pa b 39.5 718 39.5 3.676301 6.577849 C 0.015 m3/sApprox 30 Pa b 30.7 628 30.7 3.424263 6.443919 n 0.704Approx 20 Pa c 21.8 488 21.8 3.08191 6.191695 C (corrected) 0.015 m3/sApprox 10 Pa c 13 329 13 2.564949 5.797437PRESSURISATION
RING (O=open or A,B,C,D,E)
MEASURED FAN PRESSURE (Pa)
MEASURED FLOW (m3/h)
FLOW RANGE OK FOR SELECTED RING?
Adjusted Pressure (Pa)
Ln P Ln Q Q50 Calculated Flow at 50Pa (m3/h)
Permeability Press Only (m3/hr/m2)
ACH Press Only (ach)
Approx 60 Pa b 60.5 958 60.5 4.102643 6.863468Approx 50 Pa b 48 816 48 3.871201 6.703035 r2 0.994Approx 40 Pa b 40.7 740 40.7 3.706228 6.605271 C 0.023 m3/sApprox 30 Pa b 29.6 653 29.6 3.387774 6.480198 n 0.600Approx 20 Pa c 19.3 488 19.3 2.960105 6.188936 C (corrected) 0.023 m3/sApprox 10 Pa c 12.8 368 12.8 2.549445 5.906704
Model 3 with DG700Blower Door & Gauge Used
MINNEAPOLIS BLOWER DOOR DATA INPUT AND CALCULATION17/05/2007
B119
Plot 119 Stamford BrookBryantXT2JW, DM-S
2½ storey full-fill cavity masonry, 4-bed end-terrace, parging layer to all external & party walls.
Calculated Outdoor Air DensityCalculated Indoor Air Density
description of main construction details:
1.201.20
DEPRESSURISATION
5.6
5.8
6
6.2
6.4
6.6
6.8
7
2 3 4 5
Ln delta P
Ln Q
PRESSURISATION
5.8
6
6.2
6.4
6.6
6.8
7
2 3 4 5
Ln delta P
Ln Q
Depressurisation
0200400600800
10001200
0 25 50 75 100delta P
Q
Pressurisation
0200400600800
10001200
0 25 50 75 100delta P
Q

Stamford Brook – Deliverable 6: APPENDIX 10 Web version - July 2007
Page 74 of 125
Appendix 10: Pressurisation Test of Bryant Plot 120
Figure 10.1 Bryant Plot 120
Dwelling Details 1. Plot 120 (figure 10.1) was selected for this investigation as the house design incorporates a
number of details known to have been problematic in previous airtightness tests performed at Stamford Brook. It is an XT house type, 2½ storey, 4-bedroom, semi-detached dwelling, built to the standard specification for Bryant at Stamford Brook.
2. The pressure test was conducted in accordance with ATTMA’s Technical Standard 1: Measuring Air Permeability of Building Envelopes (ATTMA, 2006) with the dwelling almost fully completed, the only remaining work to be performed on the property was decorating and finishing in the utility room; the primary air barrier was intact throughout. As with plot B119, secondary sealing had been applied conscientiously particularly the floor perimeters (figure 10.2).
Figure 10.2 Secondary sealing of the floor perimeters in the dining room and hall.
Pressure Test Results 3. The pressurisation test was performed on Bryant Plot 120 by the Leeds Met research team on 27th
February 2007. The fan system used for the test was an Energy Conservatory Minneapolis Model 3 Blower Door equipped with a DG700 digital pressure gauge. The results are contained within Table 10.1.

Stamford Brook – Deliverable 6: APPENDIX 10 Web version - July 2007
Table 10.1 Pressure test results for Bryant plot 120, 17th May 2007.
Pressurisation Depressurisation Plot ACH50 Equivalent leakage area
(m2 @ 10Pa)
Mean Air Permeability
(m3/(h.m2) @ 50Pa) r2 coefficient of determination
r2 coefficient of determination
Permeability (m3/(h.m2) @ 50Pa)
Permeability (m3/(h.m2) @ 50Pa)
B120 3.61 0.996 3.67 0.999 3.64 3.15 0.046
4. The calculated mean air permeability for the dwelling was 3.64 m3/(h.m2) @ 50 Pa, inside the target
figure for the site of 5 m3/(h.m2) @ 50 Pa. This result shows an improvement over the average results obtained for finished 2½ storey dwellings tested at Stamford Brook, but not as low as the result obtained for the next-door plot B119 (2.89 m3/(h.m2) @ 50 Pa tested earlier the same day), the end-terraced variation of the XT house design without a first floor balcony door.
Leakage Detection 5. As with plot B119, the internal/external temperature differential (1.8 C°) was insufficient to use
thermal imaging. Leakage detection had to be performed under dwelling pressurisation, at approximately 75 Pa above the external pressure, using a handheld smoke puffer and recorded photographically. The main leakage paths observed during the test are listed below.
6. Generally the floor/wall junctions were very well sealed at the bottom of the skirting boards with only a small amount of leakage detected at the base of the intumescent strips in the door frames and a few slight gaps in the sealant, however there were a number of points of leakage at the top of the skirting and at junctions between skirting boards. However, the leakage at the unfinished floor/wall junction in the utility room was far greater than any of the others and one of the worst performing area of the dwelling in airtightness terms (figure 10.3).
7. Air leakage at the wall/floor junctions on the 1st floor was limited to a few gaps around the door frames, where some doorways had no sealant at the base of the intumescent strips yet others were entirely sealed (figure 10.4).
8. Air leakage was detected into the 1st floor void through gaps around repairs made to the floor in the lounge and not sealed around (figure 10.5).
9. The wall/floor junctions on the 2nd floor had been sealed with a flexible sealant and no air leakage was detected in the 2nd floor bedrooms, even in the less visible areas such as the built-in wardrobe. (figure 10.6).
10. Although gaps were visible around the risers in the stairs, it was not possible to detect points of air leakage using the smoke puffers as the upward flow of air was too great due to the proximity of the blower door.
11. As no key drop was fitted air was free to move through the keyhole in the back door. Air leakage was also detected between the door and the frame adjacent to the latch and locks (figure 10.7).
12. It was not possible to detect any air movement around the front door threshold due to the blower door fan placed there for the pressurisation test. At the back door the only air movement observed was at the junction of the door frame and skirting board (figure 10.8) with all the junctions with the floor appearing to be well sealed.
13. Air leakage was detected at a number of small gaps and cracks around the window sills, both under the sills and at the frame/sill junctions (figure 10.9).
14. The expected significant air leakage pattern around the 1st floor balcony doors did not arise. The only detected air movement was at a small number of small gaps in the sealant at the threshold and around the skirting boards at the reveal, and a small gap between the skirting and door frame that had not been sealed (figure 10.10). The junction between the flooring panels directly in front of the balcony, which had been pinpointed as a problem in previously tested dwellings, had been very effectively sealed.
15. A low level of air movement was detected around many ground floor electrical penetrations, comparatively minor amounts of air leakage were detected around sockets, light fittings and wiring for the security system (figure 10.11).
Page 75 of 125
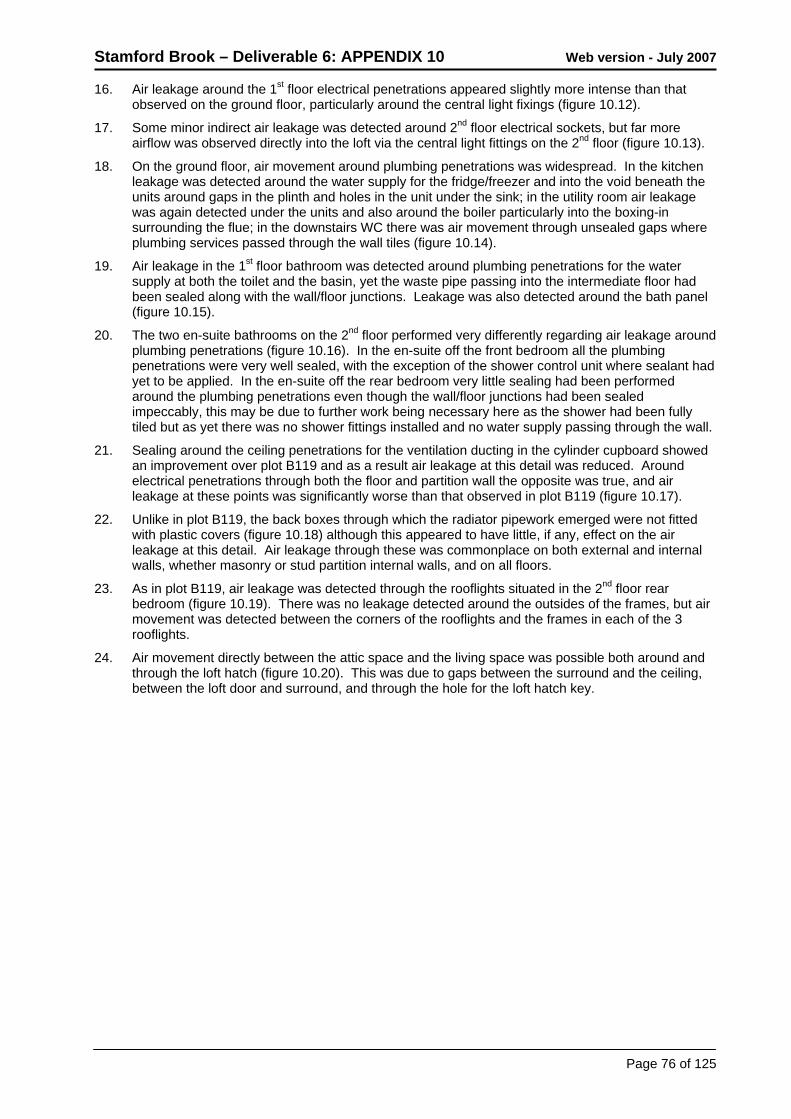
Stamford Brook – Deliverable 6: APPENDIX 10 Web version - July 2007
16. Air leakage around the 1st floor electrical penetrations appeared slightly more intense than that observed on the ground floor, particularly around the central light fixings (figure 10.12).
17. Some minor indirect air leakage was detected around 2nd floor electrical sockets, but far more airflow was observed directly into the loft via the central light fittings on the 2nd floor (figure 10.13).
18. On the ground floor, air movement around plumbing penetrations was widespread. In the kitchen leakage was detected around the water supply for the fridge/freezer and into the void beneath the units around gaps in the plinth and holes in the unit under the sink; in the utility room air leakage was again detected under the units and also around the boiler particularly into the boxing-in surrounding the flue; in the downstairs WC there was air movement through unsealed gaps where plumbing services passed through the wall tiles (figure 10.14).
19. Air leakage in the 1st floor bathroom was detected around plumbing penetrations for the water supply at both the toilet and the basin, yet the waste pipe passing into the intermediate floor had been sealed along with the wall/floor junctions. Leakage was also detected around the bath panel (figure 10.15).
20. The two en-suite bathrooms on the 2nd floor performed very differently regarding air leakage around plumbing penetrations (figure 10.16). In the en-suite off the front bedroom all the plumbing penetrations were very well sealed, with the exception of the shower control unit where sealant had yet to be applied. In the en-suite off the rear bedroom very little sealing had been performed around the plumbing penetrations even though the wall/floor junctions had been sealed impeccably, this may be due to further work being necessary here as the shower had been fully tiled but as yet there was no shower fittings installed and no water supply passing through the wall.
21. Sealing around the ceiling penetrations for the ventilation ducting in the cylinder cupboard showed an improvement over plot B119 and as a result air leakage at this detail was reduced. Around electrical penetrations through both the floor and partition wall the opposite was true, and air leakage at these points was significantly worse than that observed in plot B119 (figure 10.17).
22. Unlike in plot B119, the back boxes through which the radiator pipework emerged were not fitted with plastic covers (figure 10.18) although this appeared to have little, if any, effect on the air leakage at this detail. Air leakage through these was commonplace on both external and internal walls, whether masonry or stud partition internal walls, and on all floors.
23. As in plot B119, air leakage was detected through the rooflights situated in the 2nd floor rear bedroom (figure 10.19). There was no leakage detected around the outsides of the frames, but air movement was detected between the corners of the rooflights and the frames in each of the 3 rooflights.
24. Air movement directly between the attic space and the living space was possible both around and through the loft hatch (figure 10.20). This was due to gaps between the surround and the ceiling, between the loft door and surround, and through the hole for the loft hatch key.
Page 76 of 125

Stamford Brook – Deliverable 6: APPENDIX 10 Web version - July 2007
Figure 10.3 Air leakage at a doorframe and under the skirting in the dining room, and at junctions and over
the skirting in the kitchen, WC and dining room. More significant leakage at the unfinished floor/wall junction in the utility room.
Figure 10.4 Air leakage at the frame/floor junctions on the 1st floor off the landing; at the bathroom and at either side of the lounge door with one side allowing air movement and the other side impeccably sealed.
Figure 10.5 Air movement into the 1st floor void through gaps around repairs to the floor in the lounge.
Page 77 of 125

Stamford Brook – Deliverable 6: APPENDIX 10 Web version - July 2007
Figure 10.6 No air leakage was detected around the floor perimeters in the 2nd floor bedrooms due to the
well applied sealant, even in the less visible areas such as the built-in wardrobe.
Figure 10.7 With no key drop fitted air leakage occurred through the keyhole of the back door, also air
movement was detected between the door and frame where the locks were situated.
Figure 10.8 At the rear door threshold leakage was detected only at the frame/skirting board junction.
Figure 10.9 Air leakage detected around the window sills in the dining room and kitchen.
Page 78 of 125
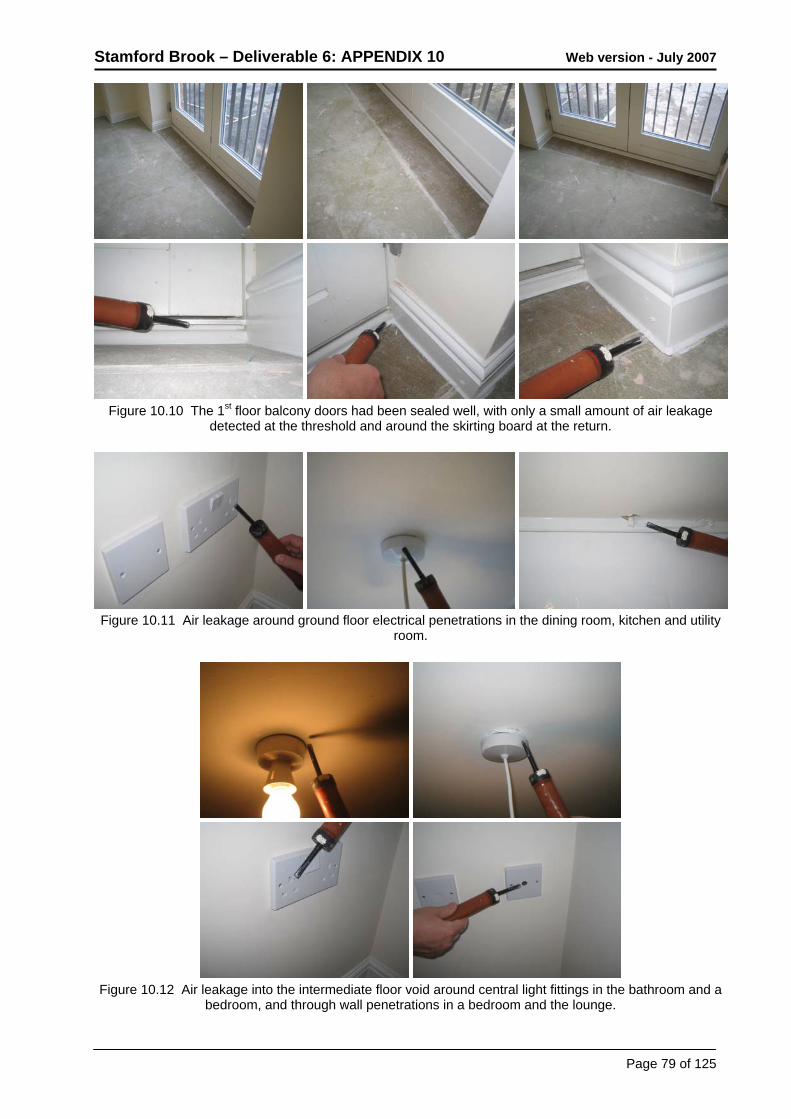
Stamford Brook – Deliverable 6: APPENDIX 10 Web version - July 2007
Figure 10.10 The 1st floor balcony doors had been sealed well, with only a small amount of air leakage
detected at the threshold and around the skirting board at the return.
Figure 10.11 Air leakage around ground floor electrical penetrations in the dining room, kitchen and utility
room.
Figure 10.12 Air leakage into the intermediate floor void around central light fittings in the bathroom and a
bedroom, and through wall penetrations in a bedroom and the lounge.
Page 79 of 125

Stamford Brook – Deliverable 6: APPENDIX 10 Web version - July 2007
Figure 10.13 Direct air leakage into the loft space around light fittings in an en-suite and the rear bedroom.
Figure 10.14 On the ground floor around plumbing penetrations in the kitchen (around the water supply for the fridge/freezer and under the units), in the utility room (around the boiler and under the units), and in the
downstairs WC.
Figure 10.15 Air leakage was detected into the service void in the 1st floor bathroom around plumbing
penetrations for the toilet and basin water supplies and also around the bath panel.
Page 80 of 125

Stamford Brook – Deliverable 6: APPENDIX 10 Web version - July 2007
Figure 10.16 On the 2nd floor the en-suite off the front bedroom had all plumbing penetrations sealed
around very well except the shower control unit and air leakage was also detected between the shower tray and fascia panel; in the en-suite off the rear bedroom air leakage was observed around most floor and wall
penetrations as they had not yet been sealed.
Figure 10.17 In the cylinder cupboard air leakage directly into the loft around the ventilation ducting was
reduced from that observed in plot B119, but still detectable. Air movement through electrical penetrations in both the floor and wall was appreciably larger than in plot B119.
Page 81 of 125

Stamford Brook – Deliverable 6: APPENDIX 10 Web version - July 2007
Figure 10.18 Behind the radiators air movement into the walls, around the pipework, was normal,
examples shown are from the a first floor bedroom on an external wall and from the ground floor WC on a masonry internal wall.
Figure 10.19 Air leakage through the rooflights in the 2nd floor rear bedroom.
Figure 10.20 Direct air leakage into the loft around and through the loft hatch.
Page 82 of 125

Stamford Brook – Deliverable 6: APPENDIX 10 Web version - July 2007
Page 83 of 125
Pressure Test Details 0.622468233 4.557467678
0.007366284 0.026321545
0.99944014 0.007362979
0.589206156 4.673661480.01912685 0.0672008350.99580255 0.024982643
0.622468233
date: Version 15a 13 October 2006
RESULTS:Mean Flow AT 50Pa = 1082.56 m3/h
ACH50 = 3.15 achAir Permeability at 50 Pa = 3.64 m/hEquivalent Leakage Area = 0.046 m2 at 10 Pa
OK 1091.49 3.67 3.18OKOKOKOKOK
OK 1073.62 3.61 3.13OKOKOKOKOK
Note: ENSURE THAT FLOW SETTINGS ARE IN M3/HR - When using the DG700 gauge you do not need to input a baseline pressure difference as this is calculated by the gauge and the readings adjusted automatically
4.557467678 95.34173794test house address: 0.589206156company: 4.67366148 107.0891302house type: 6tester: 6test reference number:outdoor temp (°C) 16.1 °Cindoor temp (°C) 17.9 °Coutdoor humidity (%rh) 81 %rhindoor humidity (%rh) 75.4 %rhoutdoor barometric pressure 1008 mbar or hPa kg/m3indoor barometric pressure 1008 mbar or hPa kg/m3temperature corr. fact. depress. 0.994temperature corr. fact. press. 1.006wind speed (m/s): 2.1baseline pressure diff (Pa) (+/-) Pahouse width: 5.18 mhouse depth: 9.31 mhouse height: 7.29 mfloor area: 48.2 m2volume: 343.4 m3envelope area including floor: 297.5 m2Pressure Difference for ELA 10 Pa
DEPRESSURISATION RING (O=open or A,B,C,D,E)
MEASURED FAN PRESSURE (Pa)
MEASURED FLOW (m3/h)
FLOW RANGE OK FOR SELECTED RING?
Adjusted Pressure (Pa)
Ln delta P Ln Q Q50 Calculated Flow at 50Pa (m3/h)
Permeability Depress Only (m3/hr/m2)
ACH Depress Only (ach)
Approx 60 Pa b 59.9 1227 59.9 4.092677 7.106121Approx 50 Pa b 50 1095 50 3.912023 6.992303 r2 0.999Approx 40 Pa b 42 979 42 3.73767 6.880325 C 0.026 m3/sApprox 30 Pa b 30.4 812 30.4 3.414443 6.693293 n 0.622Approx 20 Pa b 25.7 717 25.7 3.246491 6.568869 C (corrected) 0.027 m3/sApprox 10 Pa b 18.1 583 18.1 2.895912 6.36198PRESSURISATION
RING (O=open or A,B,C,D,E)
MEASURED FAN PRESSURE (Pa)
MEASURED FLOW (m3/h)
FLOW RANGE OK FOR SELECTED RING?
Adjusted Pressure (Pa)
Ln P Ln Q Q50 Calculated Flow at 50Pa (m3/h)
Permeability Press Only (m3/hr/m2)
ACH Press Only (ach)
Approx 60 Pa b 62.7 1250 62.7 4.138361 7.137106Approx 50 Pa b 51 1073 51 3.931826 6.984421 r2 0.996Approx 40 Pa b 42 964 42 3.73767 6.877298 C 0.030 m3/sApprox 30 Pa b 30.5 769 30.5 3.417727 6.651298 n 0.589Approx 20 Pa b 20.4 625 20.4 3.015535 6.443959 C (corrected) 0.030 m3/sApprox 10 Pa c 13.4 502 13.4 2.595255 6.224807
Model 3 with DG700Blower Door & Gauge Used
MINNEAPOLIS BLOWER DOOR DATA INPUT AND CALCULATION17/05/2007
B120
Plot 120 Stamford BrookBryantXTJW, DM-S
2½ storey full-fill cavity masonry, 4-bed mid-terrace, parging layer to all external & party walls.
Calculated Outdoor Air DensityCalculated Indoor Air Density
description of main construction details:
1.211.20
DEPRESSURISATION
6.3
6.4
6.5
6.6
6.7
6.8
6.9
7
7.1
7.2
2 3 4 5
Ln delta P
Ln Q
PRESSURISATION
6
6.2
6.4
6.6
6.8
7
7.2
2 3 4 5
Ln delta P
Ln Q
Depressurisation
0200400600800
100012001400
0 25 50 75 100delta P
Q
Pressurisation
0200400600800
100012001400
0 25 50 75 100delta P
Q

Stamford Brook – Deliverable 6: APPENDIX 11 Web version - July 2007
Page 84 of 125
Appendix 11: Pressurisation Test of Bryant Plot 121
Figure 11.1 Bryant Plot 121
Dwelling Details 25. Plot 121 (figure 11.1) was selected for this investigation as the house design incorporates a
number of details known to have been problematic in previous airtightness tests performed at Stamford Brook. It is an XT2 house type, 2½ storey, 4-bedroom, end-terraced dwelling, built to the standard specification for Bryant at Stamford Brook.
26. The pressure test was conducted in accordance with ATTMA’s Technical Standard 1: Measuring Air Permeability of Building Envelopes (ATTMA, 2006) with the dwelling not yet fully completed but with the primary air barrier intact. The remaining work still to be performed on the property was reparatory work to ceilings in the kitchen and bathroom and to walls in the utility room and WC; some snagging and finishing involving sealing of the wall/floor junctions and plumbing penetrations; bath and shower panels to be fitted, plinths fitted in the kitchen and utility room, and door furniture and draught-stripping to be completed. Figure 11.2 shows the temporary sealing carried out prior to the test being undertaken. The dwelling will be re-tested after all the finishing and additional secondary sealing has been carried out.
Figure 11.2 Temporary sealing in the kitchen, 1st floor bathroom and over penetrations through the back
door in the utility room.

Stamford Brook – Deliverable 6: APPENDIX 11 Web version - July 2007
Pressure Test Results 27. The pressurisation test was performed on Bryant Plot 121 by the Leeds Met research team on 24th
May 2007. The fan system used for the test was an Energy Conservatory Minneapolis Model 3 Blower Door equipped with a DG700 digital pressure gauge. The results are contained within Table 11.1.
Table 11.1 Pressure test results for Bryant plot 121, 24th May 2007. Pressurisation Depressurisation Plot ACH50 Equivalent
leakage area (m2 @ 10Pa)
Mean Air Permeability
(m3/(h.m2) @ 50Pa) r2 coefficient of determination
r2 coefficient of determination
Permeability (m3/(h.m2) @ 50Pa)
Permeability (m3/(h.m2) @ 50Pa)
B121 4.16 0.999 4.17 0.999 4.17 3.61 0.048
28. The calculated mean air permeability for the dwelling was 4.17 m3/(h.m2) @ 50 Pa, within the target
figure for the site of 5 m3/(h.m2) @ 50 Pa. This result shows an improvement over the average results obtained for finished 2½ storey dwellings tested at Stamford Brook, but compares unfavourably with the result obtained from a similar dwellings (2.89 m3/(h.m2) @ 50 Pa. for plot B119) tested the previous week but in a completed state. It is envisaged that with the rear door draught-stripped and the secondary sealing applied to a similar standard as observed in plots B119 and B120, the air permeability for this dwelling could improve to a value similar to that measured in plot B119.
Leakage Detection 29. Leakage detection was performed under dwelling pressurisation at approximately 75 Pa above the
external pressure, using a handheld smoke puffer and recorded photographically; and under dwelling depressurisation at approximately 65 Pa below external using infrared thermography using a FLIR Thermocam B4 IR camera. The internal/external temperature differential of only 2.3 C° limited this as method of analysis but some illustrative examples are included in this report. The main leakage paths observed during the test are listed below.
30. The floor/wall junctions on the ground floor had yet to be sealed at the bottom of the skirting boards and air leakage was observed around the room perimeters most noticeably in the room corners and in the downstairs WC which was still very much work in progress. The leakage at the unfinished floor/wall junctions in the kitchen and utility room behind the units was far greater than at any of the other points and were amongst the worst performing areas of the dwelling in terms of airtightness (figure 11.3).
31. Air leakage at the wall/floor junctions on the 1st floor was detected at numerous places around the room perimeters. No sealant had yet been applied between the skirting boards and floor and leakage was detected at this junction on internal walls, external walls and the party wall (figure 11.4).
32. Air leakage was detected into the 1st floor void through gaps around repairs made to the floor in one of the bedrooms next to a load bearing internal wall which had not been sealed around (figure 11.5).
33. The wall/floor junctions on the 2nd floor had not yet been sealed with a flexible sealant and infiltration was detected to varying extents around room perimeters, at comparable rates to those observed on the 1st floor but with a reduced rate of leakage on internal walls (figure 11.6).
34. Air was detected moving into the 2nd floor void through a hole in the lounge floor which had yet to be repaired (figure 11.7).
35. It was not possible to detect any air movement around the front door threshold due to the blower door fan placed there for the pressurisation test, but some airflow was observed at the door head which had not been fully finished. At the back door threshold air movement was observed at the unsealed junction of the door frame and skirting board, but most of the airflow was between the door and the frame as the draught-stripping had yet to be installed (figure 11.8).
36. In the 1st floor bathroom work around the window sill was not complete resulting in major infiltration at this point. Air leakage was also detected at a number of small gaps and cracks around the
Page 85 of 125

Stamford Brook – Deliverable 6: APPENDIX 11 Web version - July 2007
window frames and sills, both under the sills and at the frame/wall junctions (figure 11.9). Despite the small internal/external temperature differential it was still possible to see cooler air being drawn in to the void behind the dry-lining around the window sills when the dwelling was depressurised.
37. It was not possible to detect air leakage at the lower set of stairs using smoke puffers because of too much airflow due to the close proximity of the blower door, or using IR imaging because on insufficient temperature differential, but on the upper staircase smoke could be observed disappearing into many of the small joints (figure 11.10).
38. Air movement was detected around many ground floor electrical penetrations, albeit comparatively minor, with leakage being detected around light fittings and wiring for the security system. Around the consumer unit it was not possible to use smoke detection due to the close proximity of the blower door causing too much turbulence, however even with the small temperature differential it was possible to see cooler air emerging from around it using thermal imaging under dwelling depressurisation (figure 11.11).
39. Air leakage was detected around many 1st floor electrical penetrations appearing slightly more intense on internal partition walls than on external walls. The shaver socket in the bathroom which backed onto a service void and the central light fixings were the worst performing electrical penetrations on this floor (figure 11.12).
40. Some minor indirect air leakage was detected around 2nd floor electrical sockets on internal partition walls, a slightly greater amount was detected at similar details on the party wall and around the shaver socket in the rear en-suite which was positioned on the service void. Significantly more airflow was observed directly into the loft via the ceiling mounted light fittings on the 2nd floor, where any sealing previously observed around the wiring had been displaced (figure 11.13).
41. On the ground floor, air movement around plumbing penetrations was widespread as few of them had been fully finished. Comparatively, the worst air movement detected around these penetrations appeared to be airflow into the 1st floor void around pipework for the boiler (figure 11.14).
42. Air leakage in the 1st floor bathroom was detected around the unsealed plumbing penetrations for the water supply and soil pipe for the toilet and around the pipework for the basin, with air moving into the same service void. However the greatest movement of air into this void was through an excessively large hole made for services for the bath, which may remain unsealed on completion of the dwelling as it will be hidden from view once the bath panel has been fitted (figure 11.15).
43. The two en-suite bathrooms on the 2nd floor both performed poorly regarding air leakage around plumbing penetrations with none of the penetrations yet sealed (figure 11.16). In both en-suites air movement into the intermediate floor was detected around the waste pipes for the hand basins. However the bulk of the air movement was around the showers where the plasterboard had been cut away to allow the shower trays to be fitted allowing significant air movement into the partition walls, some airflow was also detected around the shower control units where sealant had yet to be applied.
44. Sealing around the ceiling penetrations for the ventilation ducting in the cylinder cupboard was absent and as a result air leakage at this detail was detectable through both smoke detection and thermal imaging. Around electrical penetrations through both the floor and partition wall air movement was also observed, with the infrared imaging showing cooler air entering at the wall penetration indicating that the air path here was likely to be directly from the loft space. Air movement was also observed through plumbing penetrations and junctions of the platform floor supporting the hot water cylinder (figure 11.17).
45. Although back boxes through which the radiator pipework emerged had been fitted with plastic covers throughout plot B121 air leakage through these details was detected behind most radiators, appearing to be most severe on radiators sited on internal partition walls on the 1st and 2nd floors (figure 11.18).
46. As in plots B119 and B120, air leakage was detected through the rooflights situated in the 2nd floor rear bedroom (figure 11.19). There was leakage detected around the outsides of the frames on only one of them, but between the corners of the rooflights and the frames in all 3 rooflights.
Page 86 of 125

Stamford Brook – Deliverable 6: APPENDIX 11 Web version - July 2007
47. Air movement directly between the attic space and the living space was possible around the loft hatch (figure 11.20). This was due to gaps between the surround and the ceiling, which had yet to be adequately sealed, and through the hole for the loft hatch key.
48. Although the internal/external temperature differential was reported as 2.3C° it was actually slightly greater on the 2nd floor as this was 2° warmer than the rest of the house, this made it possible to observe some of the air movement from the loft into the partition wall voids and the dry-lining voids around the loft boundary under dwelling depressurisation, as cooler air was being drawn into the habitable space directly from the loft (figure 11.21). Along the party wall in the front bedroom the slight thermal bridging of the timber in the sloping roof section could be seen along with some air movement through gaps in the continuous ribbons of adhesive at the wall/ceiling junction and some air movement and bridging in the partition wall. In the rear bedroom direct sunlight on the sloping roof section made any thermal imaging analysis impossible, but at the junctions with the party and gable walls some cooler areas behind the plasterboard could be distinguished. On the landing cooler air could be observed on the separating wall and moving into the partition wall creating some slight compartmentalisation of sectors between the studs. In the front en-suite air movement around dabs and the service void could also be observed.
Figure 11.3 Air leakage at wall/floor junctions on the ground floor, under the skirting in the dining room and
utility room, in the downstairs WC, and in hidden areas behind units in the kitchen and utility.
Page 87 of 125

Stamford Brook – Deliverable 6: APPENDIX 11 Web version - July 2007
Figure 11.4 Air leakage at the unsealed wall/floor junctions on the 1st floor; along and internal wall, the
separating wall and the corner of 2 external walls.
Figure 11.5 Air movement into the 1st floor void through gaps in the flooring panels.
Figure 11.6 Infiltration detected at wall/floor junctions in the 2nd floor front bedroom on the external wall and
adjacent party wall.
Figure 11.7 A hole in the 2nd floor in the lounge allowing air to enter the floor void.
Page 88 of 125

Stamford Brook – Deliverable 6: APPENDIX 11 Web version - July 2007
Figure 11.8 Air leakage at the unfinished head of the front door and at the back door, where the draught-
stripping was not yet installed and at the threshold.
Figure 11.9 Air leakage through unfinished gaps at the 1st floor bathroom window sill, around the kitchen window frame and beneath window sills on the 1st and 2nd floor. IR images show cooler air entering the
void behind the plasterboard dry-ling from around the window sills under dwelling depressurisation.
Page 89 of 125

Stamford Brook – Deliverable 6: APPENDIX 11 Web version - July 2007
Figure 11.10 Air movement through gaps in the staircase between the 1st and 2nd floors.
Figure 11.11 Around electrical penetrations on the ground floor a small amount of air movement was
detected behind the consumer unit, through central light fixings and around wiring for the security system.
Figure 11.12 Movement of air through electrical penetrations on the 1st floor on internal walls, service voids
and into the ceiling.
Figure 11.13 Indirect air leakage into walls and direct leakage into the loft space around electrical
penetrations on the 2nd floor,
Page 90 of 125

Stamford Brook – Deliverable 6: APPENDIX 11 Web version - July 2007
Figure 11.14 Unfinished plumbing penetrations on the ground floor.
Figure 11.15 Air movement around unsealed plumbing penetrations in the 1st floor bathroom.
Figure 11.16 Unsealed plumbing penetrations on the 2nd floor; into the intermediate floor, into the front en-
suite service void, under the shower tray and around the shower control.
Page 91 of 125

Stamford Brook – Deliverable 6: APPENDIX 11 Web version - July 2007
Figure 11.17 Air movement around junctions and penetrations in the 2nd floor cylinder cupboard.
Figure 11.18 Leakage was detected around the radiator pipework behind the radiators, which appeared
most severe on internal partition walls.
Page 92 of 125

Stamford Brook – Deliverable 6: APPENDIX 11 Web version - July 2007
Figure 11.19 All 3 of the rooflights in the 2nd floor rear bedroom displayed some degree of air leakage.
Figure 11.20 Infiltration at the loft hatch was detected through the loft hatch keyhole and around the frame.
Page 93 of 125

Stamford Brook – Deliverable 6: APPENDIX 11 Web version - July 2007
Figure 11.21 Thermal imaging of the dry-lining at the loft boundary on the 2nd floor; along the party wall in
the front bedroom, around the sloping roof section in the rear bedroom, at the party/internal wall junction on the landing and in the front en-suite bathroom.
Page 94 of 125

Stamford Brook – Deliverable 6: APPENDIX 11 Web version - July 2007
Page 95 of 125
Pressure Test Details 0.636114552 4.63581906
0.008864682 0.031726959
0.999223792 0.009500829
0.680386099 4.462274840.010935111 0.038955911
0.99896784 0.0115547790.636114552
date: Version 15a 13 October 2006
RESULTS:Mean Flow AT 50Pa = 1239.15 m3/h
ACH50 = 3.61 achAir Permeability at 50 Pa = 4.17 m/hEquivalent Leakage Area = 0.048 m2 at 10 Pa
OK 1241.03 4.17 3.61OKOKOKOKOK
OK 1237.26 4.16 3.60OKOKOKOKOK
Note: ENSURE THAT FLOW SETTINGS ARE IN M3/HR - When using the DG700 gauge you do not need to input a baseline pressure difference as this is calculated by the gauge and the readings adjusted automatically
4.63581906 103.1123386test house address: 0.680386099company: 4.46227484 86.68447832house type: 6tester: 6test reference number:outdoor temp (°C) 19.6 °Cindoor temp (°C) 21.9 °Coutdoor humidity (%rh) 66.6 %rhindoor humidity (%rh) 73.8 %rhoutdoor barometric pressure 1012 mbar or hPa kg/m3indoor barometric pressure 1013 mbar or hPa kg/m3temperature corr. fact. depress. 0.992temperature corr. fact. press. 1.008wind speed (m/s): 0.2baseline pressure diff (Pa) (+/-) Pahouse width: 5.18 mhouse depth: 9.31 mhouse height: 7.29 mfloor area: 48.2 m2volume: 343.4 m3envelope area including floor: 297.5 m2Pressure Difference for ELA 10 Pa
DEPRESSURISATION RING (O=open or A,B,C,D,E)
MEASURED FAN PRESSURE (Pa)
MEASURED FLOW (m3/h)
FLOW RANGE OK FOR SELECTED RING?
Adjusted Pressure (Pa)
Ln delta P Ln Q Q50 Calculated Flow at 50Pa (m3/h)
Permeability Depress Only (m3/hr/m2)
ACH Depress Only (ach)
Approx 60 Pa b 58.4 1376 58.4 4.067316 7.219106Approx 50 Pa b 50.2 1259 50.2 3.916015 7.130243 r2 0.999Approx 40 Pa b 43.1 1140 43.1 3.763523 7.030954 C 0.029 m3/sApprox 30 Pa b 33.8 966 33.8 3.520461 6.865334 n 0.636Approx 20 Pa b 26.9 856 26.9 3.292126 6.744441 C (corrected) 0.029 m3/sApprox 10 Pa b 15.7 596 15.7 2.753661 6.382411PRESSURISATION
RING (O=open or A,B,C,D,E)
MEASURED FAN PRESSURE (Pa)
MEASURED FLOW (m3/h)
FLOW RANGE OK FOR SELECTED RING?
Adjusted Pressure (Pa)
Ln P Ln Q Q50 Calculated Flow at 50Pa (m3/h)
Permeability Press Only (m3/hr/m2)
ACH Press Only (ach)
Approx 60 Pa b 60.3 1390 60.3 4.099332 7.244889Approx 50 Pa b 50.8 1241 50.8 3.927896 7.131503 r2 0.999Approx 40 Pa b 41.4 1088 41.4 3.723281 6.999926 C 0.024 m3/sApprox 30 Pa b 31.7 909 31.7 3.456317 6.820175 n 0.680Approx 20 Pa b 23.3 743 23.3 3.148453 6.618526 C (corrected) 0.024 m3/sApprox 10 Pa b 17.5 594 17.5 2.862201 6.394709
Model 3 with DG700Blower Door & Gauge Used
MINNEAPOLIS BLOWER DOOR DATA INPUT AND CALCULATION24/05/2007
B121
Plot 121 Stamford BrookBryantXT2DM-S
2½ storey full-fill cavity masonry, 4-bed end-terrace, parging layer to all external & party walls. Smoke test @ +75Pa, IR imaging @ -65Pa
Calculated Outdoor Air DensityCalculated Indoor Air Density
description of main construction details:
1.201.19
DEPRESSURISATION
6.3
6.4
6.5
6.6
6.7
6.8
6.9
7
7.1
7.2
7.3
2 3 4 5
Ln delta P
Ln Q
PRESSURISATION
6.36.46.56.66.76.86.9
77.17.27.3
2 3 4 5
Ln delta P
Ln Q
Depressurisation
0
500
1000
1500
0 25 50 75 100delta P
Q
Pressurisation
0
500
1000
1500
0 25 50 75 100delta P
Q

Stamford Brook – Deliverable 6: APPENDIX 12 Web version - July 2007
Page 96 of 125
Appendix 12: Pressurisation Re-test of Redrow Plot 110
Figure 12.1 Redrow Plot 110
Dwelling Details 1. Plot 110 (figure 12.1) was originally selected for the second phase coheating test investigation
(Deliverable 7, Wingfield et al. 2007), but has also been included in the detailed airtightness study. It is a Mendip house type, 4-bedroom, mid-terraced dwelling, built to the standard specification for Redrow at Stamford Brook. This pressurisation re-test was conducted immediately following the coheating test being carried out once the temperature inside the house had reduced sufficiently.
2. The dwelling was originally pressure tested prior to the coheating test, on 27th February 2007, the measured air permeability at that time was 4.03 m³/(h.m²) @ 50Pa. A summary of the pressurisation test and observations made can be found in Appendix 3.
3. The pressure test was conducted in accordance with ATTMA’s Technical Standard 1: Measuring Air Permeability of Building Envelopes (ATTMA, 2006) with the dwelling almost fully completed. Twelve 10mm diameter holes had been drilled in one party wall during the coheating test for the placement of thermocouples, these had subsequently been sealed with oversized wooden doweling being hammered into the holes to seal them at the blockwork, but no attempt had been made to repair the holes in the plasterboard (figure 12.2).
Figure 12.2 Air leakage into the void behind the plasterboard on the party wall, under dwelling pressurisation, through a hole drilled for placement of the thermocouples during the coheating test.

Stamford Brook – Deliverable 6: APPENDIX 12 Web version - July 2007
Pressure Test Results 4. The pressurisation re-test was performed on Redrow Plot 110 by the Leeds Met research team on
28th March 2007. The fan system used for the test was an Energy Conservatory Minneapolis Model 3 Blower Door equipped with a DG700 digital pressure gauge. The results of both the original test and the re-test are contained within Table 12.1.
Table 12.1 Pressure test results for Redrow plot 110.
Pressurisation Depressurisation Date ACH50 Equivalent leakage area
(m2 @ 10Pa)
Mean Air Permeability
(m3/(h.m2) @ 50Pa) r2 coefficient of determination
r2 coefficient of determination
Permeability (m3/(h.m2) @ 50Pa)
Permeability (m3/(h.m2) @ 50Pa)
27 Feb 2007 4.22 0.990 3.85 0.981 4.03 3.85 0.049
28 Mar 2007 5.00 0.998 4.55 1.000 4.78 4.09 0.055
5. The calculated mean air permeability for the dwelling had increased to 4.78 m3/(h.m2) @ 50 Pa.,
still inside the target figure for the site of 5 m3/(h.m2) @ 50 Pa. This result showed an increase in permeability of 0.75 m³/(h.m²) @ 50Pa compared to the initial pressurisation test. It is assumed that the overriding influence causing the drop in performance has been accelerated drying and shrinkage of components as a result of keeping the internal temperature at 25~29°C for the 4 week duration of the coheating test.
Leakage Detection 6. As previously leakage detection was performed under dwelling pressurisation, at approximately 60
Pa above the external pressure, using a handheld smoke puffer and recorded photographically. However, with an 8°C difference between internal and external temperature it was possible to observe infiltration under dwelling depressurisation (at approximately 60 Pa below external pressure) using a FLIR Thermacam B4 infrared thermal imaging camera. The main differences to those observed during the initial test are listed below.
7. In addition to the points of air leakage observed around the ground floor in the initial pressurisation test, air leakage was observed at junctions of the skirting boards on internal, external and separating walls to a far greater extent than previously detected (figure 12.3).
8. On the staircases air leakage around the steps and risers was observed, as previously, but additional leakage was also detected around shrinkage cracks on both staircases along the lengths of the wall stringers where cooler air could be seen entering the living space (figure 12.4).
9. By contrast, at the junction between the stairs and the 1st intermediate floor warmer air could be observed emerging from points of leakage indicating a different air leakage path (figure 12.5).
10. Air leakage through the junctions of the first floor and walls was more noticeable, particularly where the sealing had failed due to settlement and drying shrinkage (figure 2.6).
11. At both the front and rear 1st floor balcony doors cooler air could be seen entering the dwelling under depressurisation, the large differences in temperature indicate that these are direct leakage paths from the outside (figure 12.7).
12. Air movement through gaps in the 1st floor were detected as in the initial test on this dwelling. Thermal imaging of these gaps revealed that under depressurisation it was warmer air coming out from the floor void; indicating that the cooler air entering the dwelling must either have had a long enough dwell time to warm up or mixed with larger amounts of warmer internal air before exiting at this point (figure 12.8).
13. As was the case with the 1st floor, the 2nd floor junctions with external, separating and internal walls all performed worse than in the previous test on this property, with air moving through gaps created where the secondary sealing had partially failed (figure 12.9).
14. Air leakage directly through the 2nd floor ceiling appeared to be of particular concern when viewed through thermal imaging because of the large temperature differences, as was observed around the loft hatch and bathroom extract vent (figure 12.12).
Page 97 of 125

Stamford Brook – Deliverable 6: APPENDIX 12 Web version - July 2007
15. Air leakage detected around the boiler observed using smoke puffers could not determine the exact leakage paths, instead only indicating points of air leakage; thermal imaging of the same detail suggested that significant air movement was entering the void behind the plasterboard possibly where the boiler flue may have been sealed externally and at the inner face of the plasterboard lining, but not at the parging layer, allowing movement of air between the void behind the dry lining and the wall cavity (figure 12.13).
16. The penetration for the waste pipe for the kitchen sink was core drilled after the units had been installed making sealing at the blockwork problematic, so detection of air leakage at this detail was not unexpected (figure 12.14).
17. Although air leakage around the electrical consumer unit had been detected in the initial pressurisation test of this dwelling, it appeared to be worse when the dwelling was re-tested. The thermal image of this details shows air movement not only around the consumer unit but also through the actual unit itself (figure 12.15).
18. Cracks were observed around many of the window sill boards which were not present when the dwelling was first tested. Air leakage was detected through all these cracks but to very variable degrees, in some examples the air flow was barely detectable whereas in others quite sizable significant flows were detected (figure 12.16).
19. Using thermal imaging it was possible to observe certain hidden air leakage paths where cooler air was being drawn into the dwelling under depressurisation. A number of these areas could not be seen during the pre-coheating pressurisation test as there was no significant temperature difference between inside and outside the dwelling and there were no actual points of air leakage visible from inside the dwelling. Examples of these leakage paths included air movement into 2nd floor service voids directly from the loft (figure 12.17) and where plasterboard continuous ribbons had not been fully achieved at the loft boundary around the perimeter of the dwelling (figure 12.18).
Figure 12.3 Air leakage at the ground floor skirting board junctions appeared more severe than when
tested prior to the coheating test.
Figure 12.4 Air leakage around the stairs.
Page 98 of 125

Stamford Brook – Deliverable 6: APPENDIX 12 Web version - July 2007
Figure 12.5 Air leakage at the junction of the 1st intermediate floor with the stairs.
Figure 12.6 Air movement through gaps at the 1st floor junction with separating and external walls.
Figure 12.7 Direct infiltration at both front and rear 1st floor balcony doors.
Figure 12.8 Air movement into and out of the 1st floor void.
Page 99 of 125

Stamford Brook – Deliverable 6: APPENDIX 12 Web version - July 2007
Figure 12.9 Air movement around failed sealant at the 2nd floor perimeter.
Figure 12.10 Air movement directly through the top floor ceiling.
Figure 12.11 Air movement around the boiler.
Figure 12.12 Air movement around the penetration for the kitchen sink waste pipe.
Page 100 of 125

Stamford Brook – Deliverable 6: APPENDIX 12 Web version - July 2007
Figure 12.13 Air leakage around the electrical consumer unit.
Figure 12.16 Air leakage at visible shrinkage cracks around window sills.
Page 101 of 125

Stamford Brook – Deliverable 6: APPENDIX 12 Web version - July 2007
Figure 12.17 Cooler air being drawn into the dwelling from the loft through 2nd floor service voids
Figure 12.18 Air infiltration into the void behind the plasterboard at the loft boundary on an external and
party wall.
Page 102 of 125

Stamford Brook – Deliverable 6: APPENDIX 12 Web version - July 2007
Page 103 of 125
Pressure Test Details 0.679326899 4.568085873
0.004631264 0.016324261
0.999814125 0.005529246
0.686391717 4.6456523630.016399369 0.0582750730.997721864 0.0188682710.679326899
date: Version 15a 13 October 2006
RESULTS:Mean Flow AT 50Pa = 1456.90 m3/h
ACH50 = 4.09 achAir Permeability at 50 Pa = 4.78 m/hEquivalent Leakage Area = 0.055 m2 at 10 Pa
OK 1387.40 4.55 3.90OKOKOKOKOK
OK 1526.40 5.00 4.29OKOKOKOKOK
Note: ENSURE THAT FLOW SETTINGS ARE IN M3/HR - When using the DG700 gauge you do not need to input a baseline pressure difference as this is calculated by the gauge and the readings adjusted automatically
4.568085873 96.35948881test house address: 0.686391717company: 4.645652363 104.1312751house type: 6tester: 6test reference number:outdoor temp (°C) 11.6 °Cindoor temp (°C) 19.6 °Coutdoor humidity (%rh) 67.6 %rhindoor humidity (%rh) 52.5 %rhoutdoor barometric pressure 1012 mbar or hPa kg/m3indoor barometric pressure 1012 mbar or hPa kg/m3temperature corr. fact. depress. 0.973temperature corr. fact. press. 1.028wind speed (m/s): 0baseline pressure diff (Pa) (+/-) Pahouse width: mhouse depth: mhouse height: mfloor area: m2volume: 356 m3envelope area including floor: 305 m2Pressure Difference for ELA 10 Pa
DEPRESSURISATION RING (O=open or A,B,C,D,E)
MEASURED FAN PRESSURE (Pa)
MEASURED FLOW (m3/h)
FLOW RANGE OK FOR SELECTED RING?
Adjusted Pressure (Pa)
Ln delta P Ln Q Q50 Calculated Flow at 50Pa (m3/h)
Permeability Depress Only (m3/hr/m2)
ACH Depress Only (ach)
Approx 60 Pa b 58 1563 58 4.060443 7.326641Approx 50 Pa b 50.2 1422 50.2 3.916015 7.232098 r2 1.000Approx 40 Pa b 40.9 1230 40.9 3.71113 7.087048 C 0.027 m3/sApprox 30 Pa b 32 1046 32 3.465736 6.925007 n 0.679Approx 20 Pa b 24.1 853 24.1 3.182212 6.721038 C (corrected) 0.027 m3/sApprox 10 Pa b 13.6 586 13.6 2.61007 6.345598PRESSURISATION
RING (O=open or A,B,C,D,E)
MEASURED FAN PRESSURE (Pa)
MEASURED FLOW (m3/h)
FLOW RANGE OK FOR SELECTED RING?
Adjusted Pressure (Pa)
Ln P Ln Q Q50 Calculated Flow at 50Pa (m3/h)
Permeability Press Only (m3/hr/m2)
ACH Press Only (ach)
Approx 60 Pa b 60.4 1665 60.4 4.100989 7.445302Approx 50 Pa b 51.6 1523 51.6 3.943522 7.356159 r2 0.998Approx 40 Pa b 42 1320 42 3.73767 7.213109 C 0.029 m3/sApprox 30 Pa b 31.9 1095 31.9 3.462606 7.026231 n 0.686Approx 20 Pa b 23.6 911 23.6 3.161247 6.842265 C (corrected) 0.029 m3/sApprox 10 Pa b 15.3 645 15.3 2.727853 6.496972
Model 3 with DG700Blower Door & Gauge Used
MINNEAPOLIS BLOWER DOOR DATA INPUT AND CALCULATION28/03/2007Plot 110, Stamford BrookRedrowMendipJW, DM-S
Re-test following coheating test
Calculated Outdoor Air DensityCalculated Indoor Air Density
description of main construction details:
1.241.20
DEPRESSURISATION
6.2
6.4
6.6
6.8
7
7.2
7.4
2 3 4 5
Ln delta P
Ln Q
PRESSURISATION
6.4
6.6
6.8
7
7.2
7.4
7.6
2 3 4 5
Ln delta P
Ln Q
Depressurisation
0
500
1000
1500
2000
0 25 50 75 100delta P
Q
Pressurisation
0
500
1000
1500
2000
0 25 50 75 100delta P
Q

Stamford Brook – Deliverable 6: APPENDIX 13 Web version - July 2007
Page 104 of 125
Appendix 13: Pressurisation Re-test of Redrow Plot 111
Figure 13.1 Redrow Plot 111
Dwelling Details 1. Plot 111 (figure 13.1) was originally selected for the second phase coheating test investigation
(Deliverable 7, Wingfield et al. 2007), but has also been included in the detailed airtightness study. It is a Mendip house type, 4-bedroom, mid-terraced dwelling, built to the standard specification for Redrow at Stamford Brook. This pressurisation re-test was conducted immediately following the coheating test being carried out once the temperature inside the house had reduced sufficiently. ATTMA’s Technical Standard 1: Measuring Air Permeability of Building Envelopes (ATTMA, 2006) recommends not to test where (ΔT x dwelling height) > 500mK so technically it was feasible to test on 28th March, however it was felt that with a range of elevated internal temperatures between 22 and 27°C throughout the dwelling it was better to allow the house a further day to cool.
2. The dwelling was originally pressure tested prior to the coheating test, on 27th February 2007, the measured air permeability at that time was 2.84 m³/(h.m²) @ 50Pa. A summary of the pressurisation test and observations made can be found in Appendix 4.
3. The pressure test was conducted in accordance with ATTMA’s TS1 (ATTMA, 2006) with the dwelling almost fully completed with no additional work since the original test was performed 4 weeks previously.
Pressure Test Results 4. The pressurisation re-test was performed on Redrow Plot 111 by the Leeds Met research team on
29th March 2007. The fan system used for the test was an Energy Conservatory Minneapolis Model 3 Blower Door equipped with a DG700 digital pressure gauge. The results of both the original test and the re-test are contained within Table 13.1.
Table 13.1 Pressure test results for Redrow plot 111.
Pressurisation Depressurisation Date ACH50 Equivalent leakage area
(m2 @ 10Pa)
Mean Air Permeability
(m3/(h.m2) @ 50Pa) r2 coefficient of determination
r2 coefficient of determination
Permeability (m3/(h.m2) @ 50Pa)
Permeability (m3/(h.m2) @ 50Pa)
27 Feb 2007 2.99 0.980 2.68 1.000 2.84 2.46 0.034
29 Mar 2007 3.37 0.998 3.03 0.998 3.20 2.77 0.038

Stamford Brook – Deliverable 6: APPENDIX 13 Web version - July 2007
5. The calculated mean air permeability for the dwelling has increased to 3.20 m3/(h.m2) @ 50 Pa, still inside the target figure for the site of 5 m3/(h.m2) @ 50 Pa. This result shows an increase in permeability of 0.36 m³/(h.m²) @ 50Pa compared to the initial pressurisation test. This drop in performance is assumed to be due to the accelerated drying and shrinkage of components as a result of keeping the internal temperature at 25~29°C for the 4 week duration of the coheating test.
Leakage Detection 6. Leakage detection was performed under dwelling pressurisation, at approximately 60 Pa above the
external pressure, using a handheld smoke puffer and recorded photographically; and under depressurisation at approximately 60 Pa below external pressure using a FLIR Thermacam B4 infrared thermal imaging camera and again recorded photographically. The main differences to the leakage detection observed during the initial test are listed below.
7. Air leakage at the floor/wall junctions on the ground floor had increased slightly, most noticeably at room corners (figure 13.2).
8. The sealant applied at the ground floor rear threshold, underneath the patio doors, appeared to have remained effective throughout; however air movement at the junctions of the frame and the skirting boards had increased with small shrinkage cracks becoming noticeable (figure 13.3).
9. At the pre-coheating test the only air leakage detected around the stairs was at junctions of the stairs with the intermediate floors, when re-tested cracks were observed along both sets of stairs at the wall stringers where additional air movement was detected. Under dwelling depressurisation air flow through these cracks was observed using thermal imaging, showing cooler air emerging from the gap on the lower staircase and warmer air on the upper set of stairs, indicating the complexity of the air movement within the dwelling (figure 13.4).
10. Air movement through gaps at the floor/wall junctions on the first floor had increased slightly, with additional leakage detected where the flexible sealant had partially failed. Thermal imaging revealed that air movement through these gaps, under depressurisation, was cooler air entering along external walls than on separating and internal walls (figure 13.5).
11. Some of the sealed joints at the frame/floor and frame/skirting junctions of both patio doors placed on intermediate floors had deteriorated. The large range of temperatures shown on the thermal images indicates that air leakage at this detail is infiltration directly from outside (figure 13.6).
12. There did not appear to be any significant increase in air movement through the number of gaps previously identified at joints between flooring panels on both intermediate floors. Thermal imaging of these details revealed that the temperature of air emanating from them, under dwelling depressurisation, varied little from the ambient temperature around them; indicating that these points of air leakage are not direct leakage paths to outside but end points of far more complex paths in which the air has had enough dwell-time (or had mixed with enough warm internal air) to warm up before exiting at this point (figure 13.7).
13. As was observed on the 1st floor, the sealing of the floor/wall junctions on the 2nd floor had deteriorated due to the accelerated shrinkage and settlement caused by the coheating test (figure 13.8).
14. Additional air leakage at the cylinder cupboard ceiling was detected, directly into the loft (figure 13.9).
15. Direct air leakage was detected through gaps between individual elements of the bay window on the first floor as in the original test. The thermal image shows a temperature difference of around 6°C between the air entering at this point and the temperature of the window frame, this may go some way to explaining the large amount of surface condensation observed here indicated by the evaporation stains visible on the window sill after 4 weeks of elevated temperatures inside the dwelling for the duration of the coheating test (figure 13.10)
16. When originally tested, the air leakage at the loft hatch was relatively minor with air movement only detected between the hatch and door, however at the re-test air movement not previously evident was identified at the loft hatch/ceiling junction (figure 13.11).
17. Infiltration around plumbing penetrations had not noticeably increased, however the sealing around some of the boxing-in of pipework had deteriorated (figure 13.12).
18. Around electrical penetrations the only increased air leakage was observed on the 2nd floor at ceiling penetrations for light fixings. Also noteworthy is the fact that no air movement was detected
Page 105 of 125

Stamford Brook – Deliverable 6: APPENDIX 13 Web version - July 2007
around the electrical consumer unit, a detail which allowed substantial air leakage in plot R110 (figure 13.13).
19. Besides direct air leakage at the bay window, between individual window elements, no significant air leakage was detected around window frames and sills in the original pressure test. However, during leakage detection performed during the re-test, not only was leakage observed using smoke puffers on dwelling pressurisation at cracks around the windows, but it was possible to see where air was entering the dwelling during depressurisation at the window sills and entering the void behind the dry lining - even where no visible surface gaps were observed (figure 13.14).
20. As well as air movement, thermal imaging also identified other construction issues such as the thermal bridging observed above the 1st floor bay ceiling (figure 13.15).
21. Air movement at the loft boundary, into the voids behind dry lining was also visible using thermal imaging due to the temperature difference between the 2nd floor and ventilated loft space. It was possible to see on internal walls where the metal studwork was cooler and had compartmentalised the temperature in the partition walls and also the numerous areas where solid continuous ribbons of plasterboard adhesive had not been fully achieved on external walls and cooler air was being drawn in from the loft space (figure 13.16).
22. Thermographic imaging, under dwelling depressurisation, also showed air leakage into 2nd floor service voids directly from the ventilated roof space (figure 13.17).
Figure 13.2 Ground floor room corners.
Figure 13.3 Ground floor patio door threshold.
Figure 13.4 Air movement through shrinkage cracks on the lower and upper sets of stairs, with cooler air
emerging at the lower staircase and warmer air at the upper staircase.
Page 106 of 125

Stamford Brook – Deliverable 6: APPENDIX 13 Web version - July 2007
Figure 13.5 Failure of the flexible sealant on 1st floor wall junctions, with cooler air entering the dwelling on
external walls than on internal walls under dwelling depressurisation.
Figure 13.6 Air leakage around the bottoms of the balcony doors on the 1st and 2nd floors
Page 107 of 125

Stamford Brook – Deliverable 6: APPENDIX 13 Web version - July 2007
Figure 13.7 Air movement through holes in the intermediate floors.
Figure 13.8 Air leakage at the 2nd floor/wall junctions.
Figure 13.9 Air leakage at the cylinder cupboard ceiling.
Figure 13.10 Direct air leakage gaps between individual frame elements of the bay window.
Page 108 of 125

Stamford Brook – Deliverable 6: APPENDIX 13 Web version - July 2007
Figure 13.11 Direct air leakage around the loft hatch.
Figure 13.12 Increased air leakage at pipework boxing.
Figure 13.13 Air leakage around ceiling light fittings on the 2nd floor, but still no leakage detected around
the electrical consumer unit
Page 109 of 125

Stamford Brook – Deliverable 6: APPENDIX 13 Web version - July 2007
Figure 13.14 Air movement through gaps around the window frame and sills.
Figure 13.15 A combination of the effects of thermal bridging and air movement at the bay window ceiling.
Page 110 of 125

Stamford Brook – Deliverable 6: APPENDIX 13 Web version - July 2007
Figure 13.16 Air movement from the loftspace into the partition walls; on external walls around the
“continuous” ribbons of plasterboard adhesive into the voids behind the dry lining; and where dabs rather than ribbons appeared to have been used.
Figure 13.17 Air leakage into 2nd floor service voids in both bedroom and bathroom.
Page 111 of 125

Stamford Brook – Deliverable 6: APPENDIX 13 Web version - July 2007
Page 112 of 125
Pressure Test Details 0.663680404 4.254310626
0.01497078 0.052618368
0.997968823 0.017981645
0.70375561 4.218906460.01591166 0.0563729070.99795939 0.018843868
0.663680404
date: Version 15a 13 October 2006
RESULTS:Mean Flow AT 50Pa = 1011.16 m3/h
ACH50 = 2.77 achAir Permeability at 50 Pa = 3.20 m/hEquivalent Leakage Area = 0.038 m2 at 10 Pa
OK 956.61 3.03 2.62OKOKOKOKOK
OK 1065.72 3.37 2.92OKOKOKOKOK
Note: ENSURE THAT FLOW SETTINGS ARE IN M3/HR - When using the DG700 gauge you do not need to input a baseline pressure difference as this is calculated by the gauge and the readings adjusted automatically
4.254310626 70.40826281test house address: 0.70375561company: 4.21890646 67.95912759house type: 6tester: 6test reference number:outdoor temp (°C) 8.6 °Cindoor temp (°C) 18.6 °Coutdoor humidity (%rh) 65.1 %rhindoor humidity (%rh) 70.4 %rhoutdoor barometric pressure 1008 mbar or hPa kg/m3indoor barometric pressure 1008 mbar or hPa kg/m3temperature corr. fact. depress. 0.966temperature corr. fact. press. 1.036wind speed (m/s): 1baseline pressure diff (Pa) (+/-) Pahouse width: mhouse depth: mhouse height: mfloor area: m2volume: 365 m3envelope area including floor: 316 m2Pressure Difference for ELA 10 Pa
DEPRESSURISATION RING (O=open or A,B,C,D,E)
MEASURED FAN PRESSURE (Pa)
MEASURED FLOW (m3/h)
FLOW RANGE OK FOR SELECTED RING?
Adjusted Pressure (Pa)
Ln delta P Ln Q Q50 Calculated Flow at 50Pa (m3/h)
Permeability Depress Only (m3/hr/m2)
ACH Depress Only (ach)
Approx 60 Pa b 61.9 1144 61.9 4.12552 7.007391Approx 50 Pa b 49.4 969 49.4 3.89995 6.841369 r2 0.998Approx 40 Pa b 41.4 860 41.4 3.723281 6.722037 C 0.020 m3/sApprox 30 Pa b 28.7 657 28.7 3.356897 6.452789 n 0.664Approx 20 Pa c 21.8 568 21.8 3.08191 6.307226 C (corrected) 0.020 m3/sApprox 10 Pa c 14.8 441 14.8 2.694627 6.054149PRESSURISATION
RING (O=open or A,B,C,D,E)
MEASURED FAN PRESSURE (Pa)
MEASURED FLOW (m3/h)
FLOW RANGE OK FOR SELECTED RING?
Adjusted Pressure (Pa)
Ln P Ln Q Q50 Calculated Flow at 50Pa (m3/h)
Permeability Press Only (m3/hr/m2)
ACH Press Only (ach)
Approx 60 Pa b 62 1216 62 4.127134 7.138217Approx 50 Pa b 50.5 1041 50.5 3.921973 6.982832 r2 0.998Approx 40 Pa b 41.2 896 41.2 3.718438 6.832836 C 0.019 m3/sApprox 30 Pa b 32.4 743 32.4 3.478158 6.645591 n 0.704Approx 20 Pa b 22.3 574 22.3 3.104587 6.387525 C (corrected) 0.019 m3/sApprox 10 Pa c 15 451 15 2.70805 6.146363
Re-test following coheating test
Calculated Outdoor Air DensityCalculated Indoor Air Density
description of main construction details:
1.251.20
Model 3 with DG700Blower Door & Gauge Used
MINNEAPOLIS BLOWER DOOR DATA INPUT AND CALCULATION29/03/2007Plot 111, Stamford BrookRedrowMendipJW, DM-S
DEPRESSURISATION
5.8
6
6.2
6.4
6.6
6.8
7
7.2
2 3 4 5
Ln delta P
Ln Q
PRESSURISATION
6
6.2
6.4
6.6
6.8
7
7.2
2 3 4 5
Ln delta P
Ln Q
Depressurisation
0200400600800
100012001400
0 25 50 75 100delta P
Q
Pressurisation
0200400600800
100012001400
0 25 50 75 100delta P
Q

Stamford Brook – Deliverable 6: APPENDIX 14 Web version - July 2007
Page 113 of 125
Appendix 14: Pressurisation Re-test of Bryant Plot 121
Figure 14.1 Bryant Plot 121
Dwelling Details 1. Plot 121 (figure 14.1) was selected for this investigation as the house design incorporates a
number of details known to have been problematic in previous airtightness tests performed at Stamford Brook. It is an XT2 house type, 2½ storey, 4-bedroom, end-terraced dwelling, built to the standard specification for Bryant at Stamford Brook.
2. The dwelling was originally pressure tested prior to the coheating test, on 24th May 2007, the measured air permeability at that time was 4.17 m³/(h.m²) @ 50 Pa. A summary of the pressurisation test and observations made can be found in Appendix 11. Since the initial test was conducted reparatory work to ceilings in the kitchen and bathroom and to walls in the utility room and WC had been carried out; the kitchen, utility and downstairs WC floors had been tiled and sealed around; some snagging and finishing involving sealing of the plumbing penetrations had been performed; the bath and shower panels had been fitted; a broken window glazing panel replaced in the lounge; the remaining door furniture and draught-stripping had been added to the doors and additional wiring had been added to the mechanical extraction unit (figure 14.2).
Figure 14.2 The MEV unit as when the initial pressurisation test was performed and with the additional
wiring added by the time of the re-test.
3. The pressure test was conducted in accordance with ATTMA’s Technical Standard 1: Measuring Air Permeability of Building Envelopes (ATTMA, 2006), the only difference to the original test was the placement of the blower door in the back door, allowing air leakage around the front door and front door threshold to be examined which was not possible in the original test.

Stamford Brook – Deliverable 6: APPENDIX 14 Web version - July 2007
Pressure Test Results 4. The pressurisation test was performed on Bryant Plot 121 by the Leeds Met research team on 24th
May 2007. The fan system used for the test was an Energy Conservatory Minneapolis Model 3 Blower Door equipped with a DG700 digital pressure gauge. The results are contained within Table 14.1.
Table 14.1 Comparison of initial pressure test results and re-test results for Bryant plot 121.
Pressurisation Depressurisation Date ACH50 Equivalent leakage area
(m2 @ 10Pa)
Mean Air Permeability
(m3/(h.m2) @ 50Pa) r2 coefficient of determination
r2 coefficient of determination
Permeability (m3/(h.m2) @ 50Pa)
Permeability (m3/(h.m2) @ 50Pa)
24 May 2007 4.16 0.999 4.17 0.999 4.17 3.61 0.048 05 June 2007 3.34 0.997 3.19 0.997 3.27 2.83 0.037
5. The calculated mean air permeability for the dwelling had decreased from 4.17 to 3.27 m3/(h.m2) @
50 Pa, an improvement of 0.90 m3/(h.m2) @ 50 Pa and comfortably within the target figure for the site of 5 m3/(h.m2) @ 50 Pa.. The re-test result is comparable to the other XT2 house type tested in this study; plot B119, (2.89 m3/(h.m2) @ 50 Pa) which had also had sealant applied to the floor wall junctions.
Leakage Detection 6. Leakage detection was performed under dwelling pressurisation at approximately 75 Pa above the
external pressure, using a handheld smoke puffer and recorded photographically; and under dwelling depressurisation at approximately 75 Pa below external using infrared thermography using a FLIR Thermocam B4 IR camera. The internal/external temperature differential of only 4.5 C° limited the effectiveness of this as method of analysis but some illustrative examples are included in this report. The main leakage paths observed during the test are listed below.
7. The floor/wall junctions on the ground floor had only been sealed at the bottom of the skirting boards in the kitchen, utility room and WC where floor tiles had been laid. Air leakage was again observed around the room perimeters most noticeably at the unfinished floor/wall junctions in the kitchen and utility room behind the units, which appeared to be amongst the worst performing areas of the whole dwelling in terms of airtightness (figure 14.3).
8. Air leakage was detected all around the 1st floor perimeter at the wall/floor junctions on the separating walls and the external walls in the lounge and both bedrooms (figure 14.4). This was comparable to the leakage observed on the ground floor in terms of the amount air movement where similar gaps under the skirting board existed.
9. Using thermal imaging a distinct difference could be seen between air leakage at the internal wall junctions with the 1st floor and those of external and separating walls. The air emerging from the junction of the 1st floor with the external walls was much cooler than the ambient room temperatures, whereas air emerging from the bottom of the internal walls was at the ambient temperature and so did not show up on the thermal images indicating a more complex indirect air leakage path (figure 14.5).
10. The wall/floor junctions on the 2nd floor had also not yet been sealed with a flexible sealant and infiltration was detected to varying extents around room perimeters, at comparable rates to those observed on the 1st floor on external and separating walls but significantly reduced on many internal walls (figure 14.6).
11. As the blower door was placed in the rear entrance door for the re-test it was not possible to test for air leakage there, but as only one side of the skirting/frame junction had been sealed it is expected that some air leakage will remain (figure 14.7). However, the placement of the blower door enabled the research team to examine the airtightness performance around the front door which was not possible in the initial test. In particular, air leakage around the threshold which had been expected, but had not been able to be detected before, was confirmed.
12. Air movement around the front door was observed at the door head through a small crack and between the door and the frame above the top hinge (figure 14.8). Air movement through the letterbox was also detected.
13. The broken glazing panel in the lounge had been replaced and air leakage was observed under depressurisation only, under pressurisation the window was being pushed back into the compressible seal enough to prevent smoke detection of any air leakage. The previously detected major infiltration at the 1st floor bathroom window sill had been significantly reduced but not
Page 114 of 125

Stamford Brook – Deliverable 6: APPENDIX 14 Web version - July 2007
eliminated by the tiling of the sill. Air leakage was again detected at a number of small gaps and cracks around the window frames and sills, both under the sills and at the frame/wall junctions (figure 14.9).
14. At the kitchen window air leakage was observed at the junctions of the trickle vents with the window frames (figure 14.10). This was the first time that air leakage had been detected around trickle vents in the Rationel windows which did not appear to suffer from some type of damage, there were no obvious signs that the vents had been tampered with although the decorators revealed that some vents had been temporarily levered up to paint over small marks and stains.
15. Air leakage was detected through small gaps in both staircases, again this was not detectable using thermal imaging indicating complex indirect leakage paths (figure 14.11).
16. Air movement detected around ground and 1st floor electrical penetrations was again comparatively minor, with leakage being detected around light fittings, the consumer unit, wiring for the security system and doorbell and a number of 1st floor electrical sockets (figure 14.12).
17. In the previous test on this dwelling only minor air leakage was detected around 2nd floor electrical sockets on internal partition walls, although it appeared slightly worse than that observed for similar details on the ground and 1st floors. Once again, more significantly airflow was observed directly into the loft via the ceiling mounted light fittings on the 2nd floor (figure 14.13).
18. On the ground floor some areas where air leakage was previously detected, such as the pipework for the boiler, were now fully boxed-in so were not observable in the re-test. The floor of the WC had been tiled and the waste and soil pipes sealed around, but some air leakage remained (figure 14.14).
19. In the 1st floor bathroom the plumbing penetrations into the same service void had generally been sealed around very effectively, with only a small hole on the underside of the soil pipe allowing air leakage into the void. However, penetrations into the floor had not yet been sealed and allowed some air movement, with the greatest movement of air into this void around the bath panel - as had been suspected previously after the initial pressurisation test, where the large holes into the service void underneath the bath are unlikely to have been repaired (figure 14.15).
20. In both 2nd floor en-suites air movement into the intermediate floor was detected around the waste pipes for the hand basins, but the bulk of the air movement was around the shower trays which were not yet sealed around (figure 14.16). Air leakage was also detected around the soil and supply pipes for the toilet in the front en-suite, but all other wall penetrations had been sealed around successfully.
21. In the cylinder cupboard air movement was again observed through plumbing penetrations and junctions of the platform floor supporting the hot water cylinder, around electrical penetrations and around the ceiling penetrations for the ventilation ducting. In addition to that previously detected there was also air leakage into the MEV unit through a hole cut for additional electrical cables which had not been present when the initial pressurisation test had been conducted (figure 14.17).
22. Air leakage was detected around a vent for the MEV system in the kitchen which had not previously been observed, and appeared to be an isolated incident as generally air leakage around these fixtures had not been detected (figure 14.18).
23. As in plots B119 and B120 and in the previous test, air leakage was detected through the rooflights situated in the 2nd floor rear bedroom (figure 14.19). Although during dwelling pressurisation air leakage was observed all around the rooflights, under depressurisation leakage was noticeably worse at the bottom junctions of the rooflights and frames than at the top junctions.
24. Air movement directly between the attic space and the living space was still possible around the loft hatch (figure 14.20). This was due to gaps between the surround and the ceiling, which had yet to be adequately sealed, and through the hole for the loft hatch key.
25. As the internal/external temperature differential was 4.5C°, almost double that on the initial test, it was possible to observe some of the air movement from the loft into the dry-lining voids around the loft boundary under dwelling depressurisation with a little more clarity (figure 14.21). In the rear bedroom along the sloping roof section and at the junctions with the party and gable walls some cooler areas behind the plasterboard could be distinguished where air was being drawn in from the surrounding roof voids and loft space. On the landing cooler air could be observed on the separating wall moving downwards around the dabs of plasterboard adhesive. In the front en-suite air movement around dabs and the service void could also be observed, and on the other side of
Page 115 of 125

Stamford Brook – Deliverable 6: APPENDIX 14 Web version - July 2007
Page 116 of 125
the dormer window in the front bedroom cooler air can be seen moving around the plaster dabs in the dry-lining voids and emerging into the living space through the gap beneath the skirting boards.
Figure 14.3 Air leakage at wall/floor junctions on the ground floor, in hidden areas behind units in the utility
room and kitchen, under the skirting in the kitchen, dining room and hall on internal and external walls.
Figure 14.4 Air leakage at the unsealed wall/floor junctions on the 1st floor; detected along all external and
separating walls.

Stamford Brook – Deliverable 6: APPENDIX 14 Web version - July 2007
Page 117 of 125
Figure 14.5 Under depressurisation, cooler air entering at the 1st floor on external walls, whereas on
in
ternal walls there was no temperature difference with warmer air emerging from gaps between flooringpanels.
Figure 14.6 Infiltration detected at wall/floor junctions in the 2nd floor front and rear bedrooms on the party
and external walls.
Figure 14.7 The back doo shold, and air leakage detected at the front door threshold. r thre

Stamford Brook – Deliverable 6: APPENDIX 14 Web version - July 2007
Page 118 of 125
Figure 14.8 Air leakage at the head of the front door, around the door casement on the hinge side and
around the letterbox.
Figure 14.9 The replacement lounge window showing infiltration under depressurisation; and air leakage
stagain detected around the kitchen window frame, the sill in the 1 floor bathroom and beneath window sills on the 1st and 2nd floor even though additional decorating work had been carried out.

Stamford Brook – Deliverable 6: APPENDIX 14 Web version - July 2007
Figure 14.10 Air leakage at the trickle vents in the kitchen window.
Figure 14.11 Air movement through gaps in the both staircases.
Figure 14.12 Movement of air through electrical penetrations on the ground and 1st floor electrical penetrations was the same as that observed in the initial test.
Page 119 of 125

Stamford Brook – Deliverable 6: APPENDIX 14 Web version - July 2007
Figure 14.13 Indirect air leakage into walls and direct leakage into the loft space around electrical
penetrations on the 2nd floor,
Figure 14.14 Air leakage around the waste pipe for the basin in the ground floor WC.
Page 120 of 125

Stamford Brook – Deliverable 6: APPENDIX 14 Web version - July 2007
Figure 14.15 Where visible, plumbing penetrations into the service void along the wall in the 1st floor
bathroom were sealed around effectively, in less visible areas the sealing was less successful.
Figure 14.16 Unsealed plumbing penetrations into the 2nd floor in both front and rear en-suites; generally well sealed wall penetrations; air leakage around the shower trays in both bathrooms, and at the entrance
to the boxing-in in the front en-suite.
Page 121 of 125

Stamford Brook – Deliverable 6: APPENDIX 14 Web version - July 2007
Figure 14.17 Air movement around junctions and penetrations in the 2nd floor cylinder cupboard.
Figure 14.18 Air leakage around the vent for the MEV system in the kitchen.
Figure 14.19 All 3 of the rooflights in the 2nd floor rear bedroom displayed some degree of air leakage.
Page 122 of 125

Stamford Brook – Deliverable 6: APPENDIX 14 Web version - July 2007
Figure 14.20 Infiltration at the loft hatch was again detected through the loft hatch keyhole, between the
hatch and door, and around the frame itself.
Page 123 of 125

Stamford Brook – Deliverable 6: APPENDIX 14 Web version - July 2007
Figure 14.21 Thermal imaging of the dry-lining at the loft boundary on the 2nd floor; along the section of sloping roof in the rear bedroom; at the party/internal wall junction on the landing; in the front en-suite bathroom, and around the junction of the front external wall with the party wall by the dormer window.
Page 124 of 125

Stamford Brook – Deliverable 6: APPENDIX 14 Web version - July 2007
Page 125 of 125
Pressure Test Details 0.663486232 4.252411125
0.017934787 0.064970429
0.997085788 0.016976829
0.689741185 4.200784020.018177045 0.0657412930.997229683 0.0167620310.663486232
date: Version 15a 13 October 2006
RESULTS:Mean Flow AT 50Pa = 971.56 m3/h
ACH50 = 2.83 achAir Permeability at 50 Pa = 3.27 m/hEquivalent Leakage Area = 0.037 m2 at 10 Pa
OK 949.64 3.19 2.77OKOKOKOKOK
OK 993.48 3.34 2.89OKOKOKOKOK
Note: ENSURE THAT FLOW SETTINGS ARE IN M3/HR - When using the DG700 gauge you do not need to input a baseline pressure difference as this is calculated by the gauge and the readings adjusted automatically
4.252411125 70.27464922test house address: 0.689741185company: 4.20078402 66.73863497house type: 6tester: 6test reference number:outdoor temp (°C) 14.5 °Cindoor temp (°C) 19 °Coutdoor humidity (%rh) 70.8 %rhindoor humidity (%rh) 62.5 %rhoutdoor barometric pressure 1018 mbar or hPa kg/m3indoor barometric pressure 1018 mbar or hPa kg/m3temperature corr. fact. depress. 0.985temperature corr. fact. press. 1.016wind speed (m/s): 0.2baseline pressure diff (Pa) (+/-) Pahouse width: 5.18 mhouse depth: 9.31 mhouse height: 7.29 mfloor area: 48.2 m2volume: 343.4 m3envelope area including floor: 297.5 m2Pressure Difference for ELA 10 Pa
DEPRESSURISATION RING (O=open or A,B,C,D,E)
MEASURED FAN PRESSURE (Pa)
MEASURED FLOW (m3/h)
FLOW RANGE OK FOR SELECTED RING?
Adjusted Pressure (Pa)
Ln delta P Ln Q Q50 Calculated Flow at 50Pa (m3/h)
Permeability Depress Only (m3/hr/m2)
ACH Depress Only (ach)
Approx 60 Pa b 63 1113 63 4.143135 6.999283Approx 50 Pa b 50.8 975 50.8 3.927896 6.866907 r2 0.997Approx 40 Pa b 43.2 850 43.2 3.76584 6.729705 C 0.020 m3/sApprox 30 Pa b 32.6 730 32.6 3.484312 6.577514 n 0.663Approx 20 Pa b 26.7 641 26.7 3.284664 6.447499 C (corrected) 0.020 m3/sApprox 10 Pa b 20.2 517 20.2 3.005683 6.232512PRESSURISATION
RING (O=open or A,B,C,D,E)
MEASURED FAN PRESSURE (Pa)
MEASURED FLOW (m3/h)
FLOW RANGE OK FOR SELECTED RING?
Adjusted Pressure (Pa)
Ln P Ln Q Q50 Calculated Flow at 50Pa (m3/h)
Permeability Press Only (m3/hr/m2)
ACH Press Only (ach)
Approx 60 Pa b 62.1 1126 62.1 4.128746 7.041958Approx 50 Pa b 50.2 970 50.2 3.916015 6.892827 r2 0.997Approx 40 Pa b 41.4 871 41.4 3.723281 6.785173 C 0.019 m3/sApprox 30 Pa b 34.1 763 34.1 3.529297 6.652789 n 0.690Approx 20 Pa b 26.3 614 26.3 3.269569 6.435526 C (corrected) 0.019 m3/sApprox 10 Pa b 20.4 527 20.4 3.015535 6.282731
2½ storey full-fill cavity masonry, 4-bed end-terrace, parging layer to all external & party walls. Smoke test @ +75Pa, IR imaging @ -75Pa
Calculated Outdoor Air DensityCalculated Indoor Air Density
description of main construction details:
1.231.21
Model 3 with DG700Blower Door & Gauge Used
MINNEAPOLIS BLOWER DOOR DATA INPUT AND CALCULATION07/06/2007
B121
Plot 121 Stamford BrookBryantXT2JW, DM-S
DEPRESSURISATION
6.1
6.2
6.3
6.4
6.5
6.6
6.7
6.8
6.9
7
7.1
2 3 4 5
Ln delta P
Ln Q
PRESSURISATION
6.26.36.46.56.66.76.86.9
77.1
2 3 4 5
Ln delta P
Ln Q
Depressurisation
0200400600800
10001200
0 25 50 75 100delta P
Q
Pressurisation
0200400600800
10001200
0 25 50 75 100delta P
Q