list of mutual funds & etfs passed my due diligence€¦ · · 2017-06-15list of mutual funds...
TRANSCRIPT
fi360 Due Diligence BreakdownPrepared on: 4/16/2017 | Fund data as of 3/31/2017
Prepared By:
Tim Hayes, AIF®, CRPS®, AWMA®, CFS®, Investment
Adviser Representative, Registered Representative
Page 1 of 38
Fund data as of 3/31/2017
Analysis, search process, and layout are © 2000-2017, fi360, Inc. (www.fi360.com). All rights reserved. The analysis and opinions generated by fi360: (1) do not constitute professional investment advice; (2) are provided solely for informational purposes; (3) are not warranted or represented to be correct,
complete, or accurate; and (4) are for the exclusive use of subscribers to fi360. The data source is © 2017 Morningstar, Inc. All rights reserved. The data contained herein: (1) is proprietary to Morningstar, Inc and/or its content providers; (2) may not be copied or distributed; and (3) is not warranted to be
accurate, complete or timely. Neither Morningstar, Inc nor its content providers are responsible for any damages or losses arising from any use of this information. Past performance is no guarantee of future results.
fi360_Landscape_v8_1
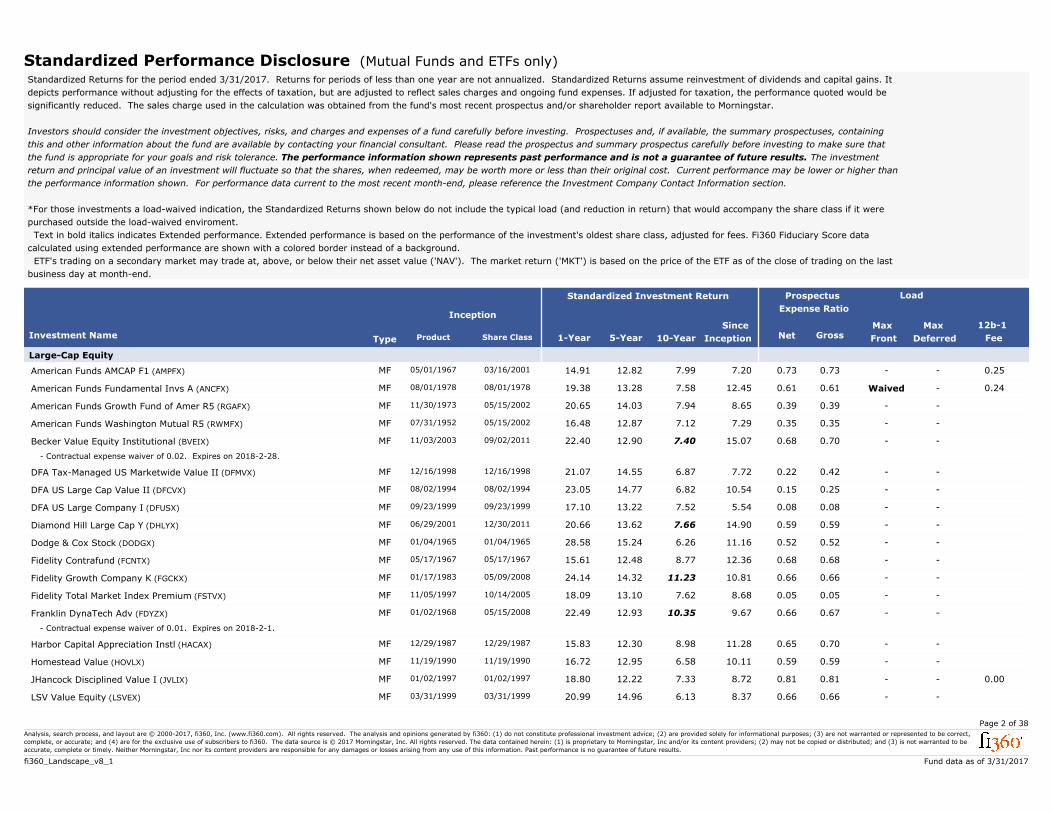
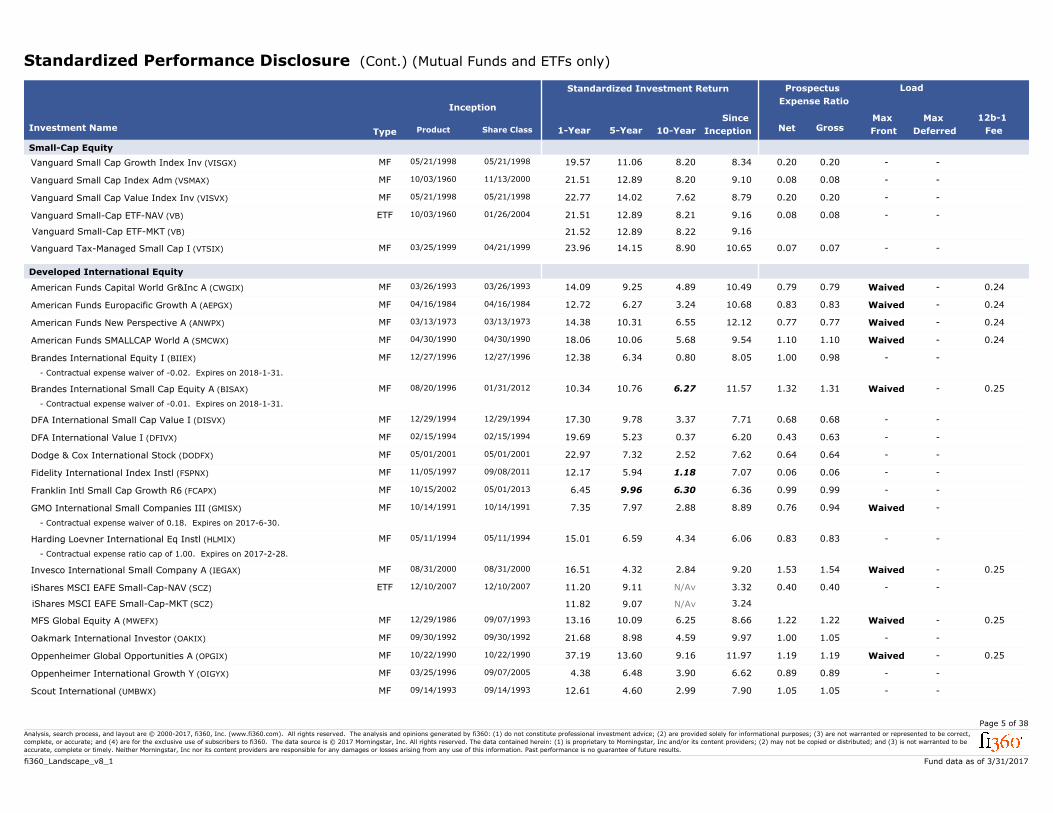
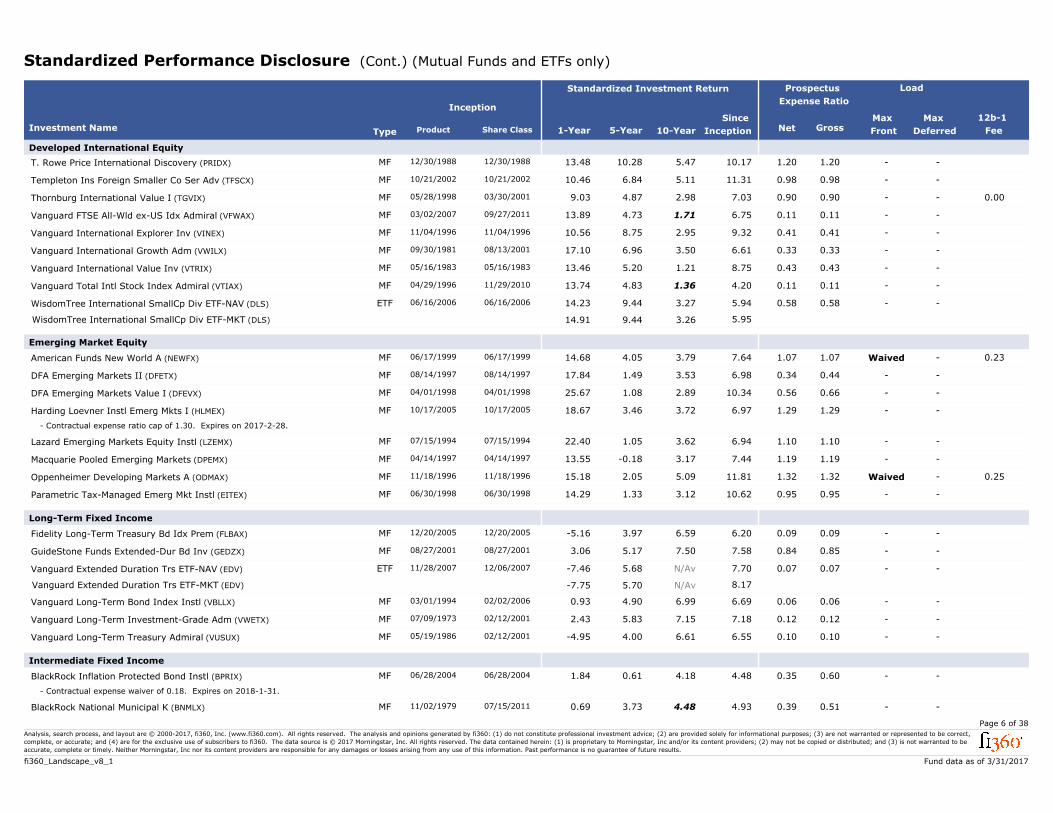
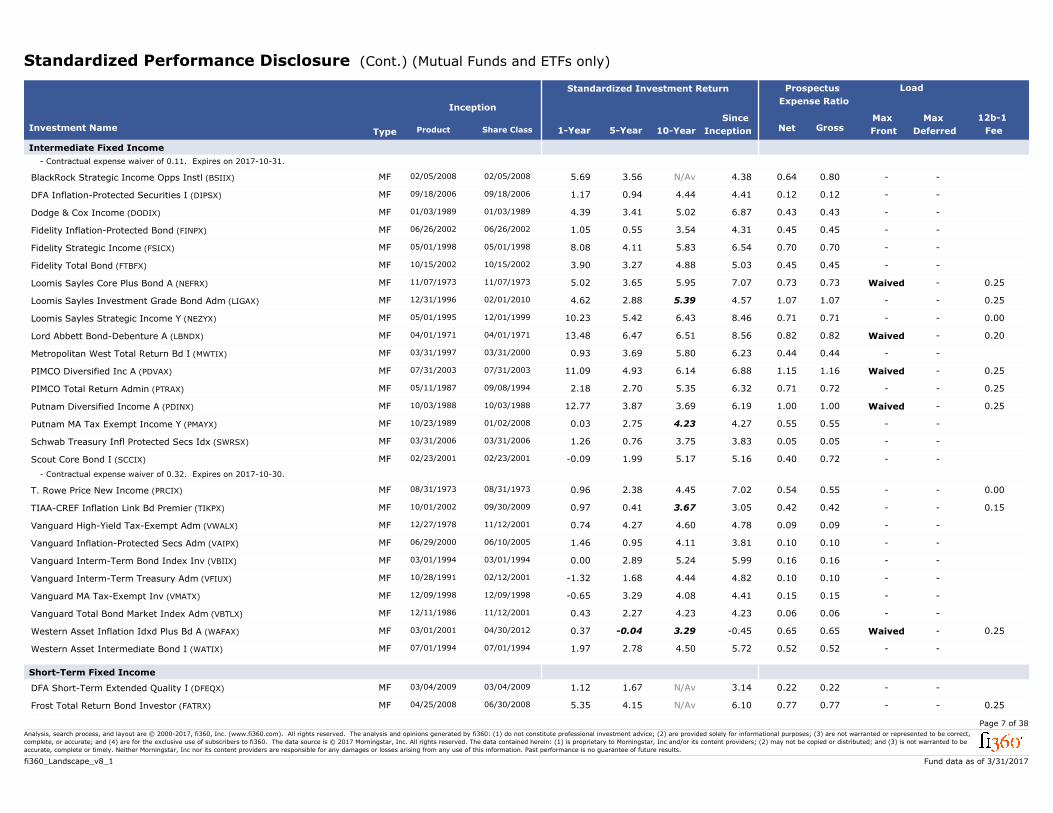
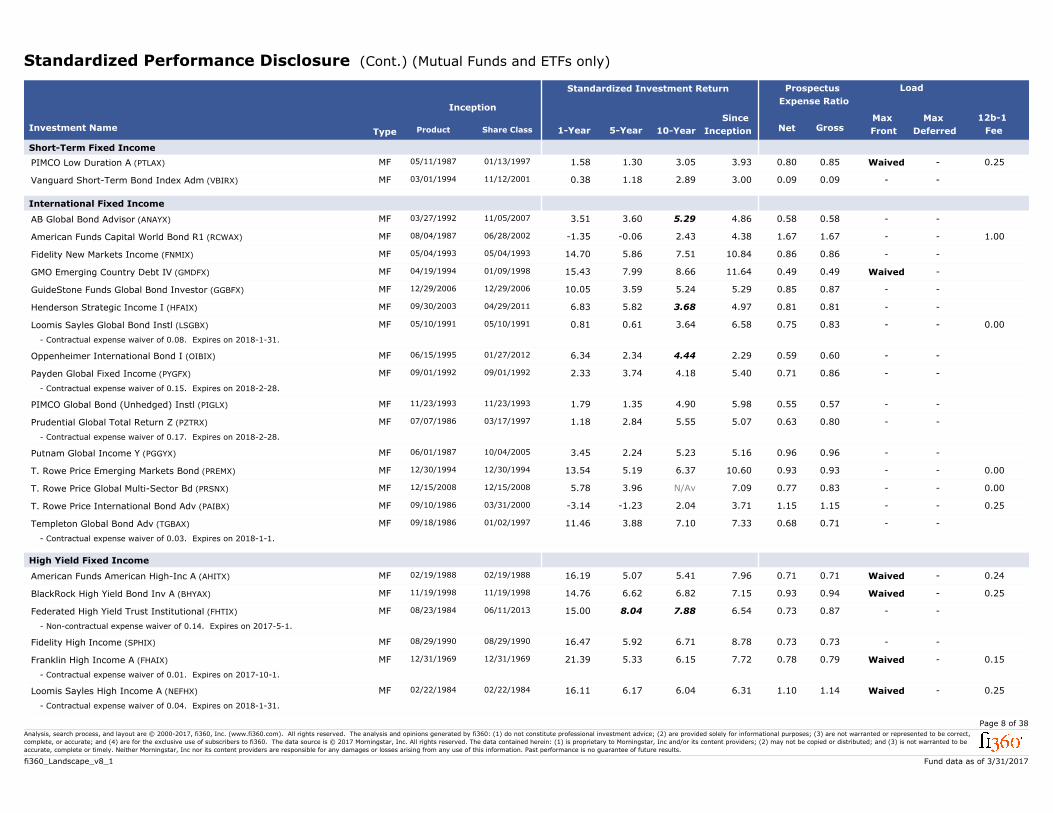
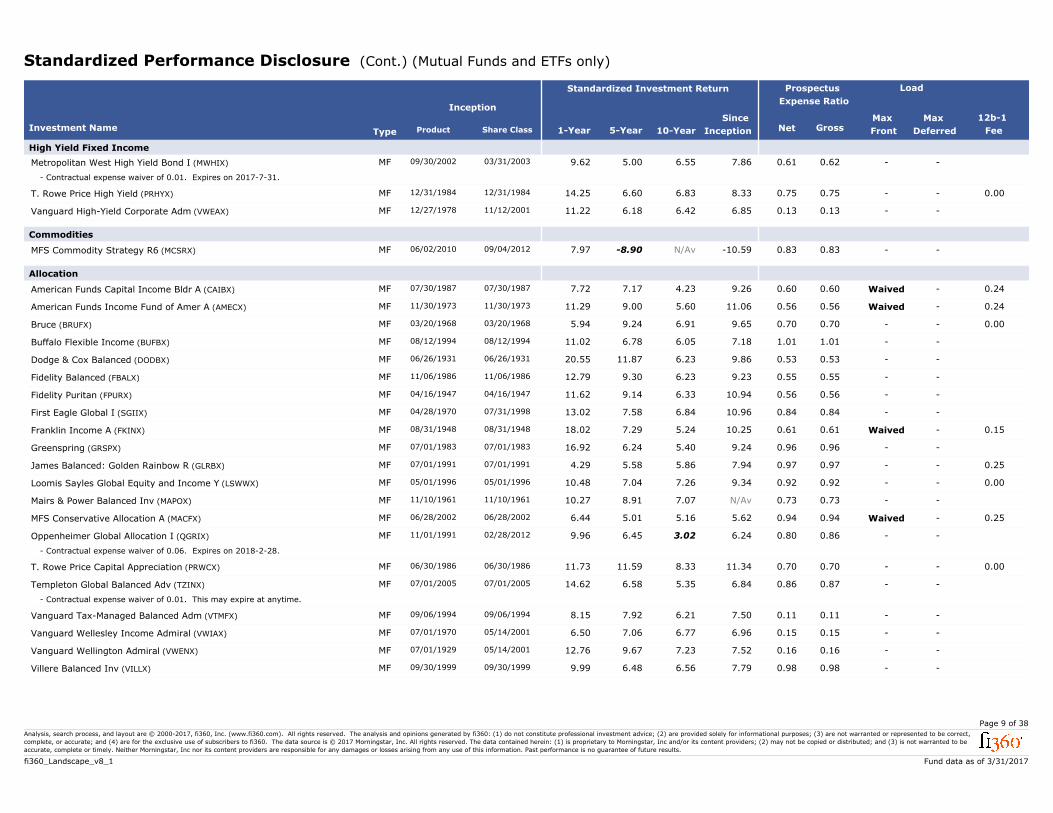
Standardized Performance Disclosure (Mutual Funds and ETFs only)
Standardized Returns for the period ended 3/31/2017. Returns for periods of less than one year are not annualized. Standardized Returns assume reinvestment of dividends and capital gains. It
depicts performance without adjusting for the effects of taxation, but are adjusted to reflect sales charges and ongoing fund expenses. If adjusted for taxation, the performance quoted would be
significantly reduced. The sales charge used in the calculation was obtained from the fund's most recent prospectus and/or shareholder report available to Morningstar.
Investors should consider the investment objectives, risks, and charges and expenses of a fund carefully before investing. Prospectuses and, if available, the summary prospectuses, containing
this and other information about the fund are available by contacting your financial consultant. Please read the prospectus and summary prospectus carefully before investing to make sure that
the fund is appropriate for your goals and risk tolerance. The performance information shown represents past performance and is not a guarantee of future results. The investment
return and principal value of an investment will fluctuate so that the shares, when redeemed, may be worth more or less than their original cost. Current performance may be lower or higher than
the performance information shown. For performance data current to the most recent month-end, please reference the Investment Company Contact Information section.
*For those investments a load-waived indication, the Standardized Returns shown below do not include the typical load (and reduction in return) that would accompany the share class if it were
purchased outside the load-waived enviroment.
Text in bold italics indicates Extended performance. Extended performance is based on the performance of the investment's oldest share class, adjusted for fees. Fi360 Fiduciary Score data
calculated using extended performance are shown with a colored border instead of a background.
ETF's trading on a secondary market may trade at, above, or below their net asset value ('NAV'). The market return ('MKT') is based on the price of the ETF as of the close of trading on the last
business day at month-end.
Standardized Investment Return
Investment Name
Inception
1-Year 5-Year 10-Year
Since
Inception
Prospectus
Expense Ratio
Load
Max
Front
Max
Deferred
12b-1
FeeProduct Share ClassType Net Gross
Large-Cap Equity
- -05/01/1967 0.2514.91 12.82 7.99 0.737.20American Funds AMCAP F1 (AMPFX) 03/16/2001MF 0.73
Waived -08/01/1978 0.2419.38 13.28 7.58 0.6112.45American Funds Fundamental Invs A (ANCFX) 08/01/1978MF 0.61
- -11/30/1973 20.65 14.03 7.94 0.398.65American Funds Growth Fund of Amer R5 (RGAFX) 05/15/2002MF 0.39
- -07/31/1952 16.48 12.87 7.12 0.357.29American Funds Washington Mutual R5 (RWMFX) 05/15/2002MF 0.35
- -11/03/2003 22.40 12.90 7.40 0.7015.07Becker Value Equity Institutional (BVEIX) 09/02/2011MF 0.68
- Contractual expense waiver of 0.02. Expires on 2018-2-28.
- -12/16/1998 21.07 14.55 6.87 0.427.72DFA Tax-Managed US Marketwide Value II (DFMVX) 12/16/1998MF 0.22
- -08/02/1994 23.05 14.77 6.82 0.2510.54DFA US Large Cap Value II (DFCVX) 08/02/1994MF 0.15
- -09/23/1999 17.10 13.22 7.52 0.085.54DFA US Large Company I (DFUSX) 09/23/1999MF 0.08
- -06/29/2001 20.66 13.62 7.66 0.5914.90Diamond Hill Large Cap Y (DHLYX) 12/30/2011MF 0.59
- -01/04/1965 28.58 15.24 6.26 0.5211.16Dodge & Cox Stock (DODGX) 01/04/1965MF 0.52
- -05/17/1967 15.61 12.48 8.77 0.6812.36Fidelity Contrafund (FCNTX) 05/17/1967MF 0.68
- -01/17/1983 24.14 14.32 11.23 0.6610.81Fidelity Growth Company K (FGCKX) 05/09/2008MF 0.66
- -11/05/1997 18.09 13.10 7.62 0.058.68Fidelity Total Market Index Premium (FSTVX) 10/14/2005MF 0.05
- -01/02/1968 22.49 12.93 10.35 0.679.67Franklin DynaTech Adv (FDYZX) 05/15/2008MF 0.66
- Contractual expense waiver of 0.01. Expires on 2018-2-1.
- -12/29/1987 15.83 12.30 8.98 0.7011.28Harbor Capital Appreciation Instl (HACAX) 12/29/1987MF 0.65
- -11/19/1990 16.72 12.95 6.58 0.5910.11Homestead Value (HOVLX) 11/19/1990MF 0.59
- -01/02/1997 0.0018.80 12.22 7.33 0.818.72JHancock Disciplined Value I (JVLIX) 01/02/1997MF 0.81
- -03/31/1999 20.99 14.96 6.13 0.668.37LSV Value Equity (LSVEX) 03/31/1999MF 0.66
Page 2 of 38
Fund data as of 3/31/2017
Analysis, search process, and layout are © 2000-2017, fi360, Inc. (www.fi360.com). All rights reserved. The analysis and opinions generated by fi360: (1) do not constitute professional investment advice; (2) are provided solely for informational purposes; (3) are not warranted or represented to be correct,
complete, or accurate; and (4) are for the exclusive use of subscribers to fi360. The data source is © 2017 Morningstar, Inc. All rights reserved. The data contained herein: (1) is proprietary to Morningstar, Inc and/or its content providers; (2) may not be copied or distributed; and (3) is not warranted to be
accurate, complete or timely. Neither Morningstar, Inc nor its content providers are responsible for any damages or losses arising from any use of this information. Past performance is no guarantee of future results.
fi360_Landscape_v8_1
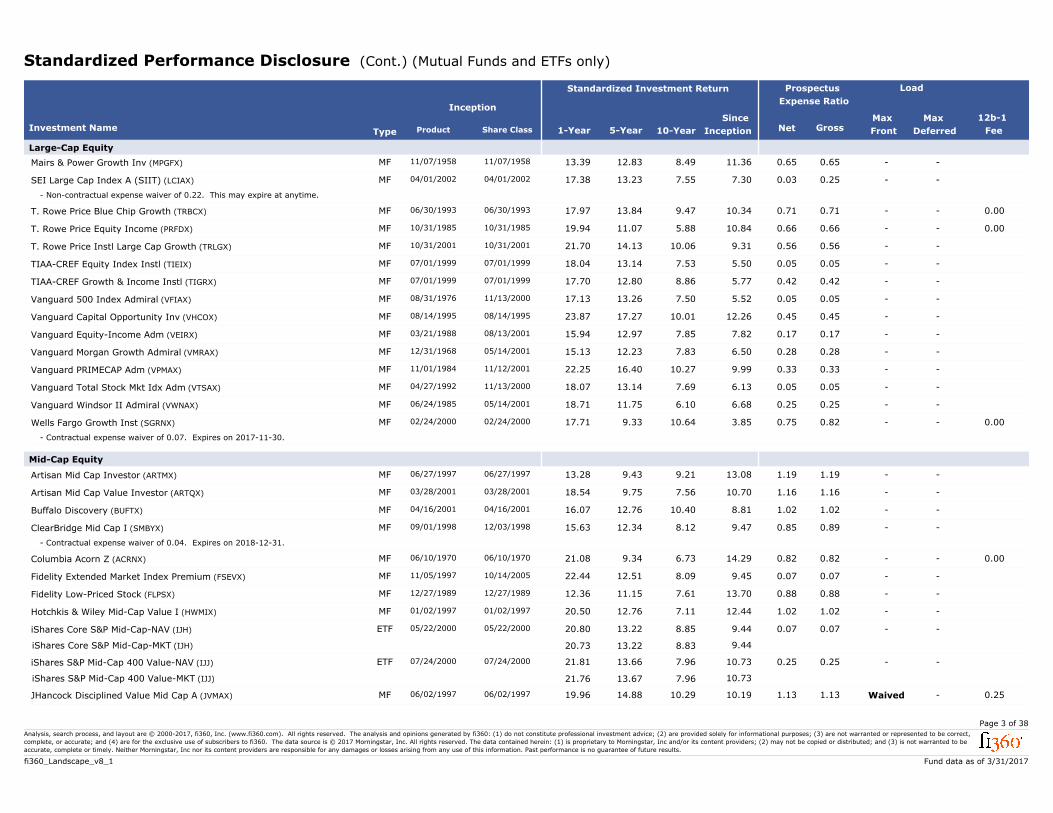
Standardized Performance Disclosure (Cont.) (Mutual Funds and ETFs only)
Standardized Investment Return
Investment Name
Inception
1-Year 5-Year 10-Year
Since
Inception
Prospectus
Expense Ratio
Load
Max
Front
Max
Deferred
12b-1
FeeProduct Share ClassType Net Gross
Large-Cap Equity
- -11/07/1958 13.39 12.83 8.49 0.6511.36Mairs & Power Growth Inv (MPGFX) 11/07/1958MF 0.65
- -04/01/2002 17.38 13.23 7.55 0.257.30SEI Large Cap Index A (SIIT) (LCIAX) 04/01/2002MF 0.03
- Non-contractual expense waiver of 0.22. This may expire at anytime.
- -06/30/1993 0.0017.97 13.84 9.47 0.7110.34T. Rowe Price Blue Chip Growth (TRBCX) 06/30/1993MF 0.71
- -10/31/1985 0.0019.94 11.07 5.88 0.6610.84T. Rowe Price Equity Income (PRFDX) 10/31/1985MF 0.66
- -10/31/2001 21.70 14.13 10.06 0.569.31T. Rowe Price Instl Large Cap Growth (TRLGX) 10/31/2001MF 0.56
- -07/01/1999 18.04 13.14 7.53 0.055.50TIAA-CREF Equity Index Instl (TIEIX) 07/01/1999MF 0.05
- -07/01/1999 17.70 12.80 8.86 0.425.77TIAA-CREF Growth & Income Instl (TIGRX) 07/01/1999MF 0.42
- -08/31/1976 17.13 13.26 7.50 0.055.52Vanguard 500 Index Admiral (VFIAX) 11/13/2000MF 0.05
- -08/14/1995 23.87 17.27 10.01 0.4512.26Vanguard Capital Opportunity Inv (VHCOX) 08/14/1995MF 0.45
- -03/21/1988 15.94 12.97 7.85 0.177.82Vanguard Equity-Income Adm (VEIRX) 08/13/2001MF 0.17
- -12/31/1968 15.13 12.23 7.83 0.286.50Vanguard Morgan Growth Admiral (VMRAX) 05/14/2001MF 0.28
- -11/01/1984 22.25 16.40 10.27 0.339.99Vanguard PRIMECAP Adm (VPMAX) 11/12/2001MF 0.33
- -04/27/1992 18.07 13.14 7.69 0.056.13Vanguard Total Stock Mkt Idx Adm (VTSAX) 11/13/2000MF 0.05
- -06/24/1985 18.71 11.75 6.10 0.256.68Vanguard Windsor II Admiral (VWNAX) 05/14/2001MF 0.25
- -02/24/2000 0.0017.71 9.33 10.64 0.823.85Wells Fargo Growth Inst (SGRNX) 02/24/2000MF 0.75
- Contractual expense waiver of 0.07. Expires on 2017-11-30.
Mid-Cap Equity
- -06/27/1997 13.28 9.43 9.21 1.1913.08Artisan Mid Cap Investor (ARTMX) 06/27/1997MF 1.19
- -03/28/2001 18.54 9.75 7.56 1.1610.70Artisan Mid Cap Value Investor (ARTQX) 03/28/2001MF 1.16
- -04/16/2001 16.07 12.76 10.40 1.028.81Buffalo Discovery (BUFTX) 04/16/2001MF 1.02
- -09/01/1998 15.63 12.34 8.12 0.899.47ClearBridge Mid Cap I (SMBYX) 12/03/1998MF 0.85
- Contractual expense waiver of 0.04. Expires on 2018-12-31.
- -06/10/1970 0.0021.08 9.34 6.73 0.8214.29Columbia Acorn Z (ACRNX) 06/10/1970MF 0.82
- -11/05/1997 22.44 12.51 8.09 0.079.45Fidelity Extended Market Index Premium (FSEVX) 10/14/2005MF 0.07
- -12/27/1989 12.36 11.15 7.61 0.8813.70Fidelity Low-Priced Stock (FLPSX) 12/27/1989MF 0.88
- -01/02/1997 20.50 12.76 7.11 1.0212.44Hotchkis & Wiley Mid-Cap Value I (HWMIX) 01/02/1997MF 1.02
- -05/22/2000 20.80 13.22 8.85 0.079.44iShares Core S&P Mid-Cap-NAV (IJH) 05/22/2000ETF 0.07
20.73 13.22 8.83 9.44iShares Core S&P Mid-Cap-MKT (IJH)
- -07/24/2000 21.81 13.66 7.96 0.2510.73iShares S&P Mid-Cap 400 Value-NAV (IJJ) 07/24/2000ETF 0.25
21.76 13.67 7.96 10.73iShares S&P Mid-Cap 400 Value-MKT (IJJ)
Waived -06/02/1997 0.2519.96 14.88 10.29 1.1310.19JHancock Disciplined Value Mid Cap A (JVMAX) 06/02/1997MF 1.13
Page 3 of 38
Fund data as of 3/31/2017
Analysis, search process, and layout are © 2000-2017, fi360, Inc. (www.fi360.com). All rights reserved. The analysis and opinions generated by fi360: (1) do not constitute professional investment advice; (2) are provided solely for informational purposes; (3) are not warranted or represented to be correct,
complete, or accurate; and (4) are for the exclusive use of subscribers to fi360. The data source is © 2017 Morningstar, Inc. All rights reserved. The data contained herein: (1) is proprietary to Morningstar, Inc and/or its content providers; (2) may not be copied or distributed; and (3) is not warranted to be
accurate, complete or timely. Neither Morningstar, Inc nor its content providers are responsible for any damages or losses arising from any use of this information. Past performance is no guarantee of future results.
fi360_Landscape_v8_1
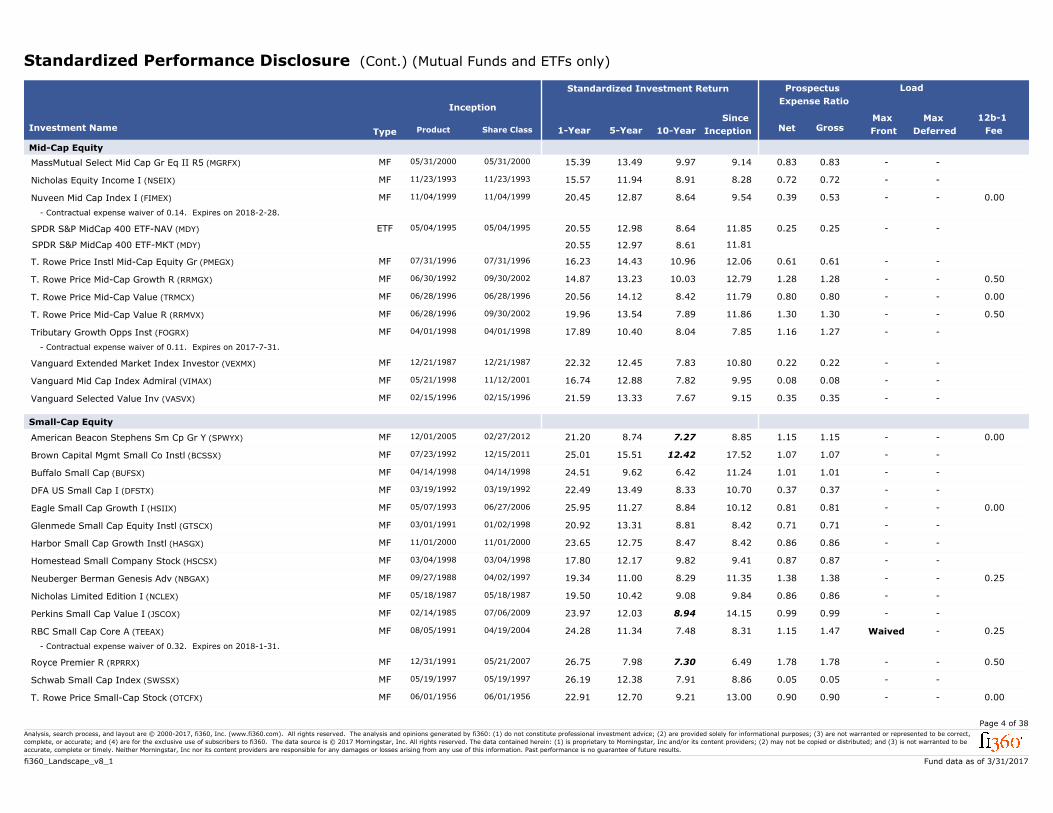
Standardized Performance Disclosure (Cont.) (Mutual Funds and ETFs only)
Standardized Investment Return
Investment Name
Inception
1-Year 5-Year 10-Year
Since
Inception
Prospectus
Expense Ratio
Load
Max
Front
Max
Deferred
12b-1
FeeProduct Share ClassType Net Gross
Mid-Cap Equity
- -05/31/2000 15.39 13.49 9.97 0.839.14MassMutual Select Mid Cap Gr Eq II R5 (MGRFX) 05/31/2000MF 0.83
- -11/23/1993 15.57 11.94 8.91 0.728.28Nicholas Equity Income I (NSEIX) 11/23/1993MF 0.72
- -11/04/1999 0.0020.45 12.87 8.64 0.539.54Nuveen Mid Cap Index I (FIMEX) 11/04/1999MF 0.39
- Contractual expense waiver of 0.14. Expires on 2018-2-28.
- -05/04/1995 20.55 12.98 8.64 0.2511.85SPDR S&P MidCap 400 ETF-NAV (MDY) 05/04/1995ETF 0.25
20.55 12.97 8.61 11.81SPDR S&P MidCap 400 ETF-MKT (MDY)
- -07/31/1996 16.23 14.43 10.96 0.6112.06T. Rowe Price Instl Mid-Cap Equity Gr (PMEGX) 07/31/1996MF 0.61
- -06/30/1992 0.5014.87 13.23 10.03 1.2812.79T. Rowe Price Mid-Cap Growth R (RRMGX) 09/30/2002MF 1.28
- -06/28/1996 0.0020.56 14.12 8.42 0.8011.79T. Rowe Price Mid-Cap Value (TRMCX) 06/28/1996MF 0.80
- -06/28/1996 0.5019.96 13.54 7.89 1.3011.86T. Rowe Price Mid-Cap Value R (RRMVX) 09/30/2002MF 1.30
- -04/01/1998 17.89 10.40 8.04 1.277.85Tributary Growth Opps Inst (FOGRX) 04/01/1998MF 1.16
- Contractual expense waiver of 0.11. Expires on 2017-7-31.
- -12/21/1987 22.32 12.45 7.83 0.2210.80Vanguard Extended Market Index Investor (VEXMX) 12/21/1987MF 0.22
- -05/21/1998 16.74 12.88 7.82 0.089.95Vanguard Mid Cap Index Admiral (VIMAX) 11/12/2001MF 0.08
- -02/15/1996 21.59 13.33 7.67 0.359.15Vanguard Selected Value Inv (VASVX) 02/15/1996MF 0.35
Small-Cap Equity
- -12/01/2005 0.0021.20 8.74 7.27 1.158.85American Beacon Stephens Sm Cp Gr Y (SPWYX) 02/27/2012MF 1.15
- -07/23/1992 25.01 15.51 12.42 1.0717.52Brown Capital Mgmt Small Co Instl (BCSSX) 12/15/2011MF 1.07
- -04/14/1998 24.51 9.62 6.42 1.0111.24Buffalo Small Cap (BUFSX) 04/14/1998MF 1.01
- -03/19/1992 22.49 13.49 8.33 0.3710.70DFA US Small Cap I (DFSTX) 03/19/1992MF 0.37
- -05/07/1993 0.0025.95 11.27 8.84 0.8110.12Eagle Small Cap Growth I (HSIIX) 06/27/2006MF 0.81
- -03/01/1991 20.92 13.31 8.81 0.718.42Glenmede Small Cap Equity Instl (GTSCX) 01/02/1998MF 0.71
- -11/01/2000 23.65 12.75 8.47 0.868.42Harbor Small Cap Growth Instl (HASGX) 11/01/2000MF 0.86
- -03/04/1998 17.80 12.17 9.82 0.879.41Homestead Small Company Stock (HSCSX) 03/04/1998MF 0.87
- -09/27/1988 0.2519.34 11.00 8.29 1.3811.35Neuberger Berman Genesis Adv (NBGAX) 04/02/1997MF 1.38
- -05/18/1987 19.50 10.42 9.08 0.869.84Nicholas Limited Edition I (NCLEX) 05/18/1987MF 0.86
- -02/14/1985 23.97 12.03 8.94 0.9914.15Perkins Small Cap Value I (JSCOX) 07/06/2009MF 0.99
Waived -08/05/1991 0.2524.28 11.34 7.48 1.478.31RBC Small Cap Core A (TEEAX) 04/19/2004MF 1.15
- Contractual expense waiver of 0.32. Expires on 2018-1-31.
- -12/31/1991 0.5026.75 7.98 7.30 1.786.49Royce Premier R (RPRRX) 05/21/2007MF 1.78
- -05/19/1997 26.19 12.38 7.91 0.058.86Schwab Small Cap Index (SWSSX) 05/19/1997MF 0.05
- -06/01/1956 0.0022.91 12.70 9.21 0.9013.00T. Rowe Price Small-Cap Stock (OTCFX) 06/01/1956MF 0.90
Page 4 of 38
Fund data as of 3/31/2017
Analysis, search process, and layout are © 2000-2017, fi360, Inc. (www.fi360.com). All rights reserved. The analysis and opinions generated by fi360: (1) do not constitute professional investment advice; (2) are provided solely for informational purposes; (3) are not warranted or represented to be correct,
complete, or accurate; and (4) are for the exclusive use of subscribers to fi360. The data source is © 2017 Morningstar, Inc. All rights reserved. The data contained herein: (1) is proprietary to Morningstar, Inc and/or its content providers; (2) may not be copied or distributed; and (3) is not warranted to be
accurate, complete or timely. Neither Morningstar, Inc nor its content providers are responsible for any damages or losses arising from any use of this information. Past performance is no guarantee of future results.
fi360_Landscape_v8_1
Standardized Performance Disclosure (Cont.) (Mutual Funds and ETFs only)
Standardized Investment Return
Investment Name
Inception
1-Year 5-Year 10-Year
Since
Inception
Prospectus
Expense Ratio
Load
Max
Front
Max
Deferred
12b-1
FeeProduct Share ClassType Net Gross
Small-Cap Equity
- -05/21/1998 19.57 11.06 8.20 0.208.34Vanguard Small Cap Growth Index Inv (VISGX) 05/21/1998MF 0.20
- -10/03/1960 21.51 12.89 8.20 0.089.10Vanguard Small Cap Index Adm (VSMAX) 11/13/2000MF 0.08
- -05/21/1998 22.77 14.02 7.62 0.208.79Vanguard Small Cap Value Index Inv (VISVX) 05/21/1998MF 0.20
- -10/03/1960 21.51 12.89 8.21 0.089.16Vanguard Small-Cap ETF-NAV (VB) 01/26/2004ETF 0.08
21.52 12.89 8.22 9.16Vanguard Small-Cap ETF-MKT (VB)
- -03/25/1999 23.96 14.15 8.90 0.0710.65Vanguard Tax-Managed Small Cap I (VTSIX) 04/21/1999MF 0.07
Developed International Equity
Waived -03/26/1993 0.2414.09 9.25 4.89 0.7910.49American Funds Capital World Gr&Inc A (CWGIX) 03/26/1993MF 0.79
Waived -04/16/1984 0.2412.72 6.27 3.24 0.8310.68American Funds Europacific Growth A (AEPGX) 04/16/1984MF 0.83
Waived -03/13/1973 0.2414.38 10.31 6.55 0.7712.12American Funds New Perspective A (ANWPX) 03/13/1973MF 0.77
Waived -04/30/1990 0.2418.06 10.06 5.68 1.109.54American Funds SMALLCAP World A (SMCWX) 04/30/1990MF 1.10
- -12/27/1996 12.38 6.34 0.80 0.988.05Brandes International Equity I (BIIEX) 12/27/1996MF 1.00
- Contractual expense waiver of -0.02. Expires on 2018-1-31.
Waived -08/20/1996 0.2510.34 10.76 6.27 1.3111.57Brandes International Small Cap Equity A (BISAX) 01/31/2012MF 1.32
- Contractual expense waiver of -0.01. Expires on 2018-1-31.
- -12/29/1994 17.30 9.78 3.37 0.687.71DFA International Small Cap Value I (DISVX) 12/29/1994MF 0.68
- -02/15/1994 19.69 5.23 0.37 0.636.20DFA International Value I (DFIVX) 02/15/1994MF 0.43
- -05/01/2001 22.97 7.32 2.52 0.647.62Dodge & Cox International Stock (DODFX) 05/01/2001MF 0.64
- -11/05/1997 12.17 5.94 1.18 0.067.07Fidelity International Index Instl (FSPNX) 09/08/2011MF 0.06
- -10/15/2002 6.45 9.96 6.30 0.996.36Franklin Intl Small Cap Growth R6 (FCAPX) 05/01/2013MF 0.99
Waived -10/14/1991 7.35 7.97 2.88 0.948.89GMO International Small Companies III (GMISX) 10/14/1991MF 0.76
- Contractual expense waiver of 0.18. Expires on 2017-6-30.
- -05/11/1994 15.01 6.59 4.34 0.836.06Harding Loevner International Eq Instl (HLMIX) 05/11/1994MF 0.83
- Contractual expense ratio cap of 1.00. Expires on 2017-2-28.
Waived -08/31/2000 0.2516.51 4.32 2.84 1.549.20Invesco International Small Company A (IEGAX) 08/31/2000MF 1.53
- -12/10/2007 11.20 9.11 N/Av 0.403.32iShares MSCI EAFE Small-Cap-NAV (SCZ) 12/10/2007ETF 0.40
11.82 9.07 N/Av 3.24iShares MSCI EAFE Small-Cap-MKT (SCZ)
Waived -12/29/1986 0.2513.16 10.09 6.25 1.228.66MFS Global Equity A (MWEFX) 09/07/1993MF 1.22
- -09/30/1992 21.68 8.98 4.59 1.059.97Oakmark International Investor (OAKIX) 09/30/1992MF 1.00
Waived -10/22/1990 0.2537.19 13.60 9.16 1.1911.97Oppenheimer Global Opportunities A (OPGIX) 10/22/1990MF 1.19
- -03/25/1996 4.38 6.48 3.90 0.896.62Oppenheimer International Growth Y (OIGYX) 09/07/2005MF 0.89
- -09/14/1993 12.61 4.60 2.99 1.057.90Scout International (UMBWX) 09/14/1993MF 1.05
Page 5 of 38
Fund data as of 3/31/2017
Analysis, search process, and layout are © 2000-2017, fi360, Inc. (www.fi360.com). All rights reserved. The analysis and opinions generated by fi360: (1) do not constitute professional investment advice; (2) are provided solely for informational purposes; (3) are not warranted or represented to be correct,
complete, or accurate; and (4) are for the exclusive use of subscribers to fi360. The data source is © 2017 Morningstar, Inc. All rights reserved. The data contained herein: (1) is proprietary to Morningstar, Inc and/or its content providers; (2) may not be copied or distributed; and (3) is not warranted to be
accurate, complete or timely. Neither Morningstar, Inc nor its content providers are responsible for any damages or losses arising from any use of this information. Past performance is no guarantee of future results.
fi360_Landscape_v8_1
Standardized Performance Disclosure (Cont.) (Mutual Funds and ETFs only)
Standardized Investment Return
Investment Name
Inception
1-Year 5-Year 10-Year
Since
Inception
Prospectus
Expense Ratio
Load
Max
Front
Max
Deferred
12b-1
FeeProduct Share ClassType Net Gross
Developed International Equity
- -12/30/1988 13.48 10.28 5.47 1.2010.17T. Rowe Price International Discovery (PRIDX) 12/30/1988MF 1.20
- -10/21/2002 10.46 6.84 5.11 0.9811.31Templeton Ins Foreign Smaller Co Ser Adv (TFSCX) 10/21/2002MF 0.98
- -05/28/1998 0.009.03 4.87 2.98 0.907.03Thornburg International Value I (TGVIX) 03/30/2001MF 0.90
- -03/02/2007 13.89 4.73 1.71 0.116.75Vanguard FTSE All-Wld ex-US Idx Admiral (VFWAX) 09/27/2011MF 0.11
- -11/04/1996 10.56 8.75 2.95 0.419.32Vanguard International Explorer Inv (VINEX) 11/04/1996MF 0.41
- -09/30/1981 17.10 6.96 3.50 0.336.61Vanguard International Growth Adm (VWILX) 08/13/2001MF 0.33
- -05/16/1983 13.46 5.20 1.21 0.438.75Vanguard International Value Inv (VTRIX) 05/16/1983MF 0.43
- -04/29/1996 13.74 4.83 1.36 0.114.20Vanguard Total Intl Stock Index Admiral (VTIAX) 11/29/2010MF 0.11
- -06/16/2006 14.23 9.44 3.27 0.585.94WisdomTree International SmallCp Div ETF-NAV (DLS) 06/16/2006ETF 0.58
14.91 9.44 3.26 5.95WisdomTree International SmallCp Div ETF-MKT (DLS)
Emerging Market Equity
Waived -06/17/1999 0.2314.68 4.05 3.79 1.077.64American Funds New World A (NEWFX) 06/17/1999MF 1.07
- -08/14/1997 17.84 1.49 3.53 0.446.98DFA Emerging Markets II (DFETX) 08/14/1997MF 0.34
- -04/01/1998 25.67 1.08 2.89 0.6610.34DFA Emerging Markets Value I (DFEVX) 04/01/1998MF 0.56
- -10/17/2005 18.67 3.46 3.72 1.296.97Harding Loevner Instl Emerg Mkts I (HLMEX) 10/17/2005MF 1.29
- Contractual expense ratio cap of 1.30. Expires on 2017-2-28.
- -07/15/1994 22.40 1.05 3.62 1.106.94Lazard Emerging Markets Equity Instl (LZEMX) 07/15/1994MF 1.10
- -04/14/1997 13.55 -0.18 3.17 1.197.44Macquarie Pooled Emerging Markets (DPEMX) 04/14/1997MF 1.19
Waived -11/18/1996 0.2515.18 2.05 5.09 1.3211.81Oppenheimer Developing Markets A (ODMAX) 11/18/1996MF 1.32
- -06/30/1998 14.29 1.33 3.12 0.9510.62Parametric Tax-Managed Emerg Mkt Instl (EITEX) 06/30/1998MF 0.95
Long-Term Fixed Income
- -12/20/2005 -5.16 3.97 6.59 0.096.20Fidelity Long-Term Treasury Bd Idx Prem (FLBAX) 12/20/2005MF 0.09
- -08/27/2001 3.06 5.17 7.50 0.857.58GuideStone Funds Extended-Dur Bd Inv (GEDZX) 08/27/2001MF 0.84
- -11/28/2007 -7.46 5.68 N/Av 0.077.70Vanguard Extended Duration Trs ETF-NAV (EDV) 12/06/2007ETF 0.07
-7.75 5.70 N/Av 8.17Vanguard Extended Duration Trs ETF-MKT (EDV)
- -03/01/1994 0.93 4.90 6.99 0.066.69Vanguard Long-Term Bond Index Instl (VBLLX) 02/02/2006MF 0.06
- -07/09/1973 2.43 5.83 7.15 0.127.18Vanguard Long-Term Investment-Grade Adm (VWETX) 02/12/2001MF 0.12
- -05/19/1986 -4.95 4.00 6.61 0.106.55Vanguard Long-Term Treasury Admiral (VUSUX) 02/12/2001MF 0.10
Intermediate Fixed Income
- -06/28/2004 1.84 0.61 4.18 0.604.48BlackRock Inflation Protected Bond Instl (BPRIX) 06/28/2004MF 0.35
- Contractual expense waiver of 0.18. Expires on 2018-1-31.
- -11/02/1979 0.69 3.73 4.48 0.514.93BlackRock National Municipal K (BNMLX) 07/15/2011MF 0.39
Page 6 of 38
Fund data as of 3/31/2017
Analysis, search process, and layout are © 2000-2017, fi360, Inc. (www.fi360.com). All rights reserved. The analysis and opinions generated by fi360: (1) do not constitute professional investment advice; (2) are provided solely for informational purposes; (3) are not warranted or represented to be correct,
complete, or accurate; and (4) are for the exclusive use of subscribers to fi360. The data source is © 2017 Morningstar, Inc. All rights reserved. The data contained herein: (1) is proprietary to Morningstar, Inc and/or its content providers; (2) may not be copied or distributed; and (3) is not warranted to be
accurate, complete or timely. Neither Morningstar, Inc nor its content providers are responsible for any damages or losses arising from any use of this information. Past performance is no guarantee of future results.
fi360_Landscape_v8_1
Standardized Performance Disclosure (Cont.) (Mutual Funds and ETFs only)
Standardized Investment Return
Investment Name
Inception
1-Year 5-Year 10-Year
Since
Inception
Prospectus
Expense Ratio
Load
Max
Front
Max
Deferred
12b-1
FeeProduct Share ClassType Net Gross
Intermediate Fixed Income
- Contractual expense waiver of 0.11. Expires on 2017-10-31.
- -02/05/2008 5.69 3.56 N/Av 0.804.38BlackRock Strategic Income Opps Instl (BSIIX) 02/05/2008MF 0.64
- -09/18/2006 1.17 0.94 4.44 0.124.41DFA Inflation-Protected Securities I (DIPSX) 09/18/2006MF 0.12
- -01/03/1989 4.39 3.41 5.02 0.436.87Dodge & Cox Income (DODIX) 01/03/1989MF 0.43
- -06/26/2002 1.05 0.55 3.54 0.454.31Fidelity Inflation-Protected Bond (FINPX) 06/26/2002MF 0.45
- -05/01/1998 8.08 4.11 5.83 0.706.54Fidelity Strategic Income (FSICX) 05/01/1998MF 0.70
- -10/15/2002 3.90 3.27 4.88 0.455.03Fidelity Total Bond (FTBFX) 10/15/2002MF 0.45
Waived -11/07/1973 0.255.02 3.65 5.95 0.737.07Loomis Sayles Core Plus Bond A (NEFRX) 11/07/1973MF 0.73
- -12/31/1996 0.254.62 2.88 5.39 1.074.57Loomis Sayles Investment Grade Bond Adm (LIGAX) 02/01/2010MF 1.07
- -05/01/1995 0.0010.23 5.42 6.43 0.718.46Loomis Sayles Strategic Income Y (NEZYX) 12/01/1999MF 0.71
Waived -04/01/1971 0.2013.48 6.47 6.51 0.828.56Lord Abbett Bond-Debenture A (LBNDX) 04/01/1971MF 0.82
- -03/31/1997 0.93 3.69 5.80 0.446.23Metropolitan West Total Return Bd I (MWTIX) 03/31/2000MF 0.44
Waived -07/31/2003 0.2511.09 4.93 6.14 1.166.88PIMCO Diversified Inc A (PDVAX) 07/31/2003MF 1.15
- -05/11/1987 0.252.18 2.70 5.35 0.726.32PIMCO Total Return Admin (PTRAX) 09/08/1994MF 0.71
Waived -10/03/1988 0.2512.77 3.87 3.69 1.006.19Putnam Diversified Income A (PDINX) 10/03/1988MF 1.00
- -10/23/1989 0.03 2.75 4.23 0.554.27Putnam MA Tax Exempt Income Y (PMAYX) 01/02/2008MF 0.55
- -03/31/2006 1.26 0.76 3.75 0.053.83Schwab Treasury Infl Protected Secs Idx (SWRSX) 03/31/2006MF 0.05
- -02/23/2001 -0.09 1.99 5.17 0.725.16Scout Core Bond I (SCCIX) 02/23/2001MF 0.40
- Contractual expense waiver of 0.32. Expires on 2017-10-30.
- -08/31/1973 0.000.96 2.38 4.45 0.557.02T. Rowe Price New Income (PRCIX) 08/31/1973MF 0.54
- -10/01/2002 0.150.97 0.41 3.67 0.423.05TIAA-CREF Inflation Link Bd Premier (TIKPX) 09/30/2009MF 0.42
- -12/27/1978 0.74 4.27 4.60 0.094.78Vanguard High-Yield Tax-Exempt Adm (VWALX) 11/12/2001MF 0.09
- -06/29/2000 1.46 0.95 4.11 0.103.81Vanguard Inflation-Protected Secs Adm (VAIPX) 06/10/2005MF 0.10
- -03/01/1994 0.00 2.89 5.24 0.165.99Vanguard Interm-Term Bond Index Inv (VBIIX) 03/01/1994MF 0.16
- -10/28/1991 -1.32 1.68 4.44 0.104.82Vanguard Interm-Term Treasury Adm (VFIUX) 02/12/2001MF 0.10
- -12/09/1998 -0.65 3.29 4.08 0.154.41Vanguard MA Tax-Exempt Inv (VMATX) 12/09/1998MF 0.15
- -12/11/1986 0.43 2.27 4.23 0.064.23Vanguard Total Bond Market Index Adm (VBTLX) 11/12/2001MF 0.06
Waived -03/01/2001 0.250.37 -0.04 3.29 0.65-0.45Western Asset Inflation Idxd Plus Bd A (WAFAX) 04/30/2012MF 0.65
- -07/01/1994 1.97 2.78 4.50 0.525.72Western Asset Intermediate Bond I (WATIX) 07/01/1994MF 0.52
Short-Term Fixed Income
- -03/04/2009 1.12 1.67 N/Av 0.223.14DFA Short-Term Extended Quality I (DFEQX) 03/04/2009MF 0.22
- -04/25/2008 0.255.35 4.15 N/Av 0.776.10Frost Total Return Bond Investor (FATRX) 06/30/2008MF 0.77
Page 7 of 38
Fund data as of 3/31/2017
Analysis, search process, and layout are © 2000-2017, fi360, Inc. (www.fi360.com). All rights reserved. The analysis and opinions generated by fi360: (1) do not constitute professional investment advice; (2) are provided solely for informational purposes; (3) are not warranted or represented to be correct,
complete, or accurate; and (4) are for the exclusive use of subscribers to fi360. The data source is © 2017 Morningstar, Inc. All rights reserved. The data contained herein: (1) is proprietary to Morningstar, Inc and/or its content providers; (2) may not be copied or distributed; and (3) is not warranted to be
accurate, complete or timely. Neither Morningstar, Inc nor its content providers are responsible for any damages or losses arising from any use of this information. Past performance is no guarantee of future results.
fi360_Landscape_v8_1
Standardized Performance Disclosure (Cont.) (Mutual Funds and ETFs only)
Standardized Investment Return
Investment Name
Inception
1-Year 5-Year 10-Year
Since
Inception
Prospectus
Expense Ratio
Load
Max
Front
Max
Deferred
12b-1
FeeProduct Share ClassType Net Gross
Short-Term Fixed Income
Waived -05/11/1987 0.251.58 1.30 3.05 0.853.93PIMCO Low Duration A (PTLAX) 01/13/1997MF 0.80
- -03/01/1994 0.38 1.18 2.89 0.093.00Vanguard Short-Term Bond Index Adm (VBIRX) 11/12/2001MF 0.09
International Fixed Income
- -03/27/1992 3.51 3.60 5.29 0.584.86AB Global Bond Advisor (ANAYX) 11/05/2007MF 0.58
- -08/04/1987 1.00-1.35 -0.06 2.43 1.674.38American Funds Capital World Bond R1 (RCWAX) 06/28/2002MF 1.67
- -05/04/1993 14.70 5.86 7.51 0.8610.84Fidelity New Markets Income (FNMIX) 05/04/1993MF 0.86
Waived -04/19/1994 15.43 7.99 8.66 0.4911.64GMO Emerging Country Debt IV (GMDFX) 01/09/1998MF 0.49
- -12/29/2006 10.05 3.59 5.24 0.875.29GuideStone Funds Global Bond Investor (GGBFX) 12/29/2006MF 0.85
- -09/30/2003 6.83 5.82 3.68 0.814.97Henderson Strategic Income I (HFAIX) 04/29/2011MF 0.81
- -05/10/1991 0.000.81 0.61 3.64 0.836.58Loomis Sayles Global Bond Instl (LSGBX) 05/10/1991MF 0.75
- Contractual expense waiver of 0.08. Expires on 2018-1-31.
- -06/15/1995 6.34 2.34 4.44 0.602.29Oppenheimer International Bond I (OIBIX) 01/27/2012MF 0.59
- -09/01/1992 2.33 3.74 4.18 0.865.40Payden Global Fixed Income (PYGFX) 09/01/1992MF 0.71
- Contractual expense waiver of 0.15. Expires on 2018-2-28.
- -11/23/1993 1.79 1.35 4.90 0.575.98PIMCO Global Bond (Unhedged) Instl (PIGLX) 11/23/1993MF 0.55
- -07/07/1986 1.18 2.84 5.55 0.805.07Prudential Global Total Return Z (PZTRX) 03/17/1997MF 0.63
- Contractual expense waiver of 0.17. Expires on 2018-2-28.
- -06/01/1987 3.45 2.24 5.23 0.965.16Putnam Global Income Y (PGGYX) 10/04/2005MF 0.96
- -12/30/1994 0.0013.54 5.19 6.37 0.9310.60T. Rowe Price Emerging Markets Bond (PREMX) 12/30/1994MF 0.93
- -12/15/2008 0.005.78 3.96 N/Av 0.837.09T. Rowe Price Global Multi-Sector Bd (PRSNX) 12/15/2008MF 0.77
- -09/10/1986 0.25-3.14 -1.23 2.04 1.153.71T. Rowe Price International Bond Adv (PAIBX) 03/31/2000MF 1.15
- -09/18/1986 11.46 3.88 7.10 0.717.33Templeton Global Bond Adv (TGBAX) 01/02/1997MF 0.68
- Contractual expense waiver of 0.03. Expires on 2018-1-1.
High Yield Fixed Income
Waived -02/19/1988 0.2416.19 5.07 5.41 0.717.96American Funds American High-Inc A (AHITX) 02/19/1988MF 0.71
Waived -11/19/1998 0.2514.76 6.62 6.82 0.947.15BlackRock High Yield Bond Inv A (BHYAX) 11/19/1998MF 0.93
- -08/23/1984 15.00 8.04 7.88 0.876.54Federated High Yield Trust Institutional (FHTIX) 06/11/2013MF 0.73
- Non-contractual expense waiver of 0.14. Expires on 2017-5-1.
- -08/29/1990 16.47 5.92 6.71 0.738.78Fidelity High Income (SPHIX) 08/29/1990MF 0.73
Waived -12/31/1969 0.1521.39 5.33 6.15 0.797.72Franklin High Income A (FHAIX) 12/31/1969MF 0.78
- Contractual expense waiver of 0.01. Expires on 2017-10-1.
Waived -02/22/1984 0.2516.11 6.17 6.04 1.146.31Loomis Sayles High Income A (NEFHX) 02/22/1984MF 1.10
- Contractual expense waiver of 0.04. Expires on 2018-1-31.
Page 8 of 38
Fund data as of 3/31/2017
Analysis, search process, and layout are © 2000-2017, fi360, Inc. (www.fi360.com). All rights reserved. The analysis and opinions generated by fi360: (1) do not constitute professional investment advice; (2) are provided solely for informational purposes; (3) are not warranted or represented to be correct,
complete, or accurate; and (4) are for the exclusive use of subscribers to fi360. The data source is © 2017 Morningstar, Inc. All rights reserved. The data contained herein: (1) is proprietary to Morningstar, Inc and/or its content providers; (2) may not be copied or distributed; and (3) is not warranted to be
accurate, complete or timely. Neither Morningstar, Inc nor its content providers are responsible for any damages or losses arising from any use of this information. Past performance is no guarantee of future results.
fi360_Landscape_v8_1
Standardized Performance Disclosure (Cont.) (Mutual Funds and ETFs only)
Standardized Investment Return
Investment Name
Inception
1-Year 5-Year 10-Year
Since
Inception
Prospectus
Expense Ratio
Load
Max
Front
Max
Deferred
12b-1
FeeProduct Share ClassType Net Gross
High Yield Fixed Income
- -09/30/2002 9.62 5.00 6.55 0.627.86Metropolitan West High Yield Bond I (MWHIX) 03/31/2003MF 0.61
- Contractual expense waiver of 0.01. Expires on 2017-7-31.
- -12/31/1984 0.0014.25 6.60 6.83 0.758.33T. Rowe Price High Yield (PRHYX) 12/31/1984MF 0.75
- -12/27/1978 11.22 6.18 6.42 0.136.85Vanguard High-Yield Corporate Adm (VWEAX) 11/12/2001MF 0.13
Commodities
- -06/02/2010 7.97 -8.90 N/Av 0.83-10.59MFS Commodity Strategy R6 (MCSRX) 09/04/2012MF 0.83
Allocation
Waived -07/30/1987 0.247.72 7.17 4.23 0.609.26American Funds Capital Income Bldr A (CAIBX) 07/30/1987MF 0.60
Waived -11/30/1973 0.2411.29 9.00 5.60 0.5611.06American Funds Income Fund of Amer A (AMECX) 11/30/1973MF 0.56
- -03/20/1968 0.005.94 9.24 6.91 0.709.65Bruce (BRUFX) 03/20/1968MF 0.70
- -08/12/1994 11.02 6.78 6.05 1.017.18Buffalo Flexible Income (BUFBX) 08/12/1994MF 1.01
- -06/26/1931 20.55 11.87 6.23 0.539.86Dodge & Cox Balanced (DODBX) 06/26/1931MF 0.53
- -11/06/1986 12.79 9.30 6.23 0.559.23Fidelity Balanced (FBALX) 11/06/1986MF 0.55
- -04/16/1947 11.62 9.14 6.33 0.5610.94Fidelity Puritan (FPURX) 04/16/1947MF 0.56
- -04/28/1970 13.02 7.58 6.84 0.8410.96First Eagle Global I (SGIIX) 07/31/1998MF 0.84
Waived -08/31/1948 0.1518.02 7.29 5.24 0.6110.25Franklin Income A (FKINX) 08/31/1948MF 0.61
- -07/01/1983 16.92 6.24 5.40 0.969.24Greenspring (GRSPX) 07/01/1983MF 0.96
- -07/01/1991 0.254.29 5.58 5.86 0.977.94James Balanced: Golden Rainbow R (GLRBX) 07/01/1991MF 0.97
- -05/01/1996 0.0010.48 7.04 7.26 0.929.34Loomis Sayles Global Equity and Income Y (LSWWX) 05/01/1996MF 0.92
- -11/10/1961 10.27 8.91 7.07 0.73N/AvMairs & Power Balanced Inv (MAPOX) 11/10/1961MF 0.73
Waived -06/28/2002 0.256.44 5.01 5.16 0.945.62MFS Conservative Allocation A (MACFX) 06/28/2002MF 0.94
- -11/01/1991 9.96 6.45 3.02 0.866.24Oppenheimer Global Allocation I (QGRIX) 02/28/2012MF 0.80
- Contractual expense waiver of 0.06. Expires on 2018-2-28.
- -06/30/1986 0.0011.73 11.59 8.33 0.7011.34T. Rowe Price Capital Appreciation (PRWCX) 06/30/1986MF 0.70
- -07/01/2005 14.62 6.58 5.35 0.876.84Templeton Global Balanced Adv (TZINX) 07/01/2005MF 0.86
- Contractual expense waiver of 0.01. This may expire at anytime.
- -09/06/1994 8.15 7.92 6.21 0.117.50Vanguard Tax-Managed Balanced Adm (VTMFX) 09/06/1994MF 0.11
- -07/01/1970 6.50 7.06 6.77 0.156.96Vanguard Wellesley Income Admiral (VWIAX) 05/14/2001MF 0.15
- -07/01/1929 12.76 9.67 7.23 0.167.52Vanguard Wellington Admiral (VWENX) 05/14/2001MF 0.16
- -09/30/1999 9.99 6.48 6.56 0.987.79Villere Balanced Inv (VILLX) 09/30/1999MF 0.98
Page 9 of 38
Fund data as of 3/31/2017
Analysis, search process, and layout are © 2000-2017, fi360, Inc. (www.fi360.com). All rights reserved. The analysis and opinions generated by fi360: (1) do not constitute professional investment advice; (2) are provided solely for informational purposes; (3) are not warranted or represented to be correct,
complete, or accurate; and (4) are for the exclusive use of subscribers to fi360. The data source is © 2017 Morningstar, Inc. All rights reserved. The data contained herein: (1) is proprietary to Morningstar, Inc and/or its content providers; (2) may not be copied or distributed; and (3) is not warranted to be
accurate, complete or timely. Neither Morningstar, Inc nor its content providers are responsible for any damages or losses arising from any use of this information. Past performance is no guarantee of future results.
fi360_Landscape_v8_1
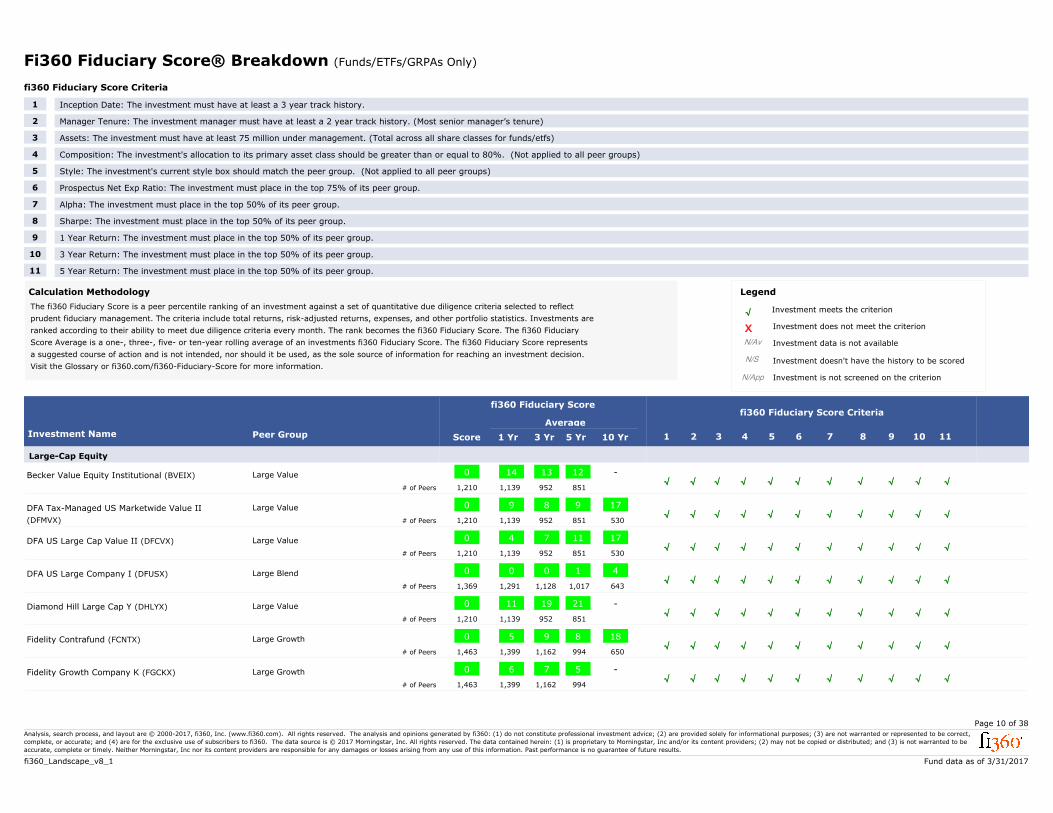
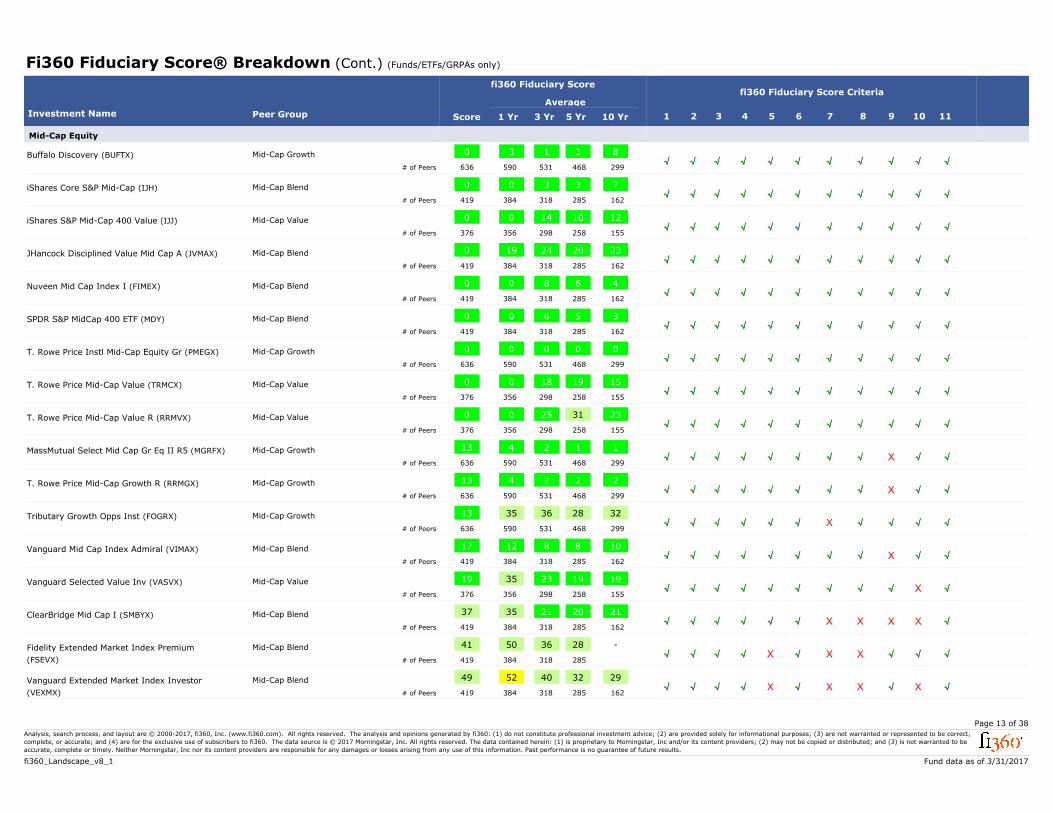
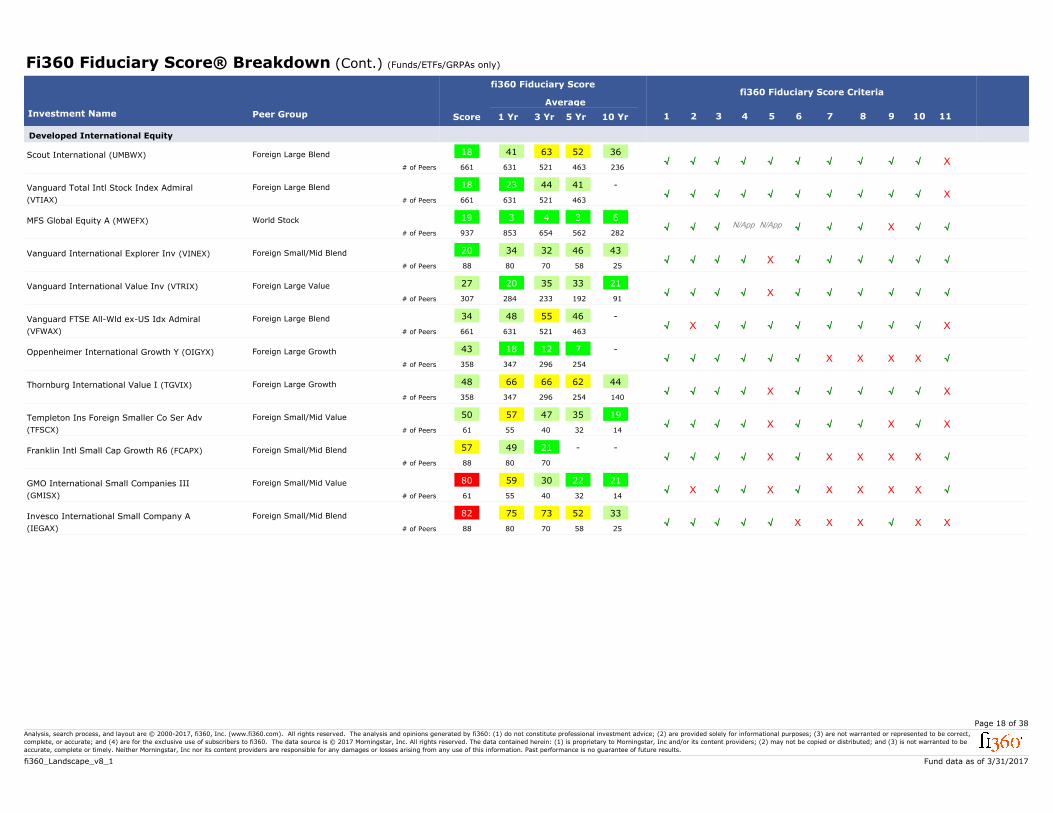
Fi360 Fiduciary Score® Breakdown (Funds/ETFs/GRPAs Only)
fi360 Fiduciary Score Criteria
Inception Date: The investment must have at least a 3 year track history.1
Manager Tenure: The investment manager must have at least a 2 year track history. (Most senior manager’s tenure)2
Assets: The investment must have at least 75 million under management. (Total across all share classes for funds/etfs)3
Composition: The investment's allocation to its primary asset class should be greater than or equal to 80%. (Not applied to all peer groups)4
Style: The investment's current style box should match the peer group. (Not applied to all peer groups)5
Prospectus Net Exp Ratio: The investment must place in the top 75% of its peer group.6
Alpha: The investment must place in the top 50% of its peer group.7
Sharpe: The investment must place in the top 50% of its peer group.8
1 Year Return: The investment must place in the top 50% of its peer group.9
3 Year Return: The investment must place in the top 50% of its peer group.10
5 Year Return: The investment must place in the top 50% of its peer group.11
The fi360 Fiduciary Score is a peer percentile ranking of an investment against a set of quantitative due diligence criteria selected to reflect
prudent fiduciary management. The criteria include total returns, risk-adjusted returns, expenses, and other portfolio statistics. Investments are
ranked according to their ability to meet due diligence criteria every month. The rank becomes the fi360 Fiduciary Score. The fi360 Fiduciary
Score Average is a one-, three-, five- or ten-year rolling average of an investments fi360 Fiduciary Score. The fi360 Fiduciary Score represents
a suggested course of action and is not intended, nor should it be used, as the sole source of information for reaching an investment decision.
Visit the Glossary or fi360.com/fi360-Fiduciary-Score for more information.
Calculation Methodology Legend
N/Av
N/App
X
√
N/S
Investment does not meet the criterion
Investment data is not available
Investment doesn't have the history to be scored
Investment is not screened on the criterion
Investment meets the criterion
fi360 Fiduciary Score Criteria
1
Average
fi360 Fiduciary Score
Investment Name 2 3 4 5 6 7 8 9 10 111 Yr 3 Yr 5 Yr 10 YrPeer Group Score
Large-Cap Equity
√√ √ √√ √ √ √ √ √Becker Value Equity Institutional (BVEIX)
1,210 952# of Peers 1,139 851
Large Value -1213140√
√√ √ √√ √ √ √ √ √DFA Tax-Managed US Marketwide Value II
(DFMVX) 1,210 952# of Peers 1,139 851 530
Large Value 179890√
√√ √ √√ √ √ √ √ √DFA US Large Cap Value II (DFCVX)
1,210 952# of Peers 1,139 851 530
Large Value 1711740√
√√ √ √√ √ √ √ √ √DFA US Large Company I (DFUSX)
1,369 1,128# of Peers 1,291 1,017 643
Large Blend 41000√
√√ √ √√ √ √ √ √ √Diamond Hill Large Cap Y (DHLYX)
1,210 952# of Peers 1,139 851
Large Value -2119110√
√√ √ √√ √ √ √ √ √Fidelity Contrafund (FCNTX)
1,463 1,162# of Peers 1,399 994 650
Large Growth 188950√
√√ √ √√ √ √ √ √ √Fidelity Growth Company K (FGCKX)
1,463 1,162# of Peers 1,399 994
Large Growth -5760√
Page 10 of 38
Fund data as of 3/31/2017
Analysis, search process, and layout are © 2000-2017, fi360, Inc. (www.fi360.com). All rights reserved. The analysis and opinions generated by fi360: (1) do not constitute professional investment advice; (2) are provided solely for informational purposes; (3) are not warranted or represented to be correct,
complete, or accurate; and (4) are for the exclusive use of subscribers to fi360. The data source is © 2017 Morningstar, Inc. All rights reserved. The data contained herein: (1) is proprietary to Morningstar, Inc and/or its content providers; (2) may not be copied or distributed; and (3) is not warranted to be
accurate, complete or timely. Neither Morningstar, Inc nor its content providers are responsible for any damages or losses arising from any use of this information. Past performance is no guarantee of future results.
fi360_Landscape_v8_1
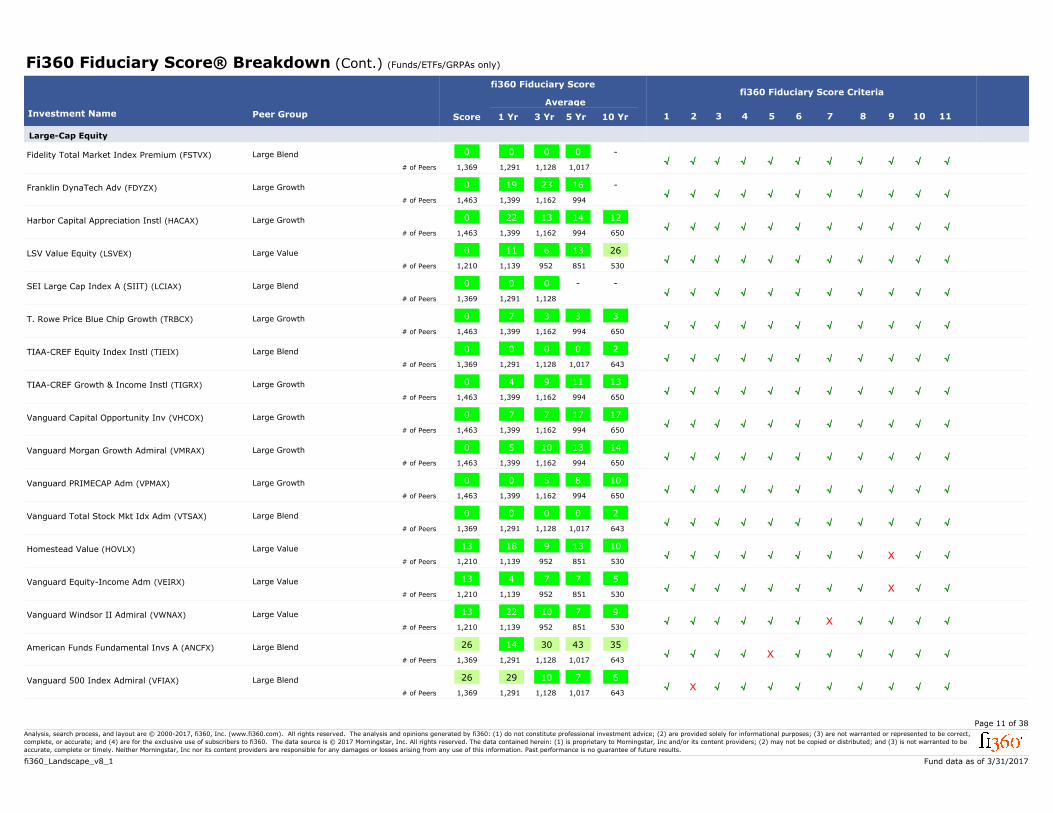
Fi360 Fiduciary Score® Breakdown (Cont.) (Funds/ETFs/GRPAs only)
fi360 Fiduciary Score Criteria
1
Average
fi360 Fiduciary Score
Investment Name 2 3 4 5 6 7 8 9 10 111 Yr 3 Yr 5 Yr 10 YrPeer Group Score
Large-Cap Equity
√√ √ √√ √ √ √ √ √Fidelity Total Market Index Premium (FSTVX)
1,369 1,128# of Peers 1,291 1,017
Large Blend -0000√
√√ √ √√ √ √ √ √ √Franklin DynaTech Adv (FDYZX)
1,463 1,162# of Peers 1,399 994
Large Growth -1623190√
√√ √ √√ √ √ √ √ √Harbor Capital Appreciation Instl (HACAX)
1,463 1,162# of Peers 1,399 994 650
Large Growth 121413220√
√√ √ √√ √ √ √ √ √LSV Value Equity (LSVEX)
1,210 952# of Peers 1,139 851 530
Large Value 26136110√
√√ √ √√ √ √ √ √ √SEI Large Cap Index A (SIIT) (LCIAX)
1,369 1,128# of Peers 1,291
Large Blend --000√
√√ √ √√ √ √ √ √ √T. Rowe Price Blue Chip Growth (TRBCX)
1,463 1,162# of Peers 1,399 994 650
Large Growth 33370√
√√ √ √√ √ √ √ √ √TIAA-CREF Equity Index Instl (TIEIX)
1,369 1,128# of Peers 1,291 1,017 643
Large Blend 20000√
√√ √ √√ √ √ √ √ √TIAA-CREF Growth & Income Instl (TIGRX)
1,463 1,162# of Peers 1,399 994 650
Large Growth 1311940√
√√ √ √√ √ √ √ √ √Vanguard Capital Opportunity Inv (VHCOX)
1,463 1,162# of Peers 1,399 994 650
Large Growth 1717770√
√√ √ √√ √ √ √ √ √Vanguard Morgan Growth Admiral (VMRAX)
1,463 1,162# of Peers 1,399 994 650
Large Growth 14131050√
√√ √ √√ √ √ √ √ √Vanguard PRIMECAP Adm (VPMAX)
1,463 1,162# of Peers 1,399 994 650
Large Growth 108500√
√√ √ √√ √ √ √ √ √Vanguard Total Stock Mkt Idx Adm (VTSAX)
1,369 1,128# of Peers 1,291 1,017 643
Large Blend 20000√
X√ √ √√ √ √ √ √ √Homestead Value (HOVLX)
1,210 952# of Peers 1,139 851 530
Large Value 101391813√
X√ √ √√ √ √ √ √ √Vanguard Equity-Income Adm (VEIRX)
1,210 952# of Peers 1,139 851 530
Large Value 577413√
√√ √ √√ √ X √ √ √Vanguard Windsor II Admiral (VWNAX)
1,210 952# of Peers 1,139 851 530
Large Value 97102213√
√√ √ X√ √ √ √ √ √American Funds Fundamental Invs A (ANCFX)
1,369 1,128# of Peers 1,291 1,017 643
Large Blend 3543301426√
√√ X √√ √ √ √ √ √Vanguard 500 Index Admiral (VFIAX)
1,369 1,128# of Peers 1,291 1,017 643
Large Blend 67102926√
Page 11 of 38
Fund data as of 3/31/2017
Analysis, search process, and layout are © 2000-2017, fi360, Inc. (www.fi360.com). All rights reserved. The analysis and opinions generated by fi360: (1) do not constitute professional investment advice; (2) are provided solely for informational purposes; (3) are not warranted or represented to be correct,
complete, or accurate; and (4) are for the exclusive use of subscribers to fi360. The data source is © 2017 Morningstar, Inc. All rights reserved. The data contained herein: (1) is proprietary to Morningstar, Inc and/or its content providers; (2) may not be copied or distributed; and (3) is not warranted to be
accurate, complete or timely. Neither Morningstar, Inc nor its content providers are responsible for any damages or losses arising from any use of this information. Past performance is no guarantee of future results.
fi360_Landscape_v8_1
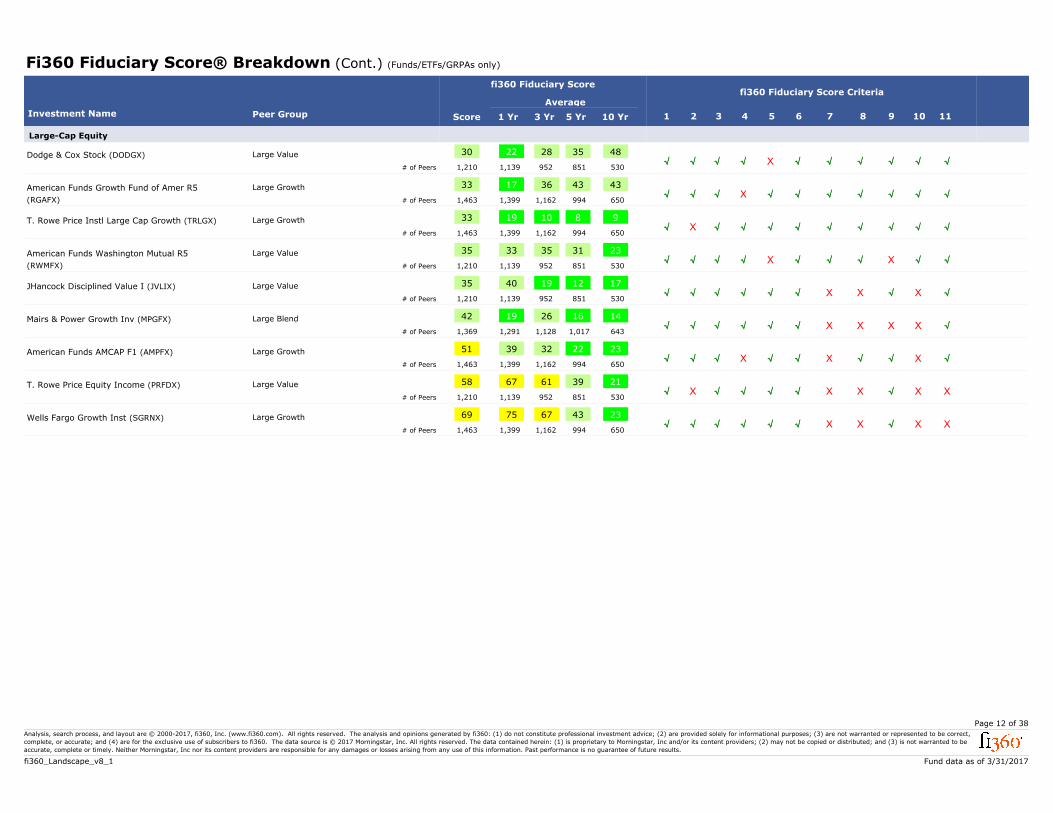
Fi360 Fiduciary Score® Breakdown (Cont.) (Funds/ETFs/GRPAs only)
fi360 Fiduciary Score Criteria
1
Average
fi360 Fiduciary Score
Investment Name 2 3 4 5 6 7 8 9 10 111 Yr 3 Yr 5 Yr 10 YrPeer Group Score
Large-Cap Equity
√√ √ X√ √ √ √ √ √Dodge & Cox Stock (DODGX)
1,210 952# of Peers 1,139 851 530
Large Value 4835282230√
√√ √ √X √ √ √ √ √American Funds Growth Fund of Amer R5
(RGAFX) 1,463 1,162# of Peers 1,399 994 650
Large Growth 4343361733√
√√ X √√ √ √ √ √ √T. Rowe Price Instl Large Cap Growth (TRLGX)
1,463 1,162# of Peers 1,399 994 650
Large Growth 98101933√
X√ √ X√ √ √ √ √ √American Funds Washington Mutual R5
(RWMFX) 1,210 952# of Peers 1,139 851 530
Large Value 2331353335√
√√ √ √√ √ X X X √JHancock Disciplined Value I (JVLIX)
1,210 952# of Peers 1,139 851 530
Large Value 1712194035√
X√ √ √√ √ X X X √Mairs & Power Growth Inv (MPGFX)
1,369 1,128# of Peers 1,291 1,017 643
Large Blend 1416261942√
√√ √ √X √ X √ X √American Funds AMCAP F1 (AMPFX)
1,463 1,162# of Peers 1,399 994 650
Large Growth 2322323951√
√√ X √√ √ X X X XT. Rowe Price Equity Income (PRFDX)
1,210 952# of Peers 1,139 851 530
Large Value 2139616758√
√√ √ √√ √ X X X XWells Fargo Growth Inst (SGRNX)
1,463 1,162# of Peers 1,399 994 650
Large Growth 2343677569√
Page 12 of 38
Fund data as of 3/31/2017
Analysis, search process, and layout are © 2000-2017, fi360, Inc. (www.fi360.com). All rights reserved. The analysis and opinions generated by fi360: (1) do not constitute professional investment advice; (2) are provided solely for informational purposes; (3) are not warranted or represented to be correct,
complete, or accurate; and (4) are for the exclusive use of subscribers to fi360. The data source is © 2017 Morningstar, Inc. All rights reserved. The data contained herein: (1) is proprietary to Morningstar, Inc and/or its content providers; (2) may not be copied or distributed; and (3) is not warranted to be
accurate, complete or timely. Neither Morningstar, Inc nor its content providers are responsible for any damages or losses arising from any use of this information. Past performance is no guarantee of future results.
fi360_Landscape_v8_1
Fi360 Fiduciary Score® Breakdown (Cont.) (Funds/ETFs/GRPAs only)
fi360 Fiduciary Score Criteria
1
Average
fi360 Fiduciary Score
Investment Name 2 3 4 5 6 7 8 9 10 111 Yr 3 Yr 5 Yr 10 YrPeer Group Score
Mid-Cap Equity
√√ √ √√ √ √ √ √ √Buffalo Discovery (BUFTX)
636 531# of Peers 590 468 299
Mid-Cap Growth 83130√
√√ √ √√ √ √ √ √ √iShares Core S&P Mid-Cap (IJH)
419 318# of Peers 384 285 162
Mid-Cap Blend 73300√
√√ √ √√ √ √ √ √ √iShares S&P Mid-Cap 400 Value (IJJ)
376 298# of Peers 356 258 155
Mid-Cap Value 12101400√
√√ √ √√ √ √ √ √ √JHancock Disciplined Value Mid Cap A (JVMAX)
419 318# of Peers 384 285 162
Mid-Cap Blend 232024190√
√√ √ √√ √ √ √ √ √Nuveen Mid Cap Index I (FIMEX)
419 318# of Peers 384 285 162
Mid-Cap Blend 46800√
√√ √ √√ √ √ √ √ √SPDR S&P MidCap 400 ETF (MDY)
419 318# of Peers 384 285 162
Mid-Cap Blend 35600√
√√ √ √√ √ √ √ √ √T. Rowe Price Instl Mid-Cap Equity Gr (PMEGX)
636 531# of Peers 590 468 299
Mid-Cap Growth 00000√
√√ √ √√ √ √ √ √ √T. Rowe Price Mid-Cap Value (TRMCX)
376 298# of Peers 356 258 155
Mid-Cap Value 15191800√
√√ √ √√ √ √ √ √ √T. Rowe Price Mid-Cap Value R (RRMVX)
376 298# of Peers 356 258 155
Mid-Cap Value 23312500√
X√ √ √√ √ √ √ √ √MassMutual Select Mid Cap Gr Eq II R5 (MGRFX)
636 531# of Peers 590 468 299
Mid-Cap Growth 112413√
X√ √ √√ √ √ √ √ √T. Rowe Price Mid-Cap Growth R (RRMGX)
636 531# of Peers 590 468 299
Mid-Cap Growth 222413√
√√ √ √√ √ X √ √ √Tributary Growth Opps Inst (FOGRX)
636 531# of Peers 590 468 299
Mid-Cap Growth 3228363513√
X√ √ √√ √ √ √ √ √Vanguard Mid Cap Index Admiral (VIMAX)
419 318# of Peers 384 285 162
Mid-Cap Blend 10881217√
√√ √ √√ √ √ √ X √Vanguard Selected Value Inv (VASVX)
376 298# of Peers 356 258 155
Mid-Cap Value 1919233519√
X√ √ √√ √ X X X √ClearBridge Mid Cap I (SMBYX)
419 318# of Peers 384 285 162
Mid-Cap Blend 2120213537√
√√ √ X√ √ X X √ √Fidelity Extended Market Index Premium
(FSEVX) 419 318# of Peers 384 285
Mid-Cap Blend -28365041√
√√ √ X√ √ X X X √Vanguard Extended Market Index Investor
(VEXMX) 419 318# of Peers 384 285 162
Mid-Cap Blend 2932405249√
Page 13 of 38
Fund data as of 3/31/2017
Analysis, search process, and layout are © 2000-2017, fi360, Inc. (www.fi360.com). All rights reserved. The analysis and opinions generated by fi360: (1) do not constitute professional investment advice; (2) are provided solely for informational purposes; (3) are not warranted or represented to be correct,
complete, or accurate; and (4) are for the exclusive use of subscribers to fi360. The data source is © 2017 Morningstar, Inc. All rights reserved. The data contained herein: (1) is proprietary to Morningstar, Inc and/or its content providers; (2) may not be copied or distributed; and (3) is not warranted to be
accurate, complete or timely. Neither Morningstar, Inc nor its content providers are responsible for any damages or losses arising from any use of this information. Past performance is no guarantee of future results.
fi360_Landscape_v8_1
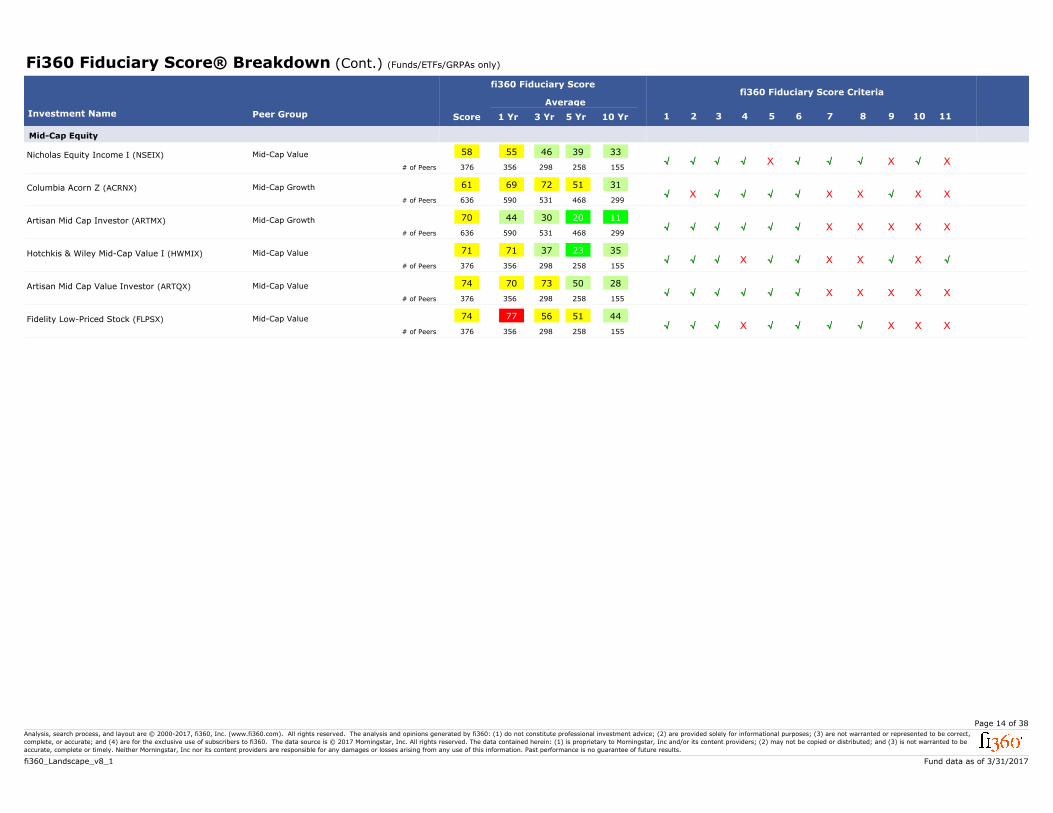
Fi360 Fiduciary Score® Breakdown (Cont.) (Funds/ETFs/GRPAs only)
fi360 Fiduciary Score Criteria
1
Average
fi360 Fiduciary Score
Investment Name 2 3 4 5 6 7 8 9 10 111 Yr 3 Yr 5 Yr 10 YrPeer Group Score
Mid-Cap Equity
X√ √ X√ √ √ √ √ XNicholas Equity Income I (NSEIX)
376 298# of Peers 356 258 155
Mid-Cap Value 3339465558√
√√ X √√ √ X X X XColumbia Acorn Z (ACRNX)
636 531# of Peers 590 468 299
Mid-Cap Growth 3151726961√
X√ √ √√ √ X X X XArtisan Mid Cap Investor (ARTMX)
636 531# of Peers 590 468 299
Mid-Cap Growth 1120304470√
√√ √ √X √ X X X √Hotchkis & Wiley Mid-Cap Value I (HWMIX)
376 298# of Peers 356 258 155
Mid-Cap Value 3523377171√
X√ √ √√ √ X X X XArtisan Mid Cap Value Investor (ARTQX)
376 298# of Peers 356 258 155
Mid-Cap Value 2850737074√
X√ √ √X √ √ √ X XFidelity Low-Priced Stock (FLPSX)
376 298# of Peers 356 258 155
Mid-Cap Value 4451567774√
Page 14 of 38
Fund data as of 3/31/2017
Analysis, search process, and layout are © 2000-2017, fi360, Inc. (www.fi360.com). All rights reserved. The analysis and opinions generated by fi360: (1) do not constitute professional investment advice; (2) are provided solely for informational purposes; (3) are not warranted or represented to be correct,
complete, or accurate; and (4) are for the exclusive use of subscribers to fi360. The data source is © 2017 Morningstar, Inc. All rights reserved. The data contained herein: (1) is proprietary to Morningstar, Inc and/or its content providers; (2) may not be copied or distributed; and (3) is not warranted to be
accurate, complete or timely. Neither Morningstar, Inc nor its content providers are responsible for any damages or losses arising from any use of this information. Past performance is no guarantee of future results.
fi360_Landscape_v8_1
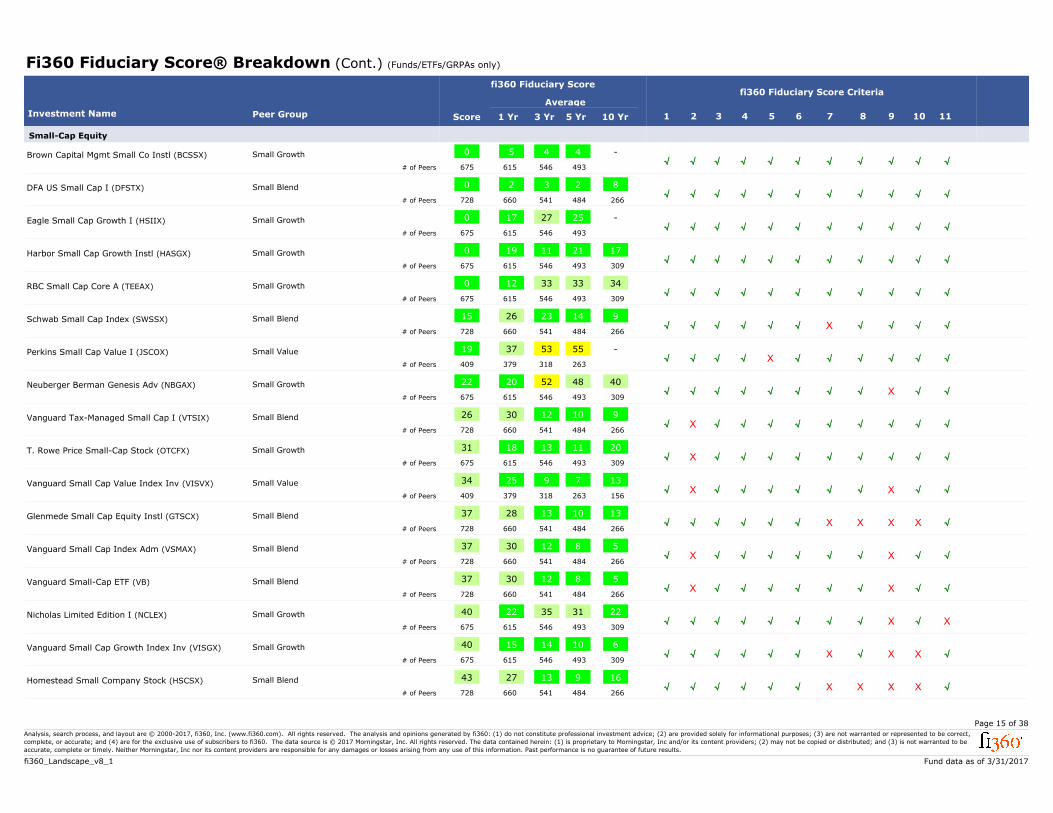
Fi360 Fiduciary Score® Breakdown (Cont.) (Funds/ETFs/GRPAs only)
fi360 Fiduciary Score Criteria
1
Average
fi360 Fiduciary Score
Investment Name 2 3 4 5 6 7 8 9 10 111 Yr 3 Yr 5 Yr 10 YrPeer Group Score
Small-Cap Equity
√√ √ √√ √ √ √ √ √Brown Capital Mgmt Small Co Instl (BCSSX)
675 546# of Peers 615 493
Small Growth -4450√
√√ √ √√ √ √ √ √ √DFA US Small Cap I (DFSTX)
728 541# of Peers 660 484 266
Small Blend 82320√
√√ √ √√ √ √ √ √ √Eagle Small Cap Growth I (HSIIX)
675 546# of Peers 615 493
Small Growth -2527170√
√√ √ √√ √ √ √ √ √Harbor Small Cap Growth Instl (HASGX)
675 546# of Peers 615 493 309
Small Growth 172111190√
√√ √ √√ √ √ √ √ √RBC Small Cap Core A (TEEAX)
675 546# of Peers 615 493 309
Small Growth 343333120√
√√ √ √√ √ X √ √ √Schwab Small Cap Index (SWSSX)
728 541# of Peers 660 484 266
Small Blend 914232615√
√√ √ X√ √ √ √ √ √Perkins Small Cap Value I (JSCOX)
409 318# of Peers 379 263
Small Value -55533719√
X√ √ √√ √ √ √ √ √Neuberger Berman Genesis Adv (NBGAX)
675 546# of Peers 615 493 309
Small Growth 4048522022√
√√ X √√ √ √ √ √ √Vanguard Tax-Managed Small Cap I (VTSIX)
728 541# of Peers 660 484 266
Small Blend 910123026√
√√ X √√ √ √ √ √ √T. Rowe Price Small-Cap Stock (OTCFX)
675 546# of Peers 615 493 309
Small Growth 2011131831√
X√ X √√ √ √ √ √ √Vanguard Small Cap Value Index Inv (VISVX)
409 318# of Peers 379 263 156
Small Value 13792534√
X√ √ √√ √ X X X √Glenmede Small Cap Equity Instl (GTSCX)
728 541# of Peers 660 484 266
Small Blend 1310132837√
X√ X √√ √ √ √ √ √Vanguard Small Cap Index Adm (VSMAX)
728 541# of Peers 660 484 266
Small Blend 58123037√
X√ X √√ √ √ √ √ √Vanguard Small-Cap ETF (VB)
728 541# of Peers 660 484 266
Small Blend 58123037√
X√ √ √√ √ √ √ √ XNicholas Limited Edition I (NCLEX)
675 546# of Peers 615 493 309
Small Growth 2231352240√
X√ √ √√ √ X √ X √Vanguard Small Cap Growth Index Inv (VISGX)
675 546# of Peers 615 493 309
Small Growth 610141540√
X√ √ √√ √ X X X √Homestead Small Company Stock (HSCSX)
728 541# of Peers 660 484 266
Small Blend 169132743√
Page 15 of 38
Fund data as of 3/31/2017
Analysis, search process, and layout are © 2000-2017, fi360, Inc. (www.fi360.com). All rights reserved. The analysis and opinions generated by fi360: (1) do not constitute professional investment advice; (2) are provided solely for informational purposes; (3) are not warranted or represented to be correct,
complete, or accurate; and (4) are for the exclusive use of subscribers to fi360. The data source is © 2017 Morningstar, Inc. All rights reserved. The data contained herein: (1) is proprietary to Morningstar, Inc and/or its content providers; (2) may not be copied or distributed; and (3) is not warranted to be
accurate, complete or timely. Neither Morningstar, Inc nor its content providers are responsible for any damages or losses arising from any use of this information. Past performance is no guarantee of future results.
fi360_Landscape_v8_1

Fi360 Fiduciary Score® Breakdown (Cont.) (Funds/ETFs/GRPAs only)
fi360 Fiduciary Score Criteria
1
Average
fi360 Fiduciary Score
Investment Name 2 3 4 5 6 7 8 9 10 111 Yr 3 Yr 5 Yr 10 YrPeer Group Score
Small-Cap Equity
√√ √ √√ √ X X X XBuffalo Small Cap (BUFSX)
675 546# of Peers 615 493 309
Small Growth 4258727863√
X√ √ √√ √ X X X XAmerican Beacon Stephens Sm Cp Gr Y
(SPWYX) 675 546# of Peers 615 493
Small Growth -37586771√
√√ √ √√ X X X X XRoyce Premier R (RPRRX)
675 546# of Peers 615 493
Small Growth -86918077√
Page 16 of 38
Fund data as of 3/31/2017
Analysis, search process, and layout are © 2000-2017, fi360, Inc. (www.fi360.com). All rights reserved. The analysis and opinions generated by fi360: (1) do not constitute professional investment advice; (2) are provided solely for informational purposes; (3) are not warranted or represented to be correct,
complete, or accurate; and (4) are for the exclusive use of subscribers to fi360. The data source is © 2017 Morningstar, Inc. All rights reserved. The data contained herein: (1) is proprietary to Morningstar, Inc and/or its content providers; (2) may not be copied or distributed; and (3) is not warranted to be
accurate, complete or timely. Neither Morningstar, Inc nor its content providers are responsible for any damages or losses arising from any use of this information. Past performance is no guarantee of future results.
fi360_Landscape_v8_1
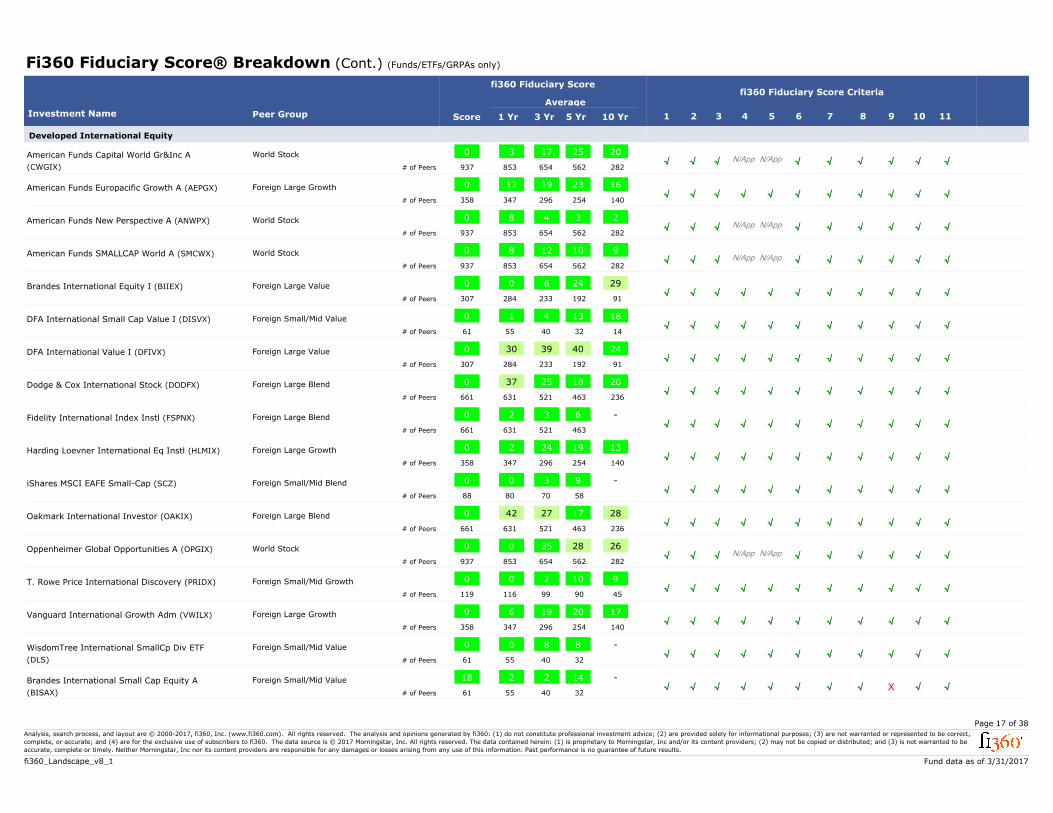
Fi360 Fiduciary Score® Breakdown (Cont.) (Funds/ETFs/GRPAs only)
fi360 Fiduciary Score Criteria
1
Average
fi360 Fiduciary Score
Investment Name 2 3 4 5 6 7 8 9 10 111 Yr 3 Yr 5 Yr 10 YrPeer Group Score
Developed International Equity
√√ √ N/AppN/App √ √ √ √ √American Funds Capital World Gr&Inc A
(CWGIX) 937 654# of Peers 853 562 282
World Stock 20251730√
√√ √ √√ √ √ √ √ √American Funds Europacific Growth A (AEPGX)
358 296# of Peers 347 254 140
Foreign Large Growth 162319120√
√√ √ N/AppN/App √ √ √ √ √American Funds New Perspective A (ANWPX)
937 654# of Peers 853 562 282
World Stock 23480√
√√ √ N/AppN/App √ √ √ √ √American Funds SMALLCAP World A (SMCWX)
937 654# of Peers 853 562 282
World Stock 9101280√
√√ √ √√ √ √ √ √ √Brandes International Equity I (BIIEX)
307 233# of Peers 284 192 91
Foreign Large Value 2924600√
√√ √ √√ √ √ √ √ √DFA International Small Cap Value I (DISVX)
61 40# of Peers 55 32 14
Foreign Small/Mid Value 1813410√
√√ √ √√ √ √ √ √ √DFA International Value I (DFIVX)
307 233# of Peers 284 192 91
Foreign Large Value 244039300√
√√ √ √√ √ √ √ √ √Dodge & Cox International Stock (DODFX)
661 521# of Peers 631 463 236
Foreign Large Blend 201825370√
√√ √ √√ √ √ √ √ √Fidelity International Index Instl (FSPNX)
661 521# of Peers 631 463
Foreign Large Blend -6320√
√√ √ √√ √ √ √ √ √Harding Loevner International Eq Instl (HLMIX)
358 296# of Peers 347 254 140
Foreign Large Growth 13192420√
√√ √ √√ √ √ √ √ √iShares MSCI EAFE Small-Cap (SCZ)
88 70# of Peers 80 58
Foreign Small/Mid Blend -9300√
√√ √ √√ √ √ √ √ √Oakmark International Investor (OAKIX)
661 521# of Peers 631 463 236
Foreign Large Blend 281727420√
√√ √ N/AppN/App √ √ √ √ √Oppenheimer Global Opportunities A (OPGIX)
937 654# of Peers 853 562 282
World Stock 26282500√
√√ √ √√ √ √ √ √ √T. Rowe Price International Discovery (PRIDX)
119 99# of Peers 116 90 45
Foreign Small/Mid Growth 910200√
√√ √ √√ √ √ √ √ √Vanguard International Growth Adm (VWILX)
358 296# of Peers 347 254 140
Foreign Large Growth 17201960√
√√ √ √√ √ √ √ √ √WisdomTree International SmallCp Div ETF
(DLS) 61 40# of Peers 55 32
Foreign Small/Mid Value -8800√
X√ √ √√ √ √ √ √ √Brandes International Small Cap Equity A
(BISAX) 61 40# of Peers 55 32
Foreign Small/Mid Value -142218√
Page 17 of 38
Fund data as of 3/31/2017
Analysis, search process, and layout are © 2000-2017, fi360, Inc. (www.fi360.com). All rights reserved. The analysis and opinions generated by fi360: (1) do not constitute professional investment advice; (2) are provided solely for informational purposes; (3) are not warranted or represented to be correct,
complete, or accurate; and (4) are for the exclusive use of subscribers to fi360. The data source is © 2017 Morningstar, Inc. All rights reserved. The data contained herein: (1) is proprietary to Morningstar, Inc and/or its content providers; (2) may not be copied or distributed; and (3) is not warranted to be
accurate, complete or timely. Neither Morningstar, Inc nor its content providers are responsible for any damages or losses arising from any use of this information. Past performance is no guarantee of future results.
fi360_Landscape_v8_1
Fi360 Fiduciary Score® Breakdown (Cont.) (Funds/ETFs/GRPAs only)
fi360 Fiduciary Score Criteria
1
Average
fi360 Fiduciary Score
Investment Name 2 3 4 5 6 7 8 9 10 111 Yr 3 Yr 5 Yr 10 YrPeer Group Score
Developed International Equity
√√ √ √√ √ √ √ √ XScout International (UMBWX)
661 521# of Peers 631 463 236
Foreign Large Blend 3652634118√
√√ √ √√ √ √ √ √ XVanguard Total Intl Stock Index Admiral
(VTIAX) 661 521# of Peers 631 463
Foreign Large Blend -41442318√
X√ √ N/AppN/App √ √ √ √ √MFS Global Equity A (MWEFX)
937 654# of Peers 853 562 282
World Stock 634319√
√√ √ X√ √ √ √ √ √Vanguard International Explorer Inv (VINEX)
88 70# of Peers 80 58 25
Foreign Small/Mid Blend 4346323420√
√√ √ X√ √ √ √ √ √Vanguard International Value Inv (VTRIX)
307 233# of Peers 284 192 91
Foreign Large Value 2133352027√
√√ X √√ √ √ √ √ XVanguard FTSE All-Wld ex-US Idx Admiral
(VFWAX) 661 521# of Peers 631 463
Foreign Large Blend -46554834√
X√ √ √√ √ X X X √Oppenheimer International Growth Y (OIGYX)
358 296# of Peers 347 254
Foreign Large Growth -7121843√
√√ √ X√ √ √ √ √ XThornburg International Value I (TGVIX)
358 296# of Peers 347 254 140
Foreign Large Growth 4462666648√
X√ √ X√ √ √ √ √ XTempleton Ins Foreign Smaller Co Ser Adv
(TFSCX) 61 40# of Peers 55 32 14
Foreign Small/Mid Value 1935475750√
X√ √ X√ √ X X X √Franklin Intl Small Cap Growth R6 (FCAPX)
88 70# of Peers 80
Foreign Small/Mid Blend --214957√
X√ X X√ √ X X X √GMO International Small Companies III
(GMISX) 61 40# of Peers 55 32 14
Foreign Small/Mid Value 2122305980√
√√ √ √√ X X X X XInvesco International Small Company A
(IEGAX) 88 70# of Peers 80 58 25
Foreign Small/Mid Blend 3352737582√
Page 18 of 38
Fund data as of 3/31/2017
Analysis, search process, and layout are © 2000-2017, fi360, Inc. (www.fi360.com). All rights reserved. The analysis and opinions generated by fi360: (1) do not constitute professional investment advice; (2) are provided solely for informational purposes; (3) are not warranted or represented to be correct,
complete, or accurate; and (4) are for the exclusive use of subscribers to fi360. The data source is © 2017 Morningstar, Inc. All rights reserved. The data contained herein: (1) is proprietary to Morningstar, Inc and/or its content providers; (2) may not be copied or distributed; and (3) is not warranted to be
accurate, complete or timely. Neither Morningstar, Inc nor its content providers are responsible for any damages or losses arising from any use of this information. Past performance is no guarantee of future results.
fi360_Landscape_v8_1
Fi360 Fiduciary Score® Breakdown (Cont.) (Funds/ETFs/GRPAs only)
fi360 Fiduciary Score Criteria
1
Average
fi360 Fiduciary Score
Investment Name 2 3 4 5 6 7 8 9 10 111 Yr 3 Yr 5 Yr 10 YrPeer Group Score
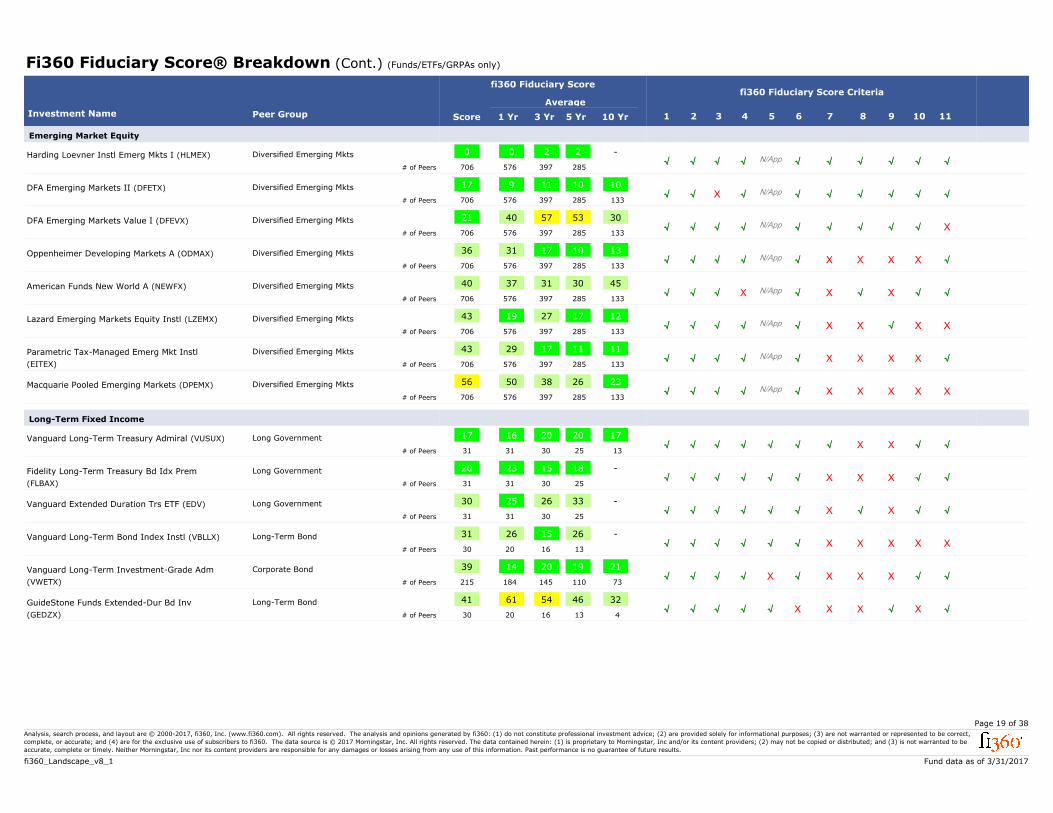
Emerging Market Equity
√√ √ N/App√ √ √ √ √ √Harding Loevner Instl Emerg Mkts I (HLMEX)
706 397# of Peers 576 285
Diversified Emerging Mkts -2200√
√√ √ N/App√ √ √ √ √ √DFA Emerging Markets II (DFETX)
706 397# of Peers 576 285 133
Diversified Emerging Mkts 101011917X
√√ √ N/App√ √ √ √ √ XDFA Emerging Markets Value I (DFEVX)
706 397# of Peers 576 285 133
Diversified Emerging Mkts 3053574021√
X√ √ N/App√ √ X X X √Oppenheimer Developing Markets A (ODMAX)
706 397# of Peers 576 285 133
Diversified Emerging Mkts 1310173136√
X√ √ N/AppX √ X √ √ √American Funds New World A (NEWFX)
706 397# of Peers 576 285 133
Diversified Emerging Mkts 4530313740√
√√ √ N/App√ √ X X X XLazard Emerging Markets Equity Instl (LZEMX)
706 397# of Peers 576 285 133
Diversified Emerging Mkts 1217271943√
X√ √ N/App√ √ X X X √Parametric Tax-Managed Emerg Mkt Instl
(EITEX) 706 397# of Peers 576 285 133
Diversified Emerging Mkts 1111172943√
X√ √ N/App√ √ X X X XMacquarie Pooled Emerging Markets (DPEMX)
706 397# of Peers 576 285 133
Diversified Emerging Mkts 2326385056√
Long-Term Fixed Income
X√ √ √√ √ √ X √ √Vanguard Long-Term Treasury Admiral (VUSUX)
31 30# of Peers 31 25 13
Long Government 1720201617√
X√ √ √√ √ X X √ √Fidelity Long-Term Treasury Bd Idx Prem
(FLBAX) 31 30# of Peers 31 25
Long Government -18152320√
X√ √ √√ √ X √ √ √Vanguard Extended Duration Trs ETF (EDV)
31 30# of Peers 31 25
Long Government -33262530√
X√ √ √√ √ X X X XVanguard Long-Term Bond Index Instl (VBLLX)
30 16# of Peers 20 13
Long-Term Bond -26152631√
X√ √ X√ √ X X √ √Vanguard Long-Term Investment-Grade Adm
(VWETX) 215 145# of Peers 184 110 73
Corporate Bond 2119201439√
√√ √ √√ X X X X √GuideStone Funds Extended-Dur Bd Inv
(GEDZX) 30 16# of Peers 20 13 4
Long-Term Bond 3246546141√
Page 19 of 38
Fund data as of 3/31/2017
Analysis, search process, and layout are © 2000-2017, fi360, Inc. (www.fi360.com). All rights reserved. The analysis and opinions generated by fi360: (1) do not constitute professional investment advice; (2) are provided solely for informational purposes; (3) are not warranted or represented to be correct,
complete, or accurate; and (4) are for the exclusive use of subscribers to fi360. The data source is © 2017 Morningstar, Inc. All rights reserved. The data contained herein: (1) is proprietary to Morningstar, Inc and/or its content providers; (2) may not be copied or distributed; and (3) is not warranted to be
accurate, complete or timely. Neither Morningstar, Inc nor its content providers are responsible for any damages or losses arising from any use of this information. Past performance is no guarantee of future results.
fi360_Landscape_v8_1
Fi360 Fiduciary Score® Breakdown (Cont.) (Funds/ETFs/GRPAs only)
fi360 Fiduciary Score Criteria
1
Average
fi360 Fiduciary Score
Investment Name 2 3 4 5 6 7 8 9 10 111 Yr 3 Yr 5 Yr 10 YrPeer Group Score
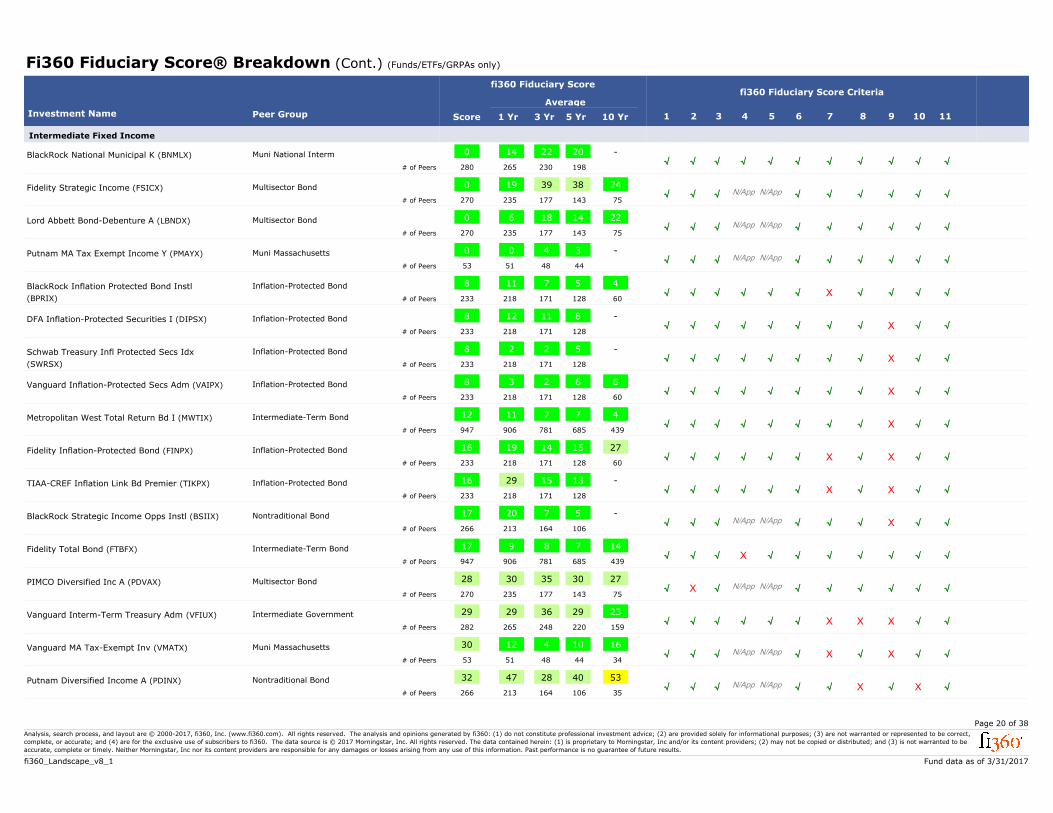
Intermediate Fixed Income
√√ √ √√ √ √ √ √ √BlackRock National Municipal K (BNMLX)
280 230# of Peers 265 198
Muni National Interm -2022140√
√√ √ N/AppN/App √ √ √ √ √Fidelity Strategic Income (FSICX)
270 177# of Peers 235 143 75
Multisector Bond 243839190√
√√ √ N/AppN/App √ √ √ √ √Lord Abbett Bond-Debenture A (LBNDX)
270 177# of Peers 235 143 75
Multisector Bond 22141860√
√√ √ N/AppN/App √ √ √ √ √Putnam MA Tax Exempt Income Y (PMAYX)
53 48# of Peers 51 44
Muni Massachusetts -3400√
√√ √ √√ √ X √ √ √BlackRock Inflation Protected Bond Instl
(BPRIX) 233 171# of Peers 218 128 60
Inflation-Protected Bond 457118√
X√ √ √√ √ √ √ √ √DFA Inflation-Protected Securities I (DIPSX)
233 171# of Peers 218 128
Inflation-Protected Bond -811128√
X√ √ √√ √ √ √ √ √Schwab Treasury Infl Protected Secs Idx
(SWRSX) 233 171# of Peers 218 128
Inflation-Protected Bond -5228√
X√ √ √√ √ √ √ √ √Vanguard Inflation-Protected Secs Adm (VAIPX)
233 171# of Peers 218 128 60
Inflation-Protected Bond 66238√
X√ √ √√ √ √ √ √ √Metropolitan West Total Return Bd I (MWTIX)
947 781# of Peers 906 685 439
Intermediate-Term Bond 4771112√
X√ √ √√ √ X √ √ √Fidelity Inflation-Protected Bond (FINPX)
233 171# of Peers 218 128 60
Inflation-Protected Bond 2715141916√
X√ √ √√ √ X √ √ √TIAA-CREF Inflation Link Bd Premier (TIKPX)
233 171# of Peers 218 128
Inflation-Protected Bond -13152916√
X√ √ N/AppN/App √ √ √ √ √BlackRock Strategic Income Opps Instl (BSIIX)
266 164# of Peers 213 106
Nontraditional Bond -572017√
√√ √ √X √ √ √ √ √Fidelity Total Bond (FTBFX)
947 781# of Peers 906 685 439
Intermediate-Term Bond 1478917√
√√ X N/AppN/App √ √ √ √ √PIMCO Diversified Inc A (PDVAX)
270 177# of Peers 235 143 75
Multisector Bond 2730353028√
X√ √ √√ √ X X √ √Vanguard Interm-Term Treasury Adm (VFIUX)
282 248# of Peers 265 220 159
Intermediate Government 2329362929√
X√ √ N/AppN/App √ X √ √ √Vanguard MA Tax-Exempt Inv (VMATX)
53 48# of Peers 51 44 34
Muni Massachusetts 161041230√
√√ √ N/AppN/App √ √ X X √Putnam Diversified Income A (PDINX)
266 164# of Peers 213 106 35
Nontraditional Bond 5340284732√
Page 20 of 38
Fund data as of 3/31/2017
Analysis, search process, and layout are © 2000-2017, fi360, Inc. (www.fi360.com). All rights reserved. The analysis and opinions generated by fi360: (1) do not constitute professional investment advice; (2) are provided solely for informational purposes; (3) are not warranted or represented to be correct,
complete, or accurate; and (4) are for the exclusive use of subscribers to fi360. The data source is © 2017 Morningstar, Inc. All rights reserved. The data contained herein: (1) is proprietary to Morningstar, Inc and/or its content providers; (2) may not be copied or distributed; and (3) is not warranted to be
accurate, complete or timely. Neither Morningstar, Inc nor its content providers are responsible for any damages or losses arising from any use of this information. Past performance is no guarantee of future results.
fi360_Landscape_v8_1
Fi360 Fiduciary Score® Breakdown (Cont.) (Funds/ETFs/GRPAs only)
fi360 Fiduciary Score Criteria
1
Average
fi360 Fiduciary Score
Investment Name 2 3 4 5 6 7 8 9 10 111 Yr 3 Yr 5 Yr 10 YrPeer Group Score
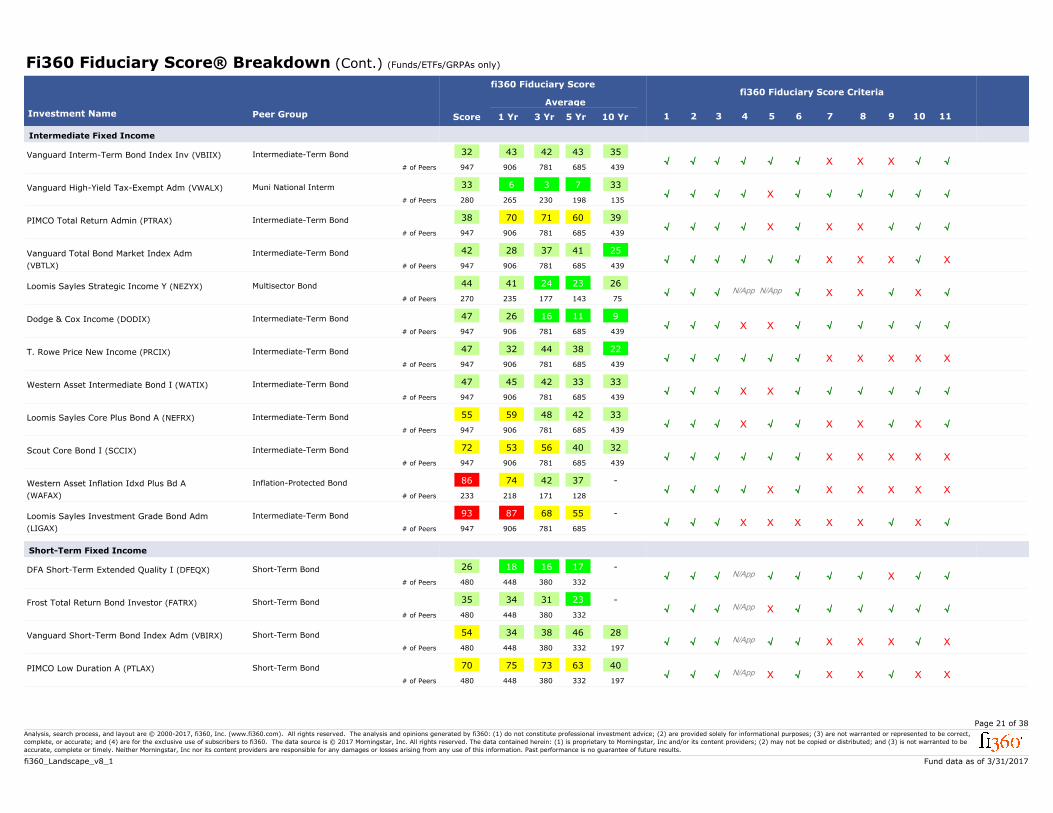
Intermediate Fixed Income
X√ √ √√ √ X X √ √Vanguard Interm-Term Bond Index Inv (VBIIX)
947 781# of Peers 906 685 439
Intermediate-Term Bond 3543424332√
√√ √ X√ √ √ √ √ √Vanguard High-Yield Tax-Exempt Adm (VWALX)
280 230# of Peers 265 198 135
Muni National Interm 3373633√
√√ √ X√ √ X X √ √PIMCO Total Return Admin (PTRAX)
947 781# of Peers 906 685 439
Intermediate-Term Bond 3960717038√
X√ √ √√ √ X X √ XVanguard Total Bond Market Index Adm
(VBTLX) 947 781# of Peers 906 685 439
Intermediate-Term Bond 2541372842√
√√ √ N/AppN/App √ X X X √Loomis Sayles Strategic Income Y (NEZYX)
270 177# of Peers 235 143 75
Multisector Bond 2623244144√
√√ √ XX √ √ √ √ √Dodge & Cox Income (DODIX)
947 781# of Peers 906 685 439
Intermediate-Term Bond 911162647√
X√ √ √√ √ X X X XT. Rowe Price New Income (PRCIX)
947 781# of Peers 906 685 439
Intermediate-Term Bond 2238443247√
√√ √ XX √ √ √ √ √Western Asset Intermediate Bond I (WATIX)
947 781# of Peers 906 685 439
Intermediate-Term Bond 3333424547√
√√ √ √X √ X X X √Loomis Sayles Core Plus Bond A (NEFRX)
947 781# of Peers 906 685 439
Intermediate-Term Bond 3342485955√
X√ √ √√ √ X X X XScout Core Bond I (SCCIX)
947 781# of Peers 906 685 439
Intermediate-Term Bond 3240565372√
X√ √ X√ √ X X X XWestern Asset Inflation Idxd Plus Bd A
(WAFAX) 233 171# of Peers 218 128
Inflation-Protected Bond -37427486√
√√ √ XX X X X X √Loomis Sayles Investment Grade Bond Adm
(LIGAX) 947 781# of Peers 906 685
Intermediate-Term Bond -55688793√
Short-Term Fixed Income
X√ √ √N/App √ √ √ √ √DFA Short-Term Extended Quality I (DFEQX)
480 380# of Peers 448 332
Short-Term Bond -17161826√
√√ √ XN/App √ √ √ √ √Frost Total Return Bond Investor (FATRX)
480 380# of Peers 448 332
Short-Term Bond -23313435√
X√ √ √N/App √ X X √ XVanguard Short-Term Bond Index Adm (VBIRX)
480 380# of Peers 448 332 197
Short-Term Bond 2846383454√
√√ √ XN/App √ X X X XPIMCO Low Duration A (PTLAX)
480 380# of Peers 448 332 197
Short-Term Bond 4063737570√
Page 21 of 38
Fund data as of 3/31/2017
Analysis, search process, and layout are © 2000-2017, fi360, Inc. (www.fi360.com). All rights reserved. The analysis and opinions generated by fi360: (1) do not constitute professional investment advice; (2) are provided solely for informational purposes; (3) are not warranted or represented to be correct,
complete, or accurate; and (4) are for the exclusive use of subscribers to fi360. The data source is © 2017 Morningstar, Inc. All rights reserved. The data contained herein: (1) is proprietary to Morningstar, Inc and/or its content providers; (2) may not be copied or distributed; and (3) is not warranted to be
accurate, complete or timely. Neither Morningstar, Inc nor its content providers are responsible for any damages or losses arising from any use of this information. Past performance is no guarantee of future results.
fi360_Landscape_v8_1
Fi360 Fiduciary Score® Breakdown (Cont.) (Funds/ETFs/GRPAs only)
fi360 Fiduciary Score Criteria
1
Average
fi360 Fiduciary Score
Investment Name 2 3 4 5 6 7 8 9 10 111 Yr 3 Yr 5 Yr 10 YrPeer Group Score
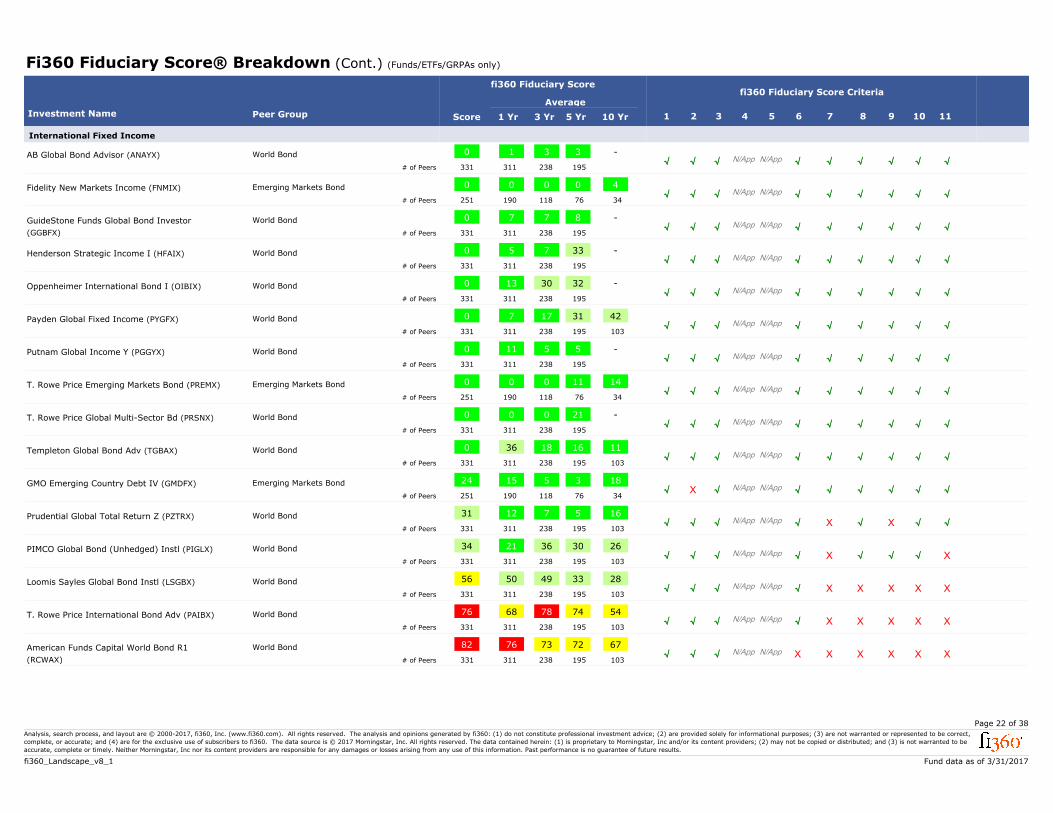
International Fixed Income
√√ √ N/AppN/App √ √ √ √ √AB Global Bond Advisor (ANAYX)
331 238# of Peers 311 195
World Bond -3310√
√√ √ N/AppN/App √ √ √ √ √Fidelity New Markets Income (FNMIX)
251 118# of Peers 190 76 34
Emerging Markets Bond 40000√
√√ √ N/AppN/App √ √ √ √ √GuideStone Funds Global Bond Investor
(GGBFX) 331 238# of Peers 311 195
World Bond -8770√
√√ √ N/AppN/App √ √ √ √ √Henderson Strategic Income I (HFAIX)
331 238# of Peers 311 195
World Bond -33750√
√√ √ N/AppN/App √ √ √ √ √Oppenheimer International Bond I (OIBIX)
331 238# of Peers 311 195
World Bond -3230130√
√√ √ N/AppN/App √ √ √ √ √Payden Global Fixed Income (PYGFX)
331 238# of Peers 311 195 103
World Bond 42311770√
√√ √ N/AppN/App √ √ √ √ √Putnam Global Income Y (PGGYX)
331 238# of Peers 311 195
World Bond -55110√
√√ √ N/AppN/App √ √ √ √ √T. Rowe Price Emerging Markets Bond (PREMX)
251 118# of Peers 190 76 34
Emerging Markets Bond 1411000√
√√ √ N/AppN/App √ √ √ √ √T. Rowe Price Global Multi-Sector Bd (PRSNX)
331 238# of Peers 311 195
World Bond -21000√
√√ √ N/AppN/App √ √ √ √ √Templeton Global Bond Adv (TGBAX)
331 238# of Peers 311 195 103
World Bond 111618360√
√√ X N/AppN/App √ √ √ √ √GMO Emerging Country Debt IV (GMDFX)
251 118# of Peers 190 76 34
Emerging Markets Bond 18351524√
X√ √ N/AppN/App √ X √ √ √Prudential Global Total Return Z (PZTRX)
331 238# of Peers 311 195 103
World Bond 16571231√
√√ √ N/AppN/App √ X √ √ XPIMCO Global Bond (Unhedged) Instl (PIGLX)
331 238# of Peers 311 195 103
World Bond 2630362134√
X√ √ N/AppN/App √ X X X XLoomis Sayles Global Bond Instl (LSGBX)
331 238# of Peers 311 195 103
World Bond 2833495056√
X√ √ N/AppN/App √ X X X XT. Rowe Price International Bond Adv (PAIBX)
331 238# of Peers 311 195 103
World Bond 5474786876√
X√ √ N/AppN/App X X X X XAmerican Funds Capital World Bond R1
(RCWAX) 331 238# of Peers 311 195 103
World Bond 6772737682√
Page 22 of 38
Fund data as of 3/31/2017
Analysis, search process, and layout are © 2000-2017, fi360, Inc. (www.fi360.com). All rights reserved. The analysis and opinions generated by fi360: (1) do not constitute professional investment advice; (2) are provided solely for informational purposes; (3) are not warranted or represented to be correct,
complete, or accurate; and (4) are for the exclusive use of subscribers to fi360. The data source is © 2017 Morningstar, Inc. All rights reserved. The data contained herein: (1) is proprietary to Morningstar, Inc and/or its content providers; (2) may not be copied or distributed; and (3) is not warranted to be
accurate, complete or timely. Neither Morningstar, Inc nor its content providers are responsible for any damages or losses arising from any use of this information. Past performance is no guarantee of future results.
fi360_Landscape_v8_1
Fi360 Fiduciary Score® Breakdown (Cont.) (Funds/ETFs/GRPAs only)
fi360 Fiduciary Score Criteria
1
Average
fi360 Fiduciary Score
Investment Name 2 3 4 5 6 7 8 9 10 111 Yr 3 Yr 5 Yr 10 YrPeer Group Score
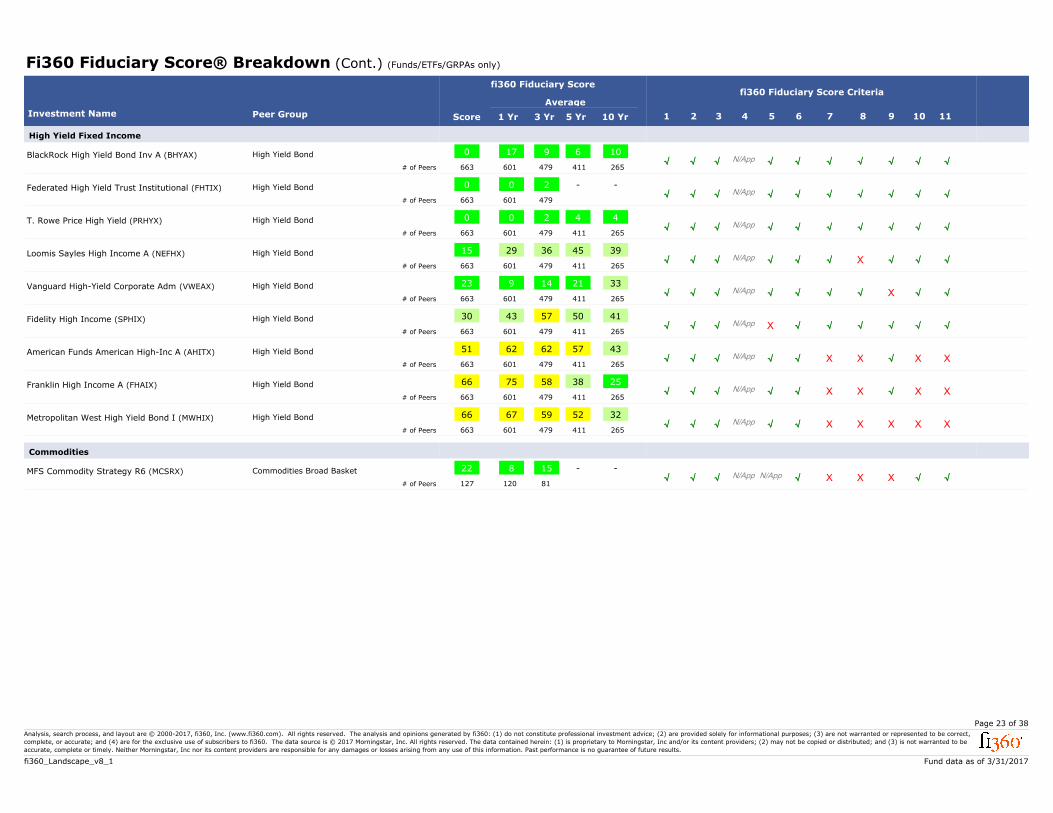
High Yield Fixed Income
√√ √ √N/App √ √ √ √ √BlackRock High Yield Bond Inv A (BHYAX)
663 479# of Peers 601 411 265
High Yield Bond 1069170√
√√ √ √N/App √ √ √ √ √Federated High Yield Trust Institutional (FHTIX)
663 479# of Peers 601
High Yield Bond --200√
√√ √ √N/App √ √ √ √ √T. Rowe Price High Yield (PRHYX)
663 479# of Peers 601 411 265
High Yield Bond 44200√
√√ √ √N/App √ √ X √ √Loomis Sayles High Income A (NEFHX)
663 479# of Peers 601 411 265
High Yield Bond 3945362915√
X√ √ √N/App √ √ √ √ √Vanguard High-Yield Corporate Adm (VWEAX)
663 479# of Peers 601 411 265
High Yield Bond 332114923√
√√ √ XN/App √ √ √ √ √Fidelity High Income (SPHIX)
663 479# of Peers 601 411 265
High Yield Bond 4150574330√
√√ √ √N/App √ X X X XAmerican Funds American High-Inc A (AHITX)
663 479# of Peers 601 411 265
High Yield Bond 4357626251√
√√ √ √N/App √ X X X XFranklin High Income A (FHAIX)
663 479# of Peers 601 411 265
High Yield Bond 2538587566√
X√ √ √N/App √ X X X XMetropolitan West High Yield Bond I (MWHIX)
663 479# of Peers 601 411 265
High Yield Bond 3252596766√
Commodities
X√ √ N/AppN/App √ X X √ √MFS Commodity Strategy R6 (MCSRX)
127 81# of Peers 120
Commodities Broad Basket --15822√
Page 23 of 38
Fund data as of 3/31/2017
Analysis, search process, and layout are © 2000-2017, fi360, Inc. (www.fi360.com). All rights reserved. The analysis and opinions generated by fi360: (1) do not constitute professional investment advice; (2) are provided solely for informational purposes; (3) are not warranted or represented to be correct,
complete, or accurate; and (4) are for the exclusive use of subscribers to fi360. The data source is © 2017 Morningstar, Inc. All rights reserved. The data contained herein: (1) is proprietary to Morningstar, Inc and/or its content providers; (2) may not be copied or distributed; and (3) is not warranted to be
accurate, complete or timely. Neither Morningstar, Inc nor its content providers are responsible for any damages or losses arising from any use of this information. Past performance is no guarantee of future results.
fi360_Landscape_v8_1
Fi360 Fiduciary Score® Breakdown (Cont.) (Funds/ETFs/GRPAs only)
fi360 Fiduciary Score Criteria
1
Average
fi360 Fiduciary Score
Investment Name 2 3 4 5 6 7 8 9 10 111 Yr 3 Yr 5 Yr 10 YrPeer Group Score
Allocation
√√ √ N/AppN/App √ √ √ √ √Dodge & Cox Balanced (DODBX)
798 616# of Peers 767 537 314
Allocation--50% to 70% Equity 3815970√
√√ √ N/AppN/App √ √ √ √ √Fidelity Balanced (FBALX)
798 616# of Peers 767 537 314
Allocation--50% to 70% Equity 71000√
√√ √ N/AppN/App √ √ √ √ √Fidelity Puritan (FPURX)
798 616# of Peers 767 537 314
Allocation--50% to 70% Equity 43370√
√√ √ N/AppN/App √ √ √ √ √First Eagle Global I (SGIIX)
441 303# of Peers 408 239 124
World Allocation 81100√
√√ √ N/AppN/App √ √ √ √ √Loomis Sayles Global Equity and Income Y
(LSWWX) 441 303# of Peers 408 239 124
World Allocation 84520√
√√ √ N/AppN/App √ √ √ √ √Mairs & Power Balanced Inv (MAPOX)
798 616# of Peers 767 537 314
Allocation--50% to 70% Equity 75700√
√√ √ N/AppN/App √ √ √ √ √Oppenheimer Global Allocation I (QGRIX)
441 303# of Peers 408 239
World Allocation -372040√
√√ √ N/AppN/App √ √ √ √ √T. Rowe Price Capital Appreciation (PRWCX)
798 616# of Peers 767 537 314
Allocation--50% to 70% Equity 30000√
√√ √ N/AppN/App √ √ √ √ √Vanguard Tax-Managed Balanced Adm (VTMFX)
451 346# of Peers 423 315 144
Allocation--30% to 50% Equity 101130√
√√ √ N/AppN/App √ √ √ √ √Vanguard Wellington Admiral (VWENX)
798 616# of Peers 767 537 314
Allocation--50% to 70% Equity 30000√
X√ √ N/AppN/App √ √ √ √ √American Funds Capital Income Bldr A (CAIBX)
441 303# of Peers 408 239 124
World Allocation 1962415√
X√ √ N/AppN/App √ √ √ √ √American Funds Income Fund of Amer A
(AMECX) 386 273# of Peers 362 234 138
Allocation--70% to 85% Equity 15710519√
X√ √ N/AppN/App √ √ √ √ √Vanguard Wellesley Income Admiral (VWIAX)
451 346# of Peers 423 315 144
Allocation--30% to 50% Equity 612525√
√√ √ N/AppN/App √ X X √ √Franklin Income A (FKINX)
451 346# of Peers 423 315 144
Allocation--30% to 50% Equity 2727364534√
√√ √ N/AppN/App √ X X X √Templeton Global Balanced Adv (TZINX)
441 303# of Peers 408 239
World Allocation -29335234√
X√ √ N/AppN/App √ √ √ √ √Bruce (BRUFX)
798 616# of Peers 767 537 314
Allocation--50% to 70% Equity 1710122035√
X√ √ N/AppN/App √ √ √ √ XMFS Conservative Allocation A (MACFX)
451 346# of Peers 423 315 144
Allocation--30% to 50% Equity 48132044√
Page 24 of 38
Fund data as of 3/31/2017
Analysis, search process, and layout are © 2000-2017, fi360, Inc. (www.fi360.com). All rights reserved. The analysis and opinions generated by fi360: (1) do not constitute professional investment advice; (2) are provided solely for informational purposes; (3) are not warranted or represented to be correct,
complete, or accurate; and (4) are for the exclusive use of subscribers to fi360. The data source is © 2017 Morningstar, Inc. All rights reserved. The data contained herein: (1) is proprietary to Morningstar, Inc and/or its content providers; (2) may not be copied or distributed; and (3) is not warranted to be
accurate, complete or timely. Neither Morningstar, Inc nor its content providers are responsible for any damages or losses arising from any use of this information. Past performance is no guarantee of future results.
fi360_Landscape_v8_1
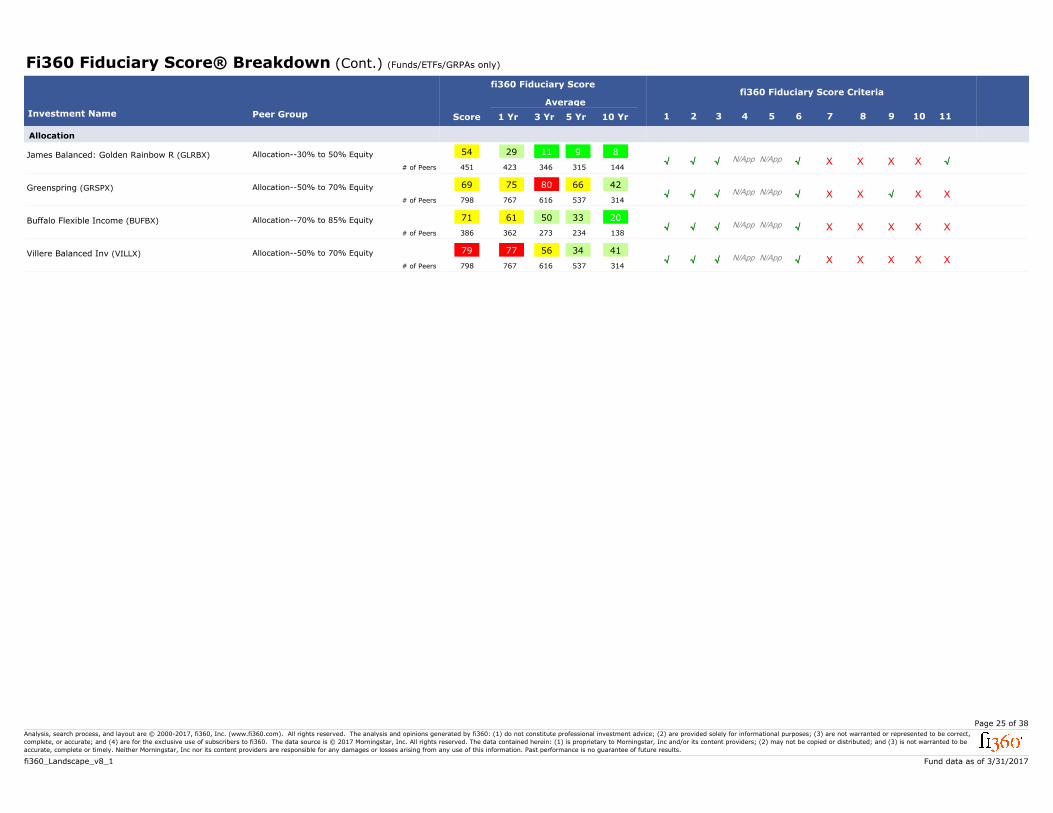
Fi360 Fiduciary Score® Breakdown (Cont.) (Funds/ETFs/GRPAs only)
fi360 Fiduciary Score Criteria
1
Average
fi360 Fiduciary Score
Investment Name 2 3 4 5 6 7 8 9 10 111 Yr 3 Yr 5 Yr 10 YrPeer Group Score
Allocation
X√ √ N/AppN/App √ X X X √James Balanced: Golden Rainbow R (GLRBX)
451 346# of Peers 423 315 144
Allocation--30% to 50% Equity 89112954√
√√ √ N/AppN/App √ X X X XGreenspring (GRSPX)
798 616# of Peers 767 537 314
Allocation--50% to 70% Equity 4266807569√
X√ √ N/AppN/App √ X X X XBuffalo Flexible Income (BUFBX)
386 273# of Peers 362 234 138
Allocation--70% to 85% Equity 2033506171√
X√ √ N/AppN/App √ X X X XVillere Balanced Inv (VILLX)
798 616# of Peers 767 537 314
Allocation--50% to 70% Equity 4134567779√
Page 25 of 38
Fund data as of 3/31/2017
Analysis, search process, and layout are © 2000-2017, fi360, Inc. (www.fi360.com). All rights reserved. The analysis and opinions generated by fi360: (1) do not constitute professional investment advice; (2) are provided solely for informational purposes; (3) are not warranted or represented to be correct,
complete, or accurate; and (4) are for the exclusive use of subscribers to fi360. The data source is © 2017 Morningstar, Inc. All rights reserved. The data contained herein: (1) is proprietary to Morningstar, Inc and/or its content providers; (2) may not be copied or distributed; and (3) is not warranted to be
accurate, complete or timely. Neither Morningstar, Inc nor its content providers are responsible for any damages or losses arising from any use of this information. Past performance is no guarantee of future results.
fi360_Landscape_v8_1
Peer Group Definitions / Risk Disclosures
Allocation--30% to 50% Equity
Funds in allocation categories seek to provide both income and capital appreciation by investing in multiple asset classes, including stocks, bonds, and cash. These portfolios are dominated by
domestic holdings and have equity exposures between 30% and 50%.
Allocation--50% to 70% Equity
Funds in allocation categories seek to provide both income and capital appreciation by investing in multiple asset classes, including stocks, bonds, and cash. These portfolios are dominated by
domestic holdings and have equity exposures between 50% and 70%.
Allocation--70% to 85% Equity
Funds in allocation categories seek to provide both income and capital appreciation by investing in multiple asset classes, including stocks, bonds, and cash. These portfolios are dominated by
domestic holdings and have equity exposures between 70% and 85%.
Commodities Broad Basket
Broad Basket portfolios can invest in a diversified basket of commodity goods including but not limited to grains, minerals, metals, livestock, cotton, oils, sugar, coffee and cocoa. Investment can be
made directly in physical assets or commodity linked derivative instruments, such as commodity swap agreements.
Corporate Bond
Corporate Bond portfolios concentrate on bonds issued by corporations. These tend to have more credit risk than government or agency-backed bonds. These portfolios hold more than 65% of their
assets in corporate bonds, hold less than 40% of their assets in foreign bonds, less than 35% in high yield bonds, and have an effective duration of more than 75% of the Mornignstar Core Bond
Index.
Diversified Emerging Mkts
Diversified emerging-markets portfolios tend to divide their assets among 20 or more nations, although they tend to focus on the emerging markets of Asia and Latin America rather than on those of
the Middle East, Africa, or Europe. These portfolios invest predominantly in emerging market equities, but some funds also invest in both equities and fixed income investments from emerging
markets.
Emerging Markets Bond
Emerging-markets bond portfolios invest more than 65% of their assets in foreign bonds from developing countries. The largest portion of the emerging-markets bond market comes from Latin
America, followed by Eastern Europe. Africa, the Middle East, and Asia make up the rest.
Foreign Large Blend
Foreign large-blend portfolios invest in a variety of big international stocks. Most of these portfolios divide their assets among a dozen or more developed markets, including Japan, Britain, France,
and Germany. These portfolios primarily invest in stocks that have market caps in the top 70% of each economically integrated market (such as Europe or Asia ex-Japan). The blend style is assigned
to portfolios where neither growth nor value characteristics predominate. These portfolios typically will have less than 20% of assets invested in U.S. stocks.
Foreign Large Growth
Foreign large-growth portfolios focus on high-priced growth stocks, mainly outside of the United States. Most of these portfolios divide their assets among a dozen or more developed markets,
including Japan, Britain, France, and Germany. These portfolios primarily invest in stocks that have market caps in the top 70% of each economically integrated market (such as Europe or Asia
ex-Japan). Growth is defined based on fast growth (high growth rates for earnings, sales, book value, and cash flow) and high valuations (high price ratios and low dividend yields). These portfolios
typically will have less than 20% of assets invested in U.S. stocks.
Foreign Large Value
Foreign large-value portfolios invest mainly in big international stocks that are less expensive or growing more slowly than other large-cap stocks. Most of these portfolios divide their assets among a
dozen or more developed markets, including Japan, Britain, France, and Germany. These portfolios primarily invest in stocks that have market caps in the top 70% of each economically integrated
market (such as Europe or Asia ex-Japan). Value is defined based on low valuations (low price ratios and high dividend yields) and slow growth (low growth rates for earnings, sales, book value, and
cash flow). These portfolios typically will have less than 20% of assets invested in U.S. stocks.
Foreign Small/Mid Blend
Foreign small/mid-blend portfolios invest in a variety of international stocks that are smaller. These portfolios primarily invest in stocks that fall in the bottom 30% of each economically integrated
market (such as Europe or Asia ex-Japan). The blend style is assigned to portfolios where neither growth nor value characteristics predominate. These portfolios typically will have less than 20% of
assets invested in U.S. stocks.
Foreign Small/Mid Growth
Foreign small-/mid-growth portfolios invest in international stocks that are smaller, growing faster, and higher-priced than other stocks. These portfolios primarily invest in stocks that fall in the bottom
30% of each economically integrated market (such as Europe or Asia ex-Japan). Growth is defined based on fast growth (high growth rates for earnings, sales, book value, and cash flow) and high
valuations (high price ratios and low dividend yields). These portfolios typically will have less than 20% of assets invested in U.S. stocks.
Page 26 of 38
Fund data as of 3/31/2017
Analysis, search process, and layout are © 2000-2017, fi360, Inc. (www.fi360.com). All rights reserved. The analysis and opinions generated by fi360: (1) do not constitute professional investment advice; (2) are provided solely for informational purposes; (3) are not warranted or represented to be correct,
complete, or accurate; and (4) are for the exclusive use of subscribers to fi360. The data source is © 2017 Morningstar, Inc. All rights reserved. The data contained herein: (1) is proprietary to Morningstar, Inc and/or its content providers; (2) may not be copied or distributed; and (3) is not warranted to be
accurate, complete or timely. Neither Morningstar, Inc nor its content providers are responsible for any damages or losses arising from any use of this information. Past performance is no guarantee of future results.
fi360_Landscape_v8_1
Peer Group Definitions / Risk Disclosures (Cont.)
Foreign Small/Mid Value
Foreign small-/mid-value portfolios invest in international stocks that are smaller and less expensive than other stocks. These portfolios primarily invest in stocks that fall in the bottom 30% of each
economically integrated market (such as Europe or Asia ex-Japan). Value is defined based on low valuations (low price ratios and high dividend yields) and slow growth (low growth rates for earnings,
sales, book value, and cash flow). These portfolios typically will have less than 20% of assets invested in U.S. stocks.
High Yield Bond
High-yield bond portfolios concentrate on lower-quality bonds, which are riskier than those of higher-quality companies. These portfolios generally offer higher yields than other types of portfolios, but
they are also more vulnerable to economic and credit risk. These portfolios primarily invest in U.S. high-income debt securities where at least 65% or more of bond assets are not rated or are rated by
a major agency such as Standard & Poor's or Moody's at the level of BB (considered speculative for taxable bonds) and below.
Inflation-Protected Bond
Inflation-protected bond portfolios invest primarily in debt securities that adjust their principal values in line with the rate of inflation. These bonds can be issued by any organization, but the U.S.
Treasury is currently the largest issuer for these types of securities.
Intermediate Government
Intermediate-government portfolios have at least 90% of their bond holdings in bonds backed by the U.S. government or by government-linked agencies. This backing minimizes the credit risk of
these portfolios, as the U.S. government is unlikely to default on its debt. These portfolios have durations typically between 3.5 and six years. Consequently, the group's performance--and its level of
volatility--tends to fall between that of the short government and long government bond categories. Morningstar calculates monthly breakpoints using the effective duration of the Morningstar Core
Bond Index (MCBI) in determing duration assignment. Intermediate is defined as 75% to 125% of the 3 year average effective duration of the MCBI.
Intermediate-Term Bond
Intermediate-term bond portfolios invest primarily in corporate and other investment-grade U.S. fixed-income issues and typically have durations of 3.5 to six years. These portfolios are less sensitive
to interest rates, and therefore less volatile, than portfolios that have longer durations. Morningstar calculates monthly breakpoints using the effective duration of the Morningstar Core Bond Index
(MCBI) in determing duration assignment. Intermediate-term is defined as 75% to 125% of the 3 year average effective duration of the MCBI.
Large Blend
Large-blend portfolios are fairly representative of the overall U.S. stock market in size, growth rates, and price. Stocks in the top 70% of the capitalization of the U.S. equity market are defined as
large-cap. The blend style is assigned to portfolios where neither growth nor value characteristics predominate. These portfolios tend to invest across the spectrum of U.S. industries, and owing to their
broad exposure, the portfolios' returns are often similar to those of the S&P 500 Index.
Large Growth
Large-growth portfolios invest primarily in big U.S. companies that are projected to grow faster than other large-cap stocks. Stocks in the top 70% of the capitalization of the U.S. equity market are
defined as large cap. Growth is defined based on fast growth (high growth rates for earnings, sales, book value, and cash flow) and high valuations (high price ratios and low dividend yields). Most of
these portfolios focus on companies in rapidly expanding industries.
Large Value
Large-value portfolios invest primarily in big U.S. companies that are less expensive or growing more slowly than other large-cap stocks. Stocks in the top 70% of the capitalization of the U.S. equity
market are defined as large-cap. Value is defined based on low valuations (low price ratios and high dividend yields) and slow growth (low growth rates for earnings, sales, book value, and cash flow).
Long Government
Long-government portfolios have at least 90% of their bond holdings invested in bonds backed by the U.S. government or by government-linked agencies. This backing minimizes the credit risk of
these portfolios, as the U.S. government is unlikely to default on its debt. They are not risk free, though. Because these portfolios have durations of typically more than six years, they are more
sensitive to interest rates, and thus riskier, than portfolios that have shorter durations. Morningstar calculates monthly breakpoints using the effective duration of the Morningstar Core Bond Index
(MCBI) in determing duration assignment. Long term is defined as 125% of the 3 year average effective duration of the MCBI.
Long-Term Bond
Long-term bond portfolios invest primarily in corporate and other investment-grade U.S. fixed-income issues and typically have durations of more than six years. Due to their long durations, these
portfolios are exposed to greater interest rate risk. Morningstar calculates monthly breakpoints using the effective duration of the Morningstar Core Bond Index (MCBI) in determing duration
assignment. Long-term is defined as 125% of the 3 year average effective duration of the MCBI.
Mid-Cap Blend
The typical mid-cap blend portfolio invests in U.S. stocks of various sizes and styles, giving it a middle-of-the-road profile. Most shy away from high-priced growth stocks, but aren't so price-conscious
that they land in value territory. The U.S. mid-cap range for market capitalization typically falls between $1 billion-$8 billion and represents 20% of the total capitalization of the U.S. equity market.
The blend style is assigned to portfolios where neither growth nor value characteristics predominate.
Page 27 of 38
Fund data as of 3/31/2017
Analysis, search process, and layout are © 2000-2017, fi360, Inc. (www.fi360.com). All rights reserved. The analysis and opinions generated by fi360: (1) do not constitute professional investment advice; (2) are provided solely for informational purposes; (3) are not warranted or represented to be correct,
complete, or accurate; and (4) are for the exclusive use of subscribers to fi360. The data source is © 2017 Morningstar, Inc. All rights reserved. The data contained herein: (1) is proprietary to Morningstar, Inc and/or its content providers; (2) may not be copied or distributed; and (3) is not warranted to be
accurate, complete or timely. Neither Morningstar, Inc nor its content providers are responsible for any damages or losses arising from any use of this information. Past performance is no guarantee of future results.
fi360_Landscape_v8_1
Peer Group Definitions / Risk Disclosures (Cont.)
Mid-Cap Growth
Some mid-cap growth portfolios invest in stocks of all sizes, thus leading to a mid-cap profile, but others focus on midsize companies. Mid-cap growth portfolios target U.S. firms that are projected to
grow faster than other mid-cap stocks, therefore commanding relatively higher prices. The U.S. mid-cap range for market capitalization typically falls between $1 billion-$8 billion and represents 20%
of the total capitalization of the U.S. equity market. Growth is defined based on fast growth (high growth rates for earnings, sales, book value, and cash flow) and high valuations (high price ratios and
low dividend yields).
Mid-Cap Value
Some mid-cap value portfolios focus on medium-size companies while others land here because they own a mix of small-, mid-, and large-cap stocks. All look for U.S. stocks that are less expensive
or growing more slowly than the market. The U.S. mid-cap range for market capitalization typically falls between $1 billion-$8 billion and represents 20% of the total capitalization of the U.S. equity
market. Value is defined based on low valuations (low price ratios and high dividend yields) and slow growth (low growth rates for earnings, sales, book value, and cash flow).
Multisector Bond
Multisector bond portfolios seek income by diversifying their assets among several fixed-income sectors, usually U.S. government obligations, U.S. corporate bonds, foreign bonds, and high-yield U.S.
debt securities. These portfolios typically hold 35% to 65% of bond assets in securities that are not rated or are rated by a major agency such as Standard & Poor's or Moody's at the level of BB
(considered speculative for taxable bonds) and below.
Muni Massachusetts
Muni Massachusetts portfolios invest at least 80% of assets in Massachusetts municipal debt and can include long-, intermediate-, and short-duration portfolios. Because the income from these bonds
is generally free from federal taxes and Massachusetts state taxes, these portfolios are most appealing to residents of Massachusetts.
Muni National Interm
Muni national intermediate portfolios invest in bonds issued by various state and local governments to fund public projects. The income from these bonds is generally free from federal taxes. To lower
risk, these portfolios spread their assets across many states and sectors. These portfolios have durations of 4.5 to seven years (or, if duration is unavailable, average maturities of five to 12 years).
Nontraditional Bond
The Nontraditional Bond category contains funds that pursue strategies divergent in one or more ways from conventional practice in the broader bond-fund universe. Many funds in this group describe
themselves as "absolute return" portfolios, which seek to avoid losses and produce returns uncorrelated with the overall bond market; they employ a variety of methods to achieve those aims. Another
large subset are self-described "unconstrained" portfolios that have more flexibility to invest tactically across a wide swath of individual sectors, including high-yield and foreign debt, and typically with
very large allocations. Funds in the latter group typically have broad freedom to manage interest-rate sensitivity, but attempt to tactically manage those exposures in order to minimize volatility. The
category is also home to a subset of portfolios that attempt to minimize volatility by maintaining short or ultra-short duration portfolios, but explicitly court significant credit and foreign bond market
risk in order to generate high returns. Funds within this category often will use credit default swaps and other fixed income derivatives to a significant level within their portfolios.
Short-Term Bond
Short-term bond portfolios invest primarily in corporate and other investment-grade U.S. fixed-income issues and typically have durations of one to 3.5 years. These portfolios are attractive to fairly
conservative investors, because they are less sensitive to interest rates than portfolios with longer durations. Morningstar calculates monthly breakpoints using the effective duration of the Morningstar
Core Bond Index (MCBI) in determing duration assignment. Short-term is defined as 25% to 75% of the 3 year average effective duration of the MCBI.
Small Blend
Small-blend portfolios favor U.S. firms at the smaller end of the market-capitalization range. Some aim to own an array of value and growth stocks while others employ a discipline that leads to
holdings with valuations and growth rates close to the small-cap averages. Stocks in the bottom 10% of the capitalization of the U.S. equity market are defined as small-cap. The blend style is
assigned to portfolios where neither growth nor value characteristics predominate.
Small Growth
Small-growth portfolios focus on faster-growing companies whose shares are at the lower end of the market-capitalization range. These portfolios tend to favor companies in up-and-coming industries
or young firms in their early growth stages. Because these businesses are fast-growing and often richly valued, their stocks tend to be volatile. Stocks in the bottom 10% of the capitalization of the
U.S. equity market are defined as small-cap. Growth is defined based on fast growth (high growth rates for earnings, sales, book value, and cash flow) and high valuations (high price ratios and low
dividend yields).
Small Value
Small-value portfolios invest in small U.S. companies with valuations and growth rates below other small-cap peers. Stocks in the bottom 10% of the capitalization of the U.S. equity market are defined
as small-cap. Value is defined based on low valuations (low price ratios and high dividend yields) and slow growth (low growth rates for earnings, sales, book value, and cash flow).
World Allocation
World-allocation portfolios seek to provide both capital appreciation and income by investing in three major areas: stocks, bonds, and cash. While these portfolios do explore the whole world, most of
them focus on the U.S., Canada, Japan, and the larger markets in Europe. They should have less than 50% of their assets in emerging markets. These portfolios typically have at least 10% of assets
in bonds, less than 70% of assets in stocks, and at least 40% of assets in non-U.S. stocks or bonds.
Page 28 of 38
Fund data as of 3/31/2017
Analysis, search process, and layout are © 2000-2017, fi360, Inc. (www.fi360.com). All rights reserved. The analysis and opinions generated by fi360: (1) do not constitute professional investment advice; (2) are provided solely for informational purposes; (3) are not warranted or represented to be correct,
complete, or accurate; and (4) are for the exclusive use of subscribers to fi360. The data source is © 2017 Morningstar, Inc. All rights reserved. The data contained herein: (1) is proprietary to Morningstar, Inc and/or its content providers; (2) may not be copied or distributed; and (3) is not warranted to be
accurate, complete or timely. Neither Morningstar, Inc nor its content providers are responsible for any damages or losses arising from any use of this information. Past performance is no guarantee of future results.
fi360_Landscape_v8_1
Peer Group Definitions / Risk Disclosures (Cont.)
World Bond
World bond portfolios invest 40% or more of their assets in foreign bonds. Some world bond portfolios follow a conservative approach, favoring high-quality bonds from developed markets. Others are
more adventurous, and own some lower-quality bonds from developed or emerging markets. Some portfolios invest exclusively outside the U.S., while others regularly invest in both U.S. and non-U.S.
bonds.
World Stock
World-stock portfolios have few geographical limitations. It is common for these portfolios to invest the majority of their assets in the U.S., Europe, and Japan, with the remainder divided among the
globe's smaller markets. These portfolios typically have 20%-60% of assets in U.S. stocks.
Investment Risk
Alternative Investments
Alternative investments may not be suitable for all investors and should be considered as an investment for the risk capital portion of the investor’s portfolio. The strategies employed in the
management of alternative investments may accelerate the velocity of potential losses.
Bonds
Bonds are subject to market and interest rate risk if sold prior to maturity. Bond values will decline as interest rates rise and bonds are subject to availability and change in price.
Commodities
The investor should note that commodities investing is generally considered speculative because of the significant potential for investment loss. Their markets are likely to be volatile and there may
be sharp price fluctuations even during periods when prices overall are rising.
Foreign Securities Funds/Emerging Market Funds
The investor should note that funds that invest in foreign securities involve special additional risks. These risks include, but are not limited to, currency risk, political risk, and risk associated with
varying accounting standards. Investing in emerging markets may accentuate these risks.
High-Yield Bond Funds
The investor should note that funds that invest in lower-rated debt securities (commonly referred to as junk bonds) involve additional risks because of the lower credit quality of the securities in the
portfolio. The investor should be aware of the possible higher level of volatility, and increased risk of default.
Mid Cap Funds
The investor should note that funds that invest in companies with market capitalizations below $10 billion involve additional risks.The securities of these companies may be more volatile and less
liquid than the securities of larger companies.
Non-Diversified Funds
The investor should note that funds that invest more of their assets in a single issuer involve additional risks, including share price fluctuations, because of the increased concentration of investments.
Real Estate Investment Trusts
Investing in Real Estate Investment Trusts (REITs) involves special risks such as potential illiquidity and may not be suitable for all investors. There is no assurance that the investment objectives of
any program will be attained.
Sector Funds
The investor should note that funds that invest exclusively in one sector or industry involve additional risks. The lack of industry diversification subjects the investor to increased industry-specific risks.
Small Cap Funds
The investor should note that funds that invest in stocks of small companies involve additional risks. Smaller companies typically have a higher risk of failure, and are not as well established as larger
blue-chip companies. Historically, smaller-company stocks have experienced a greater degree of market volatility than the overall market average.
Tax-Free Municipal Bond Funds
The investor should note that the income from tax-free municipal bond funds may be subject to state and local taxation and the Alternative Minimum Tax.
Value Investments
Value investments can perform differently from the market as a whole. They can remain undervalued by the market for long periods of time.
Page 29 of 38
Fund data as of 3/31/2017
Analysis, search process, and layout are © 2000-2017, fi360, Inc. (www.fi360.com). All rights reserved. The analysis and opinions generated by fi360: (1) do not constitute professional investment advice; (2) are provided solely for informational purposes; (3) are not warranted or represented to be correct,
complete, or accurate; and (4) are for the exclusive use of subscribers to fi360. The data source is © 2017 Morningstar, Inc. All rights reserved. The data contained herein: (1) is proprietary to Morningstar, Inc and/or its content providers; (2) may not be copied or distributed; and (3) is not warranted to be
accurate, complete or timely. Neither Morningstar, Inc nor its content providers are responsible for any damages or losses arising from any use of this information. Past performance is no guarantee of future results.
fi360_Landscape_v8_1
Index Definitions BBgBarc EM USD Aggregate TR USD
The index measures the performance of hard currency Emerging Markets debt, including fixed and floating-rate US dollar-denominated debt issued from sovereign, quasi-sovereign, and corporate EM
issuers. Country eligibility and classification as Emerging Markets is rules-based and reviewed annually using World Bank income group and International Monetary Fund (IMF) country classifications.
BBgBarc Municipal 10 Yr 8-12 TR USD
The index measures the performance of USD-denominated long-term tax exempt bond market with maturities of 10 years(8-12), including state and local general obligation bonds, revenue bonds,
insured bonds, and prerefunded bonds.
BBgBarc US Agg Bond TR USD
The index measures the performance of investment grade, U.S. dollar-denominated, fixed-rate taxable bond market, including Treasuries, government-related and corporate securities, MBS (agency
fixed-rate and hybrid ARM passthroughs), ABS, and CMBS. It rolls up into other Barclays flagship indices, such as the multi-currency Global Aggregate Index and the U.S. Universal Index, which
includes high yield and emerging markets debt.
BBgBarc US Corp IG TR USD
The index measures the performance of the investment grade, U.S. dollar-denominated, fixed-rate, taxable corporate bond market. It includes USD-denominated securities publicly issued by U.S. and
non-U.S. industrial, utility, and financial issuers that meet specified maturity, liquidity, and quality requirements.
BBgBarc US Government Long TR USD
The index measures the performance of the U.S. Treasury and U.S. Agency Indices with maturities of 10 years and greater, including Treasuries and U.S. agency debentures. It is a component of the
U.S. Government/Credit Index and the U.S. Aggregate Index.
BBgBarc US Government TR USD
The index measures the performance of the U.S. Treasury and U.S. Agency Indices, including Treasuries and U.S. agency debentures. It is a component of the U.S. Government/Credit Index and the
U.S. Aggregate Index.
BBgBarc US Govt/Credit 1-5 Yr TR USD
The index measures the performance of the non-securitized component of the U.S. Aggregate Index including treasuries, government-related issues and corporates with maturities of one to five
years. It is a subset of the U.S. Aggregate Index.
BBgBarc US Govt/Credit Long TR USD
The index measures the performance of non-securitized component of the U.S. Aggregate Index with maturities of 10 years and greater, including Treasuries, government-related issues and
corporates. It is a subset of the U.S. Aggregate Index.
BBgBarc US Treasury US TIPS TR USD
The index measures the performance of rules-based, market value-weighted inflation-protected securities issued by the U.S. Treasury. It is a subset of the Global Inflation-Linked Index (Series-L).
BBgBarc US Universal TR USD
The index measures the performance of USD-denominated, taxable bonds that are rated either investment grade or high-yield. It represents the union of the U.S. Aggregate Index, U.S. Corporate
High Yield Index, Investment Grade 144A Index, Eurodollar Index, U.S. Emerging Markets Index, and the non-ERISA eligible portion of the CMBS Index.
BofAML US HY Master II TR USD
The index measures the performance of short-term US dollar denominated below investment grade corporate debt publicly issued in the US domestic market. Qualifying securities must have at least
18 months to final maturity at the time of issuance, at least one year remaining term to final maturity as of the rebalancing date, a fixed coupon schedule and a minimum amount outstanding of
$100 million. It is capitalization-weighted.
BofAML USD LIBOR 3 Mon CM
The index measures the performance of a synthetic asset paying Libor to a stated maturity. It is based on the assumed purchase at par of a synthetic instrument having exactly its stated maturity and
with a coupon equal to that days fixing rate. That issue is assumed to be sold the following business day (priced at a yield equal to the current day fixing rate) and rolled into a new instrument.
Citi WGBI NonUSD USD
The index measures the performance of fixed-rate, local currency, investment-grade sovereign bonds of all WGBI countries except the United States and is stated in US dollar terms. It is a subset of
Citigroup World Government Bond Index (WGBI).
Morningstar Gbl Allocation TR USD
The index measures the performance of a multi-asset class portfolio of global equities, global bonds and cash. This portfolio is held in a static allocation that is appropriate for investors who seek
average exposure to global equity market risk and returns.
Page 30 of 38
Fund data as of 3/31/2017
Analysis, search process, and layout are © 2000-2017, fi360, Inc. (www.fi360.com). All rights reserved. The analysis and opinions generated by fi360: (1) do not constitute professional investment advice; (2) are provided solely for informational purposes; (3) are not warranted or represented to be correct,
complete, or accurate; and (4) are for the exclusive use of subscribers to fi360. The data source is © 2017 Morningstar, Inc. All rights reserved. The data contained herein: (1) is proprietary to Morningstar, Inc and/or its content providers; (2) may not be copied or distributed; and (3) is not warranted to be
accurate, complete or timely. Neither Morningstar, Inc nor its content providers are responsible for any damages or losses arising from any use of this information. Past performance is no guarantee of future results.
fi360_Landscape_v8_1
Index Definitions (Cont.)Morningstar Lng-Only Cmdty TR USD
The index measures the performance of future contracts on eligible long commodities. Eligibilty is defined as a commodity that has future contracts traded on one of the US exchanges and rank in the
top 95% by the 12-month average of total dollar value of open interest. The index is reconstituted annually, on the third Friday of December each year. It is a fully collateralized commodity futures
index.
Morningstar Mod Agg Tgt Risk TR USD
The Morningstar Target Risk Index family is designed to meet the needs of investors who would like to maintain a target level of equity exposure through a portfolio diversified across equities, bonds
and inflation-hedged instruments. The Morningstar Moderately Aggressive Target Risk Index seeks approximately 80% exposure to global equity markets.
Morningstar Mod Con Tgt Risk TR USD
The Morningstar Target Risk Index family is designed to meet the needs of investors who would like to maintain a target level of equity exposure through a portfolio diversified across equities, bonds
and inflation-hedged instruments. The Morningstar Moderately Conservative Target Risk Index seeks approximately 40% exposure to global equity markets.
Morningstar Mod Tgt Risk TR USD
The Morningstar Target Risk Index family is designed to meet the needs of investors who would like to maintain a target level of equity exposure through a portfolio diversified across equities, bonds
and inflation-hedged instruments. The Morningstar Moderate Target Risk Index seeks approximately 60% exposure to global equity markets.
MSCI ACWI Ex USA Growth NR USD
The index measures the performance of the growth large and mid cap segments of the particular regions, excluding USA equity securities, including developed and emerging market. It is free
float-adjusted market-capitalization weighted.
MSCI ACWI Ex USA NR USD
The index measures the performance of the large and mid cap segments of the particular regions, excluding USA equity securities, including developed and emerging market. It is free float-adjusted
market-capitalization weighted.
MSCI ACWI Ex USA SMID NR USD
The index measures the performance of the small and mid cap segments of the particular regions, excluding USA equity securities, including developed and emerging market. It is free float-adjusted
market-capitalization weighted.
MSCI ACWI Ex USA Value NR USD
The index measures the performance of the value large and mid cap segments of the particular regions, excluding USA equity securities, including developed and emerging market. It is free
float-adjusted market-capitalization weighted.
MSCI ACWI NR USD
The index measures the performance of the large and mid cap segments of all country markets. It is free float-adjusted market-capitalization weighted.
MSCI EM NR USD
The index measures the performance of the large and mid cap segments of emerging market equity securities. It is free float-adjusted market-capitalization weighted.
Russell 1000 Growth TR USD
The index measures the performance of the large-cap growth segment of the US equity securities. It includes the Russell 1000 index companies with higher price-to-book ratios and higher forecasted
growth values. It is market-capitalization weighted. Russell Investment Group is the source and owner of the trademarks, service marks and copyrights related to the Russell Indexes. Russell® is a
trademark of Russell Investment Group.
Russell 1000 TR USD
The index measures the performance of the large-cap segment of the US equity securities. It is a subset of the Russell 3000 index and includes approximately 1000 of the largest securities based on
a combination of their market cap and current index membership.
Russell 1000 Value TR USD
The index measures the performance of the large-cap value segment of the US equity securities. It includes the Russell 1000 index companies with lower price-to-book ratios and lower expected
growth values. It is market-capitalization weighted.
Russell Investment Group is the source and owner of the trademarks, service marks and copyrights related to the Russell Indexes. Russell® is a trademark of Russell Investment Group.
Russell 2000 Growth TR USD
The index measures the performance of small-cap growth segment of the US equity universe. It includes those Russell 2000 companies with higher price-to-value ratios and higher forecasted growth
values. It is market-capitalization weighted. Russell Investment Group is the source and owner of the trademarks, service marks and copyrights related to the Russell Indexes. Russell® is a trademark
of Russell Investment Group.
Page 31 of 38
Fund data as of 3/31/2017
Analysis, search process, and layout are © 2000-2017, fi360, Inc. (www.fi360.com). All rights reserved. The analysis and opinions generated by fi360: (1) do not constitute professional investment advice; (2) are provided solely for informational purposes; (3) are not warranted or represented to be correct,
complete, or accurate; and (4) are for the exclusive use of subscribers to fi360. The data source is © 2017 Morningstar, Inc. All rights reserved. The data contained herein: (1) is proprietary to Morningstar, Inc and/or its content providers; (2) may not be copied or distributed; and (3) is not warranted to be
accurate, complete or timely. Neither Morningstar, Inc nor its content providers are responsible for any damages or losses arising from any use of this information. Past performance is no guarantee of future results.
fi360_Landscape_v8_1
Index Definitions (Cont.)Russell 2000 TR USD
The index measures the performance of the small-cap segment of the US equity universe. It is a subset of the Russell 3000 and includes approximately 2000 of the smallest securities based on a
combination of their market cap and current index membership. Russell Investment Group is the source and owner of the trademarks, service marks and copyrights related to the Russell Indexes.
Russell® is a trademark of Russell Investment Group.
Russell 2000 Value TR USD
The index measures the performance of small-cap value segment of the US equity universe. It includes those Russell 2000 companies with lower price-to-book ratios and lower forecasted growth
values. It is market-capitalization weighted. Russell Investment Group is the source and owner of the trademarks, service marks and copyrights related to the Russell Indexes. Russell® is a trademark
of Russell Investment Group.
Russell Mid Cap Growth TR USD
The index measures the performance of the mid-cap growth segment of the US equity universe. It includes Russell midcap index companies with higher price-to-book ratios and higher forecasted
growth values. It is market-capitalization weighted. Russell Investment Group is the source and owner of the trademarks, service marks and copyrights related to the Russell Indexes. Russell® is a
trademark of Russell Investment Group.
Russell Mid Cap TR USD
The index measures the performance of the mid-cap segment of the US equity universe. It is a subset of Russell 1000 index and includes approximately 800 of the smallest securities based on a
combination of their market cap and current index membership. The index represents approximately 31% of the total market capitalization of the Russell 1000 companies.
Russell Mid Cap Value TR USD
The index measures the performance of the mid-cap value segment of the US equity universe. It includes Russell midcap index companies with lower price-to-book ratios and lower forecasted growth
values. It is market-capitalization weighted.
Page 32 of 38
Fund data as of 3/31/2017
Analysis, search process, and layout are © 2000-2017, fi360, Inc. (www.fi360.com). All rights reserved. The analysis and opinions generated by fi360: (1) do not constitute professional investment advice; (2) are provided solely for informational purposes; (3) are not warranted or represented to be correct,
complete, or accurate; and (4) are for the exclusive use of subscribers to fi360. The data source is © 2017 Morningstar, Inc. All rights reserved. The data contained herein: (1) is proprietary to Morningstar, Inc and/or its content providers; (2) may not be copied or distributed; and (3) is not warranted to be
accurate, complete or timely. Neither Morningstar, Inc nor its content providers are responsible for any damages or losses arising from any use of this information. Past performance is no guarantee of future results.
fi360_Landscape_v8_1
Glossary 12b-1 Fee
Maximum annual charge deducted from fund assets to pay for distribution and marketing costs. Although usually set on a percentage basis, this amount will occasionally be a flat figure. This
information is taken directly from the fund's prospectus, and includes distribution, service and other expenses incurred by the fund. Morningstar lists the maximum amount. Some 12b-1 fees are
something of a hidden charge, because they are taken out of the NAV. Morningstar breaks the 12b-1 amount out of the expense ratio so investors know how much they're paying. (Description provided by
Morningstar)
Alpha
A measure of the difference between a fund's actual returns and its expected performance, given its level of risk as measured by beta. A positive alpha figure indicates the fund has performed better
than its beta would predict. In contrast, a negative alpha indicates the fund underperformed, given the expectations established by the fund's beta. All MPT statistics (alpha, beta, and R-squared) are
based on a least-squared regression of the fund's return over Treasury bills (called excess return) and the excess returns of the fund's benchmark index. (Description provided by Morningstar)
Composition Criterion
This screen is one of the fi360 Fiduciary Score« criterion.The screened product can have no more than 20% of the portfolio invested in 'unrelated asset class securities. For example, a Large-Cap
Growth product should not hold more than 20% in cash, fixed income and/or international securities.This screen is not applied to all asset classes. (Description provided by fi360)
Deferred Load
This is also known as a back-end sales charge, and it is imposed when investors redeem shares. The percentage charged generally declines the longer shares are held, and it is usually applied to the
lower of the beginning price or ending price. This charge is often coupled with higher 12b-1 fees in B or C share classes as an alternative to a traditional front-end load fund. (Description provided by
Morningstar)
Expense Ratio - Prospectus Gross
Gross Expense Ratio represents the total gross expenses (net expenses with waivers added back in) divided by the fund's average net assets. If it is not equal to the net expense ratio, the gross
expense ratio portrays the fund's expenses had the fund not waived a portion, or all, of its fees. Thus, to some degree, it is an indication of fee contracts. Some fee waivers have an expiration date;
other waivers are in place indefinitely. (Description provided by Morningstar)
Expense Ratio - Prospectus Net
The percentage of fund assets used to pay for operating expenses and management fees, including 12b-1 fees, administrative fees, and all other asset-based costs incurred by the fund, except
brokerage costs. Fund expenses are reflected in the fund's NAV. Sales charges are not included in the expense ratio. The expense ratio for fund of funds is the aggregate expense ratio as defined as
the sum of the wrap or sponsor fees plus the estimated weighted average of the underlying fund fees. (Description provided by Morningstar)
fi360 Fiduciary Score
The fi360 Fiduciary Score® is a peer percent ranking of an investment against a set of quantitative due diligence criteria selected to reflect prudent fiduciary management. The fi360 Fiduciary Score® is
calculated on a monthly basis for investments with at least a three year history. Note: Group Retirement Plan Annuities (GRPAs) are ranked in a peer group that includes GRPAs, Mutual Funds and
ETFs. Prior to 9/30/2013 only Mutual Funds and ETFs were used to construct the peer group. (Description provided by fi360)
fi360 Fiduciary Score« Average
The fi360 Fiduciary Score Average is a one-, three-, five- or ten-year rolling average of an investment's fi360 Fiduciary Score. The Average Score is calculated on a monthly basis. Since the Average
Score is a rolling average of the historical fi360 Fiduciary Score, an investment needs to have the requisite amount of Fiduciary Score calculations for each Average Score. (Description provided by fi360)
fi360 Fiduciary Score« Methodology
The fi360 Fiduciary Score® is a peer percent ranking of an investment against a set of quantitative due diligence criteria selected to reflect prudent fiduciary management. For each investment with at
least a three-year history, fi360 calculates the fi360 Fiduciary Score based on the following due diligence criteria: regulatory oversight, minimum track record, stability of the organization, assets in the
investment, composition consistency with asset class, style consistency, expense ratio/fees relative to peers, risk-adjusted performance relative to peers, and performance relative to peers.
Investments are evaluated at the conclusion of each month. If an investment does not meet an individual due diligence criterion, points are awarded. Investments that satisfy all of the due diligence
criteria receive a fi360 Fiduciary Score of 0. Every other investment is given a Score of 1-100 based on their point total, and representing their percentile ranking within their peer group. The fi360
Fiduciary Score Average is a one-, three-, five- or ten-year rolling average of an investments fi360 Fiduciary Score. The Average Score is also calculated on a monthly basis. The fi360 Fiduciary Score
represents a suggested course of action and is not intended, nor should it be used, as the sole source of information for reaching an investment decision.Visit fi360.com/fi360-Fiduciary-Score for the
complete methodology document. (Description provided by fi360)
Front-End Load
The initial, or front-end, sales charge is a one-time deduction from an investment made into the fund. The amount is generally relative to the amount of the investment, so that larger investments
incur smaller rates of charge. The sales charge serves as a commission for the broker who sold the fund. A fund's potential fees and sales charges are an important factor to consider before making
an investment. The load fee compensates the broker or financial planner for the service of providing professional investment advice. (Description provided by Morningstar)
Page 33 of 38
Fund data as of 3/31/2017
Analysis, search process, and layout are © 2000-2017, fi360, Inc. (www.fi360.com). All rights reserved. The analysis and opinions generated by fi360: (1) do not constitute professional investment advice; (2) are provided solely for informational purposes; (3) are not warranted or represented to be correct,
complete, or accurate; and (4) are for the exclusive use of subscribers to fi360. The data source is © 2017 Morningstar, Inc. All rights reserved. The data contained herein: (1) is proprietary to Morningstar, Inc and/or its content providers; (2) may not be copied or distributed; and (3) is not warranted to be
accurate, complete or timely. Neither Morningstar, Inc nor its content providers are responsible for any damages or losses arising from any use of this information. Past performance is no guarantee of future results.
fi360_Landscape_v8_1
Glossary (Cont.)Fund Family
A company which offers mutual funds. Generally speaking, the company name is included in the official fund name. (Description provided by Morningstar)
Fund Name
The fund's official name, or an abbreviation thereof, as stated in the fund's prospectus. Morningstar attempts to limit the extent to which fund name abbreviation is made by keeping the family name
or first word intact whenever possible. As a general rule, the words Fund, Shares, Class, Series, Trust (not including class designation), and articles at the beginning of a fund's name are omitted. They
appear, however, in cases where their omission could confuse two funds or groups. The fund name is taken directly from the prospectus. The names normally do not change, unless the fund itself
changes its name. (Description provided by Morningstar)
Inception Date
The date on which the fund began its operations. Funds with long track records offer more history by which investors can assess overall fund performance. However, another important factor to consider
is the fund manager and his or her tenure with the fund. Often times a change in fund performance can indicate a change in management. (Description provided by Morningstar)
Investment Type
The following abbreviations are used to identify an investment type. MF - Mutual Fund, ETF - Exchange Traded Fund, VA - Variable Annuity, SMA - Seprately Managed Account, GRPA - Group Retirement
Plan Annuity (Description provided by fi360)
Manager Tenure
The number of years that the current manager has been managing the investment.In the case of a team, the longest manager tenure is used. (Description provided by Morningstar)
Net Assets - Funds/ETFs
The month-end net assets of the mutual fund, recorded in millions of dollars. Net-asset figures are useful in gauging a fund's size, agility, and popularity. They help determine whether a small
company fund, for example, can remain in its investment-objective category if its asset base reaches an ungainly size.The assets are totaled across all share classes of the fund. (Description provided by
Morningstar)
Number of investments in Peer Group
A count of the number of investments within a specific peer group for a particular data point such as 1yr return or Alpha. This number represents the total number of investments used to calculate the
bar charts and rankings for each data point.(Note: Group Retirement Plan Annuities (GRPAs) are ranked in a peer group that includes GRPAs, Mutual Funds and ETFs. Prior to 9/30/2013 only Mutual
Funds and ETFs were used to construct the peer group. (Description provided by fi360)
Sharpe Ratio
A risk-adjusted measure developed by Nobel Laureate William Sharpe. It is calculated by using standard deviation and excess return to determine reward per unit of risk. The higher the Sharpe Ratio,
the better the fund's historical risk-adjusted performance. The Sharpe ratio is calculated for the past 36-month period by dividing a fund's annualized excess returns by the standard deviation of a
fund's annualized excess returns.Since this ratio uses standard deviation as its risk measure, it is most appropriately applied when analyzing a fund that is an investor's sole holding. The Sharpe Ratio
can be used to compare two funds directly on how much risk a fund had to bear to earn excess return over the risk-free rate. (Description provided by Morningstar)
Style Drift Criterion
This screen is one of the fi360 Fiduciary Score« criterion.A comparison is made of the fund's category (3-year style average) and the current style (for the quarter). The fiduciary due diligence screen is
a match between the category and style. (Description provided by fi360)
Total Return - Load-Adjusted
Expressed as a percentage, this return is adjusted for front-end loads, deferred loads and redemption fees, but not taxes. For investments with front-end loads, the full amount of the load is
deducted. For deferred loads and redemption fees, the percentage charged often declines the longer the shares are held. Morningstar adjusts the deferred load for each time period accordingly when
making this calculation. (Description provided by Morningstar)
Total Return - Percentile Rank
This is the investment's total-return percentile rank relative to all funds that have the same Morningstar Category. The highest (or most favorable) percentile rank is 1 and the lowest (or least
favorable) percentile rank is 100. The top-performing investment in a category will always receive a rank of 1. Rankings may vary among share classes and are based on historical total returns, which
are not indicative of future results. (Description provided by Morningstar)
Page 34 of 38
Fund data as of 3/31/2017
Analysis, search process, and layout are © 2000-2017, fi360, Inc. (www.fi360.com). All rights reserved. The analysis and opinions generated by fi360: (1) do not constitute professional investment advice; (2) are provided solely for informational purposes; (3) are not warranted or represented to be correct,
complete, or accurate; and (4) are for the exclusive use of subscribers to fi360. The data source is © 2017 Morningstar, Inc. All rights reserved. The data contained herein: (1) is proprietary to Morningstar, Inc and/or its content providers; (2) may not be copied or distributed; and (3) is not warranted to be
accurate, complete or timely. Neither Morningstar, Inc nor its content providers are responsible for any damages or losses arising from any use of this information. Past performance is no guarantee of future results.
fi360_Landscape_v8_1
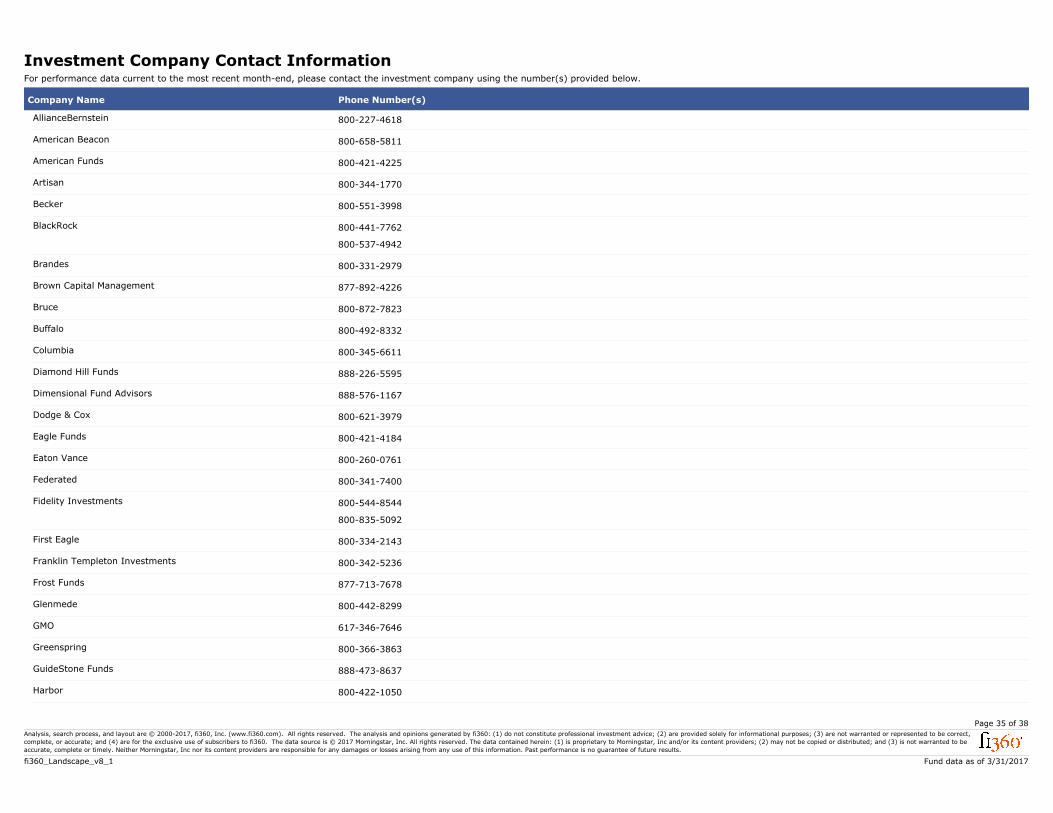
Investment Company Contact Information For performance data current to the most recent month-end, please contact the investment company using the number(s) provided below.
Phone Number(s)Company Name
AllianceBernstein 800-227-4618
American Beacon 800-658-5811
American Funds 800-421-4225
Artisan 800-344-1770
Becker 800-551-3998
BlackRock 800-441-7762
800-537-4942
Brandes 800-331-2979
Brown Capital Management 877-892-4226
Bruce 800-872-7823
Buffalo 800-492-8332
Columbia 800-345-6611
Diamond Hill Funds 888-226-5595
Dimensional Fund Advisors 888-576-1167
Dodge & Cox 800-621-3979
Eagle Funds 800-421-4184
Eaton Vance 800-260-0761
Federated 800-341-7400
Fidelity Investments 800-544-8544
800-835-5092
First Eagle 800-334-2143
Franklin Templeton Investments 800-342-5236
Frost Funds 877-713-7678
Glenmede 800-442-8299
GMO 617-346-7646
Greenspring 800-366-3863
GuideStone Funds 888-473-8637
Harbor 800-422-1050
Page 35 of 38
Fund data as of 3/31/2017
Analysis, search process, and layout are © 2000-2017, fi360, Inc. (www.fi360.com). All rights reserved. The analysis and opinions generated by fi360: (1) do not constitute professional investment advice; (2) are provided solely for informational purposes; (3) are not warranted or represented to be correct,
complete, or accurate; and (4) are for the exclusive use of subscribers to fi360. The data source is © 2017 Morningstar, Inc. All rights reserved. The data contained herein: (1) is proprietary to Morningstar, Inc and/or its content providers; (2) may not be copied or distributed; and (3) is not warranted to be
accurate, complete or timely. Neither Morningstar, Inc nor its content providers are responsible for any damages or losses arising from any use of this information. Past performance is no guarantee of future results.
fi360_Landscape_v8_1
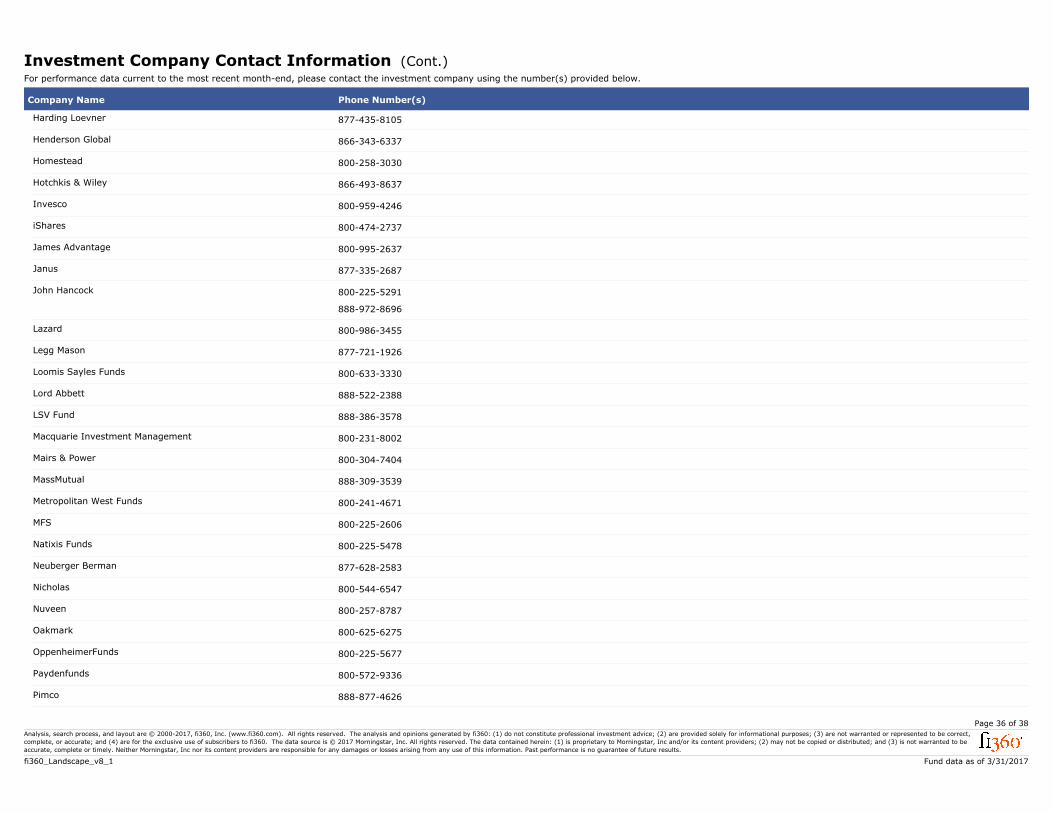
Investment Company Contact Information (Cont.)For performance data current to the most recent month-end, please contact the investment company using the number(s) provided below.
Phone Number(s)Company Name
Harding Loevner 877-435-8105
Henderson Global 866-343-6337
Homestead 800-258-3030
Hotchkis & Wiley 866-493-8637
Invesco 800-959-4246
iShares 800-474-2737
James Advantage 800-995-2637
Janus 877-335-2687
John Hancock 800-225-5291
888-972-8696
Lazard 800-986-3455
Legg Mason 877-721-1926
Loomis Sayles Funds 800-633-3330
Lord Abbett 888-522-2388
LSV Fund 888-386-3578
Macquarie Investment Management 800-231-8002
Mairs & Power 800-304-7404
MassMutual 888-309-3539
Metropolitan West Funds 800-241-4671
MFS 800-225-2606
Natixis Funds 800-225-5478
Neuberger Berman 877-628-2583
Nicholas 800-544-6547
Nuveen 800-257-8787
Oakmark 800-625-6275
OppenheimerFunds 800-225-5677
Paydenfunds 800-572-9336
Pimco 888-877-4626
Page 36 of 38
Fund data as of 3/31/2017
Analysis, search process, and layout are © 2000-2017, fi360, Inc. (www.fi360.com). All rights reserved. The analysis and opinions generated by fi360: (1) do not constitute professional investment advice; (2) are provided solely for informational purposes; (3) are not warranted or represented to be correct,
complete, or accurate; and (4) are for the exclusive use of subscribers to fi360. The data source is © 2017 Morningstar, Inc. All rights reserved. The data contained herein: (1) is proprietary to Morningstar, Inc and/or its content providers; (2) may not be copied or distributed; and (3) is not warranted to be
accurate, complete or timely. Neither Morningstar, Inc nor its content providers are responsible for any damages or losses arising from any use of this information. Past performance is no guarantee of future results.
fi360_Landscape_v8_1
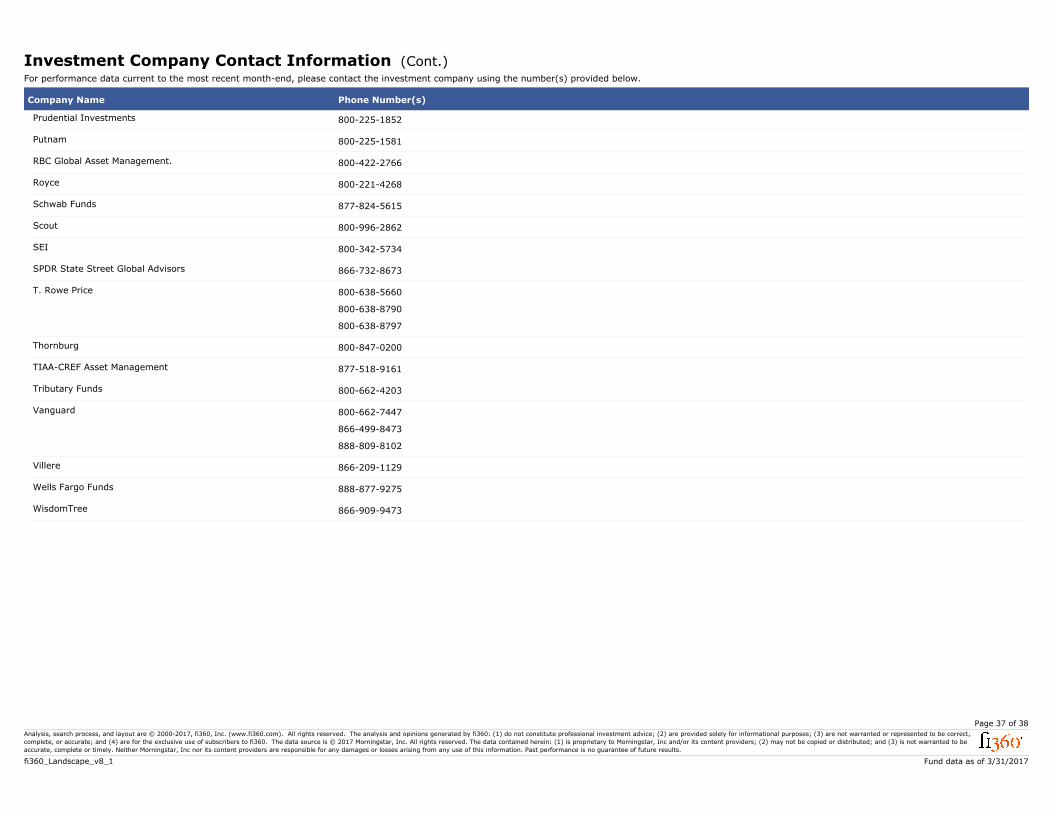
Investment Company Contact Information (Cont.)For performance data current to the most recent month-end, please contact the investment company using the number(s) provided below.
Phone Number(s)Company Name
Prudential Investments 800-225-1852
Putnam 800-225-1581
RBC Global Asset Management. 800-422-2766
Royce 800-221-4268
Schwab Funds 877-824-5615
Scout 800-996-2862
SEI 800-342-5734
SPDR State Street Global Advisors 866-732-8673
T. Rowe Price 800-638-5660
800-638-8790
800-638-8797
Thornburg 800-847-0200
TIAA-CREF Asset Management 877-518-9161
Tributary Funds 800-662-4203
Vanguard 800-662-7447
866-499-8473
888-809-8102
Villere 866-209-1129
Wells Fargo Funds 888-877-9275
WisdomTree 866-909-9473
Page 37 of 38
Fund data as of 3/31/2017
Analysis, search process, and layout are © 2000-2017, fi360, Inc. (www.fi360.com). All rights reserved. The analysis and opinions generated by fi360: (1) do not constitute professional investment advice; (2) are provided solely for informational purposes; (3) are not warranted or represented to be correct,
complete, or accurate; and (4) are for the exclusive use of subscribers to fi360. The data source is © 2017 Morningstar, Inc. All rights reserved. The data contained herein: (1) is proprietary to Morningstar, Inc and/or its content providers; (2) may not be copied or distributed; and (3) is not warranted to be
accurate, complete or timely. Neither Morningstar, Inc nor its content providers are responsible for any damages or losses arising from any use of this information. Past performance is no guarantee of future results.
fi360_Landscape_v8_1
Index Family Disclosure
BofA Merrill LynchMerrill Lynch, Pierce, Fenner & Smith Incorporated and its affiliates ("BofAML") indices and related information, the name "Bank of America Merrill Lynch", and related
trademarks, are intellectual property licensed from BofAML, and may not be copied, used, or distributed without BofAML's prior written approval. The licensee's products have
not been passed on as to their legality or suitability, and are not regulated, issued, endorsed, sold, or promoted by BofAML. BOFAML MAKE NO WARRANTIES AND BEAR NO
LIABILITY WITH RESPECT TO THE INDICES, INDEX DATA, ANY RELATED DATA, ITS TRADEMARKS, OR THE PRODUCT(S) (INCLUDING WITHOUT LIMITATION, THEIR QUALITY,
ACCURACY, SUITABILITY AND/OR COMPLETENESS).
MSCICopyright (c) 2017 MSCI. All Rights Reserved. Without prior written permission of MSCI, this information and any other MSCI intellectual property may only be used for your
internal use, may not be reproduced or redisseminated in any form and may not be used to create any financial instruments or products or any indices. This information is
provided on an as is basis, and the user of this information assumes the entire risk of any use made of this information. Neither MSCI nor any third party involved in or
related to the computing or compiling of the data makes any express or implied warranties, representations or guarantees concerning the MSCI index-related data, and in
no event will MSCI or any third party have any liability for any direct, indirect, special, punitive, consequential or any other damages (including lost profits) relating to any use
of this information.
RussellRussell Investment Group is the source and owner of the trademarks, service marks and copyrights related to the Russell Indexes. Russell« is a trademark of Russell
Investment Group.
Page 38 of 38
Fund data as of 3/31/2017
Analysis, search process, and layout are © 2000-2017, fi360, Inc. (www.fi360.com). All rights reserved. The analysis and opinions generated by fi360: (1) do not constitute professional investment advice; (2) are provided solely for informational purposes; (3) are not warranted or represented to be correct,
complete, or accurate; and (4) are for the exclusive use of subscribers to fi360. The data source is © 2017 Morningstar, Inc. All rights reserved. The data contained herein: (1) is proprietary to Morningstar, Inc and/or its content providers; (2) may not be copied or distributed; and (3) is not warranted to be
accurate, complete or timely. Neither Morningstar, Inc nor its content providers are responsible for any damages or losses arising from any use of this information. Past performance is no guarantee of future results.
fi360_Landscape_v8_1