list of topics in lecture 1 ioe 466 statistical quality …. shi, the university of michigan,...
TRANSCRIPT

1J. Shi, the University of Michigan, [email protected], 734-763-5321(O)
Statistical Quality ControlIOE 466
Statistical Quality Control(MW 12:00 – 1:30pm, Chrysler Center media classroom #165)
Instructor: Prof. Jianjun Shi1784 IOE
Department of Industrial and Operations EngineeringThe University of Michigan
[email protected], 734-763-5321(O), 734-764-3451(Fax)
2J. Shi, the University of Michigan, [email protected], 734-763-5321(O)
List of Topics in Lecture 1
• What are the course grading rules?• What do you expect to learn from this course?• Introduction of SPC
– Why is quality control important?– Introduce quality engineering terminology– Evolution of SPC methods
• What are the statistical methods for quality improvement?• Examples: How to use SPC in real applications?
3J. Shi, the University of Michigan, [email protected], 734-763-5321(O)
Background Overview• INSTRUCTORS
- Background- Availability
• GSIs- Justin Wayne Kile <[email protected] Yu-Li Huang <[email protected]>
• CPD Student Support- Hongbin Jia <[email protected]>
• TEXT- Author- Prerequisites- Other References- Coursepack
• COURSE- Attendance Policy- Computers
4J. Shi, the University of Michigan, [email protected], 734-763-5321(O)
Introduce Yourself to Others(2 minutes)
• Name• Department• Undergraduate or graduate students?• Other Background and more?

5J. Shi, the University of Michigan, [email protected], 734-763-5321(O)
Prerequisites: Review Questions
• Do you know what is Normal distribution?• Do you know the difference between mean and median?• Do you know how to calculate the variance of a sample?• Do you know the meaning of p-value in hypothesis
testing?• If X follows normal distribution with mean 2 and
standard deviation 3, do you know how to use table to get the probability of X<0?
• Do you know what is type I and type II errors in hypothesis testing?
• Do you know what is partial derivative?• Can you calculate the integral and derivative of x2?• Do you know how to calculate the inverse of a 2-by-2
matrix and the product of any two matrices by hand?
How many “Yes” do you get?
6J. Shi, the University of Michigan, [email protected], 734-763-5321(O)
More Questions
• Are you familiar with hypogeometric distribution, Binomial distribution and Poisson distribution?
• Do you know how to estimate and test the difference in variances of two normal distribution?
• Are you familiar with OC-curves?• Do you know when should use S chart and when use R
chart to monitor process variability?• Do you know what’s the advantage of CUSUM and EWMA
chart to Shewhart control chart?• Do you know PCR and PCRk?• Do you know p-chart?
7J. Shi, the University of Michigan, [email protected], 734-763-5321(O)
Grading Policy
• Homework 30% • Exam 1 35%• Exam 2 35%
- Homework should be handed in during class on the due date;- No late homework is acceptable;
8J. Shi, the University of Michigan, [email protected], 734-763-5321(O)
IOE 466Statistical Quality Control
• Fundamentals of Engineering Statistics• Statistical Methods in Quality Improvements• Statistical Process Control• Introduction to Advanced Quality Control
Topics

9J. Shi, the University of Michigan, [email protected], 734-763-5321(O)
Objectives
• Introduce statistical tools and concepts that are useful for product/process quality improvements
• Demonstrate the procedures of implementation of the quality engineering tools in various applications
• This is NOT a course on mathematical statistics
10J. Shi, the University of Michigan, [email protected], 734-763-5321(O)
PRODUCTIONPROCESS
• Leave Alone• Adjust• Stop
• Accept• Rework• Scrap
Analysis ofVariations
(Samples)
"Feedback" "Feedforward"
OURSE VERVIEWC O
"Charting" "Process Capability Analysis"
Measurement
11J. Shi, the University of Michigan, [email protected], 734-763-5321(O)
Contents
• Statistical Methods: Modeling & Inferences Ch.2 - Ch3• Statistical Process Control:
– Philosophy Ch.4– Control Charts Ch.5,Ch.6 & Ch8
• Process Capability Analysis Ch.7• Advanced Topics Ch 9, 10, 11
– SPC for Short Run – Multivariate Quality Control– SPC with Correlated Data– Frontier of the Current Research Ideas
• Acceptance Sampling Ch14
12J. Shi, the University of Michigan, [email protected], 734-763-5321(O)
WHY IS QUALITY IMPORTANT? --- Quality, Productivity and Cost
1. Consumer awareness and quality / performance sensitive.
2. Product liability laws.3. Costs of labor, energy, and materials.4. Competition is doing it.5. Quality, Productivity and Cost are
complementary !

13J. Shi, the University of Michigan, [email protected], 734-763-5321(O)
Quality Engineering Terminology— “Quality” Definitions
• Quality means fitness for use• Quality is evaluated by the variability,
which is inversely proportional to the variability
• Quality improvement is the reduction of variability in processes and products
14J. Shi, the University of Michigan, [email protected], 734-763-5321(O)
How to describe a product not meet “Quality” requirements?
• Nonconformity—A departure of a quality characteristic from its intended level or state that occurs with a severity sufficient to cause an associated product or service not to meet a specificationrequirement.
• Nonconforming unit—A unit of product or service containing at least one nonconformity .
• Defect—A departure of a quality characteristic from its intended level or state that occurs with a severity sufficient to cause an associated product or service not to satisfy intended normal, or reasonably foreseeable usage requirements.
• Defective (Defective Unit)—A unit of product or service containing at least one defect, or having several imperfections that in combination cause the unit not to satisfy intended normal, or reasonably foreseeable, usage requirements.
15J. Shi, the University of Michigan, [email protected], 734-763-5321(O)
TWO COMPONENTS OF QUALITY
Manufacturing Industries Service Industries
Product features
Performance AccuracyReliability TimelinessDurability CompletenessEase of use Friendliness and courtesyServiceability Anticipating customer needsAesthetics Knowledge of serverAvailability of options Esthetics
and expandability ReputationReputation
Freedom from deficiencies
Product free of defects Service free of errorsand errors at delivery, during original and futureduring use, and during service transactionsservicing Sales, billing, and other
business processes freeof errors
16J. Shi, the University of Michigan, [email protected], 734-763-5321(O)
Quality Engineering and Process Characteristics
• Quality Engineering:– A set of operational, managerial and engineering activity to ensure the
quality characteristics at a nominal level • Attributes/Variables depend on the measurements of the
quality characteristics– attributes: discrete data
• to judge each product as either conforming or non-conforming, or to count the number of nonconformities appearing on a unit of product
– variables:continuous measurement of quality characteristics
• Specifications: desired measurements for the quality characteristics
– upper/lower specification limits (USL/LSL)

17J. Shi, the University of Michigan, [email protected], 734-763-5321(O)
WHO’s Responsible for Quality?
1. Product planning, marketing, and sales. 2. Development engineering.3. Manufacturing engineering. 4. Purchasing. 5. Manufacturing management.6. Manufacturing employees.7. Inspection and test. 8. Packaging and shipping. 9. Customer service.
18J. Shi, the University of Michigan, [email protected], 734-763-5321(O)
It’s NOT My Job!!!
• This is a story about four people named EVERYBODY, SOMEBODY, ANYBODY, and NOBODY.
• There was an important job to be done, and EVERYBODY was sure that SOMEBODY would do it. ANYBODY could have done it but NOBODY did it. SOMEBODY got angry because it was EVERYBODY'S job. EVERYBODY thought ANYBODY could do it, but NOBODY realized that EVERYBODY wouldn’t do it. It ended up that EVERYBODY blamed SOMEBODY when NOBODY did what ANYBODY could have done.
19J. Shi, the University of Michigan, [email protected], 734-763-5321(O)
What are the statistical methods for quality improvement?
20J. Shi, the University of Michigan, [email protected], 734-763-5321(O)
A Shewhart Control Chart
201000-3
-2
-1
0
1
2
3
Time
LCL
Average
UCL
mm
Dr. Shewhart first proposed usage of control chart in 1924, which is the start of “statistical process control”

21J. Shi, the University of Michigan, [email protected], 734-763-5321(O)
Statistical Quality Control Methods
• Three major quality control methods are – SPC, – DOE (design of experiments), and – acceptance sampling.
• This course will cover two of them: SPC and acceptance sampling. DOE is covered in IOE 465.
• A simple example to illustrate the three methods: A typing example.
22J. Shi, the University of Michigan, [email protected], 734-763-5321(O)
Typing Example
• Consider improvement of typing quality, which is measured by typing accuracy and clearness.
• Acceptance sampling—several sample pages are inspected from every “lot” (for example, every 100 typed pages). If the selected sample pages have satisfactory quality, the whole “lot” is accepted. Otherwise, the whole lot is rejected and rework should be done.
• Statistical process control (SPC)—Every hour one page is selected and its quality is measured. Plot the measurements from each hour on a control chart. If a shift of quality is detected, the root cause of this shift (such as typist tiredness, lack of ink) is identified and fixed.
• Design of experiment (DOE)—Conduct experiments with combinations of different typists, typewriters, papers, working schedules. The best combination of these factors are selected toachieve optimal typing quality.
23J. Shi, the University of Michigan, [email protected], 734-763-5321(O)
AcceptanceSampling
Perc
ent o
f App
licat
ion
Time
DesignedExperiments
ProcessControl
0
100
Phases in Quality Engineering Methods
24J. Shi, the University of Michigan, [email protected], 734-763-5321(O)
Variation Reduction Approaches

25J. Shi, the University of Michigan, [email protected], 734-763-5321(O)
Statistical Process Control Procedures
Process
DecisionFormulate action Data analysis
EvaluationFaulty discovery
Diagnosis
Take actionImplementation
Data collectionObservation
26J. Shi, the University of Michigan, [email protected], 734-763-5321(O)
Quality Improvement Example
Problem: Cowl side reinforcement panel I/O variation
2L (y=2.91) 5L (y=3.16)
SPC ExampleSPC Example
27J. Shi, the University of Michigan, [email protected], 734-763-5321(O)
Data Analysis: spikes with a cycle of 26
Process knowledge: welding robot changing tip dressing after 26 welding
Quality Improvement Example
200
180
160
140
120
10080604020
00.0
0.5
1.0
1.5
2.0
2.5
3.0
3.5
4.004/10/92 Sample of 160
AFTER CORRECTION
BEFORE CORRECTION
Time
Y
[mm
]
SPC Example (Cont’d)SPC Example (Cont’d)
28J. Shi, the University of Michigan, [email protected], 734-763-5321(O)
Root causes and action:
Welding robot #3 after tip dressing, after 26 panels, skip two welding spots
Welding spots
Missed welding spots
Cowlside Reinforcement panel
Evaluations
Sensors6 SIGMA 6 SIGMA
BEFORE AFTER
2 L_Y 2.91 2.02 3.16 1.44
1.0 1.4 2.0 0.9
2 L_Z5 L_Y5 L_Z
Quality Improvement Example
SPC Example (Cont’d)SPC Example (Cont’d)

29J. Shi, the University of Michigan, [email protected], 734-763-5321(O)
Total Quality Management (TQM)
• Statistical techniques must be implemented within a management system that is quality driven.
• One of the managerial frameworks used is total quality management.• TQM is a strategy for implementing and managing quality improvement
activities on an organization-wide basis.• TQM emphasizes on continuous improvements.
30J. Shi, the University of Michigan, [email protected], 734-763-5321(O)
Total Quality Person
Companies today are turning to total quality management to improve their capabilities. To adapt to TQM, management styles have had to change to new form of employee-employer relationships. But what about the individuals involved in this transformation? Are they TQM people?
31J. Shi, the University of Michigan, [email protected], 734-763-5321(O)
Personal Leadership
1. I take on responsibility for my actions and don’t rely on others to plan my future.
Rarely Sometimes Always
1 2 3 4 5 6 7 8 9 10
2. I enjoy the people and things in my environment.
Rarely Sometimes Always
1 2 3 4 5 6 7 8 9 10
32J. Shi, the University of Michigan, [email protected], 734-763-5321(O)
Planning
3. Every day I take time to plan my daily activities around that which is important to me.
Rarely Sometimes Always
1 2 3 4 5 6 7 8 9 10
4. I have a good sense of how personal values, strengths, and weaknesses align with what I am doing.
Rarely Sometimes Always
1 2 3 4 5 6 7 8 9 10

33J. Shi, the University of Michigan, [email protected], 734-763-5321(O)
Improvement
5. I constantly strive to measure whether I am meeting my personal goals.
Rarely Sometimes Always
1 2 3 4 5 6 7 8 9 10
6. I celebrate my successes and improvements.
Rarely Sometimes Always
1 2 3 4 5 6 7 8 9 10
34J. Shi, the University of Michigan, [email protected], 734-763-5321(O)
Interpret Your Score12-17: Grade F. You might want to adopt some of these individual total quality strategies to get your life back on track.
18-25: Grade D. You might want to analyze your daily living patterns and goals in life. You do not demonstrate and individual total quality philosophy.
26-31: Grade C. You demonstrate some patterns of a total quality person but need to more consistent on daily basis.
32-45: Grade B. You have a good individual foundation in total quality principles and could serve as a role model for others.
46-60: Grade A. You are a great total quality role model, with a solid set of principles in leadership, planning, and continuous improvement.
35J. Shi, the University of Michigan, [email protected], 734-763-5321(O)
Six-Sigma Program
• First developed by Motorola in the late 1980s.• To reduce the process variability so that the
specification limits are six standard deviations from the mean. Then there will only be about 2 parts per billion defective.
• Four phases of six sigma project: Measure Analyze Improve Control
• SPC is a major tool of Six-Sigma• An introduction to six-sigma is posted on course
web site.
36J. Shi, the University of Michigan, [email protected], 734-763-5321(O)
Chapter 2: Probability Review- Fundamentals of Engineering Statistics
• Describing Variation– Frequency Distribution &
Histogram– Numerical Summary of Data– Probability Distribution
• Important Distributions• Some Useful Approximations

37J. Shi, the University of Michigan, [email protected], 734-763-5321(O)
Need for Statistics
• Some variation is inevitable in manufacturing processes.
• Variation reduction is one of the major objectives in quality control
• Variation needs to be described, modeled, and analyzed
How to do it?
38J. Shi, the University of Michigan, [email protected], 734-763-5321(O)
Describing VariationDescribing VariationMethod 1: Frequency Distribution & Histogram
39J. Shi, the University of Michigan, [email protected], 734-763-5321(O)
An Example:Forged Piston Rings for Engines (Text Book P43-46)
• Variable Data (Table 2-2, P44): – the inside diameter of forged piston rings(mm)– 125 observations, 25 samples of 5 observations each.
40J. Shi, the University of Michigan, [email protected], 734-763-5321(O)
Frequency Table & Frequency Histogram
• To construct a frequency table1. Find the range of the data
– start the lower limit for the first bin just slightly below the smallest data value
– b0<min(x), bm=max(x), (m: # of bins)
2. Divide this range into a suitable number of equal intervals– m=4 ~ 20, or (N is the total number of observations)
3. Count the frequency of each interval– if bi-1< x ≤ bi,
N

41J. Shi, the University of Michigan, [email protected], 734-763-5321(O)
Frequency Distribution for Piston-Ring Diameter Table 2-3 (P45)
• Data range b0=73.965, bN=74.030– Min[x(i,j)]=73.967(i=14, j=2); max[x(i,j)]=74.030 i=1, j=1
• # of Bin m=13, Interval=(74.030-73.965)/13=0.005
• count for each bin: bi-1< x ≤ bi,
42J. Shi, the University of Michigan, [email protected], 734-763-5321(O)
Fig. 2-4 (P44)Histogram for Piston-ring Diameter Data
- A graphical display of the frequency table
43J. Shi, the University of Michigan, [email protected], 734-763-5321(O)
Interpretation based on the Frequency Histogram
Visual Display of Three Properties of Sample Data• Shape:
– roughly symmetric and unimodal• The center tendency or location
– the points tend to cluster near 74mm.• Scatter or spread range
– variability is relatively high (min=73.967; max=74.030)
44J. Shi, the University of Michigan, [email protected], 734-763-5321(O)
Describing VariationDescribing VariationMethod 2: Numerical Summary of Data
• Center Tendency: sample average
• Scatter: sample variance or sample standard deviation
• Shape: skewness and kurtosis– skewness: measure the lack of symmetry of the distribution
symmetry; mean>median; mean<median– kurtosis: indicates the heaviness of the tails of the data distribution
larger has a heavier tail
n
)xx(M;
MMˆ;
)M(Mˆ
n
1i
ji
j22
422/3
2
31
∑=
−==β=β
n
xx
n
ii∑
== 1
;1
)(ˆ 1
2
22
−
−==σ
∑=
n
xxS
n
ii
0ˆ1 =β 0ˆ
1 <β0ˆ1 >β
2β

45J. Shi, the University of Michigan, [email protected], 734-763-5321(O)
Describing VariationDescribing VariationMethod 3: Probability Distribution
• A Probability distribution is a mathematical model that relates the value of the variable with the probability of occurrence of thatvalue in the population.
• Two types of distributions: – Continuous: if the variable being measured is expressed on a
continuous scale– discrete :if the parameter being measured can only take on
certain values, e.g.. 1,2,3,4,..
p(xi)
p(x1)p(x2)
p(x5)p(x4)
p(x6)
p(x3)
p(x7)
x1 x2 x5x4 x6x3 x7x
f(x)
a bx
∫+∞
∞−
= 1dx)x(f ∑∞
=
=1i
i 1)x(p
46J. Shi, the University of Michigan, [email protected], 734-763-5321(O)
Theoretical & Sampling Distribution
• If we consider each interval as one unit, then each rectangle in the histogram will have an area equal to its relative frequency. The total area of the rectangles will be unity
• If we could increase samples and make the intervals much smallerand still maintain enough data for each interval. When the intervals become narrower, the histogram will appear smoother.
• Extending this concept to the extreme case where the histogram becomes a smooth curve. This smooth curve is called a “theoretical probability distribution” or “theoretical distribution”.
Increase samples
Smoother
∫+∞
∞−
= 1dx)x(f
47J. Shi, the University of Michigan, [email protected], 734-763-5321(O)
Review of Probability Distribution Calculation
Continuous Distribution Discrete Distribution
Probability ∫=≤≤b
a
dx)x(f)bxa{P )x(p)x(P ii =
Distribution mean ∫
+∞
∞−
=µ dxxxf )( ∑
∞
=
=µ1
)(i
ii xpx
Distribution variance ∫
+∞
∞−
µ−=σ= dxxfxxV )()()( 22 ∑∞
=
µ−=σ=1
22 )()()(i
ii xpxxV
Sample mean
Sample variance
n
xx
n
1ii∑
==
1n
)xx(Sˆ
n
1i
2i
22
−
−==
∑=σ
48J. Shi, the University of Michigan, [email protected], 734-763-5321(O)
Important Distributions
1. Discrete Probability Distribution• Hypergeometric distribution • Binomial distribution• Poisson Distribution
2. Continuous Probability Distribution • Normal distribution • Chi-Square distribution• Student t distribution

49J. Shi, the University of Michigan, [email protected], 734-763-5321(O)
Hypergeometric Distribution• Suppose that there is a FINITE population consisting of N items. Some
number , say D (D≤N), of these items fall into a class of interest. A random sample of n items is selected from the population without replacement, and the number of items in the sample that fall into the class of interest, say x, is observed. Then x is a Hypergeometric random variable with the probability distribution:
• Used as a model when selecting a random sample of n items without replacement from a lot of N items of which D are noncomforming or defective
• Excel function: HYPGEOMDIST(x,n,D,N)
⎟⎠⎞
⎜⎝⎛
−−
⎟⎠⎞
⎜⎝⎛ −=σ
1NnN
ND1
NnD2
⎟⎟⎠
⎞⎜⎜⎝
⎛
⎟⎟⎠
⎞⎜⎜⎝
⎛−−
⎟⎟⎠
⎞⎜⎜⎝
⎛
=
nN
xnDN
xD
)x(p x=0, 1,…,min(n,D)
NnD
=µ
)!(!!
baba
ba
−=⎟⎟
⎠
⎞⎜⎜⎝
⎛
50J. Shi, the University of Michigan, [email protected], 734-763-5321(O)
Example 1: Special-purpose circuit boards are produced in lots of size N = 20. The boards are accepted in a sample of n =3 if all are conforming. The entire sample is drawn from the lotat one time and tested. If the lot contains D=3 nonconforming boards, what is the probability of acceptance?
51J. Shi, the University of Michigan, [email protected], 734-763-5321(O)
Example 2: (Textbook Problem 2-28) A lot of size N = 30 contains five nonconforming units. What is the probability that a sample of five units selected at random contains exactly one nonconforming units? What is the probability that it contains one or more nonconformances?
52J. Shi, the University of Michigan, [email protected], 734-763-5321(O)
Binomial Distribution
p(x) = ⎝⎜⎛
⎠⎟⎞n
x px (1 – p)n – x x = 0,1,2,...,n 0 ≤p≤ 1
E(x) = np V(x) = np(1 – p) [Note: V(x) < E(x)]
Bernoulli trials: A sequence of n independent trials, where the outcome of each trial is either a “success” or a “failure”
Binomial Distribution: If the probability of a success on any trial is a constant, p, the number of "success" x in n Bernoulli trials has the Binomial distribution
Assumption: (1) Constant probability of success p; (2) Two mutually exclusive outcomes; (3) All trials statistically independent; (4) Number of trials n is known and constantApplication: used as a model when sampling from an infinitely large population. The constant p represents the fraction of defective or nonconforming items in the population
Excel Function: BINOMDIST(x,n,p,false) (True:accumulative probability)
53J. Shi, the University of Michigan, [email protected], 734-763-5321(O)
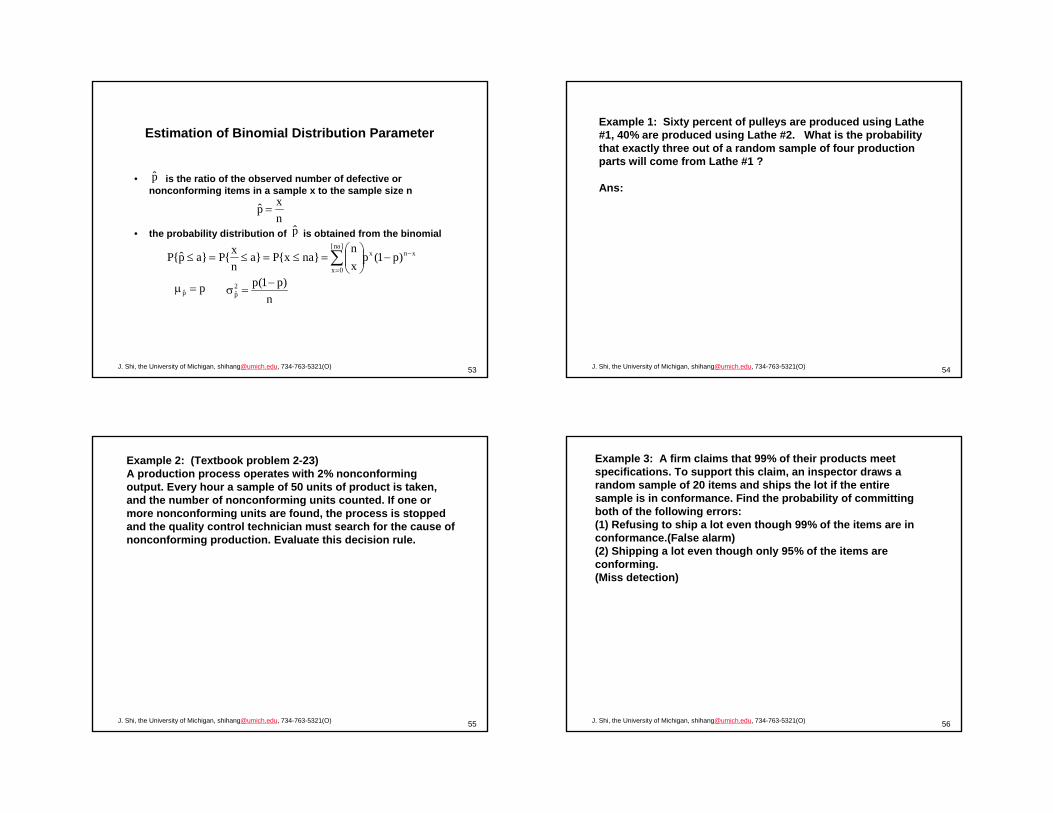
• is the ratio of the observed number of defective or nonconforming items in a sample x to the sample size n
• the probability distribution of is obtained from the binomial
Estimation of Binomial Distribution Parameter
nxp =
p
xnx]na[
0x)p1(p
xn
}nax{P}anx{P}ap{P −
=
−⎟⎟⎠
⎞⎜⎜⎝
⎛=≤=≤=≤ ∑
p
n)p1(p2
p−
=σpp =µ
54J. Shi, the University of Michigan, [email protected], 734-763-5321(O)
Example 1: Sixty percent of pulleys are produced using Lathe #1, 40% are produced using Lathe #2. What is the probability that exactly three out of a random sample of four production parts will come from Lathe #1 ?
Ans:
55J. Shi, the University of Michigan, [email protected], 734-763-5321(O)
Example 2: (Textbook problem 2-23)A production process operates with 2% nonconforming output. Every hour a sample of 50 units of product is taken, and the number of nonconforming units counted. If one or more nonconforming units are found, the process is stopped and the quality control technician must search for the cause of nonconforming production. Evaluate this decision rule.
56J. Shi, the University of Michigan, [email protected], 734-763-5321(O)
Example 3: A firm claims that 99% of their products meet specifications. To support this claim, an inspector draws a random sample of 20 items and ships the lot if the entire sample is in conformance. Find the probability of committing both of the following errors: (1) Refusing to ship a lot even though 99% of the items are in conformance.(False alarm) (2) Shipping a lot even though only 95% of the items are conforming.(Miss detection)

57J. Shi, the University of Michigan, [email protected], 734-763-5321(O)
Example 4: (Textbook problem 2-25) A random sample of 100 units is drawn from a production process every half hour. The fraction ofnonconforming product manufactured is 0.03. What is the probability that if the fraction nonconforming really is 0.03?04.0p ≤=
58J. Shi, the University of Michigan, [email protected], 734-763-5321(O)
Poisson Distribution
The number of random events occurring during a specified time period:
p(x) = e–λλx
x! x = 0, 1, 2,. . .
E(x) = λ V(x) = λ β1 = 1
λ β2 = 3 + 1
λ
Uses:a. number of "defects" per unitb. number of "defects" per unit of areac. number of random occurrences per unit of timed. approximate the binomial distribution with λ= np when np Š 5 and p Š .1 or �
.9
Assumptions: 1. The average occurrence rate (λ) is known and constant.2. Occurences are equally likely to occur during any time interval.3. Occurences are statistically independent.
λ=β
11
Excel Function: POISSON(x,λ, false) (True:accumulative probability)
PoissonBinomialthenttanconsnp,0p;nif
→=→∞→
59J. Shi, the University of Michigan, [email protected], 734-763-5321(O)
Example 1: Arrivals of parts at a repair station are Poisson distributed, with a mean rate of 1.2 per day. What is the probability of no repairs in the next day?
60J. Shi, the University of Michigan, [email protected], 734-763-5321(O)
Example 2: What is the probability that today the number of parts requiring repair will exceed the average by more than one standard deviation?

61J. Shi, the University of Michigan, [email protected], 734-763-5321(O)
Example 3: Glass bottles are formed by pouring molten glass into a mold. The molten glass is prepared in a furnace lined with firebrick. As the firebrick wears, small pieces of brick are mixed into the molten glass and finally appear as defects (called "stones") in the bottle. If we can assume that stones occur randomly at the rate of 0.00001 per bottle, what is the probability that a bottle selected at random will contain at least one such defect?
62J. Shi, the University of Michigan, [email protected], 734-763-5321(O)
Example 4: The billing department of a major credit card company attempts to control errors (clerical, keypunch, etc.) on customers' bills. Suppose that errors occur according to a Poisson distribution with parameter λ = 0.01. What is the probability that a customer's bill selected at random will contain one error?
63J. Shi, the University of Michigan, [email protected], 734-763-5321(O)
Normal Distributionf(x) =
1
2πσ2 e–(x–µ)2/2σ2
– ∞ ≤ x ≤ ∞
E(x) = µ V(x) = σ2
β1 = 0 β2 = 3
f(x)
xµ
σ2
Pr(µ−σ≤x≤µ+σ)=68.26%Pr(µ−2σ≤x≤µ+2σ)=95.46%Pr(µ−3σ≤x≤µ+3σ)=99.73%)(}zPr{}axPr{
σµ−
Φ=σ
µ−≤=≤
aa
)1,0(N~z;),(N~x 2σµ
If x1, x2 are independently normally distributed variables, then y=x1+x2also follows the normal distribution, i.e. y~N(µ1+µ2,σ1
2+ σ22)
The Center Limit Theorem: if x1, x2, …, xn are independent random variables, with mean µi and variance σi
2, and if y=x1+x2+…+xn, then the distribution approaches the N(0,1) distribution as n approaches infinite.
Excel Function: NORMDIST(x,µ,σ,true)
∑∑==
σµ−n
1i
2i
n
1ii /)y(
64J. Shi, the University of Michigan, [email protected], 734-763-5321(O)
Example 1: The tensile strength of a metal part is normally distributed with mean 40 LB. and standard deviation 8 LB. If 50,000 parts are produced, approximately how many would fail to meet a minimum specification limit of 34-LB tensile strength? Approximately how many would have a tensile strength in excess of 48 LB?

65J. Shi, the University of Michigan, [email protected], 734-763-5321(O)
Example 2: Three shafts are made and assembled in a linkage. The length of each shaft, in centimeters, is distributed as follows:
Shaft 1: N ~ (75, 0.09) Shaft 2: N ~ (60, 0.16) Shaft 3: N ~ (25, 0.25)
(a) What is the distribution of the linkage? (b) What is the probability that the linkage will be longer than 160.5 cm?
66J. Shi, the University of Michigan, [email protected], 734-763-5321(O)
Example 3: A quality characteristic of a product is normally distributed with mean µ and standard deviation one. Specifications on the characteristic are 6 < x < 8. A unit that falls within specifications on this quality characteristic results in a profit of C0. However, if x < 6, the profit is –C1, while if x > 8, the profit is –C2. Find the value of µ that maximizes the expected profit.
67J. Shi, the University of Michigan, [email protected], 734-763-5321(O)
Chi–Squared Distribution (with degrees of freedom ν)
E(x) = ν V(x) = 2ν β1=8/ν, β2=3+12//ν,
• The Chi-squared Distribution is associated with squared normalrandom variables.
• The most popular use of this distribution is for testing hypothesesabout variances of samples from normal distributions.
2/y1)2/n(2/n
2
ey)2/n(2
1)y(f −−
Γ= Γ(
ν2 ) = (
ν2 – 1) (
ν2 – 2)... 3 • 2 • 1 for ν even
= (ν2 – 1) (
ν2 – 2)...
52 •
32 •
π2 for ν odd
y>0
2n
22
21 xxxy +++=
Y follows If x1, x2, …, xn are normally and independently distributed random variables
21n−χ
68J. Shi, the University of Michigan, [email protected], 734-763-5321(O)
Student t Distribution (with degrees of freedom ν)
f(x ) = 1π ν
Γ ⎣⎢
⎡⎦⎥⎤ν + 1
2
Γ ⎣⎢⎡
⎦⎥⎤ν
2
⎝⎜⎛
⎠⎟⎞
1 + x 2
ν
– (ν + 1 )2
E (x ) = 0 V (x ) = ν
ν – 2 β 1 = 0
β 2 = 3 + 6
n – 4 fo r n > 4
N o te : A s n → ∞ th e d is tr ib u tio n o f x (d is tr ib u ted a s a S tu d en t tran d o m v a riab le ) ap p ro ach e s th a t o f a s tan d a rd n o rm a l ran d o mv aria b le .
Γ (ν2 ) = (
ν2 – 1 ) (
ν2 – 2 )... 3 • 2 • 1 fo r ν e v en
= (ν2 – 1 ) (ν
2 – 2 )... 52 •
32 • π
2 fo r ν o d d
Application: If x and y are independent standard normal and chi-square random variable respectively, then is distributed as t with k degrees of freedom. k/y
xt =

69J. Shi, the University of Michigan, [email protected], 734-763-5321(O)
INTERRELATIONSHIPS BETWEEN DISTRIBUTIONSHypergeometric, Binomial, Poisson, Normal
N: population sizen:sample size
Sampling without replacementin finite population
The sum of a sequence of n Bernoulli trials in infinite population with probability of success p
Number of defects per unit
p=D/N, n
λ=np constant
Poissonif λ ≥15
µ= λ, σ2= λ
If np>10 and p ≥0.5µ=np, σ2=np(1-p)
⎟⎟⎠
⎞⎜⎜⎝
⎛
−−−
Φ−⎟⎟⎠
⎞⎜⎜⎝
⎛
−−+
Φ≈=)1(
5.0)1(
5.0)Pr(pnpnpa
pnpnpaax
⎟⎟⎠
⎞⎜⎜⎝
⎛
−−−
Φ−⎟⎟⎠
⎞⎜⎜⎝
⎛
−−+
Φ≈≤≤)1(
5.0)1(
5.0)Pr(pnpnpa
pnpnpbbxa
⎟⎟⎠
⎞⎜⎜⎝
⎛
−−µ
Φ−⎟⎟⎠
⎞⎜⎜⎝
⎛
−−ν
Φ≈ν≤≤µnpp
pnpp
pp/)1(/)1(
)ˆPr(
Normal
Binomialif larger n, smaller p <0.1
Hypergeometricfinite population
if n/N≤0.1
70J. Shi, the University of Michigan, [email protected], 734-763-5321(O)
Example 1: (Textbook Problem 2-27) An electronic component for a laser range-finder is produced in lots of size N = 25. An acceptance testing procedure is used by the purchaser to protect against lots that contain too many nonconforming components. The procedure consists of selecting five components at random from the lot (without replacement) and testing them. If none of the components is nonconforming, the lot is accepted.
a. If the lot contains three nonconforming components, what is the probability of lot acceptance?
b. Calculate the desired probability in (a) using the binomial approximation. Is this approximation satisfactory'? Why or why not?
c. Suppose the lot size was N=150. Would the binomial approximation be satisfactory in this case?
d. Suppose that the purchaser will reject the lot with the decision rule of finding one or more nonconforming components in a sample of size n, and wants the lot to be rejected with probability at least O.95 if the lot contains five or more nonconforming components. How large should the sample size n be?
71J. Shi, the University of Michigan, [email protected], 734-763-5321(O)
Example 2: A textbook has 500 pages on which typographical errors could occur. Suppose that there are exactly 10 such errors randomly located on those pages. Find the probability that a random selection of 50 pages will contain no errors. Find the probability that 50randomly selected pages will contain at least two errors.
72J. Shi, the University of Michigan, [email protected], 734-763-5321(O)
Example 3: A sample of 100 units is selected from a production process that is 2% nonconforming. What is the probability that will exceed the true fraction nonconforming by k standard deviations, where k = 1, 2, and 3?
p

73J. Shi, the University of Michigan, [email protected], 734-763-5321(O)
Interrelations Normal, Chi-Squared, Student t, F
1. N(0,1)
χ2(ν)/ν = t(ν)
2. χ2(ν) / ν = F(ν,∞)
3. F(α,ν1,ν2) = 1F(1-α,ν2,ν1)
4. χ2(α,ν) = ν F(α,ν,∞)
5. t(α/2, ν) = F(α,1,ν) 1/2
6. t(∞) = N(0,1)
74J. Shi, the University of Michigan, [email protected], 734-763-5321(O)
Chapter 3 Inference About Process Quality- Statistics Review
• Motivation• Estimation
– point estimation– interval estimation
• Hypothesis Testing– Definition– Testing on means
• known and Unknown variance
– Testing on Variance
75J. Shi, the University of Michigan, [email protected], 734-763-5321(O)
The need of “Statistical Inference”
• The parameters of a probability distribution are unknown.– Estimation of Process Parameters
• The parameters of a process can be time varying, how do we identify a process change?– Hypothesis Testing
76J. Shi, the University of Michigan, [email protected], 734-763-5321(O)
Random Samples
• Random Sample: – Sampling from an infinite population or finite
population with replacement: A sample is selected so that the observations are independently and identically distributed.
– Sampling n samples from a finite population of N items without replacement if each of the possible samples has an equal probability of being chosen
⎟⎟⎠
⎞⎜⎜⎝
⎛nN

77J. Shi, the University of Michigan, [email protected], 734-763-5321(O)
Terminology Definition
• Estimate: a particular numerical value of an estimator, computed from sample data.
– Point estimator: a statistic that produces a single numerical value as the estimate of the unknown parameter
– Interval estimator: a random interval (or called confidence interval) in which the true value of the parameter falls with some level of probability.
• Statistic: – any function of the sample data that does not contain unknown
parameters.
• Sampling distribution: – The probability distribution of a statistic.
78J. Shi, the University of Michigan, [email protected], 734-763-5321(O)
METHODS FOR ESTIMATION1. METHOD OF MOMENTS (MOM):
Principle:if E{|x|r}<∝, then sample rth moment converges with probability 1 to the population rth moment when sample size is larger enough.
Analysis procedures:• If p.d.f has k unknown parameters, equating the first k
population moments to the first k sample moments.• Solve k parameters from these simultaneous equationsProperty:• Simple to generate but may not have desired
properties
79J. Shi, the University of Michigan, [email protected], 734-763-5321(O)
METHOD OF MOMENTS (MOM): Example
Example: f(x) = λ e –λx , x ≥ 0 , λ > 0
Population Mean (First Moment): E(x) = 1λ
Sample Mean: x−
Estimate: λ = 1
x−
Exponential:
Poisson: E(x)=λ, thus, x=λ
80J. Shi, the University of Michigan, [email protected], 734-763-5321(O)
METHODS FOR ESTIMATION2. Method of Maximum Likelihood Estimation(MLE)
a.) Given x1, x2, ..., xn from f(x) define
L = ∏i=1
nf(xi) or L* = ln(L)
b.) Maximize L or L* usually by setting dL*
d(parameter of interest) = 0 and
c.) Solve system of simultaneous equations.
Usually preferred to MOM since the MLE's are
1. Consistent2. Asymptotically Normal3. Asymptotically Efficient4. May not be unbiased.

81J. Shi, the University of Michigan, [email protected], 734-763-5321(O)
METHOD OF MLE: Example
Exponential: Suppose f(x) = λ e –λx , x ≥ 0 , λ > 0
L = ∏i
n λ e –λxi = λn e –λΣxi
L* = ln(L) = n ln λ – λ ΣxidLdλ
* =
nλ – Σxi = 0
Thus the estimate λ = 1
x− (same as MOM) .
82J. Shi, the University of Michigan, [email protected], 734-763-5321(O)
Assessment of Estimation
A. PROPERTIES
1. UNBIASED: An estimate θ∧
of parameter θ is unbiased if
E( θ∧
) = θ
2. CONSISTENT: An estimate θ∧
of parameter θ is consistent if
E( θ∧
– θ )2 → 0 as n → ∞
3. EFFICIENT: θ∧
1 is more efficient than θ∧
2 if
E( θ∧
1 – θ1 )2 < E( θ∧
2 – θ2 )2
it has a minimum variance
83J. Shi, the University of Michigan, [email protected], 734-763-5321(O)
METHODS FOR ESTIMATION3. Interval Estimation
• Estimate the interval between two statistics that include the true value of the parameter with some probability– Example: Pr{ L≤ µ ≤ U}=1-α– The interval L≤ µ ≤ U is called a 100(1- α)% confidence interval (C.I.)
for the unknown mean µ– two side C.I. (L is lower confidence limit, U is upper confidence limit)– single side C.I.:
• lower side L≤ µ , Pr{ L≤ µ }=1-α• upper side µ ≤ U, Pr{ µ ≤ U}=1-α
• Analysis procedures:– get the samples– compute the statistic– determine the statistic reference distribution– select confidence level– find the lower and/or upper confidence limits based on the reference
distribution
xµ UL
α/2α/2
84J. Shi, the University of Michigan, [email protected], 734-763-5321(O)
If x is a random variable with unknown mean µ and known variance σ2, what is estimation interval for mean µ?
– Select a statistic– The approximate distribution of is regardless of the
distribution of x per the central limit theorem.– Given confidence level α, then
• 100(1-α)% two-side confidence interval on µ is:
• 100(1-α)% upper confidence interval on µ is:
• 100(1-α)% lower confidence interval on µ is:
Interval Estimation
∑=
=n
ii nxx
1/)(
)/,( 2 nN σµ
nZx
nZx σ
+≤µ≤σ
− αα 2/2/ 2/}Pr{ 2/ α=≥ αZzwhere
nZx σ
+≤µ α
µ≤σ
− α nZx
x

85J. Shi, the University of Michigan, [email protected], 734-763-5321(O)
Example 1: The strength of a disposable plastic beverage container is being investigated. The strengths are normally distributed, with a known standard deviation of 15 psi. A sample of 20 plastic containers has a mean strength of 246 psi. Compute a 95% confidence interval for the process mean.
86J. Shi, the University of Michigan, [email protected], 734-763-5321(O)
Example 2: A chemical process converts lead to gold. However, the production varies due to the powers of the alchemist. It is known that the process is normally distributed, with a standard deviation of 2.5 g. How many samples must be taken to be 90% certain that an estimate of the mean process is within 1.5 g of the true but unknown mean yield?
87J. Shi, the University of Michigan, [email protected], 734-763-5321(O)
Interval Estimation of the Binomial Distribution Parameter with A Larger Sample
Size
• From the central limit theorem: p =x/n~ Normal (p, p(1-p) /n )
Example 1: (Textbook Problem 3-18) A random sample of 200printed circuit boards contains 18 defective or nonconforming units.Estimate the process fraction nonconforming. Construct a 90% two-sided confidence interval on the true fraction nonconforming in theproduction process.
88J. Shi, the University of Michigan, [email protected], 734-763-5321(O)
Hypothesis Testing
• Statistical hypothesis:– a statement about the values of the parameters of a
probability distribution• Hypothesis testing:
– Making a hypothesis concerning what we believe to be true and then use sampled data to test it.
• Two Hypotheses (Two Competing Propositions)– Null Hypothesis H0: will be rejected if the sample data do not
support it.– Alternative Hypothesis H1: a hypothesis different from the null
hypothesis

89J. Shi, the University of Michigan, [email protected], 734-763-5321(O)
Hypothesis Testing Procedures
1) State the null and alternative hypothesis, and define the test statistic.
2) Specify the significance level α.3) Find the distribution of the test statistic
and the rejection region of H0.4) Collect data and calculate the test
statistic.5) Compare the test statistic with the
rejection region.6) Assess the risk.
90J. Shi, the University of Michigan, [email protected], 734-763-5321(O)
TESTS FOR COMPARING ONE POPULATION MEAN WITH A
STANDARDA ssum ing K now n P opu lation V ariance
x− – µσ / n ~ N (0 ,1 )
R ejec t H 0: µ ≠ µ0 if ⎪⎪⎪⎪
⎪⎪⎪⎪x− – µ0
σ / n > Z (α /2 )
R ejec t H 0: µ < µ0 if x− – µ0σ / n < -Z (α )
R ejec t H 0: µ > µ0 if x− – µ0σ / n > Z (α )
nZx
nZx σ
+≤µ≤σ
− αα 2/2/
00 :H µ=µ H1
91J. Shi, the University of Michigan, [email protected], 734-763-5321(O)
Assuming Unknown Population Variance
x− – µs/ n ~ t(n-1)
Reject H0: µ ≠ µ0 if ⎪⎪⎪⎪
⎪⎪⎪⎪x− – µ0
s/ n > t(α/2, n-1)
Reject H0: µ < µ0 if x− – µ0s/ n <- t(α, n-1)
Reject H0: µ > µ0 if x− – µ0s/ n > t(α, n-1)
TESTS FOR COMPARING ONE POPULATION MEAN WITH A STANDARD
nstx
nstx 2/2/ αα +≤µ≤−
00 :H µ=µ H1
92J. Shi, the University of Michigan, [email protected], 734-763-5321(O)
Example 3: The mean time it takes a crew to restart an aluminum rolling mill after a failure is of interest. The crew was observed over 25 occasions, and the results were = 26.42 minutes andvariance S2 =12.28 minutes. If repair time is normally distributed, find a 95% confidence interval on the true but unknown mean repair time.
x

93J. Shi, the University of Michigan, [email protected], 734-763-5321(O)
Example 4: The life of a battery used in a cardiac pacemaker isassumed to be normally distributed. A random sample of 10 batteries is subjected to an accelerated life test by running them continuously at an elevated temperature until failure, and the following lives are obtained.
Construct a 90% two-sided confidence interval on mean life in the accelerated test.
2 5 .5 h 2 6 .1 h
2 6 .8 2 3 .2
2 4 .2 2 8 .4
2 5 .0 2 7 .8
2 7 .3 2 5 .7
94J. Shi, the University of Michigan, [email protected], 734-763-5321(O)
TESTS FOR COMPARING TWO POPULATION MEANS
nnxxnnxx2
22
1
21
2/2
_
1
_
212
22
1
21
2/2
_
1
_
-- σ+
σ+≤µ−µ≤
σ+
σ− αα ZZ
Assume Known Population Variances
)1,0(~-
nn
xx
2
22
1
21
2
_
1
_
Nσ
+σ
Reject 210 :H µ≠µ if 2/
2
22
1
21
2
_
1
_
xx -α>
σ+
σZ
nn
Reject 210 : µµ <H if α−<σ
+σ
Z
nn 2
22
1
21
2
_
1
_
xx -
Reject 210 : µµ >H if α>σ
+σ
Z
nn 2
22
1
21
2
_
1
_
xx -
210 :H µ=µ H1
95J. Shi, the University of Michigan, [email protected], 734-763-5321(O)
Example 5: A bakery has a line making Binkies, a big-selling junkfood. Another line has just been installed, and the plant managerwants to know if the output of the new line is greater than that ofthe old line, as promised by the bakery equipment firm. 12 days ofdata are selected at random from line 1 and 10 days of data are
selected at random from line 2, with x– 1
= 1124.3 cases and
x– 2
= 1138.7. It is known that σ12= 52 and σ2
2 = 60. Test the
appropriate hypotheses at α = 0.05, given that the outputs arenormally distributed.
96J. Shi, the University of Michigan, [email protected], 734-763-5321(O)
1. Assume Unknown Population Variances
a) Assume Homogeneity (22
21
2 σσσ == )
)2(~11
-21
21
2
_
1
_
xx −++
nnt
nnS p
where 2
)12( 22
)11( 21
21
2
−+
−+−=
nn
snsnS p
Reject 210 :H µ≠µ if )2,2/(11
-21
21
2
_
1
_
xx −+α>+
nnt
nnSp
Reject 210 : µµ <H if )2,(
11-
21
21
2
_
1
_
xx −+α−<+
nnt
nnS p
Reject 210 : µµ >H if )2,(
11-
21
21
2
_
1
_
xx −+α>+
nnt
nnS p
TESTS FOR COMPARING TWO POPULATION MEANS
nnxxnnxx21
2,2/2
_
1
_
2121
2,2/2
_
1
_ 11-11-2121
++≤µ−µ≤+− −+α−+α pnnpnn StSt;
210 :H µ=µ H1

97J. Shi, the University of Michigan, [email protected], 734-763-5321(O)
2. Assume Unknown Population Variances
b) Assume Heterogeneity (22
21 σσ ≠ )
)(~-
2
22
1
21
2
_
1
_
xx vt
ns
ns
+ where 2
1
)/
1
)/
)//
2
22
2
2
1
21
2
1
22
2
21
2
1
(((
−
++
+
+=
n
n
n
n
nnv
ssss
Reject 210 :H µ≠µ if ),2/(-
2
22
1
21
2
_
1
_
xx vt
ns
ns
α>
+
Reject 210 : µµ <H if ),(-
2
22
1
21
2
_
1
_
xx vt
ns
ns
α−<
+
Reject 210 : µµ >H if ),(-
2
22
1
21
2
_
1
_
xx vt
ns
ns
α>
+
TESTS FOR COMPARING TWO POPULATION MEANS
210 :H µ=µ H1
98J. Shi, the University of Michigan, [email protected], 734-763-5321(O)
Textbook problem: 3-11. Two quality-control technicians measured the surface finish of a metal part, obtaining the data shown below. Assume that the measurements are normally distributed. Technician 1 Technician 2
1.45 1.54 1.37 1.41 1.21 1.56 1.54 1.37 1.48 1.20 1.29 1.31 1.34 1.27
1.35 Assuming that the variances are equal, construct a 95% confidence interval on the mean difference in surface-finish measurements.
99J. Shi, the University of Michigan, [email protected], 734-763-5321(O)
να,t
100J. Shi, the University of Michigan, [email protected], 734-763-5321(O)
TESTS FOR COMPARING ONE "NORMAL" POPULATION VARIANCE WITH A STANDARD
2
2s)1n(σ− ~ χ2
(n – 1)
Reject H0: σ ≠ σo
if (n - 1) s2
σo2 > χ2
(α/2,n - 1) or (n - 1) s2
σo2 < χ2
(1 - α/2,n - 1)
Reject H0: σ < σo if
(n - 1) s2
σo2 < χ2
(1-α,n - 1)
Reject H0: σ > σo if
(n - 1) s2
σo2 > χ2
(α,n - 1)
2/}Pr{,)1()1( 21,2/
212
1,2/1
22
21,2/
2
α=χ≥χχ
−≤σ≤
χ−
−α−−α−−α
nnnn
SnSn
00 :H σ=σ H1
21n,2/2
22
1n,2/1S)1n(
−α−α− χ≤σ−
≤χ

101J. Shi, the University of Michigan, [email protected], 734-763-5321(O)
Consider the data in Exercise 3-3. Construct a 90% two-sided confidence interval on the variance of battery life. Convert this into a corresponding confidence interval on the standard deviation of battery life.
2 5 .5 h 2 6 .1 h
2 6 .8 2 3 .2
2 4 .2 2 8 .4
2 5 .0 2 7 .8
2 7 .3 2 5 .7
102J. Shi, the University of Michigan, [email protected], 734-763-5321(O)
TESTS FOR COMPARING TWO NORMAL POPULATION VARIANCES
1,122
22
21
21
21~
//
−−σσ
nnFSS With H0: σ1
2 = σ2
2
for H1: σ12
≠ σ22
Reject H0 if s1
2
s22 > F(α/2,n1–1,n2–1) or
s12
s22 < F(1–α/2,n1–1,n2–1)
for H1: σ12
< σ22
Reject H0 if s2
2
s12 > F(α,n2–1,n1–1)
for H1: σ12
> σ22
Reject H0 if s1
2
s22 > F(α,n1–1,n2–1)
µνανµα−−−α−−α− =≤σσ
≤ ,,2/,,2/11,1,2/22
21
22
21
1,1,2/122
21 /1,
1212FFF
SSF
SS
nnnn
103J. Shi, the University of Michigan, [email protected], 734-763-5321(O)
(Textbook Problem 3-11 - AGAIN) Two quality-control technicians measured the surface finish of a metal part, obtaining the data shown below. Assume that the measurements are normally distributed. b. Construct a 95% confidence interval estimate of the ratio of the variances of technician measurement error. c. Construct a 95% confidence interval on the variance of measurement error for Technician 2.
Ans: x 1 = 1.3829, S1 = .11485, n1 = 7x 2 = 1.3763, S2 = .1249, n2 = 8
S p2 = 6 (.11485) 2 + 7 (.1249) 2
13 = .0145
104J. Shi, the University of Michigan, [email protected], 734-763-5321(O)
The Use of P-Values in Hypothesis Testing
1. Traditional hypothesis testing:– Given α to determine whether the null hypothesis was rejected– Disadvantage:
• No information on how close to/far away from the rejection region• predefined α may not reflect different decision maker’s risk assessments
2. P-Value approach– P-Value: the smallest level of significance would lead to rejection of the
null hypothesis– if the predefined α>P= αmin, reject the null hypothesis
f(x)
xµ=0 Z0>0Z0<0
1-Φ(Z0)Φ(Z0)

105J. Shi, the University of Michigan, [email protected], 734-763-5321(O)
Use of P Value for the Normal Distribution
H0: µ=µ0 , standard statistic Z0~N(0,1) – P=2[1-Φ|Z0|] for two- tailed test with H1: µ≠µ0
– P=1-Φ(Z0) for an upper-tailed test with H1: µ>µ0
– P=Φ(Z0) for an lower-tailed test with H1: µ<µ0
– e.g. Textbook Page 100, P=1-Φ(Z0)=0.00023, If α>P then rejected. If α=0.01 rejected; however, If α=0.00001, not rejected.
f(x)
xµ=0 Z0>0Z0<0
1-Φ(Z0)Φ(Z0)
106J. Shi, the University of Michigan, [email protected], 734-763-5321(O)
%)95(.I.Csideone1)z(%)90(.I.Csizetwo2/1)z(
α−=Φα−=Φ
107J. Shi, the University of Michigan, [email protected], 734-763-5321(O)
Testing on Binomial Parameters
• To test whether the parameter p of a binomial distribution equals a standard value p0
• The test is based on the normal approximation to the binomial distribution
• The null hypothesis is rejected if |z0|>Zα/2
01
00
::
ppHppH
≠=
⎪⎪⎩
⎪⎪⎨
⎧
>−−−
<−−+
=0
00
0
000
0
0
)1()5.0(
)1()5.0(
npxifpnpnpx
npxifpnpnpx
Z
npppxZ
/)1( 00
00 −
−=Or using the central limit theorem
211
210
::
ppHppH
≠=
21
2211
21
210
ˆˆˆ;)11)(ˆ1(ˆ
ˆˆnn
pnpnp
nnpp
ppZ++
=+−
−= 21 ppif =
2/0 Z|Z| α>H0 is rejected if
Example 3-7, p108 108J. Shi, the University of Michigan, [email protected], 734-763-5321(O)
Test on Poisson Distribution
• A random sample of n observation is taken, say x1, x2, ..,xn. Each {xi} is Poisson distributed with parameter λ. Then the sum x= x1+ x2+...+xn is Poisson distributed with parameter nλ.Example 3-9 show how to use Poisson distribution to do hypothesis test directly
• If n is large, =x/n is approximately normal with mean λ and variance λ/n
• Test hypothesis H0: λ =λ0H1: λ ≠λ0
• The null hypothesis would be rejected if |Z0|>Zα/2.
n/xZ
0
00 λ
λ−=
x

109J. Shi, the University of Michigan, [email protected], 734-763-5321(O)
Two Types of Hypothesis Test Errors
• Type I error ( producer’s risk):– α = P{type I error} = P{reject H0 |H0 is true}
=P{product is rejected| but product is good}
• Type II error (consumer’s risk):– β = P{type II error} = P{fail to reject H0 |H0 is false}
=P{product is not rejected|although product is bad}
• Power of the test:– Power = 1- β = P{reject H0 |H0 is false}
110J. Shi, the University of Michigan, [email protected], 734-763-5321(O)
The Probability of Type II Error— Detection of a mean shift
• Type II error= β=Pr{H0 |H1 |}=Pr{within the control limits|has a mean shift}H0: µ = µ0
H1: µ = µ1≠ µ0 with known σ2 0if,01 >δδ+µ=µ
)nZ()nZ(
}H|n/Zxn/ZPr{
}H|HPr{
2/2/
12/02/0
10
σδ
−−Φ−σ
δ−Φ=
σ+µ≤≤σ−µ=
=β
αα
αα
OC curve see Fig. 3-7 P109• The larger the mean shift, the smaller the type II error• The larger the sample size, the smaller the type II error
111J. Shi, the University of Michigan, [email protected], 734-763-5321(O)
Ch 4. Methods and Philosophy of SPC
• Chance Causes and Assignable Causes of Variations
• Statistical Basis of Control Charts• Implementation of SPC and Examples
112J. Shi, the University of Michigan, [email protected], 734-763-5321(O)
MotivationHow to do?• Distinguish two process variations:
– Chance causes and assignable causes• Decide the status of a process
– in control– out of control
• Continuously improve quality

113J. Shi, the University of Michigan, [email protected], 734-763-5321(O)
Chance and assignable causes of variationTextbook Fig. 4-1 P155
114J. Shi, the University of Michigan, [email protected], 734-763-5321(O)
Chance Cause & Assignable Cause
• Chance causes/common causes/system faults/chronic problems– system problems/inherent problems (natural
variation/background noise)– “in statistical control”
• Assignable causes/special causes/local causes/sporadic problems– problems arise in somewhat unpredictable fashion (operator
error, material defects, machine failure)– “out of statistical control”
Textbook Fig. 4-1 P155
115J. Shi, the University of Michigan, [email protected], 734-763-5321(O)
Purpose of Using Control charts- Improve Process and Reduce Process Variation
1. Most processes do not operate in a state of statistical control.
2. Consequently, the routine and attentive use of control charts will identify assignable causes. If these causes can be eliminated from the process, variability will be reduced and the process will be improved.
3. The control chart will only detect assignable causes. Management, operator, and engineering action will usually be necessary to eliminate the assignable cause.
116J. Shi, the University of Michigan, [email protected], 734-763-5321(O)
Objectives of SPC
• To quickly detect the occurrence of assignable causes or process shifts so that investigations of the process and corrective actions may be undertaken before many nonconforming units are manufactured.
• Process Variation Reduction

117J. Shi, the University of Michigan, [email protected], 734-763-5321(O)
Procedures of implementing SPC
– Monitoring the process and detecting process changes– Diagnosing the assignable causes– Providing corrective actions plans– Dealing with resistance to changes/actions– Instituting controls to hold the gains
Problem/VariationProcess Measurement/
ObservationData
Analysis Evaluation
Find RootCauses
Formulate Action
Chances Causes
Assignable CausesTake
Action
118J. Shi, the University of Michigan, [email protected], 734-763-5321(O)
Continuous Improvement• "Continuous improvement" (called Kaizen by the Japanese) –
enduring efforts to act upon both chronic and sporadic problems and to make refinements to processes. – For sporadic problems, it means taking corrective action on
periodic problems; – For chronic problems, it means achieving better and better
levels of performance each year (move mean to target); – For process refinements, it means taking such action as
reducing variation around a target value.
Problem/VariationProcess Measurement/
ObservationData
Analysis Evaluation
Find RootCauses
Formulate Action
Chances Causes
Assignable CausesTake Action
Control mean close to the targetReduce variation
119J. Shi, the University of Michigan, [email protected], 734-763-5321(O)
Example: Implementation of Continuous Quality Improvement
•Special cause: tool broken, operator injury•easy to fix•manufacturer problem
•Chronic problem: design problem, degradation•continuous improvement
120J. Shi, the University of Michigan, [email protected], 734-763-5321(O)
Concept of Control Charts• Control Chart: is a graphical display of a quality characteristic that has
been measured or computed from a sample versus the sample number or time.
• Center Line – represents the average value of the quality characteristic corresponding to the in-control state (only chance causes are present.)
• Upper Control Limit (UCL), Lower Control Limit (LCL) – are chosen so that if the process is in control, nearly all of the sample points will fall between them.
201000-3
-2
-1
0
1
2
3
Time
LCL
Average
UCL
mm

121J. Shi, the University of Michigan, [email protected], 734-763-5321(O)
The Basis of Control Charts
201000-3
-2
-1
0
1
2
3
Time
LCL
Average
UCL
mm
Distribution ofindividual
measurements x:
Distribution ofsample subgroupmean x-bar
n/1σ
n/2σ
n/3σ
122J. Shi, the University of Michigan, [email protected], 734-763-5321(O)
General Model for a Control Chart
Let w be a sample statistic that measures some quality characteristics ofinterest, and suppose that the mean of w is µw and the standard deviationof w is σw. Then the center line, the upper control limit, and the lowercontrol limit become
UCL = µw + k σw
Center line = µw
LCL = µw - k σw
where k is the "distance" of the control limits from the center line,expressed in standard deviation units
3 sigma control limits:• Action limits: K=3 (p=0.0027)• Warning limits: K=2 (p=0.0455)
Probability limits (Western Europe):• Action limits: 0.001 limits (p=0.002)• Warning limits: 0.025 limits (p=0.050)
123J. Shi, the University of Michigan, [email protected], 734-763-5321(O)
Control Charts vs. Hypothesis Test
• Control Charts• Control chart has UCL & LCL• The process is out of control if the data beyond the control limits
f(x)
xµ0 UCLLCL
α/2α/2
H0: µ = µ0H1: µ≠ µ0
if ⎪⎪⎪⎪
⎪⎪⎪⎪x− – µ0
σ/ n > Z(α/2)Reject H0
• Hypothesis Testing• Hypothesis testing has a rejection region• H0 is rejected if the data follow in the rejection region
124J. Shi, the University of Michigan, [email protected], 734-763-5321(O)
Review of Two Types of Hypothesis Test Errors• Type I error ( producer’s risk):
– α = P{type I error} = P{reject H0 |H0 is true}=P{conclude out of control|although the process is truly in control}
• Type II error (consumer’s risk):– β = P{type II error} = P{fail to reject H0 |H0 is false}
=P{conclude in control|although the process is truly out of control}
• Power of the test:– Power = 1- β = P{reject H0 |H0 is false}
β
µ1
f(x)
xµ0 UCLLCL
α/2α/2

125J. Shi, the University of Michigan, [email protected], 734-763-5321(O)
The Probability of Type II Error— Detection of a mean shift with a known σ
• Type II error= β=Pr{H0 |H1 |}=Pr{within the control limits|has a mean shift}H0: µ = µ0
H1: µ = µ1≠ µ0 with known σ2 0if,01 >δδ+µ=µ
)nZ()nZ(
}H|n/Zxn/ZPr{
}H|HPr{
2/2/
12/02/0
10
σδ
−−Φ−σ
δ−Φ=
σ+µ≤≤σ−µ=
=β
αα
αα
n/σδ
126J. Shi, the University of Michigan, [email protected], 734-763-5321(O)
• The larger the mean shift, the smaller the type II error• The larger the sample size, the smaller the type II error
increased
OC curve with α=0.05 (P119, Fig. 3-9)
σδ= /||d
127J. Shi, the University of Michigan, [email protected], 734-763-5321(O)
Two Types of Errors
– Type I error:– Concluding the process out of control when the process is
really in control– Type II error:
– Concluding the process in control when it is really out of control.
β
µ1
f(x)
xµ0 UCLLCL
α/2α/2
128J. Shi, the University of Michigan, [email protected], 734-763-5321(O)
Summary of Type I and Type II Errors
You Conclude :"In Control"
Nature :"Out of Control"
"In Control"
"Out of Control"
Confidence 1–α
Producer Error, α
Power 1–β
Consumer Error, β
129J. Shi, the University of Michigan, [email protected], 734-763-5321(O)
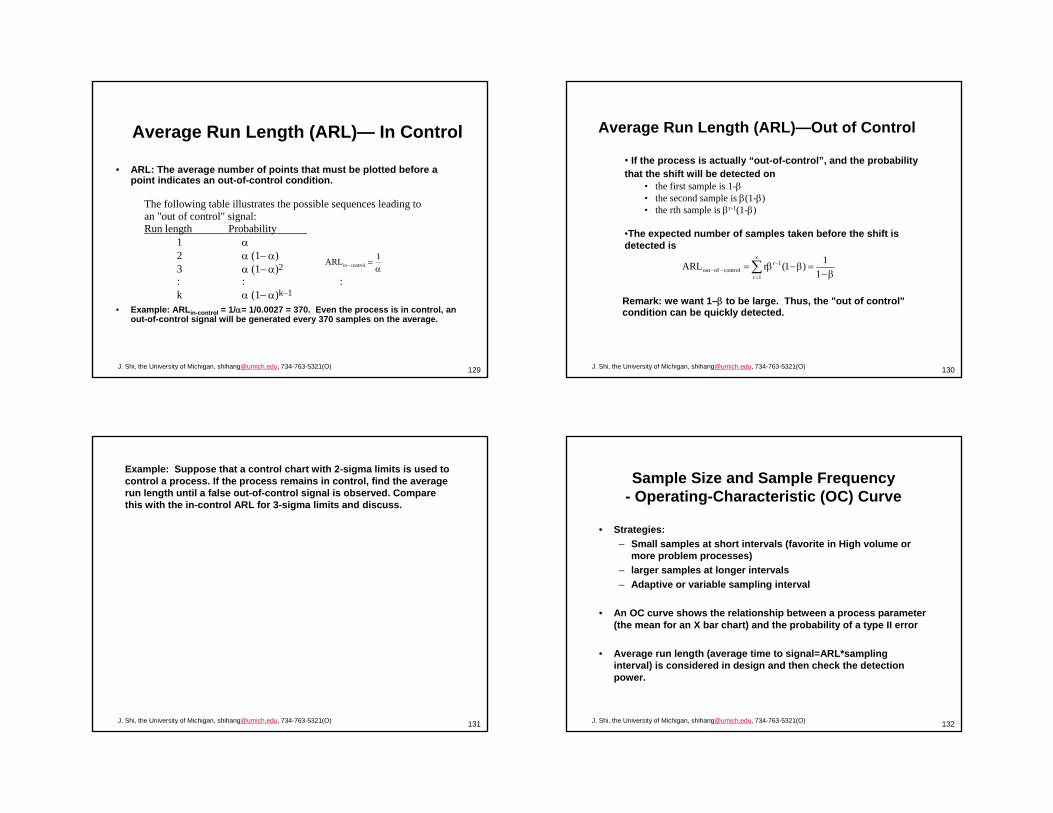
• ARL: The average number of points that must be plotted before a point indicates an out-of-control condition.
• Example: ARLin-control = 1/α= 1/0.0027 = 370. Even the process is in control, an out-of-control signal will be generated every 370 samples on the average.
Average Run Length (ARL)— In Control
The following table illustrates the possible sequences leading toan "out of control" signal:Run length Probability
1 α2 α (1– α)3 α (1– α)2
: : :k α (1– α)k–1
α=−
1ARL controlin
130J. Shi, the University of Michigan, [email protected], 734-763-5321(O)
Average Run Length (ARL)—Out of Control
Remark: we want 1–β to be large. Thus, the "out of control"condition can be quickly detected.
• If the process is actually “out-of-control”, and the probability that the shift will be detected on
• the first sample is 1-β• the second sample is β(1-β)• the rth sample is βr-1(1-β)
•The expected number of samples taken before the shift is detected is
∑∞
=
−−− β−
=β−β=1r
1rcontrolofout 1
1)1(rARL
131J. Shi, the University of Michigan, [email protected], 734-763-5321(O)
Example: Suppose that a control chart with 2-sigma limits is used to control a process. If the process remains in control, find the average run length until a false out-of-control signal is observed. Compare this with the in-control ARL for 3-sigma limits and discuss.
132J. Shi, the University of Michigan, [email protected], 734-763-5321(O)
Sample Size and Sample Frequency- Operating-Characteristic (OC) Curve
• Strategies:– Small samples at short intervals (favorite in High volume or
more problem processes)– larger samples at longer intervals – Adaptive or variable sampling interval
• An OC curve shows the relationship between a process parameter (the mean for an X bar chart) and the probability of a type II error
• Average run length (average time to signal=ARL*sampling interval) is considered in design and then check the detection power.

133J. Shi, the University of Michigan, [email protected], 734-763-5321(O)
Process Out of Control
Out of control process:• When one or more points fall beyond the control limit• Plotted points exhibit some nonrandom pattern of behavior
Description of nonrandom pattern• a nonrandom pattern with a longer run up or run down, or a run of
length 8 or more – Run up: a sequence of increasing observations– Run Down: a sequence of decreasing observations– Run: a sequence of observations of the same type – Run of length: the number of samples in a run
• a periodic pattern
134J. Shi, the University of Michigan, [email protected], 734-763-5321(O)
Control Chart Patterns and Causes JUMPS IN PROCESS LEVEL
1. NEW SUPPLIER2. NEW WORKER3. NEW MACHINE4. NEW TECHNOLOGY5. CHANGE IN METHOD OR PROCESS6. CHANGE IN INSPECTION DEVICE OR METHOD
HIGH PROPORTION OF POINTS NEAR OUTER LIMITS
1. OVER CONTROL2. LARGE DIFF IN MATERIAL QUALITY, TEST METHOD3. CONTROL OF 2 OR MORE PROC. ON ONE CHART4. MIXTURES OF MATERIALS OF DIFFERENT QUALITY5. MULTIPLE CHARTERS6. IMPROPER SUBGROUPING
STRATIFICATION (LACK OF VARIABILITY)
1. INCORRECT CALCULATION OF CONTROL LIMITS2. SYSTEMATIC SAMPLING
135J. Shi, the University of Michigan, [email protected], 734-763-5321(O)
Control Chart Patterns and Causes RECURRING CYCLES
1. TEMPERATURE AND OTHER CYCLIC ENVIRONMENTAL EFFECTS2. WORKER FATIGUE3. DIFFERENCES IN MEASURING DEVICES USED IN ORDER4. REGULAR ROTATION OF MACHINES OR OPERATORS5. SCHEDULED PREVENTIVE MAINTENANCE (R CHART)6. TOOL WEAR (R CHART)
TRENDS1. GRADUAL EQUIPMENT DETERIORATION2. WORKER FATIGUE3. ACCUMULATION OF WASTE PRODUCTS4. IMPROVEMENT OR DETERIORATION OF WORKER SKILL/EFFORT
(ESPECIALLY IN R CHART)5. DRIFT IN INCOMING MATERIALS QUALITY
136J. Shi, the University of Michigan, [email protected], 734-763-5321(O)
SUMMARY OF OUT-OF-CONTROL CRITERIA— Western Electric Rules (Zone Rules for Control
Charts)
Enhance the sensitivity of control charts for detecting a small shift or other nonrandom patterns
1. One point plot outside 3σ limits.2. Two successive points plot outside 2σ limits3. Four consecutive points plot at a distance of 1σ or beyond
from the center line (one side)4 A run of length eight points
More other sensitizing rules for Shewhart control chart; Table 4-1, P176
The final type I error: the process is concluded out of control if any one of the rules is applied
∏=
α−−=αk
ii
1
)1(1 αi is the type I error of using one rule i alone

137J. Shi, the University of Michigan, [email protected], 734-763-5321(O)
Rational Subgroups• Want each subgroup as homogeneous as possible• Want maximum opportunity for variation between groups.• Should be time ordered.• Should consist of items produced together for detection of a mean shift.
138J. Shi, the University of Michigan, [email protected], 734-763-5321(O)
Implementing SPC- Magnificent SEVEN
1. Histogram2. Check Sheet3. Pareto Chart4. Cause and Effect Diagram5. Defect Concentration Diagram6. Scatter Diagram7. Control Chart
139J. Shi, the University of Michigan, [email protected], 734-763-5321(O)
2. Check Sheet Example
140J. Shi, the University of Michigan, [email protected], 734-763-5321(O)
3. Pareto Chart Example

141J. Shi, the University of Michigan, [email protected], 734-763-5321(O)
4. Cause and Effect Diagram Example
142J. Shi, the University of Michigan, [email protected], 734-763-5321(O)
5. Defect Concentration Diagram Example
143J. Shi, the University of Michigan, [email protected], 734-763-5321(O)
6. Scatter Plot Example
144J. Shi, the University of Michigan, [email protected], 734-763-5321(O)
CASE Example (Grant/Levenworth 1988) : Thread grinding for fitting used in aircraft hydraulic system.
Process• Inspection thread pitch diameter based on a given specifications
(37.5±12.5)• Total 20hrs with each hour 5 items
Question:• Is the process capable of producing such quality products?• Can the process or quality be further improved?

145J. Shi, the University of Michigan, [email protected], 734-763-5321(O)
Sample Thread Pitch Diameter DataAircraft Fittings (Thread Pitch Diameter)
5 items sampled each hourValues in .0001 inches excess of 0.4000 in.
Sample Avg. R1 36 35 34 33 32 34.0 42 31 31 34 32 30 31.6 43 30 30 32 30 32 30.8 24 32 33 33 32 35 33.0 35 32 34 37 37 35 35.0 56 32 32 31 33 33 32.2 27 33 33 36 32 31 33.0 58 23 33 36 35 36 32.6 139 43 36 35 24 31 33.8 19
10 36 35 36 41 41 37.8 611 34 38 35 34 38 35.8 412 36 38 39 39 40 38.4 413 36 40 35 26 33 34.0 1414 36 35 37 34 33 35.0 415 30 37 33 34 35 33.8 716 28 31 33 33 33 31.6 517 33 30 34 33 35 33.0 518 27 28 29 27 30 28.2 319 35 36 29 27 32 31.8 920 33 35 35 39 36 35.6 6
33.6 6.2146J. Shi, the University of Michigan, [email protected], 734-763-5321(O)
20
30
40
50
20
30
40
50
Thr
ead
Pitc
h
0 5 10 15 20 25
Sample Number
PITCH DIAMETER FOR AIRCRAFT FITTINGS
Upper Tolerance Limit
Lower Tolerance Limit
Nominal Target
147J. Shi, the University of Michigan, [email protected], 734-763-5321(O)
MEAN 33.5500
LWL 31.1659
UWL 35.9341
LCL 29.9738
UCL 37.1262
27.5
30
32.5
35
37.5
40
Fitt
ing
Dim
ensi
on
0 5 10 15 20 25
Sample Number
Aircraft Fittings X-Bar Chart
148J. Shi, the University of Michigan, [email protected], 734-763-5321(O)
MEAN 6.2000
LWL 1.5940
UWL 10.8060
UCL 13.1090
0
5
10
15
20
Fitt
ing
Dim
ensi
on
0 5 10 15 20 25
Sample Number
Aircraft Fittings Range Chart

149J. Shi, the University of Michigan, [email protected], 734-763-5321(O)
Summary: What can a control chart do?
• Is a proven technique for improving productivity• Is effective in defect prevention• Prevent unnecessary process adjustment• Provide diagnostic information• Provide information about process capability
150J. Shi, the University of Michigan, [email protected], 734-763-5321(O)
Ch 5 Control Charts for Variables
• Control Chart for and R• Control Chart for and S• Operating-Characteristic Function• Relationship of NTL, CL, and SL
XX
151J. Shi, the University of Michigan, [email protected], 734-763-5321(O)
Need for Control of Both Mean and Variability• The number of nonconforming product is dependent on both
mean shift and larger variation (Textbook Fig. 5-1, P208)
Normal mean and variance
Larger mean and normal variance
normal mean and larger variance
• Mean is monitored by X bar chart• Variability is monitored by either S chart (standard deviation) or R chart (range)
152J. Shi, the University of Michigan, [email protected], 734-763-5321(O)
Review of the Basic Model of Control Charts
Let w be a sample statistic that measures some quality characteristic of interest, andsuppose that the mean of w is µw and the standard deviation of w is σw. Then the centerline, the upper control limit, and the lower control limit become
UCL = µw + k σw
Center line = µw
LCL = µw - k σw
where k is the "distance" of the control limits from the center line, expressed in standarddeviation units
153J. Shi, the University of Michigan, [email protected], 734-763-5321(O)
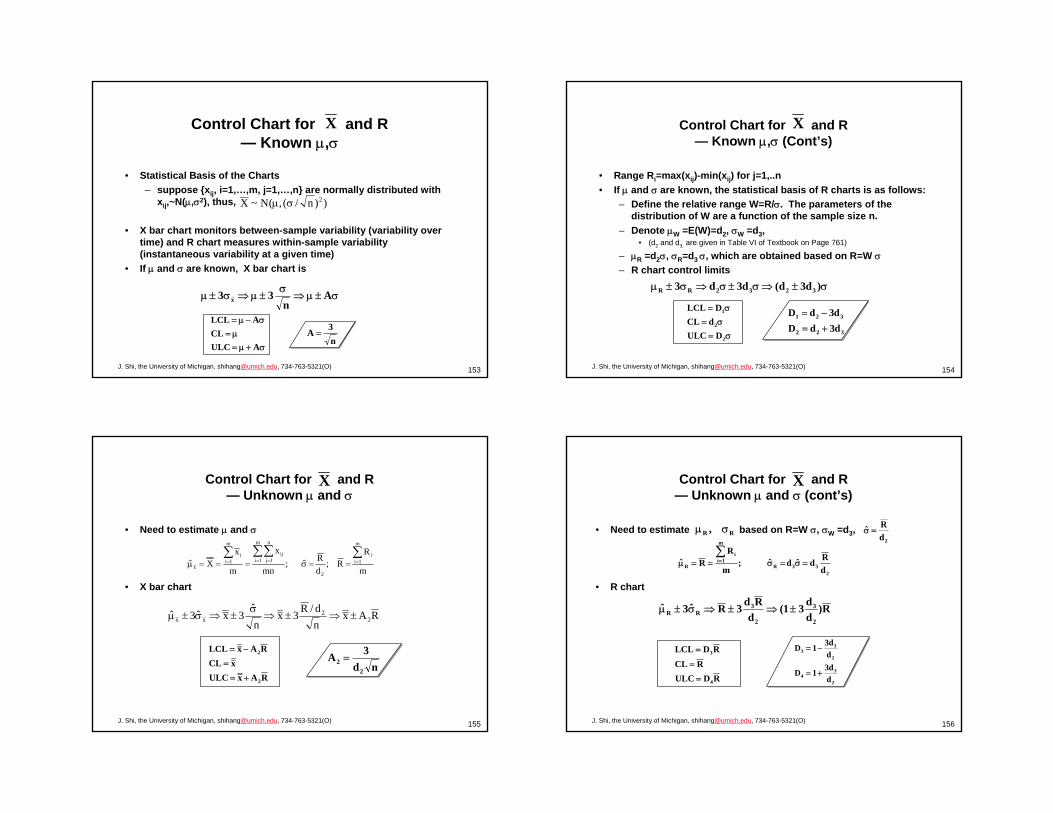
• Statistical Basis of the Charts– suppose {xij, i=1,…,m, j=1,…,n} are normally distributed with
xij,~N(µ,σ2), thus,
• X bar chart monitors between-sample variability (variability over time) and R chart measures within-sample variability (instantaneous variability at a given time)
• If µ and σ are known, X bar chart is
Control Chart for and R— Known µ,σ
X
))n/(,(N~X 2σµ
σ±µ⇒σ
±µ⇒σ±µ An
33 x
n3A =
σ+µ=µ=
σ−µ=
AULCCL
ALCL
154J. Shi, the University of Michigan, [email protected], 734-763-5321(O)
• Range Ri=max(xij)-min(xij) for j=1,..n• If µ and σ are known, the statistical basis of R charts is as follows:
– Define the relative range W=R/σ. The parameters of the distribution of W are a function of the sample size n.
– Denote µW =E(W)=d2, σW =d3, • (d2 and d3, are given in Table VI of Textbook on Page 761)
– µR =d2σ, σR=d3 σ, which are obtained based on R=W σ– R chart control limits
Control Chart for and R— Known µ,σ (Cont’s)
X
σ±⇒σ±σ⇒σ±µ )d3d(d3d3 3232RR
σ=σ=
σ=
2
2
1
DULCdCL
DLCL
322
321
d3dDd3dD
+=
−=
155J. Shi, the University of Michigan, [email protected], 734-763-5321(O)
• Need to estimate µ and σ
• X bar chart
Control Chart for and R— Unknown µ and σ
X
m
RR;
dRˆ;
mn
x
m
xXˆ
m
1ii
2
m
1i
n
1jij
m
1ii
x
∑∑∑∑== == ==σ===µ
RAxnd/R3x
nˆ
3xˆ3ˆ 22
xx ±⇒±⇒σ
±⇒σ±µ
RAxULCxCL
RAxLCL
2
2
+=
=
−=
nd3A
22 =
156J. Shi, the University of Michigan, [email protected], 734-763-5321(O)
Control Chart for and R— Unknown µ and σ (cont’s)
X
233R
m
1ii
R dRdˆdˆ;
m
RRˆ =σ=σ==µ
∑=
• Need to estimate based on R=W σ, σW =d3,
• R chart
RR , σµ2d
Rˆ =σ
R)dd31(
dRd3Rˆ3ˆ
2
3
2
3RR ±⇒±⇒σ±µ
RDULCRCL
RDLCL
4
3
=
=
=
2
34
2
33
dd31D
dd31D
+=
−=

157J. Shi, the University of Michigan, [email protected], 734-763-5321(O)
Procedures for Establishment of Control Limits— Unknown µ and σ
• If µ and σ are unknown, we need to estimate µ and σ based on the preliminary in-control data (normally m=20~25).
• The control limits established using the preliminary data are called trial control limits, which are used to check whether the preliminary data are in control.
• First check R or S chart to ensure all data in-control, and then check X bar chart (P213, Example 5-1)
Collect Preliminary Data
EstablishControl Limits
EstimateorX SR
Check Preliminary Data
Eliminate the Outliers due to Assignable Causes
Update Estimation
In-control FutureMonitoring
Out-of-control
158J. Shi, the University of Michigan, [email protected], 734-763-5321(O)
Review of Type I and Type II Error
You Conclude :"In Control"
Nature :"Out of Control"
"In Control"
"Out of Control"
Confidence 1–α
Producer Error, α
Power 1–β
Consumer Error, β
159J. Shi, the University of Michigan, [email protected], 734-763-5321(O)
Review of the ARL - “In Control”
The following table illustrates the possible sequences leading to an"out of control" signal:Run length Probability
1 α2 α (1– α)3 α (1– α)2
: : :k α (1– α)k–1
∑∞
=
−− α
=αα−=1r
1kcontrolin
1)1(kARL
160J. Shi, the University of Michigan, [email protected], 734-763-5321(O)
Review of the ARL - “Out of Control”
• If the process is actually “out-of-control”, the probability that the shift will be detected on
• the first sample is 1-β• the second sample is β(1-β)• the rth sample is βr-1(1-β)
• The expected number of samples taken before the shift is detected is
∑∞
=
−−− β−
=β−β=1r
1rcontrolofout 1
1)1(rARL

161J. Shi, the University of Michigan, [email protected], 734-763-5321(O)
OC Curve for x bar and R Chart• X bar chart
• The expected number of samples taken before the shift is detected
If sample interval is very small, the small shift may still be detected reasonably fast although perhaps not on the first sample following the shift
• If process is in control: ARL is the expected number of samples until a "false alarm” occurs
[ ] [ ]nkLnkL
}|LCLxPr{}|UCLxPr{}k|UCLxLCL{P
11
01
−−Φ−−Φ=
µ≤−µ≤=σ+µ=µ≤≤=β
;n/LLCL;n/LUCL,k 0001 σ−µ=σ+µ=σ+µ=µ
∑∞
=
−−− β−
=β−β=1r
1rcontrolofout 1
1)1(rARL
( ) ( )α
=αα−= ∑∞
=
−−
11kARL1i
1kcontrolin
162J. Shi, the University of Michigan, [email protected], 734-763-5321(O)
OC Curve for X bar and R chart (Cont’s)
P234 Figure 5-15
P236 Figure 5-16
163J. Shi, the University of Michigan, [email protected], 734-763-5321(O)
ARL for X bar
P237 Figure 5-17
P238 Figure 5-18
I=n*ARLARL
164J. Shi, the University of Michigan, [email protected], 734-763-5321(O)
Estimation of the Process Capability
• Get process specification limits (USL, LSL)• Estimate σ based on (R chart) or (S chart)• Estimate the fraction of nonconforming products p (or p×106PPM)
• Process-Capability Ratio
PCR=1 means the process uses up 100% tolerance band with 0.27% (2700PPM) nonconforming units
• Percentage of the specification band that the process uses upP=(1/PCR)100%
2d/Rˆ =σ 4c/Sˆ =σ
)ˆ
xUSL(1)ˆ
xLSL(}USLxPr{}LSLxPr{pσ
−Φ−+
σ−
Φ=>+<=
;ˆ6LSLUSLPCR;
6LSLUSLPCR
σ−
=σ−
=

165J. Shi, the University of Michigan, [email protected], 734-763-5321(O)
Differences among NTL, CL and SL and Impact on Process Capability
µ USL3σ 3σ
LSL UNTLLNTL
µ USL3σ 3σ
LSL UNTLLNTL
µ
USL3σ 3σLSL
UNTLLNTL
PCR>1, P<100%
PCR<1, P>100%
PCR=1, P=100%µ
USL
3 σ3 σ
LSL
UNTL
LNTL
Externallydetermined
Externallydetermined
Distribution of individualprocess measurement
UCL
LCL Distribution of x bar values
n3σ
Center lineon x bar
• There is no relationship betw een control lim its and specification lim its.• PCR is an index relating natural to lerance lim its to specification lim its.
166J. Shi, the University of Michigan, [email protected], 734-763-5321(O)
Interpretation of X bar and R Chart
• First check the R chart and eliminate the assignable causes from R chart, and then check the X bar chart
• Check non-random pattern– Cyclic pattern due to temperature, regular rotation of
operators or machines, maintenance schedules, tool wear (Fig. 5-10, P230)
– Mixture pattern when the plotted points tend to fall near or slightly outside the control limits. Two overlapping distributions are resulted from too often process adjustment(Fig 5-11, p230).
– Shift in process level due to introduction of new workers, methods, materials, or inspection standard (Fig. 5-12, P231)
– Trend pattern due to gradual tool wear (Fig. 5-13, P231)– Stratification pattern for the points to cluster around the center
line due to incorrect calculation of Control limits or inappropriate reasonable sampling group (Fig. 5-14, P232)
167J. Shi, the University of Michigan, [email protected], 734-763-5321(O) 168J. Shi, the University of Michigan, [email protected], 734-763-5321(O)
Application Conditions of X bar and R chart
• Underlying distribution of the quality characteristics is normal– X bar chart is more robust to nonnormality than R chart– samples of 4 or 5 are sufficient to ensure reasonable
robustness to the normality assumption for X bar chart• Calculation accuracy of Type I error is dependent on the
distribution• X bar chart (n=4, 5, 6) is not effective to detect a small mean shift
(less than 1.5 σ) on the first sample following the shift• R chart is insensitive to small or moderate shifts (σ1/σ0 <2.5) for
the sample size of n=4, 5, or 6. If n>10, a s chart should be used instead of a R chart

169J. Shi, the University of Michigan, [email protected], 734-763-5321(O)
• If known µ and σ, X bar chart is the same as that in and R chart
• S chart– Denote µS =E(S)=c4 σ,
(c4 is a constant that depends on the sample size n, which,is given in Table VI of Textbook on Page 761)
– control limits for S chart
Control Chart for and S— Known µ and σ
X
σ−±⇒−σ±σ⇒σ±µ )c13c(c13c3 244
244SS
σ=σ=
σ=
6
4
5
BULCcCL
BLCL
2446
2445
c13cB
c13cB
−+=
−−=
X
24S c1−σ=σ )]2/1n[(
)2/n(1n
2c2/1
4 −ΓΓ
⎟⎠⎞
⎜⎝⎛
−=
170J. Shi, the University of Michigan, [email protected], 734-763-5321(O)
• Need to estimate µ and σ.
• X bar chart
Control Chart for and S— Unknown µ and σ
X
;cS
cˆˆ
Sm1S;
1n
)xx(S;
mn
x
m
xXˆ
44
S
m
1ii
n
1j
2iij
i
m
1i
n
1jij
m
1ii
=µ
=σ
=−
−====µ ∑
∑∑∑∑=
== ==
(based on µS =E(S)=c4 σ)
SAxcS
n3x
nˆ
3xˆ3ˆ 34
x ±⇒±⇒σ
±⇒σ±µ
nc3A
43 =
SAxULCxCL
SAxLCL
3
3
+=
=
−=
171J. Shi, the University of Michigan, [email protected], 734-763-5321(O)
• Need to estimate µs and σs.
• S chart
X
1n
)xx(S;S
m1Sˆ
n
1j
2iij
i
m
1iiS −
−===µ
∑∑ =
=
S)c
c131(c1
cS3Sˆ3ˆ
4
242
44
SS
−±⇒−±⇒σ±µ
24
44
24
43
c1c31B
c1c31B
−+=
−−=
SBULCSCL
SBLCL
4
3
=
=
=
Control Chart for and S— Unknown Standard µ,σ (Cont’s)
24
4
24S c1
cSc1ˆˆ −=−σ=σ ;
cSˆ
4
=σ
Please review Example 5-3, p243172J. Shi, the University of Michigan, [email protected], 734-763-5321(O)
SBULCSCL
SBLCL
4
3
=
=
=
;cSˆ
4
=σ SAxULCxCL
SAxLCL
3
3
+=
=
−=
σ=σ=
σ=
6
4
5
BULCcCL
BLCL
RDULCRCL
RDLCL
4
3
=
=
=
RAxULCxCL
RAxLCL
2
2
+=
=
−=
σ=σ=
σ=
2
2
1
DULCdCL
DLCL
σ+µ=µ=
σ−µ=
AULCCL
ALCL
2dRˆ =σ
Xˆ =µ
Xˆ =µ
σµknown
X bar chart R chart S chartProcess Parameters
X bar & R chart
X bar & S chart
Summary of Control Charts

173J. Shi, the University of Michigan, [email protected], 734-763-5321(O)
Textbook 5-43:A normally distributed quality characteristic is monitored through use of an X bar and an R chart. These charts have the following parameters (n = 4):
x bar chart: UCL = 626.0;Center line = 620.0LCL = 614.0
R chart: UCL = 18.795 Center line = 8.236 LCL = 0
Both charts exhibit control.(a) What is the estimated standard deviation of the process?(b) Suppose an S chart were to be substituted for the R chart. What would be the appropriate parameters of the S chart? (c) If specifications on the product were 610 ± 15, what would be your estimate of the process fraction nonconfornting?(d) What could be done to reduce this fraction nonconforming? (e) What is the probability of detecting a shift in the process mean to 610 on the first sample following the shift (sigma remains constant)? (f) What is the probability of detecting the shift in part (e) by at least the third sample after the shift occurs?
174J. Shi, the University of Michigan, [email protected], 734-763-5321(O)
X bar and S Control Chart with Variable Sample Size
• Use a weighted average approach in calculating and
– A3, B3, and B4 will use the corresponding sample size of each subgroup (Please see Example 5-4, P245; Fig. 5-20, P248)
• Use an average sample size , or use the most often sample sizeif ni are not very different
x S
∑
∑
=
== m
1ii
m
1iii
n
xnx
2/1
m
1ii
m
1i
2ii
mn
S)1n(S
⎥⎥⎥⎥
⎦
⎤
⎢⎢⎢⎢
⎣
⎡
−
−=
∑
∑
=
=
n
175J. Shi, the University of Michigan, [email protected], 734-763-5321(O) 176J. Shi, the University of Michigan, [email protected], 734-763-5321(O)
areChart S

177J. Shi, the University of Michigan, [email protected], 734-763-5321(O) 178J. Shi, the University of Michigan, [email protected], 734-763-5321(O)
Comparison of R Chart and S Chart
• R Chart– simple for hand calculation;– good for small sample size;– lose information between xmin and xmax;
– not used for variable sample size. • S Chart
– when the sample size is large (n>10);– Used for variable sample size ;– Computation complexity can be simplified by using a
computer.
Summary of x bar, R and S chart formula (Table 5-9, Table 5-10; P260)
n RelativeEfficiency
2 1.000
3 0.992
4 0.975
5 0.955
6 0.930
10 0.850
The relative efficiency of R to S2
179J. Shi, the University of Michigan, [email protected], 734-763-5321(O)
Application Conditions of X bar and R chart
• Underlying distribution of the quality characteristics is normal– X bar chart is more robust to nonnormality than R chart– samples of 4 or 5 are sufficient to ensure reasonable
robustness to the normality assumption for X bar chart• Calculation accuracy of Type I error is dependent on the
distribution• X bar chart (n=4, 5, 6) is not effective to detect a small mean shift
(less than 1.5 σ) on the first sample following the shift• R chart is insensitive to small or moderate shifts (σ1/σ0 <2.5) for
the sample size of n=4, 5, or 6. If n>10, a s chart should be used instead of a R chart
180J. Shi, the University of Michigan, [email protected], 734-763-5321(O)
Example #3: (Problem 5-16) Control charts for X and R are maintained for an important qualitycharacteristic. The sample size is n = 7; X and R are computed for each sample. After 35 samples, wehave found that
x i = 7805 and Ri =1200i=1
35
∑i =1
35
∑ (a) Set up X and R charts using these data. (b) Assuming that both charts exhibit control, estimate the process mean andstandard deviation. (c) If the quality characteristic is normally distributed and if the specifications are
220 ± 35, can the process meet the specifications? Estimate the fractionnonconforming.
(d) Assuming the variance to remain constant, state where the process mean should be located to minimizethe fraction nonconforming. What would be the value of the fraction nonconforming under theseconditions?

181J. Shi, the University of Michigan, [email protected], 734-763-5321(O)
Applications of Variables Charts
• Ex. 5-7: Improving Suppliers' Processes• Ex. 5-8: Purchasing a Machine Tool• Ex. 5-9: Short Run Job Shop• Ex. 5-10: Nonmanufacturing Application• Ex. 5-11: Care in Selecting Rational Subgroups
This is a nice collection of “successful stories” describing howcharting can be used effectively to improve quality.
182J. Shi, the University of Michigan, [email protected], 734-763-5321(O)
Ch6 Control Charts for Attributes
• p and np chart• c and u chart• Variable sample size• OC curve and ARL
183J. Shi, the University of Michigan, [email protected], 734-763-5321(O)
Terminology
• Nonconforming: Defective • Conforming: Nondefective• Attributes: Quality characteristics of conforming or non
conforming• The fraction nonconforming: the ratio of the number of
nonconforming items in a population to the total number of itemsin that population.
samplesof#Totalgminnonconforof#
nDp i
i ==
184J. Shi, the University of Michigan, [email protected], 734-763-5321(O)
Review of Binomial Distribution
Let x = # defects in a sample of size n where defects follow aBernoulli Process (two outcomes, p-constant, x - independent)
f (x) =nx
⎛ ⎝ ⎜ ⎞
⎠ px (1 − p)n − x
E(x) = np
V(x) = np(1 − p)

185J. Shi, the University of Michigan, [email protected], 734-763-5321(O)
Sample Estimation of p
Let ˆ p = xn
E( ˆ p ) =E(x)
n=
npn
= p
V( ˆ p ) =1n2 V(x) =
p(1 − p)n
186J. Shi, the University of Michigan, [email protected], 734-763-5321(O)
Review of the Basic Model of a Control Chart
Let w be a sample statistic that measures some quality characteristic of interest, andsuppose that the mean of w is µw and the standard deviation of w is σw. Then the centerline, the upper control limit, and the lower control limit become
UCL = µw + k σw
Center line = µw
LCL = µw - k σw
where k is the "distance" of the control limits from the center line, expressed in standarddeviation units
187J. Shi, the University of Michigan, [email protected], 734-763-5321(O)
Fraction Nonconforming Control Chart (p-Chart)
For np large ⇒ ˆ p ~ N p,p(1 − p)
n⎛ ⎝
⎞ ⎠
UCL ˆ p = p + 3p(1 − p )
n Centerline = p
LCL ˆ p = p − 3 p(1 − p)n
Binomial (n>10, p close to 0.5) ⇒ normal
If LCLp <0, set LCLp=0
Remarks: When data points are plotted below LCL, they generally do not represent a real improvement. Actually, they are often caused by errors in the inspection rather than a process improvement
188J. Shi, the University of Michigan, [email protected], 734-763-5321(O)
How to Establish a p-Chart?
• Is there an assignable cause for out-of-control points or a nonrandom pattern? If so, find the root causes and delete these points, and then update control limits.(Example 6-1, p. 288)
If p unknown, conduct a test and trial control limits with
p)p(Em
p
mn
Dp
m
1ii
m
1ii
=
==∑∑
==
pp =
m=20-25samples for constructing trial control limits

189J. Shi, the University of Michigan, [email protected], 734-763-5321(O)
A P-Chart Example
0
0.05
0.1
0.15
0.2
0.25
0.3
0.35
0.4
0 10 20 30 40 50 60 70 80 90 100
Revised control chart after making adjustments
Out-of-control point
190J. Shi, the University of Michigan, [email protected], 734-763-5321(O)
Example The following data give the number of nonconforming ROM chips in samplesof size 200. Construct a p chart for these data. Assume that any values beyond the controllimits have an assignable cause and revise the control limits as appropriate.
Sample Nonconforming Sample Nonconforming 1 19 12 182 7 13 173 11 14 214 29 15 165 24 16 166 24 17 237 15 18 148 25 19 49 11 20 21
10 10 21 2411 37 22 10
191J. Shi, the University of Michigan, [email protected], 734-763-5321(O)
Example (Textbook problem 6-18) A fraction nonconforming control chart with center line0.10, UCLp = 0.19, and LCLp = 0.01 is used to control a process.
a. If 3-sigma limits are used, find the sample size for the control chart.
b. Use the Poisson approximation to the binomial to find the probability of type I error.
c. Use the Poisson approximation to the binomial to find the probability of type II error if theprocess fraction defective is actually p = 0.20.
192J. Shi, the University of Michigan, [email protected], 734-763-5321(O)
Design of the Fraction Nonconforming Control Chart (p Chart)
• Three key parameters:– the sample size; the frequency of sampling; the width of the
control limits
• General Guidelines:– select n so that the probability of finding at least one
nonconforming unit per sample is at least r Pr{D≥1} ≥r– p small ---> n large
– Duncan approach: 50% chance of detecting a process shift, i.e. p1=p0+δ (δ>0). P{x>UCL| p1}=0.5
− δ small⇒ n large
– a positive lower control limit
)p1(pLn2
−⎟⎠⎞
⎜⎝⎛
δ=
round n to integer2L
pp1n −
>

193J. Shi, the University of Michigan, [email protected], 734-763-5321(O)
Variable Sample Size• Variable width of control limits
corresponding to each sample size– not appropriate for nonrandom pattern check
• Constant width of control limits using average sample size– future sample size should not differ greatly
• Standardized Control Chart– can be used to check a nonrandom pattern– no reference to the actual process fraction defective
ip
ip n
)p1(p3pLCL;n
)p1(p3pUCLii
−−=
−+=
nsobservatioof#totaldefectsof#total
n
Dp m
1ii
m
1ii
==
∑
∑
=
=
m
nn
m
1ii∑
==
0CL;3LCL;3UCL;pp;
n)p1(p
ppZ
i
ii =−===
−−
=
MEAN 0.223
LWL
UWL
LCL
UCL
0
0.1
0.2
0.3
0.4
0.5
Def
ects
0 10 20 30
Row Numbers
P Chart Using Cricketgraph III
Remarks: Use Approaches 1 and 3 together (Example, Table 6-4, Figs. 6-6, 6-7, 6-8; P299-P301)
194J. Shi, the University of Michigan, [email protected], 734-763-5321(O)
Table 6-4, P267I n(i) D(i) pi=D(i)/n(i) sigma=sqrt(pbar*(1-pbar)/n(i)) LCL (ni) UCL(ni) LCL (n bar) UCL(n bar) Zi LCL(stand)UCL(stand)1 100 12 0.120 0.029 0.007 0.184 0.007 0.185 0.81 -3 32 80 8 0.100 0.033 0.000 0.194 0.007 0.185 0.12 -3 33 80 6 0.075 0.033 0.000 0.194 0.007 0.185 -0.64 -3 34 100 9 0.090 0.029 0.007 0.184 0.007 0.185 -0.20 -3 35 110 10 0.091 0.028 0.011 0.180 0.007 0.185 -0.18 -3 36 110 12 0.109 0.028 0.011 0.180 0.007 0.185 0.47 -3 37 100 11 0.110 0.029 0.007 0.184 0.007 0.185 0.48 -3 38 100 16 0.160 0.029 0.007 0.184 0.007 0.185 2.17 -3 39 90 10 0.111 0.031 0.003 0.188 0.007 0.185 0.49 -3 310 90 6 0.067 0.031 0.003 0.188 0.007 0.185 -0.94 -3 311 110 20 0.182 0.028 0.011 0.180 0.007 0.185 3.06 -3 312 120 15 0.125 0.027 0.015 0.176 0.007 0.185 1.08 -3 313 120 9 0.075 0.027 0.015 0.176 0.007 0.185 -0.78 -3 314 120 8 0.067 0.027 0.015 0.176 0.007 0.185 -1.09 -3 315 110 6 0.055 0.028 0.011 0.180 0.007 0.185 -1.48 -3 316 80 8 0.100 0.033 0.000 0.194 0.007 0.185 0.12 -3 317 80 10 0.125 0.033 0.000 0.194 0.007 0.185 0.88 -3 318 80 7 0.088 0.033 0.000 0.194 0.007 0.185 -0.26 -3 319 90 5 0.056 0.031 0.003 0.188 0.007 0.185 -1.30 -3 320 100 8 0.080 0.029 0.007 0.184 0.007 0.185 -0.54 -3 321 100 5 0.050 0.029 0.007 0.184 0.007 0.185 -1.56 -3 322 100 8 0.080 0.029 0.007 0.184 0.007 0.185 -0.54 -3 323 100 10 0.100 0.029 0.007 0.184 0.007 0.185 0.14 -3 324 90 6 0.067 0.031 0.003 0.188 0.007 0.185 -0.94 -3 325 90 9 0.100 0.031 0.003 0.188 0.007 0.185 0.13 -3 3
sum 2450 234average 98 pbar= 0.096
p bar=total defective/total samples
Fig 6-6 control chart with variable sample size
0.0
0.1
0.2
0.3
1 4 7 10 13 16 19 22 25
sample index
p
0.0
0.1
0.1
0.2
0.2
0.3
1 4 7 10 13 16 19 22 25
p
standardized control chart
-4.0-3.0-2.0-1.00.01.02.03.04.0
1 4 7 10 13 16 19 22 25 28
index
zi
195J. Shi, the University of Michigan, [email protected], 734-763-5321(O)
np Control Chart (The number of nonconforming items)
Rather than plotting the fraction nonconforming, we plot the number ofnonconforming items with an “np Chart”:
UCLX = np + 3 np(1–p) Center line = npLCLX = np – 3 np(1–p)
• This chart, too, can be "standardized", adjusted for unequal ni
, etc.
nsobservatioof#totaldefectsof#total
n
DP m
1ii
m
1ii
==
∑
∑
=
=pp =
Example 6-2, P298
196J. Shi, the University of Michigan, [email protected], 734-763-5321(O)
Example: The number of transmission cases that required deburring in a 16-day sample of 100 each was as follows:
Day Number Day Number1 5 9 42 4 10 63 3 11 154 2 12 45 6 13 56 3 14 77 9 15 38 6 16 6
Prepare an np chart with trial control limits. Assume that any points plotting out of control have assignable causes, and continue to refine the control limits until no points plot out of control.

197J. Shi, the University of Michigan, [email protected], 734-763-5321(O)
I Di UCL(trial) LCL(trial) UCL LCL1 5 12.34 0 11.32 0.002 4 12.34 0 11.32 0.003 3 12.34 0 11.32 0.004 2 12.34 0 11.32 0.005 6 12.34 0 11.32 0.006 3 12.34 0 11.32 0.007 9 12.34 0 11.32 0.008 6 12.34 0 11.32 0.009 4 12.34 0 11.32 0.00
10 6 12.34 0 11.32 0.0011 15 12.34 0 11.32 0.0012 4 12.34 0 11.32 0.0013 5 12.34 0 11.32 0.0014 7 12.34 0 11.32 0.0015 3 12.34 0 11.32 0.0016 6 12.34 0 11.32 0.00
sum 88 UCL(trial) LCL(trial)p bar=88/(100*16)= 0.055 12.34 -1.34 set to zeronp 5.500eliminate point 11pbar=(88-15)/(100*15) 0.048667 UCL LCLnp 4.866667 11.32 -1.59 set to zero
np chart with trial control limits
0.0
5.0
10.0
15.0
20.0
1 3 5 7 9 11 13 15
np chart after eliminate outliers
0.0
5.0
10.0
15.0
20.0
1 3 5 7 9 11 13 15
Di
UCL(trial)LCL(trial)UCL
LCL
198J. Shi, the University of Michigan, [email protected], 734-763-5321(O)
np Chart Properties
• Advantage– np chart is a scaling of the vertical axis by the constant n,
provide the same information as p chart– np chart needs less calculation ( no need to calculate Di/ni)– often used when n is constant and p is small
• Limitation– not easy for interpretation when n is varied (UCL LCL and Ctr
line all vary)– only plot # of defects without considering sample size, hard to
take action
199J. Shi, the University of Michigan, [email protected], 734-763-5321(O)
Example #8: (Textbook Exercise 6-15) A control chart is used to control the fraction nonconforming for a plasticpart manufactured in an injection molding process. Ten subgroups yield the following data:
Sample Number Sample Size No. Nonconforming1 100 102 100 153 100 314 100 185 100 266 100 127 100 258 100 159 100 810 100 8
a. Set up a control chart for the number nonconforming in samples of n = 100.b. For the chart established in part (a), what is the probability of detecting a shift in the process fractionnonconforming to 0.30 on the first sample after the shift has occurred?
200J. Shi, the University of Michigan, [email protected], 734-763-5321(O)
OC Curve and ARL
• Type II error for the p chart (OC curve see Fig 6-11, P307)
• ARL0=ARLin-control=1/α• ARL1=ARLout-of-control=1/(1-β)
}|{}|{}|ˆ{}|ˆ{ 1111 pnLCLDPpnUCLDPpLCLpPpUCLpP pppp ≤−<=≤−<=β

201J. Shi, the University of Michigan, [email protected], 734-763-5321(O)
Example (Textbook Exercise 6-20) Consider the control chart in Exercise 6-18. Find the average run length if the process fraction nonconforming shifts to 0.20.
202J. Shi, the University of Michigan, [email protected], 734-763-5321(O)
• Why need it?– Control the total number of nonconformities in a sample or the
average number of nonconformities per unit• nonconformity/defect: a specification of the quality characteristic is not
satisfied result in a defect or nonconformity, e.g., – weld spots on a car– paint dent on a car body
• A unit may not be “nonconforming”, even though it has several nonconformities. So, nonconforming ≠defects or nonconformities
• Assumption: The occurrence of nonconformities in samples of constant size is well modeled by the Poisson distribution.
– The number of potential location for nonconformities is the infinitely large, and the probability of occurrence of a nonconformity at any location is small and constant
Control Charts for Nonconformities (Defects)- C and U Charts
203J. Shi, the University of Michigan, [email protected], 734-763-5321(O)
Statistical Basis of Control Charts for Nonconformities (Defects)
- c and u ChartsLet X = total # of defects in a sample
Assume X ~ Poisson ( E(X) = C )For large C ⇒ X ~ N ( E(X) = C , Var(X) = C )
Further, suppose that a sample size of n inspection units(e.g. 100 yd2 , 144 microprocessors, 1100 employees)Note: n is not necessarily integer.Then, Y = average # of defects per unit in a sample = X / n
E ( Y ) = C / n = UVar ( Y ) = C / n2 = U / n
Note: C vs. U distinction is similar to X vs X–
common in "normal" analyses
• c chart: total number of defects in a sample • u chart: average number of defects per unit in a sample size of n inspection units
X=0,1,2,...
204J. Shi, the University of Michigan, [email protected], 734-763-5321(O)
Control Charts for Nonconformities (Defects)- c Chart
• Control limits for the c chart with a known c
• If unknown c, c is estimated from preliminary samples of inspection units for constructing trial control limits
• The preliminary samples are examined by the control chart using the trial control limits for checking out-of-control points
Example 6-3, P310
c3cUCL
cCLc3cLCL
+=
=+=
If LCL<0, set LCL=0
samplesofnumbersamplesallindefectsof#total
m
ccc
m
1ii
===∑
=

205J. Shi, the University of Michigan, [email protected], 734-763-5321(O) 206J. Shi, the University of Michigan, [email protected], 734-763-5321(O)
207J. Shi, the University of Michigan, [email protected], 734-763-5321(O)
Control Charts for Nonconformities Per Unit- u Chart
• c: total nonconformities in a sample of n inspection units (n is not necessary be integer)
• u: average # of nonconformities per inspection unit in a sample
• If unknown u, is estimated from preliminary samples of inspection units for constructing trial control limits
Example 6-4, P317
nu3uUCL
uCLnu3uLCL
+=
=
−=
m
uu;
ncu
m
1ii
i
ii
∑===
u
208J. Shi, the University of Michigan, [email protected], 734-763-5321(O)
Variable Sample Size of Control Charts for Nonconformities
• If sample size varies, it is always to use a u chart rather than a c chart
• Approaches– Control limits varies with each sample size, but the center
line is constant
– Use a control limits based on an average sample size
– Use a standardized control chart (this is preferred option), with UCL=3, LCL=-3, Center line=0.
• This chart can be used for pattern recognition
uCL;nu3uUCL;
nu3uLCL
ii
=+=−=
m
nn
m
1ii∑
==
i
ii
nu
uuZ −=
Example 6-5, P319
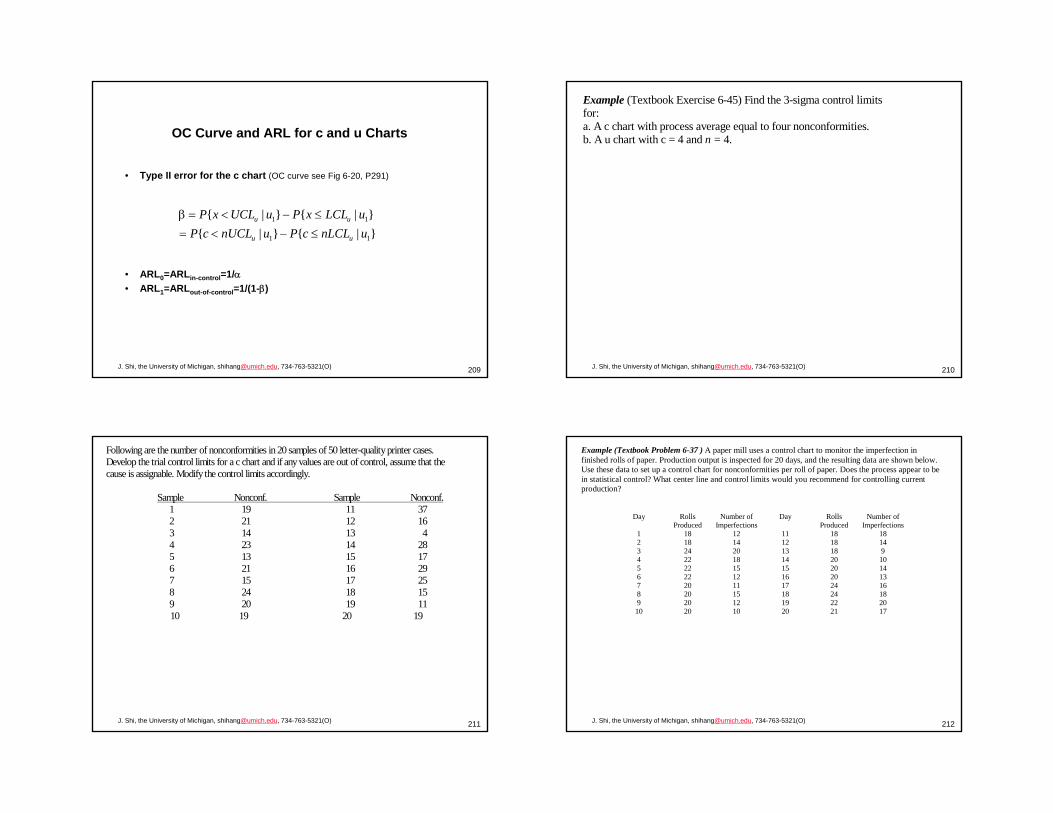
209J. Shi, the University of Michigan, [email protected], 734-763-5321(O)
OC Curve and ARL for c and u Charts
• Type II error for the c chart (OC curve see Fig 6-20, P291)
• ARL0=ARLin-control=1/α• ARL1=ARLout-of-control=1/(1-β)
}|{}|{}|{}|{
11
11
unLCLcPunUCLcPuLCLxPuUCLxP
uu
uu
≤−<=≤−<=β
210J. Shi, the University of Michigan, [email protected], 734-763-5321(O)
Example (Textbook Exercise 6-45) Find the 3-sigma control limitsfor:a. A c chart with process average equal to four nonconformities.b. A u chart with c = 4 and n = 4.
211J. Shi, the University of Michigan, [email protected], 734-763-5321(O)
Following are the number of nonconformities in 20 samples of 50 letter-quality printer cases.Develop the trial control limits for a c chart and if any values are out of control, assume that thecause is assignable. Modify the control limits accordingly.
Sample Nonconf. Sample Nonconf.1 19 11 372 21 12 163 14 13 44 23 14 285 13 15 176 21 16 297 15 17 258 24 18 159 20 19 1110 19 20 19
212J. Shi, the University of Michigan, [email protected], 734-763-5321(O)
Day RollsProduced
Number ofImperfections
Day RollsProduced
Number ofImperfections
1 18 12 11 18 182 18 14 12 18 143 24 20 13 18 94 22 18 14 20 105 22 15 15 20 146 22 12 16 20 137 20 11 17 24 168 20 15 18 24 189 20 12 19 22 2010 20 10 20 21 17
Example (Textbook Problem 6-37 ) A paper mill uses a control chart to monitor the imperfection infinished rolls of paper. Production output is inspected for 20 days, and the resulting data are shown below.Use these data to set up a control chart for nonconformities per roll of paper. Does the process appear to bein statistical control? What center line and control limits would you recommend for controlling currentproduction?

213J. Shi, the University of Michigan, [email protected], 734-763-5321(O)
Example (Textbook Problem 6-56) A control chart is to be established on a process producingrefrigerators. The inspection unit is one refrigerator, and a control chart for nonconformities is tobe used. As preliminary data, 16 nonconformities were counted in inspecting 30 refrigerators.
a. What are the 3-sigma control limits'?b. What is the α-risk for this control chart?c. What is the β-risk if the average number of defects is actually 2 (i.e., if c = 2.O)?d. Find the average run length if the average number of defects is actually 2.
214J. Shi, the University of Michigan, [email protected], 734-763-5321(O)
Chapter 8 - CUSUM and EWMA Control Charts
• Why need them– CUSUM chart– EWMA chart – Weighted/Moving Average chart
• What are they?• How to set up the control limits?
215J. Shi, the University of Michigan, [email protected], 734-763-5321(O)
Needs for CUSUM and EWMA Control Charts
Why? ... To expedite detection of a small mean shift in the process.
• Shewhart chart – takes a long time to detect a small mean shift (shift<1.5σ)
• only uses the information about process contained in the last plotted point and ignores any information given by the entire sequence of points
– is not suitable for the sample with a single observation
• Shewhart chart with other supplemental sensitizing rules– can increase detection sensitivity but reduce simplicity and ease
of interpretation of the Shewhart control chart
216J. Shi, the University of Michigan, [email protected], 734-763-5321(O)
What is CUSUM Control Chart?
• The CUSUM chart is the “most powerful chart” for detecting a small mean shift in the process, which was first proposed by Page (1954).
• CUSUM chart: directly incorporates all the information in the sequence of sample values by plotting the cumulative sums (CUSUM) of deviations of the sample values from a target value
– : the average of the jth sample– µ0: the target for the process mean– Ci: the cumulative sum up to and including the ith sample– n≥1: cusum could be constructed for individual observations
∑=
µ−=i
1j0ji )x(C
jx

217J. Shi, the University of Michigan, [email protected], 734-763-5321(O)
Interpretation of the CUSUM chart
• µ=µ0, Ci is a random walk with mean zero• µ>µ0, Ci is an upward drift trend• µ<µ0, Ci is a downward drift trend
Remark: a trend of Ci is an indication of the process mean shift.
)x(C)x()x()x(C 0i1i0i
1i
1j0j
i
1j0ji µ−+=µ−+⎥
⎦
⎤⎢⎣
⎡µ−=µ−= −
−
==∑∑
218J. Shi, the University of Michigan, [email protected], 734-763-5321(O)
Example #1: Consider the following tension test data. This process has a mean increase at sample 20, do you see it?
219J. Shi, the University of Michigan, [email protected], 734-763-5321(O)
The process mean in this case could be modeled as: µ1=µ + δσ
UCL
LCL
µµ + δσ
X
t
220J. Shi, the University of Michigan, [email protected], 734-763-5321(O)
∑=
−=i
0jji )10X(C

221J. Shi, the University of Michigan, [email protected], 734-763-5321(O)
How to Construct a CUSUM Control Chart?
• Monitor the mean of a process :– Tabular (algorithmic) cusum (preferable way)– V-mask form of cusum
• cusum can be constructed for both individual observations and for the averages of rational subgroups.
• For individual observation:
)x(C)x(Cxx 0i1i
i
1j0jiii µ−+=µ−=⇒= −
=∑
222J. Shi, the University of Michigan, [email protected], 734-763-5321(O)
• Statistic / : one side upper/lower cusum– / : accumulate derivations from µo that are greater than K,
with both quantities reset to zero upon becoming negative• K: reference value (allowance or slack value)
– chosen about halfway between the target µo and the out-of-control value of the mean µ1 that we are interested in detecting quickly
• Decision Rules:– If either or exceeds the decision interval H (Generally H=5σ),
the process is considered to be out of control
Construct a CUSUM Control Chart–— Tabular CUSUM
0CC
]Cx)K(,0max[C
]C)K(x,0max[C
00
1ii0i
1i0ii
==
+−−µ=
++µ−=
−+
−−
−
+−
+
+C −C
2||
2K|| 0101
01µ−µ
=δσ
=⇒σ
µ−µ=δ⇒δσ±µ=µ
+C −C
+C −C
Example 8-1, P411
223J. Shi, the University of Michigan, [email protected], 734-763-5321(O)
0CC
]Cx)K(,0max[C
]C)K(x,0max[C
00
1ii0i
1i0ii
==
+−−µ=
++µ−=
−+
−−
−
+−
+
5.022
||K 01 =δσ
=µ−µ
= ; H=5σ=5
HCorHCifcheckto ii >> −+
224J. Shi, the University of Michigan, [email protected], 734-763-5321(O)
Procedures for Construction of CUSUM
• Select K and H:• Construct one side upper and lower cusum and represented in the two
separate columns of the table (Table 8-2, P412)– Calculate xi-(µ0+K) and µ0-K- xi
– Calculate the accumulative derivations and – Count the number of consecutive periods that the cusum or
have been nonzero, which are indicated by N+ and N- respectively
+C −C
22||K 01 δσ=
µ−µ= ; H=5σ
+C −C
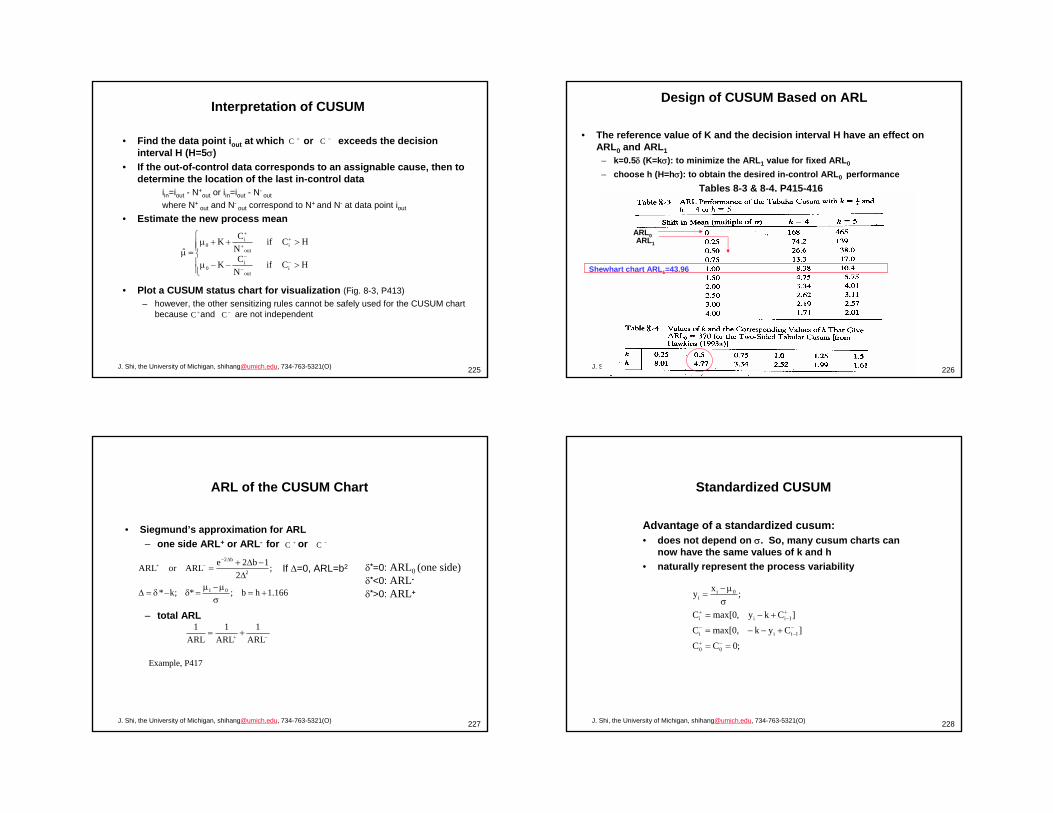
225J. Shi, the University of Michigan, [email protected], 734-763-5321(O)
Interpretation of CUSUM
• Find the data point iout at which or exceeds the decision interval H (H=5σ)
• If the out-of-control data corresponds to an assignable cause, then to determine the location of the last in-control data
iin=iout - N+out or iin=iout - N-
out
where N+ out and N-
out correspond to N+ and N- at data point iout
• Estimate the new process mean
• Plot a CUSUM status chart for visualization (Fig. 8-3, P413) – however, the other sensitizing rules cannot be safely used for the CUSUM chart
because and are not independent
⎪⎪⎩
⎪⎪⎨
⎧
>−−µ
>++µ=µ
−−
−
++
+
HCifNCK
HCifNCK
ˆ
iout
i0
iout
i0
+C −C
+C −C
226J. Shi, the University of Michigan, [email protected], 734-763-5321(O)
Design of CUSUM Based on ARL
• The reference value of K and the decision interval H have an effect on ARL0 and ARL1
– k=0.5δ (K=kσ): to minimize the ARL1 value for fixed ARL0
– choose h (H=hσ): to obtain the desired in-control ARL0 performanceTables 8-3 & 8-4, P415-416
ARL0ARL1
Shewhart chart ARL1=43.96
227J. Shi, the University of Michigan, [email protected], 734-763-5321(O)
ARL of the CUSUM Chart
• Siegmund’s approximation for ARL– one side ARL+ or ARL- for or
– total ARL
166.1hb;*;k*
;2
1b2eARLorARL
01
2
b2
+=σ
µ−µ=δ−δ=∆
∆−∆+
=∆−
−+ If ∆=0, ARL=b2
−+ +=ARL
1ARL
1ARL
1
δ*=0: ARL0 (one side) δ*<0: ARL-
δ*>0: ARL+
Example, P417
+C −C
228J. Shi, the University of Michigan, [email protected], 734-763-5321(O)
Standardized CUSUM
Advantage of a standardized cusum:• does not depend on σ. So, many cusum charts can
now have the same values of k and h• naturally represent the process variability
;0CC
]Cyk,0max[C]Cky,0max[C
;xy
00
1iii
1iii
0ii
==
+−−=
+−=σ
µ−=
−+
−−
−
+−
+

229J. Shi, the University of Michigan, [email protected], 734-763-5321(O)
Improvement of CUSUM
• Fast initial response (FIR): set– If a shift occurred at the beginning, it can detect the shift more quickly
to decrease ARL1
– If in control at the beginning, cusum will quickly drop to zero, little effect on the performance
• Example:µ0=100, K=3, H=12, 50%headstart value
0CC 00 ≠= −+
62/HCC 00 === −+
In-control data µ1=105
230J. Shi, the University of Michigan, [email protected], 734-763-5321(O)
More Discussion on CUSUM
• Rational subgroup: the cusum often work best with n=1– if n>1, replace by , replace σ with
• One side cusum in each direction can be designed differently • CUSUM chart is not as effective as the Shewhart chart in detecting
large shifts– combined cusum-Shewhart procedure (Shewhart limits use
3.5σ) can improve the ability of detecting larger shifts, and has only slightly decreased ARL0 (Table 8-5, P418).
n/x σ=σix ix
231J. Shi, the University of Michigan, [email protected], 734-763-5321(O)
CUSUM for Monitoring Process Variability
• Create a new standardized quantity (Hawkins, 1981,1993), which is sensitive to variance changes.
• In-control distribution of νi is approximately N(0,1)
• Selection of h and k and the interpretation of cusum are similar to the cusum for controlling the process mean
]Sk,0max[S
]Sk,0max[S
;xy);1,0(N~;349.0
822.0|y|
1iii
1iii
0iii
ii
−−
−
+−
+
+ν−−=
+−ν=σ
µ−=ν
−=ν
232J. Shi, the University of Michigan, [email protected], 734-763-5321(O)
EXPONENTIALLY WEIGHTED MOVING AVERAGE (EWMA)
• To exponentially forget the past data, we want to attach more weight to the most recent data
• It is a weighted average: “a geometric series of weights”
0i
ji
1i
0j
ji Z)1(X)1(Z λ−+λ−λ= −
−
=∑
XZ;Z)1(XZ 001iii =µ=λ−+λ= −
0<λ≤1, Z0=µ0
Assume xt are independent random variables, with E(xt)=µ0, Var(xt)=σ2

233J. Shi, the University of Michigan, [email protected], 734-763-5321(O)
Var (Zt ) = ⎝⎜⎛
⎠⎟⎞σ2
n ⎝⎜⎛
⎠⎟⎞λ
2–λ ⎝⎛ ⎠⎞1 – (1 – λ)2t
As t becomes large:
Var (Zt ) = ⎝⎜⎛
⎠⎟⎞σ2
n ⎝⎜⎛
⎠⎟⎞λ
2–λ
• Note: for λ=1 we have Shewhart Chart.
In general,
UCLZt = µ0 + L σ ])1(1[
n)2(t2λ−−
λ−λ
LCLZt = µ0 – L σ ])1(1[
n)2(t2λ−−
λ−λ
How to Construct a EWMA Chart?
CL=µ0
Note : Different from the textbook, here we use the sample averages (n>1) rather than the individual samples (n=1)
(from Eq. 8-21)
Assume xt are independent random variables, with E(xt)=µ0, Var(xt)=σ2
234J. Shi, the University of Michigan, [email protected], 734-763-5321(O)
UCLZt = µ0+ L σ ])1(1[
n)2(t2λ−−
λ−λ
LCLZt = µ0 – L σ ])1(1[
n)2(t2λ−−
λ−λ
XZ;Z)1(XZ 001iii =µ=λ−+λ= −
n=1
235J. Shi, the University of Michigan, [email protected], 734-763-5321(O)
Design of EWMA Control Chart
• Selection of parameters: L and λ– Affect the ARL performance (see Table 8-10, P431)– Smaller λ to detect smaller shift
• recommend to use 0.05≤λ≤0.25, especially, λ=0.05, 0.10, 0.20)
– Generally L=3, but for small λ≤0.1, L=2.6~2.8 • approximately ARL0=500, ARL1=10.3 for detection of 1σ shift
ARL0
ARL1
Shewhart chart ARL1=43.96
σ
236J. Shi, the University of Michigan, [email protected], 734-763-5321(O)
Performance of EWMA Control Chart
• Compared to Shewhart chart and CUSUM chart, EWMA chart is– effective on detection of small mean shifts like CUSUM, – less effective on larger shift detection than the Shewhart chart,
but generally superior to the CUSUM chart (particularly if λ>0.1)
• EWMA is very insensitive to the normality assumption. So, it is an ideal control chart for individual observations.
Recommendation:To combine the Shewhart chart with the EWMA and use a wider control limits ( L=3.25 or 3.5) for the Shewhart chart

237J. Shi, the University of Michigan, [email protected], 734-763-5321(O)
EWMA for Monitoring Process Variability
• The exponentially weighted mean square error (EWMS)
• For larger i and independent observation, it follows the chi-square distribution with (2- λ)/ λ degrees of freedom and
• Construct exponentially weighted root mean square (EWRMS) control chart to check data point in-control or not.
• To be insensitive to process mean change, it is suggested to replace µ with zi (a prediction of xi+1)
21i
2i
2i S)1()x(S −λ−+µ−λ=
22i )S(E σ=
2iS
νχ
σ=
νχ
σ=
α−ν
αν
2/1,0
2/,0
LCL
UCL
),(N~x 2i σµ
i1i zx =+
238J. Shi, the University of Michigan, [email protected], 734-763-5321(O)
Extension of EWMA
• EWMA for time i is equal to the EWMA for time i-1 plus a fraction λof the forecast error of the mean shift at time i
• More general expression is:
i1iii1i1ii1i1iii ez)xx(z)zx(zz)1(xz λ+=−λ+=−λ+=λ−+λ= −−−−−
1ii zx −= iii xxe −=
i3
i
1jj2i11ii eeezz ∇λ+λ+λ+= ∑
=−
proportional Integral First differentialPredication at i+1
i1i zx =+
One time ahead predication
Remarks: Generally, zi is plotted at time period i+1 on the EWMA control chart
239J. Shi, the University of Michigan, [email protected], 734-763-5321(O)
Moving Average Control Charts
• Different from EWMA, use an unweighted moving average Mt = ( X t + X t-1 + X t-2 +...+ X t-w+1) / w • This window of size, w, incorporates some of the memory of
the past data information by dropping the oldest data and adding the newest data
240J. Shi, the University of Michigan, [email protected], 734-763-5321(O)
Construct Moving Average Control Charts
• The moving averatge can be written recursively as,
Mt = Mt-1 + ( X t – X t-w)/w
w = window size, n = # samples in X
Var (Mt ) = 1w2 • ∑
i=t-w+1
t Var( X i) =
σ2
nw
UCL Mt = µ + 3
σnw
LCL Mt = µ - 3
σnw
Remarks: The window size of w and the magnitude of the shift of interest are inversely related.
in30 ⋅
σ±µ
At the beginning, if i<w

241J. Shi, the University of Michigan, [email protected], 734-763-5321(O)
in30 ⋅
σ±µ
UCL Mt = µ + 3
σnw
LCL Mt = µ - 3
σnw
n=1
242J. Shi, the University of Michigan, [email protected], 734-763-5321(O)
Example 4 : Compare MA and X-bar Chart
Let w = 4, suppose process shifts from µ to µ + σn
Pr(detect) = Pr( X > µ0 +3 σn | µ = µ0 +
σn ) = Pr (z > 2) = .0227
• for Shewhart Chart (this value does not change from sample to sample)
Pr(detect) = Pr (Mt > UCL Mt | µ = µ0 +
σn )
• for Moving Average Chart (this value changes from sample to sample since,
E(Mt) = 1w {(µ + σn
)+ (w-1) µ} [for 1st sample]
= 1w {2(µ + σn )+ (w-2) µ} [2nd sample]
= 1w {w(µ + σn
)+ (w-w) µ} [wth sample]
243J. Shi, the University of Michigan, [email protected], 734-763-5321(O)
Ch 9 Other Univariate Statistical Process Monitoring and Control Techniques
244J. Shi, the University of Michigan, [email protected], 734-763-5321(O)
9-1 SPC for Short and Small Production Runs
I. Why Need Short/Small Run SPC?
• Job shops• Batch processes• Large, unique products (e.g., Hubble Space Telescope, Space Shuttles)• Start-up processes, new machines, new production systems, new products• Flexible manufacturing, Just-In-Time inventory control systems, and numerically
controlled processes with build-to-order production schedules• Teaching/learning processes• Many non-traditional applications of SPC where the prior knowledge of the
system/process is not available and one wants to monitor/control the process assoon as possible.

245J. Shi, the University of Michigan, [email protected], 734-763-5321(O)
What do we mean by Short and Small Runs?
• Short Run: the time between different jobs/product types is short– It is an environment that has a large number of jobs per operator in a
production cycle (typically a week or month), with each job involving different products. (e.g., automobile maintenance shops)
• Small Run: the number of the same product type is small– It is a situation in which only a very few products of the same type are
to be produced (e.g., space shuttles).• An example of short and small run
– The computer numerical control (CNC) machines in an aerospace firm producing only a small number of guided missiles each month.
• Short runs need not be small runs– a can manufacturing line can produce more than 100,000 cans in an
hour or two.• Small runs are not necessarily short runs
– One wing of an aircraft may requires hundreds of machining hours.
246J. Shi, the University of Michigan, [email protected], 734-763-5321(O)
X-Bar and R Chart for Short Production Run— Simplest Technique: Deviation from Nominal (DNOM)
• A particular process/product characteristic can be identified for our SPC purposes. If the following assumptions hold for that parameter, we can use deviation from nominal (DNOM) (xi=measurementi - targetproduct) as the process characteristic to construct control charts as we did before.– Process standard deviation across different product types is
approximately the same (otherwise, use a standardized control chart).– The nominal specification is the desired target value for the process.– More than twenty samples (after aggregation) have been collected– assumptions for a general X bar or R chart hold
• The assumption of a normal distribution holds• DNOM is IID for different nominal values• constant sample size constrained for the R chart
Note: It is customary to use a division line to separate different products on the control charts (see Fig. 8-1 P351, Data Table 8-1 P350)
247J. Shi, the University of Michigan, [email protected], 734-763-5321(O)
Review of Previous Variable Charts
Charts Advantages Disadvantagesx and R charts Easy to
construct/implementEasy to interpret
Not sensitive to small shiftsNeed lots of dataNeed prior knowledge
Cusum charts Sensitive to small shifts Difficult to construct/implementDifficult to interpretNeed prior knowledge
EWMA charts Sensitive to small shiftsProvide “predictive” info.
Difficult to construct manuallyNeed prior knowledge
248J. Shi, the University of Michigan, [email protected], 734-763-5321(O)
Standardized Variable Control Chartsfor Short Runs
• Let and Ti be the average range and nominal value of x for part i
• Plot Rs on a standardized R chart with control limits at LCL=D3and UCL=D4
• Plot on a standardized x-bar chart with control limits at LCL=-A2 and UCL=A2
• Use traditional sensitizing rules to detect out-of-control signals
iR
is R/RR =
sx
i
is
RTxx −
=
• Why need it?If process standard deviation across different product types isdifferent, the general DNOM chart is not appropriate
Analysis procedures:

249J. Shi, the University of Michigan, [email protected], 734-763-5321(O)
Standardized Attribute Control Chartsfor Short Runs
ip
ipn
ic
iu
p
pn
c
u
n/)p1(p −
)p1(pn −
cn
n/u
n/)p1(pppZ i
i −−
=
)p1(pnpnpnZ i
i −−
=
cccZ i
i−
=
n/uuuZ i
i−
=
Attribute Target Value
StandardDeviation
Statistic to plot on the control chart
250J. Shi, the University of Michigan, [email protected], 734-763-5321(O)
• Cusum and EWMA control charts with n=1• Modified DNOM (error reported as percentage of the reading) • Q chart (other transform)• Kalman filter
Some Other Methods
251J. Shi, the University of Michigan, [email protected], 734-763-5321(O)
Some Useful References
1. Castillo, E.D. and Montgomery, D.C. (1994) Short-Run Statistical ProcessControl: Q-Chart Enhancements and Alternative Methods, Quality and ReliabilityEngineering International, 10(2) 87-97.
2. Farnum, N.R. (1992) Control Charts for Short Runs: Nonconstant Process andMeasurement Error. Journal of Quality Technology, 24(3) 138-144.
3. Foster, G. (1988) Implementing SPC in Low Volume Manufacturing. 1988 AnnualQuality Congress Transactions, Milwaukee, WI: ASQC. pp. 261-267.
4. Hillier, F.S. (1969) X and R -Chart Control Limits Based on a Small Number ofSubgroups, Journal of Quality Technology, 1(1) 17-26.
5. Holmes, D. (1990) SPC Techniques for Low-Volume Batch Processes. CeramicBulletin, 69(5) 818-821.
6. Proschan F. and Savage, I.R. (1960) Starting a Control Chart, Industrial QualityControl, Sep, 1960, 12-13.
7. Pyzdek, T. (1993) Process Control for Short and Small Runs. Quality Progress,26(4) 51-60.
8. Quesenberry, C.P. (1991) SPC Q Charts for Start-Up Processes and Short or LongRuns. Journal of Quality Technology, 23(3), 213-224.
9. Quesenberry, C.P. (1991) SPC Q Charts for A Binomial Parameter P: Short orLong Runs. Journal of Quality Technology, 23(3), 239-246.
10. Quesenberry, CP.. (1991) SPC Q Charts for A Poisson Parameter λ: Short orLong Runs. Journal of Quality Technology, 23(4), 296-303.
11. Wheeler, D.J. (1991) Short Run SPC. Knoxville, Tennessee: SPC Press, Inc.
252J. Shi, the University of Michigan, [email protected], 734-763-5321(O)
Section 9-4 SPC With AutoCorrelated Process Data
Why need to study it?– Less defects rates and high quality require
100% inspection. This generally results in correlated inspection data.
– Recently the sensing techniques and computer capacity become more powerful, thus, 100% inspection becomes more important.
– Applications: • Autobody assembly process using OCMM (perceptron) • Painting process using interferometer (Autospec)• Semiconductor using optical/image measurement

253J. Shi, the University of Michigan, [email protected], 734-763-5321(O)
Example• Sampling one out of every five products: individual x and moving R chart.
sequence # x mR
1 29.336 32.68 3.35
11 28.94 3.7416 27.63 1.3121 30.80 3.1726 33.22 2.4231 29.04 4.1836 30.29 1.2541 32.43 2.1446 28.12 4.3151 27.99 0.1356 28.78 0.7961 33.61 4.8366 25.12 8.4971 32.01 6.8976 24.28 7.7381 28.17 3.8986 16.56 11.6191 26.14 9.5896 31.68 5.54
Average 28.841 4.492
254J. Shi, the University of Michigan, [email protected], 734-763-5321(O)
Based on Data to Construct Control Charts
• The traditional way of constructing the control charts and control limits:
(1) Individual x chart:UCL = 28.841 + 3(4.492)/1.128 = 40.788
CL = 28.841LCL = 28.841 - 3(4.492)/1.1.28 = 16.894
(2) Moving R chart:UCL = 4.492(3.267) = 14.675
CL = 4.492LCL = 0
16.89
28.84
40.79
1 11 21 31 41 51 61 71 81 91
individual x chartUCL
CL
LCL
0
2
4
6
8
10
12
14
16
6 16 26 36 46 56 66 76 86 96
moving R chart
UCL
CL
LCLWe could do lots of things with the data(estimate process mean, process variation,process stability, process capability, etc.)
255J. Shi, the University of Michigan, [email protected], 734-763-5321(O)
Suppose, due to a breakthrough of the inspection technology, 100% inspection becomes feasible. Allthe parts are measured:
sequence # x mR
1 29.332 19.98 9.353 25.76 5.784 29 3.245 31.03 2.036 32.68 1.657 33.56 0.888 27.50 6.069 26.75 0.7510 30.55 3.8011 28.94 1.6112 28.50 0.44• • •• • •
95 31.95 0.4296 31.68 0.2797 29.10 2.5898 23.15 5.9599 26.74 3.59
100 32.44 5.70average 28.569 3.212
256J. Shi, the University of Michigan, [email protected], 734-763-5321(O)
Comparison Results
• Compare the estimated process parameters from two data sets:The estimated process standard deviations are very different!
• Why are they different? Is this purely a coincidence? Which one should we use?
sampled data complete data
x 28.841 28.569
R 4.492 3.212R /d2 3.982 2.848
15
25
35
45
1 11 21 31 41 51 61 71 81 91
UCL
LCL
CL
Using sampled data to estimate the parameters
15
25
35
45
1 11 21 31 41 51 61 71 81 91
UCL
LCL
CL
Using complele data to estimate the parameters

257J. Shi, the University of Michigan, [email protected], 734-763-5321(O)
Autocorrelation
• What is autocorrelation?– Some times called serial correlation– Autocorrelation describes the dependence of data over
time – Recall one of the basic assumptions for Shewhart
charts to work is data independence. This assumption would usually hold if the products are being sampled.
– It is important to recognize, however, that all manufacturing processes are driven by inertial elements, and when the interval between samples becomes small relative to these forces, the observations on the process will be correlated over time.
258J. Shi, the University of Michigan, [email protected], 734-763-5321(O)
Mathematical Definition of Autocorrelation
• The correlation over a series of time-oriented observations is measured by the autocorrelation functions:
– where the covariance of observations is k times periods apart. We have assumed that the observations have constant variance.
• All autocorrelation functions are bounded by [-1, 1].
• The sample autocorrelation functions are:
( )( ) ,...2,1,0k;xV
x,xcov
t
kttk ==ρ − 10 =ρ
( )( )
( ),...2,1,0k;
xx
xxxxˆ
n
1t
2t
n
1ktktt
k =−
−−=ρ
∑
∑
=
+=−
259J. Shi, the University of Michigan, [email protected], 734-763-5321(O)
How to determine if the data are autocorrelated?
There are several ways of checking autocorrelations.1) Graphical method: Scatter plot
– Just plot xt vs xt-1 and visually inspect if there is any correlation. In our example, we can have scatter plots for both the sampled and the complete data:
0
10
20
30
40
0 10 20 30 40
x(t)
x(t-5)
Scatter plot of the sampled data. No autocorrelation
0
10
20
30
40
0 10 20 30 40
x(t)
X(t-1)
Scatter Plot of the complete data. Autocorrelation exists.
260J. Shi, the University of Michigan, [email protected], 734-763-5321(O)
How to determine if the data are autocorrelated?
2) Numerical method: Sample autocorrelation functions• Determine the sample autocorrelation functions for our sample data
using Excel's CORREL function. • In a cell of your choice, type:
– CORREL(array1,array2)– where array1 is the cell range of the data except the first entry, x(1)
and array2 is the cell range of the data except the last entry, x(100).

261J. Shi, the University of Michigan, [email protected], 734-763-5321(O)
• The autocorrelation for the above example:(sampled data) = 0.018; (complete data) = 0.510
Yes! Autocorrelation does play an important role in this particular process.
• What about the order of the autocorrelation function, k?– We can compute the second and higher-order sample
autocorrelation functions: In our example, we can use the function, CORREL to compute by assigning x(1) ~ x(98) as array1 and x(3) ~ x(100) as array2.
– After getting a series of , we can plot them on a column chart:
1ρ 1ρ
( )( )
( )∑
∑
=
=−
−
−−=ρ n
1t
2t
n
3t2tt
2
xx
xxxxˆ
2ρ
-1.0
0.0
1.0
1 2 3 4 5
Sample autocorrelation functions, rho(k)
lag, k
262J. Shi, the University of Michigan, [email protected], 734-763-5321(O)
How large an autocorrelation function is large?
• A simple rule of thumb: any absolute sample autocorrelations, , greater than are large
that is, they are statistically significant, with α= 0.05 roughly).
• In our example, n = 100, is the boundary.
kρ
n ns,observatio ofnumber 2
2.0n/2 =
-1.0
-0.20.00.2
1.0
1 2 3 4 5
Sample autocorrelation functions, rho(k)
lag, k
263J. Shi, the University of Michigan, [email protected], 734-763-5321(O)
When should consider autocorrelation? • Dynamic systems:
– A dynamic system is one that experiences a memory effect in response to the external disturbances to the system.
– A dynamic system can be analyzed and described in a continuous time frame or a discrete time frame in terms of the transfer functions. If a discrete time frame is being used, the data being recorded with a small time interval usually have very strong autocorrelation.
• Static systems: – on the other hand, is one that does not remember its past behavior and
response to the external disturbances instantaneously. If the external disturbances are purely random variables (i.e., white noises, asmechanical engineers call them), the system output would be just a series of independent random numbers. No autocorrelation would be observed, the traditional control charts would work just well.
• Sampling intervals:– When the sampling intervals get larger and larger, the autocorrelation,
even if it exists, will gradually disappear in the data. We use system time constant to characterize the time a system takes to reach a new state after being “excited”. (e.g., the time you have to wait when taking your body temperature.) If, in an intuitive sense, the sampling interval is longer than the system time constant, one would not expect to detect autocorrelation in the observed data. This was exactly what happened in our example.
264J. Shi, the University of Michigan, [email protected], 734-763-5321(O)
How to analyze data with autocorrelation?
(1) The statistician’s approach• Worst suggestion: Increase sampling intervals to avoid autocorrelations.
– Why not good? It is counter-evolutionary. Even though autocorrelation complicates our data analysis procedure, we should not just throw away the important information about the system dynamics and go back to the “good old days” in which everything was assumed IID normal.
• Expand the control limits to compensate for the underestimation of the process variance.
– If the sample first-order autocorrelation function is roughly between -0.5 and +0.5, Hunter (1988) suggests the following modified control limits:
nˆ)1n(21
nˆ
3xUCL 12 ρ−
+σ′
+=n
ˆ)1n(21nˆ
3xLCL 12 ρ−
+σ′
−=
where ˆ ′ σ =R d2
is the standard deviation estimated from the range chart, and n is
the sample size. If n = 1 (for the individual x chart) use n = 2 in the second squareroot.

265J. Shi, the University of Michigan, [email protected], 734-763-5321(O)
In the example:
08.3951.0185.2357.28n
ˆ)1n(21nˆ
3xUCL 12
=+××+=ρ−
+σ′
+=
06.1851.0185.2357.28n
ˆ)1n(21nˆ
3xLCL 12
=+××−=ρ−
+σ′
−=
15.00
30.00
45.00
1 11 21 31 41 51 61 71 81 91
CL
UCL, sampled
UCL, complete
UCL, modified
LCL, complete
LCL, modified
LCL, sampled
Comparison of different control limits. 266J. Shi, the University of Michigan, [email protected], 734-763-5321(O)
How to analyze data with autocorrelation?
2. Time Series methodology: • A useful tool for analyzing system dynamics and data
autocorrelations in the discrete time domain.– Time series methodology is extensively covered in ME563/IOE565.
• Basic ideas:– Once the autocorrelations are detected (utilizing previous
methods), we can use some types of computer coded algorithm to fit an ARMA (autoregressive moving average) model [ARMA (n, m)] for the data:
mtm2t21t1tntn2t21t1t ...x...xxx −−−−−− εθ−−εθ−εθ−ε+ξ=φ−−φ−φ−
267J. Shi, the University of Michigan, [email protected], 734-763-5321(O)
More about ARMA(n,m) Model
For AR(1) models, the extreme value φ1 =1 means the process has a slowwondering mean. It is called a random walk. Stock market prices are anexcellent example.
ε t , so called disturbances or residuals, should be IID N(0, σε2 ) if the empirical
model fits the real system well enough.
mtm2t21t1tntn2t21t1t ...x...xxx −−−−−− εθ−−εθ−εθ−ε+ξ=φ−−φ−φ−
Where ξ is the process mean; xt is the output readings. εt is the estimated unmeasurable disturbances. This procedure, called system identification. φi’s and θi’s are the model parameters. Note that φi is not ρi.
In order to have accurate estimates of the parameters, it is suggested to have at least 200 data points.
268J. Shi, the University of Michigan, [email protected], 734-763-5321(O)
How to analyze data with autocorrelation?— Using ARMA modeling
• Fit an appropriate ARMA model to the data and plot the residuals on the Shewhart charts.
– Sounds good. As argued above, should be IID normal, and therefore is a “perfect” candidate for Shewhart control charts in the sense that all the requirements for the Shewhart charts are met.
• Limitations:– does not have physical meanings except that it provides a check for
model validity. An out-of-control signal on a control chart tells us that the empirical model no longer fits the true system. Is it showing that the process is out-of-control? May be, may be not.
– It is sensitive to the accuracy of ARMA modeling• In our example, It is told that the appropriate model is (using computer
codes to do model fitting, you’d learn how to do it in IOE565)
The residuals are approximately N 0,3.202( ) (recall the raw data has standarddeviation ~ 3.50. The ARMA model has reduced the standard deviation by ~10%)
tttt axxx +−+= −− 21 492.0777.062.20ˆ

269J. Shi, the University of Michigan, [email protected], 734-763-5321(O)
• In our example, It is told that the appropriate model is (using computer codes to do model fitting, you’d learn how to do it in IOE565)
ˆ x t = 20.62 + 0.777xt −1 − 0.492xt −2 +at
The residuals are approximately N 0,3.202( ) (recall the raw data has standarddeviation ~ 3.50. The ARMA model has reduced the standard deviation by ~10%)
-10.00
0.00
10.00
1 11 21 31 41 51 61 71 81 91
UCL
CL
LCL
Plot the residuals on the control chart:
270J. Shi, the University of Michigan, [email protected], 734-763-5321(O)
Different Views of the Autocorrelation• Almost 99% of the statisticians would think of autocorrelations as the
“trouble-makers” in a sense that their existence makes the statistical inferences about the data very difficult and tricky. – The traditional control charts fail terribly when being applied to
autocorrelated data.• As engineers, however, we should think of autocorrelations as the
opportunity of process improvement.– When autocorrelations are present, it means that the processes are
somewhat predictable. Since the data is NOT totally random (as being required by the traditional SPC tools), the process behavior is following a specific pattern. This observation opens up a whole different viewpoint of controlling the process variability. We should consider taking a proactive approach to control the process.
• The traditional SPC methodology is a reactive approach. – The process is left alone as long as no out-of-control signal is
detected. The opportunity of process improvement (reducing process variability and/or bringing the process mean to target) appears only when the process is being diagnosed as out-of-control. Even when an alarm goes off, it is not guaranteed that the process will be improved. The signal might be a false alarm, or no assignable causes can be identified or removed.
271J. Shi, the University of Michigan, [email protected], 734-763-5321(O)
Different Views of the Autocorrelation (Cont’s)• On the other hand, the Engineering Process Control (EPC) approach, takes
full advantages of system dynamics (i.e., process predictability) and proactively manipulates the process to minimize the process variability and maintain the process mean.– It is beyond the scope of this course to go further and discuss how to
perform engineering control. Basically, you have to identify one or more controllable process variables (the input), and adjust the input in order to compensate any possible disturbances that would drive the process away from target. A “closed-loop” control scheme can effectively reduce the process variability.
• You should know that when you are faced with autocorrelation, do not just come up with some fancy control charts that sound statistically correct , but do little in improving processes. Work together with the engineers and try to perform proactive controls if at all possible.
• A future trend: Combined the SPC (Statistical Process Control) and APC (Automatic Process/feedback Control).
Process
Disturbances,
Input Output,
ε t
x t
Controller
272J. Shi, the University of Michigan, [email protected], 734-763-5321(O)
Ch. 10 Multivariate Quality Control
• Monitoring of Process Mean– Chi-square Control Chart– Hotelling T2 control chart
• sample size n>1• Sample size n=1
– Interpretation of out-of-control signals• Monitoring Process Variability
– test covariance matrix– test sample generalized variance

273J. Shi, the University of Michigan, [email protected], 734-763-5321(O)
Need for Multivariate Control Charts• Simultaneous monitoring or control of two or more related
quality characteristics is necessary• Using individual control charts to monitor the independent p
variables separately can be very misleading– Decision rule 1: if one variable is out of control, then
system is concluded to be out-of-control• use x-bar chart for each variable, let Pr{Type I error}=α, then the Type
I error for the joint control of p independent variables could be very large for a large p
α’=1-(1-α)p
– Decision rule 2: if all variables are out of control, then the system is concluded to be out-of-control
• use x-bar chart for each variable, let Pr{Type II error}=β, then the Type II error for the joint control of p independent variables could be very large for a large p
β’=1-(1- β)p
• For dependent variables, there is no easy way to measure the distortion in the joint control rules
274J. Shi, the University of Michigan, [email protected], 734-763-5321(O)
Chi-Square Control Chart— Known process mean & variance matrix
• Assumption: The joint probability distribution of the p variables is the p-variate normal distribution
• Sample statistic and control limits
• How to use control charts: – plot of each sample on the control chart and check
with the UCL – check any nonrandom patterns
2p,
1T20
UCL
)()(n
α
−
χ=
−−=χ µΣµ XX
20χ
275J. Shi, the University of Michigan, [email protected], 734-763-5321(O)
Geometry Interpretation of Chi-square Control Chart
• For p=2, it forms a control ellipse
– If σ12=0, the principal axes parallel to the – If σ12=0 and σ1=σ2, the control ellipse becomes a circle
• a pair of sample average plotting inside of the ellipse indicates that the process is in control.
)]x)(x(2)x()x([n221112
222
21
211
222
1222
21
20 µ−µ−σ−µ−σ+µ−σ
σ−σσ=χ
)x,x( 21
21 x,x
276J. Shi, the University of Michigan, [email protected], 734-763-5321(O)
Hotelling T2 Control Chart(sample size n>1)
• T2 statistic: )()(nT 1T2 XXSXX −−= −
∑∑
∑∑
∑∑
==
==
==
=−−−
=
=−−
=
==
m
1kjhkjhhkihkjk
n
1iijkjhk
m
1k
2jk
2j
2jk
n
1iijk
2jk
m
1kjkj
n
1iijkjk
Sm1S;)xx)(xx(
1n1S
Sm1S;)xx(
1n1S
;xm1x;x
n1x
ith observation (i=1,…,n)j, hth variable (quality characteristic) (j,h=1,…p, j≠h)kth sample (k=1,…,m)
Sample average Total average
mean
variance
covariance

277J. Shi, the University of Michigan, [email protected], 734-763-5321(O)
Construct a Hotelling T2 Control Chart
• Two distinct phases of control chart usage– phase I: testing whether the process was in control
when the m preliminary subgroups were drawn and the sample statistics and S computed (m>20)
– Phase II: monitor the future observation
• if large number of preliminary samples are used, it is customary to use as the upper control limit inboth phases
0;1)1)(1(
1,, =+−−
−−= +−−α LCLF
pmmnnmpUCL pmmnp
0;1)1)(1(
1,, =+−−
−+= +−−α LCLF
pmmnnmpUCL pmmnp
2p,UCL αχ=
X
Reference: Alt, F. B. (1985), “Multivariate Quality Control,” Encyclopedia of Statistical
Science, Vol. 6, edited by N. L. Johnson and S. Kotz, John Wiley, New York, pp. 110-122.
278J. Shi, the University of Michigan, [email protected], 734-763-5321(O)
Example:
)]xx)(xx(s2)xx(s)xx(s[sss
nT 2211122
2221
211
222
1222
21
2 −−−−+−−
=
279J. Shi, the University of Michigan, [email protected], 734-763-5321(O)
Interpretation of Out-of-Control Signals
How to find which of the p variables is responsible for the out-of-control signal?– Simultaneous univariate control chart– Simultaneous confidence intervals– Control chart for p principle component– Decomposition of T2 control chart
280J. Shi, the University of Michigan, [email protected], 734-763-5321(O)
Monitor Process Variability
• Repetitively test the significance of the hypothesis that the process covariance matrix is equal to a particular matrix of constants Σ
• Test on the sample generalized variance |Si|
• Remarks:– It lost the individual variance information.– Recommended to use univariate control charts for variability
in conjunction with the control chart for |S|
22/)1p(p,
iii1
ii
UCL
S)1n(A;)A(tr|)|/|Aln(||n)nln(pnpnW
+α
−
χ=
−=Σ+Σ−+−=
)b3b(||LCL
||bCL)b3b(||UCL
21
1
21
−Σ=
Σ=
+Σ=
∏ ∏ ∏
∏
= = =
=
⎥⎦
⎤⎢⎣
⎡−−+−−
−=
−−
=
p
1i
p
1j
p
1jp22
p
1ip1
)jn()2jn()in()1n(
1b
)in()1n(
1b
221 ||b|)S(|V|;|b|)S(|E Σ=Σ=
1b/|S||ˆ| =Σ

281J. Shi, the University of Michigan, [email protected], 734-763-5321(O)
Ch7 Process Capability Analysis
• PCR, PCRk, PCRkm
• C.I. and Hypothesis testing of PCR• Gage Capability Study• Setting Specification limits
282J. Shi, the University of Michigan, [email protected], 734-763-5321(O)
Ch7 Contents
7-1 Introduction7-2 Process Capability Analysis Using a Histogram7-3 Process Capability Ratio7-4 Process Capability Analysis Using a Control Chart7-5 Process Capability Analysis Using a Designed Experiments7-6 Gage and Measurement System Capability Analysis7-7 Setting Specification Limits7-8 Natural Tolerance Limits
283J. Shi, the University of Michigan, [email protected], 734-763-5321(O)
Why Need to Study It?
1) Predicting ability to hold tolerances.2) Assist product developers/designers in selecting /designing processes.3) Assist in establishing an interval between sampling.4) Specifying requirements of new equipment.5) Selecting between vendors.6) Planning production sequences with inter-active effects of processes on tolerances.7) Reducing variability in manufacturing process.
The above general activity is called process capability analysis, involving:• product and process design• vendor sourcing• production or manufacturing planing• manufacturing process control
284J. Shi, the University of Michigan, [email protected], 734-763-5321(O)
Process Capability Analysis and Techniques
• Three primary techniques– histograms or probability plot to know the distribution, and get the
parameter estimation • product characterization can only use this method
– PCR analysis using control charts to obtain estimation of the parameters (will be discussed in the lecture)
• better approach for understanding process capability by monitoring process variability
– design experiments to isolate and estimate the sources of process variability
• effective way for understanding the effect of process variables on the outputs to finally realize optimization of process design and control

285J. Shi, the University of Michigan, [email protected], 734-763-5321(O)
Description of Process Capability
• Process capability refers to the uniformity of the process, representing by– natural or inherent variability at a specified time: “instantaneous” variability– variability over time
• Natural tolerance limit– It is customary to take the 6-sigma spread in the distribution of the product
quality characteristic as a measure of process capability
• PCR: process ability to manufacture products that meet specification
LNTL = µ – 3 σ UNTL = µ + 3 σFor normal distribution, we expect 99.73% of data between UNTL and LNTL.
286J. Shi, the University of Michigan, [email protected], 734-763-5321(O)
Review of PCR
• Process-Capability Ratio
R chart S chart samples
PCR=1 means the process uses up 100% tolerance band with 0.27% (2700PPM) nonconforming units for a normal distribution
• Percentage of the specification band used up by the process
P=(1/PCR)100%
;ˆ6LSLUSLPCR;
6LSLUSLPCR
σ−
=σ−
=
242 Sor;c/Sˆor;d/Rˆ =σ=σ
287J. Shi, the University of Michigan, [email protected], 734-763-5321(O)
Review of SL, CL and NTL
A s lo n g as U S L – L S L > U N T L – L N T Lw e a re ca p ab le o f p ro d u c in g a la rg ep ro p o rtio n o f g o o d item s b y c o n tro llin g(c en te rin g ) th e p ro c es s m e an .
µ USL3σ 3σLSL UNTLLNTL
µUSL3σ 3σLSL UNTLLNTL
µ
USL
3σ 3σ
LSL
UNTLLNTL
PCR>1, P<100%
PCR<1, P>100%
PCR=1, P=100%µ
USL
3σ3σ
LSL
UNTL
LNTL
Externallydetermined
Externallydetermined
Distribution of individualprocess measurement
UCL
LCL Distribution of x bar values
n3σ
Center lineon x bar
• There is no relationship betw een control lim its and specification lim its.• PCR is an index relating natural to lerance lim its to specification lim its.
288J. Shi, the University of Michigan, [email protected], 734-763-5321(O)
More about Process Capability Ratio
• Two- sided specifications
• One-sided specification
• Estimation of PCR are obtained by replacing µ and σ with the estimates of and
σ−
=6
LSLUSLPCR
;3LSLPCR;
3USLPCR LU σ
−µ=
σµ−
=
µ σ

289J. Shi, the University of Michigan, [email protected], 734-763-5321(O)
PCR vs Defective PPM NormallyNormally Distributed Process with the centeredcentered mean
PPM: defective or nonconforming parts per million
Table 7-3, P360
290J. Shi, the University of Michigan, [email protected], 734-763-5321(O)
Recommended Minimum PCR
Two Spec. One Spec.
Existing Process 1.33 1.25New Process 1.50 1.45Critical Existing 1.50 1.45Critical New Process 1.67 1.60
Table 7-4, P361
291J. Shi, the University of Michigan, [email protected], 734-763-5321(O)
ExampleSheet metal components for an autombile (Doors, Fenders, Hood, etc.) are placed in afixture to measure conformance to specifications. The fixture is 3mm larger than thenominal dimensions of the part. The gap between the part and the fixture is measured in"critical" positions. The data are reported as deviations from 3mm (i.e. deviations from thenominal).
A sample of 30 parts are mounted in the fixture and measured. Summary data (in mm) forone critical position follow:
USL: .75LSL: -.75
X = -.54σ = .08
UNTL = -.54 + 3 (.08) = -.30LNTL = -.54 – 3 (.08) = -.78
Note: USL – LSL > UNTL – LNTL
PCR^
= USL – LSL6σ
= .75 – (-.75)6(.08) = 3.125
Note: This process has the potential to have virtually 100% to specification
beyond LSL
292J. Shi, the University of Michigan, [email protected], 734-763-5321(O)
PCRk (Off–Center Processes)
• To take process centering into acount, define
PCRk = min { PCRU, PCRL }
where PCRU = USL – µ
3σ ; PCRL = µ – LSL
3σ
• PCRk is just one side PCR for the specification limit closest to µ(use one side specification on Table 9-3 to get PPM).
• If the process is centered , then PCR = PCRk ; If not centered, then PCRk < PCR.• PCR measures potential capability, PCRk measures actual capability

293J. Shi, the University of Michigan, [email protected], 734-763-5321(O) 294J. Shi, the University of Michigan, [email protected], 734-763-5321(O)
Example: to calculate PCR and PCRk for the following two processes with LSL=35, USL=65Process A: µA=50, σA=5Process B: µB=57.5, σB=2.5
295J. Shi, the University of Michigan, [email protected], 734-763-5321(O)
More about Process Capability Index
τ : square root of expected square deviation from target
PCRkm
= USL – LSL
6 τ
τ 2 = E[ (x – T) 2 ] = σ2 + (µ – T) 2 ; T = USL–LSL
2
• Note: Variance is composed of two components
Hence, PCRkm
= USL – LSL
6 σ2
+(µ–T)2 =
PCR
1 + ξ2
ξ = T – µ
σ
+
296J. Shi, the University of Michigan, [email protected], 734-763-5321(O)
Discussion on PCRkm
• PCRkm range: 0≤ PCRkm ≤ PCR (however, PCRk could be negative)• When µ=T, PCRk=PCRkm
• A given value of PCRkm places a constraint on the |µ−T|– A necessary condition for PCRkm≥1 is:
• The estimation of PCRkm is
• Third generation process capability ratio: increase the sensitivity to departures of µ from T,
SxTV;
V1PCRPCR
2km−
=+
=
)LSLUSL(61|T| −<−µ
2k
2k
pkm1
PCR
T1
PCRPCRξ+
=
⎟⎠⎞
⎜⎝⎛
σ−µ
+
=PCR: the first generationPCRk: the second generation

297J. Shi, the University of Michigan, [email protected], 734-763-5321(O)
Problem 7-6: A process is in control with
.2 and 75 == Sx
The process specifications are at 80±8. N=5
a. Estimate the potential capability.
b. Estimate the actual capability.
c. How much could process fallout be reduced by shifting the mean to the nominal dimension?
Assume that quality characteristic is normally distributed
298J. Shi, the University of Michigan, [email protected], 734-763-5321(O)
Problem 9-7: Consider the two processes shown below:
Process A: X A = 100 S A = 3
Process B: X B = 105 S B =1
Specifications are at 100 ± 10.Calculate PCR, PCRk, and PCRkm and interpret these ratiosWhich process would you prefer to use?
n=5
299J. Shi, the University of Michigan, [email protected], 734-763-5321(O)
Problem 9-8: Suppose that 20 of the parts manufacturedby the processes in example 2 were assembled so thattheir dimensions were additive; that is,x = x1 +x2 +.....x20
Specifications on x are 2000 ± 200. Would you prefer toproduce the parts using process A or process B? Why?Do the capability ratios computed in problem 9-7 provideany guidance for process selection?
300J. Shi, the University of Michigan, [email protected], 734-763-5321(O)
Confidence Intervals for PCR
Based on σ−
=6
LSLUSLPCR , thus
11
1,2/2
4
1,2/12
4 −χ
≤≤−
χ −α−α−
ncPCRPCR
ncPCR nn

301J. Shi, the University of Michigan, [email protected], 734-763-5321(O)
textbook, P368
302J. Shi, the University of Michigan, [email protected], 734-763-5321(O)
303J. Shi, the University of Michigan, [email protected], 734-763-5321(O) 304J. Shi, the University of Michigan, [email protected], 734-763-5321(O)
• Why need it?• Total variability decomposition
Gage and Measurement System Capability
2gage
2product
2total σ+σ=σ
2ilityreproducib
2ityrepeatabil
2gage
2error_tmeasuremen σ+σ=σ=σ
inherent precision of gage different operators or conditions

305J. Shi, the University of Michigan, [email protected], 734-763-5321(O)
Gage Capability Criteria
• Precision to tolerance ratio or P/T ration
• gage error as a percentage of the product variability
1.0LSLUSL
ˆ6TP gage <
−
σ=
%100ˆˆ
product
gage ×σ
σ
306J. Shi, the University of Michigan, [email protected], 734-763-5321(O)
Example 7-7 P378
2gage
2product
2total σ+σ=σ
• X-bar chart represents variability between different product units• R chart represents the gage measurement variability:
2gage d
Rˆ =σ
307J. Shi, the University of Michigan, [email protected], 734-763-5321(O)
Example 7-8 P380
)x,x,xmin(x)x,x,xmax(x
19.0693.132.0
|dRˆ32.028.2260.22xxR
02.1128.115.1
|dRˆ15.1)2.125.11(
31)RRR(
31R
321min
321max
3n2
xilityreproducibminmaxx
2n2ityrepeatabil321
=
=
===σ=−=−=
===σ=++=++=
=
=
(1) average of all ranges
(2) Difference among operators
(3) Each operator’s average308J. Shi, the University of Michigan, [email protected], 734-763-5321(O)
Gage and Measurement System Capability• Variation Decomposition
2ilityreproducib
2ityrepeatabil
2gage
2tmeasuremen
2gage
2product
2total σ+σ=σ=σ⇒σ+σ=σ
Use R chart for estimationr: # of operatorsm: # of samplesn: # of repeated measurementsxkij :i: sample indexj: repeated measurement indexk: operator index
rmn
xx
1rmn
)xx(
r
1k
m
1i
n
1jkij
r
1k
m
1i
n
1jkij
2total
∑∑∑
∑∑∑
= = =
= = =
=
−
−=σ
2ityrepeatabil d
Rˆ =σ
r
RR
r
1kk∑
==
)x(min)x(maxRm
RR
kijjkijjki
m
1iki
k
−=
=∑
=
)x,x,xmin(x
)x,x,xmax(x
;xxR
r,21min
r,21max
minmaxX
…
…
=
=
−=
2
Xilityreproducib d
Rˆ =σ
mn
x
m
xx
m
1i
n
1jxij
m
1iki
k
∑∑∑= == ==

309J. Shi, the University of Michigan, [email protected], 734-763-5321(O)
• Gage capability: precision-to-tolerance ratio (P/T ratio)– Generally, an adequate gage capability: P/T≤0.1
• gage variability-to-product variability ratio– independent of specification limits
Gage and Measurement System Capability (Cont’s)
LSLUSLˆ6
TP gage
−σ
=
%100ˆˆ
product
gage ×σσ
2totalσ
2ilityreproducib
2ityrepeatabil
σ
σ 2gageσ
2productσ2
ilityreproducib2
ityrepeatabil2gage σ+σ=σ
2gage
2total
2product σ−σ=σ
310J. Shi, the University of Michigan, [email protected], 734-763-5321(O)
Setting Specification Limits on Discrete Components
N am e of lim it
Toler anc e S et by the engineer ing des ign f unct ion to de f ine the minimum and m axim um values allowa ble f or the pr oduct to w or k pr oper ly
S tat is tic al toler ance Calcula ted f rom pr oces s data to def ine the amount of var ia tiontha t the pr oce ss exhibits ; thes e limits w il l contain a spe cif ied pr opor tion of the total populat ion
P redic tion Calcula ted f rom pr oces s data to def ine the lim its w hich w il l contain a ll of k f utur e obs er vat ions
Conf ide nce Calcula ted f rom data to def ine an inter va l w ithin which a popula tion pa r ame ter l ies
Contr ol Calcula ted f rom pr oces s data to def ine the lim its of cha nce ( random ) var iation ar ound s ome c entr al value
(SPL)
(NTL)
(C. I)
(CL)
Meaning
311J. Shi, the University of Michigan, [email protected], 734-763-5321(O)
Example
Suppose three components were manufactured to the specificationsindicated below:
Assembly
A B C
1.000 0.500 2.000± 0.001 ± 0.0005 ± 0.002
A “logical” specification on the assembly length would be 3.500 ± 0.0035.
Maximum Minimum1.0010 0.99900.5005 0.49952.0020 1.9980 3.5035 3.4965
312J. Shi, the University of Michigan, [email protected], 734-763-5321(O)
Example (cont’s)
The approach of adding component tolerances is too conservative!
Suppose that about 1% if A component is below lower tolerancelimits. Likewise for B and C.
If assemblies are made at random and if the components aremanufactured independently, then the chance that an assembly willhave all three components simultaneously below the lowertolerance limit is
1100
x1
100x
1100
=1
1,000,000
Thus, setting component and assembly tolerances based on thesimple stacking of tolerances is conservative; failing to recognizelow “joint probabilities”.

313J. Shi, the University of Michigan, [email protected], 734-763-5321(O)
Recall the variance of sums of independent events:
σ result = σ cause A2 + σ cause B
2 + σ cause C2 +
For the assembly example:
σ assembly = σA2 + σ B
2 + σ C2 +
Suppose for each component the tolerance range is equal to ± 3standard deviations (natural tolerance limits; process capability =1.0). The variance relationship may be rewritten as
Tassembly = TA2 + TB
2 + TC2
Thus the squares of tolerances are added to determine the square ofthe tolerance for the overall result.
314J. Shi, the University of Michigan, [email protected], 734-763-5321(O)
AssumptionsThe formula is based on several assumptions:
• Each component dimension is independent and the components are assembled randomly.(usually met in practice).
• Each component dimension should be normally distributed. (robust to this assumption)
• The component has mean = nominal spec.
Bender (1975) has studied these assumptions for some complex assembly cases andconcluded based on a "combination of probability and experience" that a factor of 1.5should be included to account for the assumptions, i.e.,
Tresult = 1.5 TA2 + TB
2 + TC2 +
Variation Simulation Analysis (VSA) uses simulation to analyze tolerances with/withoutnormality and with/without independence; see Rowzee and Holmes (1986).
315J. Shi, the University of Michigan, [email protected], 734-763-5321(O)
7-7.1 Linear Combinations
Now let’s generalize a bit. For linear, independent assemblies
y = a1x1 + a2 x2 + anxn
We recall,
E(y) = a1E(x1 ) + a2 E(x2 )+ anE(xn )
Var(y) = a12Var(x1 ) + a2
2Var(x2)+ an2Var(xn )
)(N~x 2i,i0i σµ
316J. Shi, the University of Michigan, [email protected], 734-763-5321(O)
Example 2:
Two mating parts are assembled as shown below:
X Y
Assume µx = 2.010 cm., σx = .002 cm.µy = 2.004 cm., σy = .001 cm.
What fraction of parts will have positive clearance?

317J. Shi, the University of Michigan, [email protected], 734-763-5321(O)
• Assembly process assessment – Calculate the nonconforming fraction of the final assembled
product when each component distribution is known (Example 7-9, P388 )
• Tolerance design for each component (Example 7-10, P389 )– To meet the specification limits of the final assemblies
• 2W is the width of SL for the final assemblies • NTL is defined so that no more than α% of the final assemblies will fall outside
SL ( the width of NTL= )• assume n components with the same variance σ2
• Design minimum clearance C (Example 7-11, P391)
– Pr{clearance<C}= = α
⎟⎟⎠
⎞⎜⎜⎝
⎛
σµ−
Φ−⎟⎟⎠
⎞⎜⎜⎝
⎛
σµ−
Φ=≤≤
σ=σ⇒µ=µ⇒= ∑∑∑===
y
y
y
y
n
1i
2i
2i
2y
n
1iiiy
n
1iii
LSLUSL}USLyLSLPr{
ccxcy
nZW 2
y2
2/y
σ≤σ⇒≤σ
α
W2Z2 y2/ =σα
Applications
αα− −==σ
µ−ZZ
C
y
y1⎟
⎟⎠
⎞⎜⎜⎝
⎛
σµ−
Φy
yC
318J. Shi, the University of Michigan, [email protected], 734-763-5321(O)
7-7.2 Nonlinear Combinations
For nonlinear functions
y = g(x1, x2 , , xn )
We can use a second order Taylor series approximation to gand expand the solution around µ1, µ2, . . . . , µn
y = g(x1, x2 , , xn )
= g(µ1,µ 2, ,µ n ) + (xi – µ i)∂g∂xi µ 1, µ 2 , ,µ n
i =1
n
∑ + R
µ y = E(y) ≈ g(µ1,µ 2, ,µ n )
σY
2 = Var(y) ≈∂g∂xi µ 1, µ 2 , ,µ n
⎛
⎝ ⎜
⎞
⎠ ⎟
i =1
n
∑2
σ i2
319J. Shi, the University of Michigan, [email protected], 734-763-5321(O)
Example 7-12, P392:
V = IR Expanded, V ≈ µI µR + (I – µI )µR + (R – µR ) µI µV ≈ µI µR σ2
V ≈ µR2 σI2+µI2 σR2
320J. Shi, the University of Michigan, [email protected], 734-763-5321(O)
Example 2:
Consider a cylinder cut from sheet aluminum as illustrated:
X
Y
Assume X ~ N (20,2) and Y~N(10,1)
What is the mean and variance of the resultant volume?
Recall: Area of a circle = π r2
Circumference of a circle = 2 π r

321J. Shi, the University of Michigan, [email protected], 734-763-5321(O)
7-8 Estimating Natural Tolerance Limits of a Process
In general we want an interval which contains (1-α)% of the process withprobability γ.
For a normal process distribution, Tables VII and Table VIII (see Appendix)provide values for K for two- and one-sided tolerance limits respectively;
X– ± K S
for 2 ≤ n ≤ 1000, γ = .90, .95, .99 and α = .10, .05, .01.
322J. Shi, the University of Michigan, [email protected], 734-763-5321(O)
Ch14 Acceptance Sampling for Attributes
• What is acceptance sampling?• Why use acceptance sampling?• Types of Sampling Plans
– Single sampling plan– Double sampling plan– Multiple-sampling plan
323J. Shi, the University of Michigan, [email protected], 734-763-5321(O)
What is acceptance sampling?
• Scenario 1– A company received a shipment of product from a vendor.
This product is often a component or raw material used in the company’s manufacturing process. A sample is taken from the lot, and some quality characteristic of the units in the sample is inspected. On the basis of the information in this sample, a decision is made regarding lot disposition. Usually, the decision is either to accept or to reject the lot. This procedure is called acceptance sampling.
• Scenario 2– A manufacturer will sample and inspect its own product at
various stages of production. Lots that are accepted are sent forward for further processing, while rejected lots may be reworked or scraped.
324J. Shi, the University of Michigan, [email protected], 734-763-5321(O)
Why use acceptance sampling?
• Three methods for lot sentencing– Accept without inspection– 100% inspection– Acceptance sampling
• Advantages of acceptance sampling– It is usually less expensive because there is less inspection
(less personal, less inspection time, less inspection error)– There is less handling of product, hence reduced damage– Rejection of entire lots as opposed to the simple return of
defectives often provides a stronger motivation to the vendor for quality improvement.
• Disadvantages– Risks of accepting “bad” lots and rejecting “good” lots.– Less information is generated– Need planning and documentation

325J. Shi, the University of Michigan, [email protected], 734-763-5321(O)
Types of Acceptance Sampling
• Single sampling plan– The lot disposition is determined by one single sample.
• Double-sampling plan– The decision from the first sample is to (1) accept the lot, (2)
reject the lot, (3) take second sample.– If we need to take the second sample, the lot disposition is
determined by both the first and the second sample.
• Multiple-sampling plan– It is an extension of double-sampling plan.– Sequential sampling is an ultimate extension of multiple
sampling.
326J. Shi, the University of Michigan, [email protected], 734-763-5321(O)
Considerations in acceptance sampling
• Lot formation– Homogeneous– Larger lots are better– Lots should be conformable to the materials-handling systems
used in both the vendor and consumer facilities.• Random sampling
• An acceptance sampling plan is a statement of the sample size tobe used and the associated acceptance or rejection criteria for sentencing individual lots.
327J. Shi, the University of Michigan, [email protected], 734-763-5321(O)
Single-Sampling Plans for Attributes
• Definition– A single-sampling plan is defined by the sample size n and the
acceptance number c.
Example:If the lot size is N=10000, then the sampling plan n=89, c=2 means that from a lot of size 10000 a random sample of n=89 units is inspected and the number of nonconforming or defective items d observed. If d is less or equal to c = 2, the lot will be accepted. If d is larger than 2, the lot will be rejected.
328J. Shi, the University of Michigan, [email protected], 734-763-5321(O)
How to evaluate the acceptance sampling plan?The performance is evaluated by OC curve: a plot that shows the probability of accepting the lot versus the lot fraction defective.
OC curve shows the discriminatory power of the sampling plan.

329J. Shi, the University of Michigan, [email protected], 734-763-5321(O)
How to get OC curve?
∑=
−
−
−−
=≤=
−−
==
c
d
dnda
dnd
ppdnd
ncdpP
ppdnd
ndfdP
0
)1()!(!
!}{
)1()!(!
!)(}defectives {
330J. Shi, the University of Michigan, [email protected], 734-763-5321(O)
Draw OC curve for the single-sampling plan n=50,c=1. Assume lot is infinite large
331J. Shi, the University of Michigan, [email protected], 734-763-5321(O)
The ideal acceptance sampling plan
It can only be achieved by 100% inspection if there is no inspection error.
332J. Shi, the University of Michigan, [email protected], 734-763-5321(O)
Effects of sample size n and defective number c on OC curves

333J. Shi, the University of Michigan, [email protected], 734-763-5321(O)
Characterization of OC curve
• AQL: represents the poorest level of quality for the vendor’s process that the consumer would consider to be acceptable as a process average.– It is defined by the consumer.– An acceptance sampling plan should give a high probability of
acceptance at the AQL.• LTPD: lot tolerance percent defective. It is the poorest level of
quality that the consumer is willing to accept in an individual lot.– It is also called rejectable quality level (RQL) or limiting quality
level (LQL).– An acceptance sampling plan should give a low probability of
acceptance at RQL
334J. Shi, the University of Michigan, [email protected], 734-763-5321(O)
Type A and Type B OC curve
• Type A OC curve: isolated lot with finite (small) size.– Lot size N, sample size n, acceptance number c– The # of defective units in the sample is “Hypergeometric”
distributed.
• Type B OC curve: sample is from a infinite (large) lot– The # of defective units in the sample is binomial distributed.– Type B OC curve is always higher than type A curve– If n/N>0.1, type A and type B are almost the same.
Np is D,0
∑=
⎟⎟⎠
⎞⎜⎜⎝
⎛
⎟⎟⎠
⎞⎜⎜⎝
⎛−−
⎟⎟⎠
⎞⎜⎜⎝
⎛
=c
da
nN
dnDN
dD
P
335J. Shi, the University of Michigan, [email protected], 734-763-5321(O)
An example of type A and type B OC curve
336J. Shi, the University of Michigan, [email protected], 734-763-5321(O)
Design a single-sampling plan with a specified OC curve
• Need two points to define a curve.– It does not matter which two points we select. It is customary
in industry to use AQL and RQL for this purpose.• Given Pr(accept|p1)=1-α where p1=AQL and Pr(accept|p2)=β where
p2=RQL, how to get n and c? Assume the lot size is large.
∑
∑
=
−
=
−
−−
=β
−−
=α−
c
d
dnd
c
d
dnd
ppdnd
n
ppdnd
n
022
011
)1()!(!
!
)1()!(!
!1

337J. Shi, the University of Michigan, [email protected], 734-763-5321(O)
Solve the equation by Binomial nomograph
Example: p1=0.01, α=0.05, p2=0.06, β=0.1338J. Shi, the University of Michigan, [email protected], 734-763-5321(O)
Rectifying Inspection
• Acceptance-sampling programs usually require corrective action when lots are rejected. If the action is 100% inspection and to replace all nonconforming parts, such sampling programs are called rectifying inspection programs.
339J. Shi, the University of Michigan, [email protected], 734-763-5321(O)
Average Outgoing Quality
• It is the average value of total quality that would be obtained over a long sequence of lots from a process.
• The calculation of AOQ– n items in the sample which, after the inspection, contain no
defectives.– N-n items which, if the lot is rejected, also contain no
defectives– N-n items which, if the lot is accepted, contain p(N-n)
defectives
pPAOQN
nNpPAOQ
a
a
≈
−=
)(
340J. Shi, the University of Michigan, [email protected], 734-763-5321(O)
Example: suppose that N=10,000, n=89, and c=2, and that the incoming lots are of quality p=0.01. What is AOQ?

341J. Shi, the University of Michigan, [email protected], 734-763-5321(O)
AOQ curve
The worst possible average quality that would result from the rectifying inspection program us called average outgoing quality limit (AOQL)
342J. Shi, the University of Michigan, [email protected], 734-763-5321(O)
Average total inspection
• The average amount of inspection per lot will is the average total inspection (ATI).
• Example: N=10,000, n=89, c=2, and p=0.01. What is ATI?
))(1( nNPnATI a −−+=
343J. Shi, the University of Michigan, [email protected], 734-763-5321(O)
Average total inspection curves
344J. Shi, the University of Michigan, [email protected], 734-763-5321(O)
Summary of single-sampling plan for attributes
• Definition• Performance evaluation: OC curve
– AQL and RQL points– Type A and Type B OC curves– Design a single-sampling plan with a specified OC curve
• Rectifying Inspection– AOQ
• AOQL
– ATI

345J. Shi, the University of Michigan, [email protected], 734-763-5321(O)
Double, Multiple, and Sequential Sampling• Definition of double
sampling plan– n1: sample size
on the first sample
– c1: acceptance number of the first sample
– n2: sample size on the second sample
– c2: acceptance number for both samples
• The operation of double sampling– Example:
n1=50,c1=1,n2=100,c2=3
346J. Shi, the University of Michigan, [email protected], 734-763-5321(O)
Double-Sampling plan
• Advantages– Curtailment: reject a lot without complete the second sample– Inspection size is smaller than single sampling plan
• Disadvantages– If not applied correctly, it may need more inspections– Need more administration work
347J. Shi, the University of Michigan, [email protected], 734-763-5321(O)
The OC curve of a double-sampling plan
348J. Shi, the University of Michigan, [email protected], 734-763-5321(O)
Average Sample Number Curve• Average sample number (ASN)
• ASN for a double-sampling plan with curtailment
)1()1)(( 21211 III PnnPnnPnASN −+=−++=
∑+=
+−++−+−+=2
1 122222211 ]/)2,1()1(),()[,(
c
cjML pjcnPjcjcnPnjnPnASN
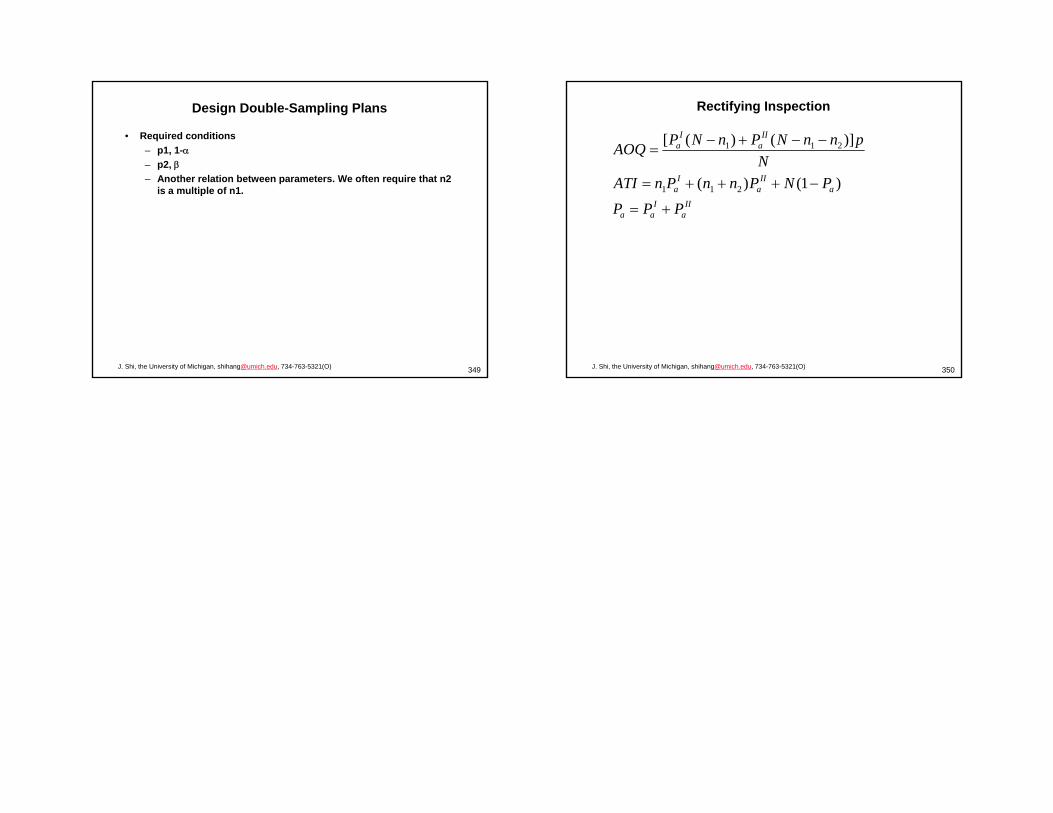
349J. Shi, the University of Michigan, [email protected], 734-763-5321(O)
Design Double-Sampling Plans
• Required conditions– p1, 1-α– p2, β– Another relation between parameters. We often require that n2
is a multiple of n1.
350J. Shi, the University of Michigan, [email protected], 734-763-5321(O)
Rectifying Inspection
IIa
Iaa
aII
aI
a
IIa
Ia
PPP
PNPnnPnATIN
pnnNPnNPAOQ
+=
−+++=
−−+−=
)1()(
)]()([
211
211