listen to me: improving process model matching through user feedback€¦ · · 2015-12-31......
TRANSCRIPT

Listen to me: Improving Process ModelMatching through User Feedback
Christopher Klinkmuller1, Henrik Leopold2, Ingo Weber3,4, Jan Mendling2,and Andre Ludwig1
1 Information Systems Institute, University of Leipzig, Leipzig, Germany?
klinkmueller,[email protected] Wirtschaftsuniversitat Wien, Augasse 2-6, A-1090 Vienna, Austria
henrik.leopold,[email protected] Software Systems Research Group, NICTA, Sydney, Australia??
[email protected] School of Computer Science & Engineering, University of New South Wales
Abstract. Many use cases in business process management rely on theidentification of correspondences between process models. However, thesparse information in process models makes matching a fundamentallyhard problem. Consequently, existing approaches yield a matching qual-ity which is too low to be useful in practice. Therefore we propose toinvestigate user feedback to improve the matching quality. To this end,we analyze which information is suitable for learning. On this basis,we design an approach that performs matching in an iterative, mixed-initiative approach: we determine correspondences between two modelsautomatically, let the user correct them and analyze this input to adaptthe matching algorithm. Then, we continue with presenting the resultsfor the next two models. This approach improves the matching quality, asshowcased by a comparative evaluation. From this study, we also derivestrategies on how to maximize the quality while limiting the workload.
Keywords: BPM, process similarity, process model matching
1 Introduction
More and more organizations use process models as a tool for managing theiroperations. Typical use cases for process models range from process documen-tation to the implementation of workflow systems. Once a repository of processmodels reaches a certain size, there are several important use cases which re-quire the comparison of process models. Examples include validating a technical
? The work presented in this paper was partly funded by the German Federal Min-istry of Education and Research under the projects LSEM (BMBF 03IPT504X) andLogiLeit (BMBF 03IPT504A).
?? NICTA is funded by the Australian Government through the Department of Commu-nications and the Australian Research Council through the ICT Centre of ExcellenceProgram.

implementation of a business process against a business-centered specification[2], process model search [6, 13, 10], or identifying clones in process models [7].
The demand for techniques that are capable of comparing process modelshas led to the development of a variety of process model matchers. These match-ers, e.g. [24, 14, 11], are usually designed for universal applicability. That is, theyare based on common matching metrics used to assess pairs of activities anddefine classification rules which are believed to provide meaningful indicationsof similarity for activities in any pair of process models. However, the insuffi-cient accuracy of these approaches [3] suggests that the assumption of universalapplicability is too strict, and might hinder effective application in practice.
For this reason, we seize the idea of an adaptive matcher. A similar ideawas discussed in [23] where characteristics of a certain process model collectionare analyzed to select well-suited matchers for the collection. In contrast to thisapproach, we build on an iterative, mixed-initiative approach that utilizes userfeedback to constantly adapt the matching algorithm. It aims to maximize thematching quality improvements while introducing a minimized additional effortfor the user in correcting correspondences. Therefore, correspondences betweentwo models are presented to the user, and she is asked to add missing and removeincorrect ones. Based on this feedback, the matching algorithm is updated byanalyzing the user’s decisions. Once this is done, the correspondences betweenthe next two models are presented. This inquiry of feedback is repeated until thematching system provides good results. The quality of this approach stronglydepends on the information that is considered during the analysis. Thus, wesubstantiate its design by deriving indicators from related research and by as-sessing their suitability for feedback analysis. Furthermore, an evaluation basedon benchmark matching samples demonstrates the benefits of the approach.
The rest of the paper is organized as follows. Section 2 defines process modelmatching and introduces the state of the art. Section 3 provides an overview ofcorrespondence indicators derived from related research and investigates theirpotential for user feedback analysis. Based on this survey, Section 4 defines ourapproach that incorporates feedback. Section 5 evaluates the approach usingsimulated feedback from gold standards. Finally, Section 6 concludes the paper.
2 Foundations: Problem Illustration and Related Work
This section introduces the problem of process model matching in more detail.First, we explain the problem of matching process models in Subsection 2.1.Afterwards, we review the state of the art in Subsection 2.2.
2.1 Problem Illustration
In accordance with ontology matching [8], process model matching is the pro-cess of identifying an alignment between two process models. In this paper, aprocess model is regarded as a business process graph as defined in [4]: a processmodel consists of labeled nodes of different types and directed edges connecting
2

them. While the edges define the control flow of the process, the nodes expressactivities, gateways, etc. This abstract notion of process models permits the ap-plication of our work to other notations like Petri nets, Event-driven ProcessChains (EPCs) or Business Process Model and Notation (BPMN).
Definition 1 (Process model, Set of activities). Let L be a set of labelsand T be a set of types. A process model p is a tuple (N,E, λ, τ), in which:
– N is the set of nodes;– E ⊆ N ×N is the set of edges;– λ : N → L is a function that maps nodes to labels; and– τ : N → T is a function that assigns types to nodes.
For a given process model p = (N,E, λ, τ) the set A = a|a ∈ N ∧ τ(a) =activity is called the set of activities, where we require ∀a ∈ A,n ∈ N :|n|(a, n) ∈ E)| ≤ 1 and |n|(n, a) ∈ E)| ≤ 1. Furthermore, we require thatthere only exists one start (∃n ∈ N, ∀ni ∈ N : (ni, n) /∈ E) and one end node(∃n ∈ N, ∀ni ∈ N : (n, ni) /∈ E).
Given two process models p1, p2 and their activity sets A1, A2 an alignmentis a set of correspondences, i.e. activity pairs (a1, a2) with a1 ∈ A1 and a2 ∈ A2
that represent similar functionality. This binary relation depicts more complexcorrespondences between sets of activities (A∗1, A
∗2) with A∗1 ⊆ A1 and A∗2 ⊆ A2
as the set of all activity pairs that they consist of (a∗1, a∗2)|(a∗1 ∈ A∗1∧a∗2 ∈ A∗2).Fig. 1 presents an alignment between two university admission process models
which will be used as a running example throughout the paper. Both processesrepresent the scenario of receiving, evaluating, and deciding about an applica-tion. Hence, activities from one process related to one of these tasks are matchedwith activities dealing with the same task in the other process. While α2 and β2constitute a one-to-one correspondence, β6 is not matched. Moreover, there aretwo complex correspondences: a one-to-many correspondence formed by α1, α1
and β2 and a many-to-many correspondence comprised of α3, α4, α5, β4 and β5.Applying a matcher to automatically determine alignments will only be use-
ful if it yields a high quality, i.e. if it meets the user’s expectations. This willbe the case when the number of correctly identified correspondences (true posi-tives) is high. Consequently, only a few correspondences should be missed (false
Process A
Check
Application
Documents
Complete?
Documents
in Time?
Is Student
Qualified?
Reject
Student
Accept
Student
Archive
Documents
Evaluate
Application
Prepare
notification
Publish
notification
Register
applicant
Process B
α1 α2 α3
α4
α5
β1
β2
β3
β4
β5
β6
Fig. 1: An example for a process model alignment
3

negatives). Moreover, the results of a good matcher also contain as few erroneouscorrespondences (false positives) as possible.
2.2 Related Work
The foundations for research in process model matching can be found in variousworks on schema and ontology matching [1, 8] as well as in research on processmodel similarity. Such process similarity techniques exploit different sources ofinformation such as text [5, 12], model structure [9, 4], or execution semantics[13, 26]. An overview is provided in [5].
Approaches for process model matching typically derive attributes of activitypairs from these techniques and aggregate these attribute in a predefined staticclassifier in different ways (see e.g. [24, 14, 11]). In [23], the idea of a more dy-namic assembly of matchers is discussed. Therefore, matchers are allocated toproperties of process model pairs. By evaluating these properties within a modelcollection, appropriate matchers are selected and composed.
However, up until now there is no automated technique for process match-ing available that achieves results comparable to those in the field of ontologymatching. In fact, a comparison of techniques developed by different researchersrevealed that the best matcher achieved an f-measure of 0.45 on the test datasets [3]. This calls for improving precision and recall of existing techniques. Tothis end, we investigate suitable matching indicators and user feedback.
3 Information for User Feedback Analysis
The goal of analyzing user feedback is to reveal models that can predict userdecisions with a high chance. Therefore, indicators whose values are highly cor-related to the decisions, i.e., whether activity pairs correspond or not, are needed[19]. For example, label similarity is generally seen as a good indicator: activitypairs with a high similarity tend to correspond more likely than those with a lowsimilarity. As various information sources, e.g. structure and execution seman-tics, can be considered, we systematically identify suitable indicators following atwo-step approach. In Subsection 3.1, we present indicators derived from relatedwork and investigate their potential for feedback analysis in Subsection 3.2.
3.1 Indicator Definitions
Approaches from related work rely on various characteristics of activities tojudge whether activities correspond. From analyzing related work, we identifiedfive categories: position and neighborhood based on the model structure, labelspecificity and label semantics referring to the labels, and execution semantics.Thereby, some approaches rely on a certain modeling notation or do not explicitlydefine the characteristics. In order to assess whether these characteristics can beused for feedback analysis, we present indicators that follow the approaches fromrelated work, but that are suited to our notation.
4

Basically, we define indicators as similarity functions from the set of activitypairs A2 to the interval [0, 1], where a value of 0 indicates total dissimilarity,a value of 1 identity, and values in between a degree of similarity. Most of thepresented indicators utilize an attribute function at : A→ R≥0 which returns avalue measured with regard to a certain property of an activity. Those indicatorsare referred to as attribute indicators. Given an activity pair they indicate thesimilarity of these activities with regard to a certain attribute.
Definition 2 (Attribute indicator). Let A1, A2 be two sets of activities anda1 ∈ A1, a2 ∈ A2 be two activities. The attribute indicator iat is then defined as:
iat(a1, a2) =
0 max
a∈A1
(at(a)) = 0 ∧ maxa∈A2
(at(a)) = 0
1− | at(a1)maxa∈A1
(at(a)) −at(a2)
maxa∈A2
(at(a)) | else
Position. Process models might represent the same abstract process. In suchcases, it is more likely for activities at similar positions to correspond than foractivities whose positions differ. This idea is pursued in the Triple-S approach,which takes the relative position of nodes in the process models as a similarityindicator [3]. According to our definition, each process model has one start andone end node. Thus, we view these nodes as anchors and consider the distancesto these nodes, i.e. the smallest number of activities on paths from a node to thestart or end node, as attributes to define the attribute indicators σstartpos , σendpos .
The position of an activity can also be defined with reference to the RefinedProcess Structure Tree (RPST) [24, 23]. The RPST is a hierarchical representa-tion of a process model consisting of single-entry-single-exit fragments [20]. EachRPST fragment belongs to one of four structured classes: Trivial fragments (T)consist of two nodes connected with a single edge. A Bond (B) represents a set offragments sharing two common nodes. Polygons (P) capture sequences of otherfragments. In case a fragment cannot be classified as trivial, bond, or polygon,it is categorized as a rigid (R). Fig. 2 presents the RPST of the process A.
The idea is to view the depth of the non-trivial fragments that contain theactivity as an attribute for the position of the model structure (σrpstpos ), i.e., thedeeper an activity is located in the RPST the more decision points need to bepassed to get to the activity. As activities have at most one incoming and at mostone outgoing edge, there are no more than two trivial fragments an activity ispart of and these trivial fragments are part of the same non-trivial fragment.
Table 1 illustrates the position indicators for (α1, β1) from the running ex-ample. Both activities have a distance to the start event of 0. As the structure
P1
P2 B1
P4P3Check
Application
Evaluate
Application
Prepare
notification
Publish
notification
Register
applicant
P4P1
α1 α2 α3
α4
α5P2 P3
T1 T2 T3 T4 T5
T7
T6
T8
T9 T1 T2 T3 T4
T5 T7T6 T8
T9
B1
Fig. 2: The fragments of the admission process of university A and the RPST
5
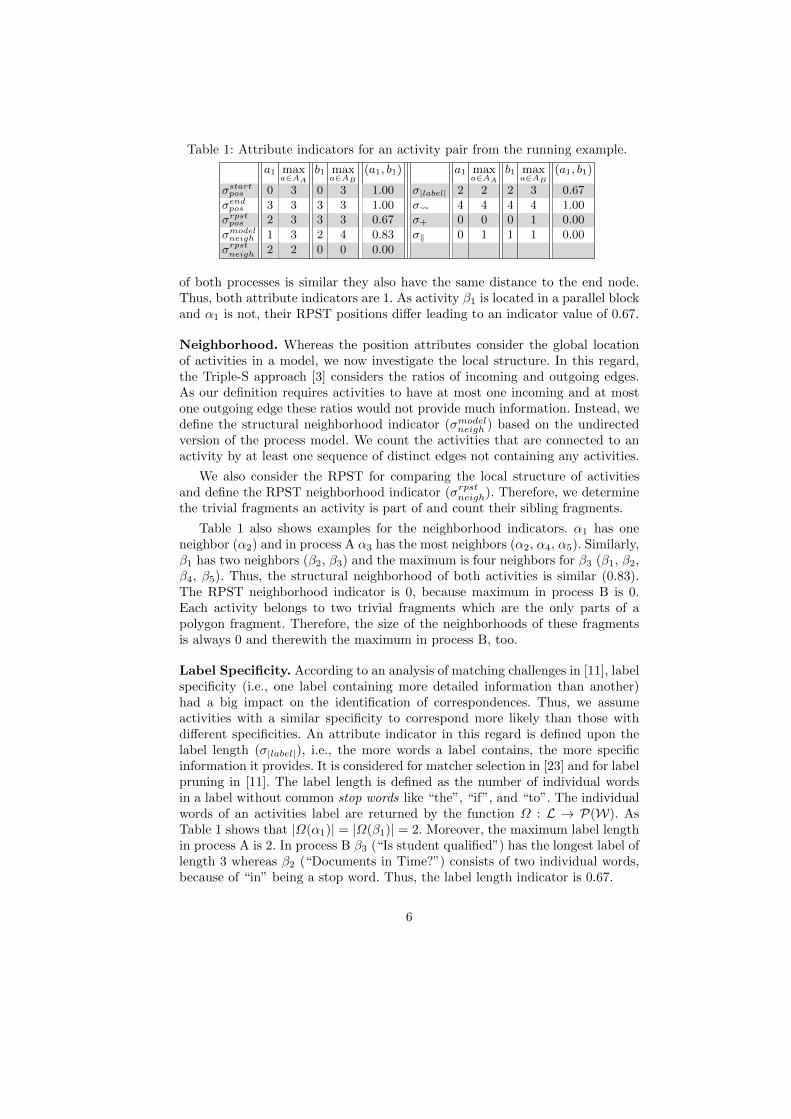
Table 1: Attribute indicators for an activity pair from the running example.
a1 maxa∈AA
b1 maxa∈AB
(a1, b1) a1 maxa∈AA
b1 maxa∈AB
(a1, b1)
σstartpos 0 3 0 3 1.00 σ|label| 2 2 2 3 0.67
σendpos 3 3 3 3 1.00 σ 4 4 4 4 1.00σrpstpos 2 3 3 3 0.67 σ+ 0 0 0 1 0.00
σmodelneigh 1 3 2 4 0.83 σ‖ 0 1 1 1 0.00
σrpstneigh 2 2 0 0 0.00
of both processes is similar they also have the same distance to the end node.Thus, both attribute indicators are 1. As activity β1 is located in a parallel blockand α1 is not, their RPST positions differ leading to an indicator value of 0.67.
Neighborhood. Whereas the position attributes consider the global locationof activities in a model, we now investigate the local structure. In this regard,the Triple-S approach [3] considers the ratios of incoming and outgoing edges.As our definition requires activities to have at most one incoming and at mostone outgoing edge these ratios would not provide much information. Instead, wedefine the structural neighborhood indicator (σmodelneigh ) based on the undirectedversion of the process model. We count the activities that are connected to anactivity by at least one sequence of distinct edges not containing any activities.
We also consider the RPST for comparing the local structure of activitiesand define the RPST neighborhood indicator (σrpstneigh). Therefore, we determinethe trivial fragments an activity is part of and count their sibling fragments.
Table 1 also shows examples for the neighborhood indicators. α1 has oneneighbor (α2) and in process A α3 has the most neighbors (α2, α4, α5). Similarly,β1 has two neighbors (β2, β3) and the maximum is four neighbors for β3 (β1, β2,β4, β5). Thus, the structural neighborhood of both activities is similar (0.83).The RPST neighborhood indicator is 0, because maximum in process B is 0.Each activity belongs to two trivial fragments which are the only parts of apolygon fragment. Therefore, the size of the neighborhoods of these fragmentsis always 0 and therewith the maximum in process B, too.
Label Specificity. According to an analysis of matching challenges in [11], labelspecificity (i.e., one label containing more detailed information than another)had a big impact on the identification of correspondences. Thus, we assumeactivities with a similar specificity to correspond more likely than those withdifferent specificities. An attribute indicator in this regard is defined upon thelabel length (σ|label|), i.e., the more words a label contains, the more specificinformation it provides. It is considered for matcher selection in [23] and for labelpruning in [11]. The label length is defined as the number of individual wordsin a label without common stop words like “the”, “if”, and “to”. The individualwords of an activities label are returned by the function Ω : L → P(W). AsTable 1 shows that |Ω(α1)| = |Ω(β1)| = 2. Moreover, the maximum label lengthin process A is 2. In process B β3 (“Is student qualified”) has the longest label oflength 3 whereas β2 (“Documents in Time?”) consists of two individual words,because of “in” being a stop word. Thus, the label length indicator is 0.67.
6

Table 2: Word occurrences and term frequencies in the admission processes
check application documents completeoccurrences 1 2 3 1term frequency 0.33 0.67 1.00 0.33
We further assume frequently occurring words to be more specific than lessfrequently occurring words. This idea is also pursued for label pruning in [11].Thus, we rely on the term frequency which is well known in information retrieval.It is defined as the number of occurrences of a certain word in a document. Onthe one hand, we take the union of all activity labels in the model collection asa document and define the function tfcoll : W → [0, 1] to return the number ofa word’s occurrences in the model collection divided by the maximum numberdetermined for a word in the collection. On the other hand, we define tf2p :W → [0, 1] by using all activity labels in the examined model pair to create thedocument. Based thereon, we define the term frequency indicators σcolltf and σ2p
tf .
Definition 3 (Term frequency indicators). Let a1, a2 be two activities.Then, the term frequency indicators σcolltf and σ2p
tf are defined as:
σcolltf (a1, a2) = 1− | 1|Ω(a1)| ∗
∑ω∈Ω(a1)
tfcoll(ω)− 1|Ω(a2)| ∗
∑ω∈Ω(a2)
tfcoll(ω)|
σ2ptf (a1, a2) = 1− | 1
|Ω(a1)| ∗∑
ω∈Ω(a1)
tf2p(ω)− 1|Ω(a2)| ∗
∑ω∈Ω(a2)
tf2p(ω)|
Table 2 illustrates the model pair based indicator. “Documents” occurs mostoften in the pair. Thus, the term frequencies are yielded by dividing the occur-rence values with 3. As the average term frequency of α1 (“Check Application”)is 0.50 and for β2 (“Documents Complete?”) it is 0.67, the indicator yields 0.83.
Label Semantics. Every matching approach relies on the calculation of labelsimilarities as an indicator to which degree activities constitute the same func-tionality. Prior research has shown that the basic bag-of-words similarity [11]yields good results [3]. It calculates a symmetric similarity score σ.ω : W2 →[0..1] for each pair of individual words (ω1, ω2) with ω1 ∈ Ω(a1) and ω2 ∈ Ω(a2).Based thereon, it is then defined as the mean of the maximum similarity scoreeach individual word has with any of the individual words from the other label.
Definition 4 (Basic bag-of-words similarity). Let a1, a2 be two activities.The basic bag-of-word similarity σ.λ is then defined as:
σ.λ(a1, a2) =
∑ω1∈Ω(a1)
maxω2∈Ω(a2)
(σ.ω(ω1,ω2))+∑
ω2∈Ω(a2)
maxω1∈Ω(a1)
(σ.ω(ω1,ω2))
|Ω(a1)|+|Ω(a2)|
Table 3 illustrates the computation of the basic bag-of-words similarity forα1 (“Check Application”) and β2 (“Documents complete?”). To compute thesimilarity of a pair of words, we relied on the maximum of the Levenshteinsimilarity [15] and the Lin similarity [16]. This measure sees high values in both,syntax (Levenshtein) and semantics (Lin), as evidence for similarity.
7

Table 3: Example for the basic bag-of-words similarity
document complete maxcheck 0.78 0.25 0.78application 0.11 0.18 0.18max 0.78 0.25 σ.λ = 0.50
Behavior. Lastly, there are approaches that account for the behavioral contextof activities within a process model. Such behavioral attributes are proposed asindicators for matcher selection [23], considered for probabilistic match optimiza-tion [14] and also implemented in the ICoP framework [21]. The idea is that cor-responding pairs have similar execution semantics, whereas non-correspondingpairs do not. Therefore, we rely on the notion of behavioral profile [22] whichcomprises three relations between activities in a process model defined uponthe set of all possible execution sequences. Two activities are in strict order(a1 a2), if there exist execution sequences that contain a1 and a2, but in allsuch sequences a2 is executed after a1. Two activities are exclusive (a1 + a2) ifno sequence contains both activities, or interleaving (a1 ‖ a2) if there are se-quences in which a1 occurs before a2 and there are sequences in which a2 occursbefore a1. For each type of relation, we count the number of relations the givenactivity participates in. Based on these counts we define the attribute indicatorsσ , σ+ and σ‖ which are illustrated in Table 1, too. While the (α1, β1) havean identical number of strict order relations (their execution can be followed bythe execution of up to four activities), they do not share similar characteristicswith regard to the other behavioral attributes. On the one hand, there are noexclusive activities in process A at all. Thus, the maximum in process A and theaccording attribute indicator yield a value of 0. On the other hand, there is oneinterleaving relation in each process (α4 ‖ α5 and β1 ‖ β2). As β1 is part of oneof these relations and α1 not, the according indicator is 0.
3.2 Applicability Assessment
Having a set of indicators, we now need to analyze whether they can be used toderive models that can predict user’s decisions. For an indicator to be applicable,there must be a correlation between its values or value ranges and the classes.
As the suitability of an indicator cannot be predicted in general, it must beestimated with regard to particular data sets (i.e., process collections) for whichthe set of correspondences is known (i.e., a gold standard of correspondencesexists). To this end, we used the two process collections and respective goldstandards from the matching contest in 2013 [3]: processes on birth certificatesand university admission. More precisely, we took the set of all corresponding andthe set of all non-corresponding activity pairs for both data sets as representativesamples for both classes. At this point, it should be noted that some of the processmodels in the university admission data set are not sound, which is a necessaryprerequisite for computing the behavior attributes. Thus, we only considered thesound university admission models for these attributes.
8

Table 4: p-values of the Kolmogorov–Smirnov test for the birth certificate (grayrows) and the university admission (white rows).
σstartpos σend
pos σrpstpos σmodel
neigh σrpstneigh σ|label| σ
colltf σ2p
tf σ.λ σ σ+ σ‖0.001 0.010 0.967 0.054 0.010 0.581 0.000 0.111 0.000 0.000 0.111 0.2110.000 0.367 0.155 0.286 0.468 0.210 0.016 0.699 0.000 0.001 0.864 0.393
To assess the correlation of classes and indicator values, we first examined thedistributions of indicator values within both classes. The rationale is that classescan only be assigned to value ranges if the values are distributed differentlyacross the classes. Therefore, we randomly drew 100 activity pairs from eachclass per attribute. The reason is that the number of non-corresponding activitypairs is roughly 30 times as high as the number of corresponding pairs in bothdata sets, which would distort our analysis. Next, we conducted a two-sidedKolmogorov-Smirnov [17] test at a significance level of 0.01 with these samples.The neutral hypothesis of this test is that the examined distributions are equaland will be rejected if the yielded p-value is lower than the significance level.Table 4 summarizes the p-values yielded for each attribute. Bold values highlightp-values that are below the significance level.
As can be seen from the table, there are only three attributes (σstartpos , σ.λ, andσ ) for which the null hypothesis is rejected in both cases. From this analysisthese three attributes seem suitable for classification, but we will also considerσcolltf as its p-value are only marginally larger than the significance level.
We further substantiated our analysis by investigating how well each classcan be assigned to a value range of an indicator. Therefore, we measured theinformation gain [19], a well established measure from statistics, as an indicatorfor the entropy of class assignments within subsets of activity pairs with regardto all pairs. More precisely, we calculated the values of all activity pairs foreach of the four attributes (σstartpos , σ.λ, σcolltf , σ ). We then determined twosubsets of pairs with regard to one of the attributes and to a threshold. Forall pairs in the first subset the attribute value is smaller than the threshold,whereas the values of pairs in the second subset are larger than it. We consideredall possible separations of activity pairs that satisfied this rule and chose theseparation with the highest information gain for each attribute. The rationale isthat the respective subsets constitute the best separation of corresponding andnon-corresponding pairs with regard to the considered attribute. As can be seenfrom Table 5, σ.λ yields the highest and σstartpos the lowest information gain, σcolltf
and σ are in between. To convey a better intuition for this measure, Fig. 3shows the distribution of the relative value frequencies for σ.λ and σstartpos as well
as for σcolltf as a representative for the indicators with medium information gains.
Table 5: Information gains for the selected attributes for the birth certificate(gray rows) and the university admission (white rows).
σ.λ σcolltf σ σstart
pos
0.056 0.023 0.016 0.0050.027 0.010 0.007 0.002
9

σ.λ σcolltf σstart
pos
1
Fig. 3: Box plots for corresponding (c) and non-corresponding (n) activity pairsrepresenting three indicators for the birth certificate (upper row) and the uni-versity admission (lower row) data sets.
According to these box plots a threshold at about 0.4 would yield a goodclassifier for σ.λ as many corresponding and only a few non-corresponding activ-ity pairs have values larger than this threshold. For the other indicators whosedistributions differ only slightly there is no threshold which would classify thatwell. Thus, we only consider σ.λ for user feed back analysis and introduce amixed-initiative approach which aims at increasing the applicability of σ.λ forseparating activity pairs in the next section.
4 Word Similarity Adaptation
The incorporation of user feedback opens the opportunity to analyze the user’sdecisions and adjust the matching process accordingly. Here, we rely on correc-tions made by the user to proposed alignments. Therefore, we let the user selecta pair of process models and automatically determine an alignment. Presentingit to the user, she is asked to remove incorrect and add missing correspondences.These corrections are passed to the algorithm which examines the feedback andadapts its classification mechanism. Afterwards, the next matching process canbe started by the user. Fig. 4 illustrates this basic approach.
As outlined in Section 3, we will only consider the basic bag-of-words simila-rity σ.λ for correspondence identification. Given a predefined threshold we clas-sify all activity pairs with a basic bag-of-words similarity score higher than orequal to the threshold as correspondences.
Although our analysis shows this attribute to have the most desirable pro-perties, there will still be false positives and false negatives leading to an unsat-isfactory matching quality [3]. Hence, it is the goal of the feedback analysis tounderstand why mistakes were done and how they could have been avoided.
With regard to the matching process a false positive was suggested becausethe similarity of the activity pair was estimated too high, i.e., it should have beenlower than the threshold. In case of a false negative, it is the other way around,i.e., the similarity should have been higher than the threshold. The main reasonsfor such wrong assessments originate not directly in the basic bag-of-words sim-ilarity, but in the underlying word similarity measure σ.ω. Those measures areeither syntactic, not considering word meaning, or semantic being based on ex-
10

Select
Model Pair
Determine
Alignment
Correct
Alignment
Analyze
User Feedback U
ser
Alg
ori
thm
Fig. 4: Basic mixed-initiative approach to learning
ternal sources of knowledge like lexical databases or corpora [18]. As the creationof such databases or corpora incurs huge manual effort, usually matchers relyon universal ones. In both cases, i.e. syntactic matching or semantic matchingusing universal corpora, the word similarity measures do not sufficiently accountfor domain-specific information, e.g., technical vocabulary or abbreviations, andthus introduce errors.
Consequently, when the user feedback indicates a misclassification of an ac-tivity pair, our learning approach checks which pairs of words contributed tothat misclassification. According to the definition of the basic bag-of-words sim-ilarity, a word pair contributes to an activity pair classification each time ityields the highest similarity score for one word in the respective activity labels.Therefore, in order to adjust the word similarities to the domain characteristicsof the considered process model collection, we decrease the similarity of a pair ofwords whenever it contributed to a false positive, and increase the similarity fora false negative. We do so by defining two counting functions: γfp : (ω1, ω2)→ Nreturns the number of counted false positive contributions for a word pair, andγfn : (ω1, ω2) → N analogously for false negative contributions. Based on thesecounters, we introduce a word similarity correction term.
Definition 5 (Word similarity correction). Let ω1, ω2 be two words. Fur-thermore, let ρfp, ρfn ∈ R be two predefined learning rates. The correction func-tion δ :W2 → R is then defined as:
δ(ω1, ω2) := ρfp × γfp(ω1, ω2) + ρfn × γfn(ω1, ω2)
Note that the counts are multiplied with learning rates; together with thethreshold these are the control parameters of the approach.
Given this correction term and an ordinary word similarity measure σ.ωo, weintroduce the adaptive word similarity σ.ωα.
Definition 6 (Adaptive word similarity). Let ω1, ω2 be two words. Further-more, let δ : W2 → R be a function that returns a correction value for a wordpair. The adapting word similarity function σ.ωα :W2 → [0..1] is then defined as:
σ.ωα(ω1, ω2) :=
1 σ.ωo(ω1, ω2) + δ(ω1, ω2) > 10 σ.ωo(ω1, ω2) + δ(ω1, ω2) < 0σ.ωo(ω1, ω2) + δ(ω1, ω2) else
Since σ.ωo(ω1, ω2) + δ(ω1, ω2) might return a value outside the interval [0, 1],but any σ.ω function is expected to stay within these bounds, we enforce the
11

bounds as per the first and second case in the above definition. We then useσ.ωα as σ.ω in the basic bag-of-words similarity when determining the alignmentbetween two process models.
To illustrate this approach, we refer to Table 3 which outlines the computa-tion of σ.λ for (α1, β1). In previous work [11] we found that a threshold above 0.6yields good results. In this case, the matching algorithm will classify the activitypair as non-corresponding. Collecting user feedback this will be revealed as awrong classification. Thus, the false negative counter will be increased by 2 for(“check”, “complete”) as this word pair yielded the highest value for both wordsand by one for (“complete”, “check”) and for (“complete”, “application”). Hav-ing ρfp set to 0.1 the adaptive word similarity will now roughly be 0.6. Thus, anactivity pair with the labels of α1 and β1 will now be classified as corresponding.
5 Evaluation
This section has two objectives. First, we want to analyze if our mixed-initiativeapproach improves the results of existing matchers with regard to the amountof missing and incorrect correspondences. Second, we aim to derive strategies tominimize the amount of user feedback required to achieve high matching quality.
Experiment Setup. Our evaluation utilizes the birth certificate and the univer-sity admission data sets from the matching competition [3]. The gold standardsserve a dual purpose here: (i) assessing the matching quality and (ii) simulatinguser feedback. Therefore, going through a sequence of model pairs, we first deter-mine an alignment for the current pair and assess the quality of this alignment.That is, we determine the number of true positives (TP), false positives (FP)and false negatives (FN) given the gold standard. We then calculate the stan-dard measures of precision (P) (TP/(TP + FP )), recall (R) (TP/(TP + FN)),and f-measure as their harmonic mean (F) (2× P ×R/(P +R)). Next, we passthe sets of false positives and false negatives to the algorithm which adapts theword similarities accordingly. Then, we move on to the next pair. The average(AVG) and the standard deviation (STD) of all measures and model pairs areused to assess the approach’s quality. These are calculated either as a runningstatistics during learning, or as an overall quality indicator after all model pairshave been matched and the respective feedback has been considered.
We sampled the space of possible threshold values over the interval [0,1] insteps of 0.05 as well as the space of possible false positive and false negativelearning rates over the interval [0,0.2] in steps of 0.01. Moreover, we randomly
Table 6: Best results from matching contest and for word similarity adaptation
Birth Certificate University AdmissionPrecision Recall F-Measure Precision Recall F-Measure
Approach AVG STD AVG STD AVG STD AVG STD AVG STD AVG STD
Baseline .68 .19 .33 .22 .45 .18 .56 .23 .32 .28 .41 .20Adaptive .73 .15 .67 .24 .69 .18 .60 .20 .56 .25 .58 .21
12

generated different model pair sequences in order to check the influence of themodel pair order on the quality. We used the maximum of the Levenshtein [15]and the Lin [16] similarities as the ordinary similarity measure.
Matching Results. Table 6 compares the results of our mixed-initiative ap-proach to a baseline comprised of the best results from the matching competition[3], i.e., the RefMod-Mine/NSCM results for the birth certificate and the bag-of-words similarity with label pruning for the university admission data set. Theresults for the mixed-initiative approach were determined for collecting user feed-back over all model pairs. We observed an increase of the f-measure by 0.24 forthe birth certificate and by 0.17 for the university admission data set. While theprecision remained stable, there was a dramatic improvement in the recall.
Deriving strategies. To derive strategies for minimizing the user workload,we first investigated if the order in which process model pairs are consideredby learning had impact on the overall quality. For this purpose, we determinedthe quality of the basic bag-of-words similarity for each model pair. Then, wesplit the model pairs for each data set into three equal-sized classes, i.e., modelpairs with a high, a medium, and a low f-measure. We generated three sequences(high, medium, and low) where each sequence starts with 12 model pairs of therespective class, randomly ordered, followed by the remaining 24 model pairs,also in random order. Fig. 5 shows the running average f-measure after the ithiteration for all three sequences per data set. The results suggest that the orderonly has a small impact on the final quality, since the average f-measures convergeto roughly the same value as the number of iterations increases. However, therunning average can be misleading: if we start learning with pairs that are alreadymatched well before learning (as in the high case), how much can we learn fromthem? To examine this aspect, we ran a different experiment, where learning isstopped after the ith iteration, and the f-measure over all pairs is computed.The results are shown in Fig. 6, left. Looking at the data, one might hypothesizethat here the user workload per model pair is lower in the high case than for theother sequences. Thus, we also counted the number of changes a user has to dountil learning is stopped. These effort indicators are shown in Fig. 6, right.
First of all, it can be seen that – regardless of the order – the amount of cor-rections is roughly growing linearly without big differences across the sequences.
0
0,2
0,4
0,6
0,8
1 6 11 16 21 26 31 36Aver
age
f-m
easu
re
Number of iterations
Birth Certificate
high medium low baseline
0,15
0,35
0,55
0,75
1 6 11 16 21 26 31 36Aver
age
f-m
easu
re
Number of iterations
University Admission
high medium low baseline
Fig. 5: Running average f-measure after ith iteration
13

0,4
0,5
0,6
0,7
1 6 11 16 21 26 31 36
Av
erag
e f-
mea
sure
Learning stopped after ith iteration
Birth Certificate
high medium low
0
100
200
300
400
1 6 11 16 21 26 31 36
Eff
ort
(n
um
ber
of
chan
ges
)
Learning stopped after ith iteration
Birth Certificate
high medium low
0,4
0,45
0,5
0,55
0,6
1 6 11 16 21 26 31 36
Av
erag
e f-
mea
sure
Learning stopped after ith iteration
University Admission
high medium low
0
100
200
300
400
500
1 6 11 16 21 26 31 36
Eff
ort
(n
um
ber
of
chan
ges
)
Learning stopped after ith iteration
University Admission
high medium low
Fig. 6: Overall average f-measure over all 36 model pairs and the user workloadafter learning for i iterations
Furthermore, the f-measure curves for all three sequences approach each otherwith a growing number of iterations used to learn. When learning is stoppedearly, the best results are yielded for the low and the medium sequences: feed-back on models has a larger impact if matching quality is low beforehand. Finally,regardless of the order, 2/3rds of the improvements are obtained from learningfrom about half the model pairs (i = 16). In practice it is not possible to sortmodel pairs with regard to the f-measure upfront. But as feedback collection andlearning are progressing, the relative improvements can be measured. As soonas the improvements from additional feedback level off, learning can be stopped.
Discussion. The evaluation showed that the incorporation of user feedback ledto strong improvements compared to the top matchers of the matching competi-tion [3]. When feedback was collected for all model pairs, the f-measure increasedby 41% and 53% for the two data sets. Even when reducing the workload by onlycollecting feedback for half of the model pairs, big improvements were obtained.
The major concern of experiments on process model matching relate to ex-ternal validity, i.e. in how far the results of our study can be generalized [25].In this regard, the size of the two data sets restricts the validity of both, the in-dicator assessment and the evaluation. Furthermore, the processes in both datasets represent the same abstract processes. Hence, some structural and behav-ioral characteristics might be underrepresented limiting the significance of theindicator assessment. This problem also has implications on the evaluation of
14

the word similarity adaptation, as the processes only cover a small number oftasks from both domains and a rather limited vocabulary used to describe them.Thus, words might tend to occur more often than in other model collections.Consequently, feedback might be collected for the same word pair more oftenthan usual limiting the generalization of the quality improvements and strategiesto minimize the user’s efforts. Lastly, the indicator assessment does not allow fora general judgement on the sources of information, as there might exist otherencodings of indicators which better exploit these characteristics. Therefore, en-larging the data sets by including data sets which characteristics differ from theonce considered in this paper and considering more indicators are two importantsteps in future work.
6 Conclusions and Future Work
In this paper, we investigated user feedback as a mean for improving the qual-ity of process model matching. Thus, we first reviewed indicators derived fromrelated work and assessed their potential as information sources for feedbackanalysis. This assessment showed that, from the known sources of information,only the label based similarity of activities can reliably be applied to decidewhether an activity pair corresponds or not. In a next step, we designed amixed-initiative approach that adapts the word similarity scores based on userfeedback. We evaluated our approach with regard to established benchmarkingsamples and showed that user feedback can substantially improve the match-ing quality. Furthermore, we investigated strategies to reduce the user workloadwhile maximizing its benefit.
In future research, we plan to investigate further strategies for decreasing theuser workload while maximizing the matching quality. This comprises guidelinesfor choosing model pairs (or activity pairs) the user needs to provide feedbackon. Another direction we plan to pursue is the extension of our approach tobetter account for semantic relations and co-occurrences of words within labels.
References
1. Z. Bellahense, A. Bonifati, and E. Rahm. Schema Matching and Mapping. Springer,Heidelberg, 2011.
2. M. C. Branco, J. Troya, K. Czarnecki, J. M. Kuster, and H. Volzer. Matchingbusiness process workflows across abstraction levels. In MoDELS, pages 626–641,2012.
3. U. Cayoglu, R. Dijkman, M. Dumas, P. Fettke, L. Garcıa-Banuelos, P. Hake,C. Klinkmuller, H. Leopold, A. Ludwig, P. Loos, J. Mendling, A. Oberweis,A. Schoknecht, E. Sheetrit, T. Thaler, M. Ullrich, I. Weber, and M. Weidlich.The process model matching contest 2013. In PMC-MR, 2013.
4. R. Dijkman, M. Dumas, and L. Garcıa-Banuelos. Graph matching algorithms forbusiness process model similarity search. In BPM, pages 48–63, 2009.
5. R. Dijkman, M. Dumas, B. van Dongen, R. Kaarik, and J. Mendling. Similarity ofbusiness process models: Metrics and evaluation. Inf. Syst., 36(2):498–516, 2011.
15

6. M. Dumas, L. Garcıa-Banuelos, and R. M. Dijkman. Similarity search of businessprocess models. IEEE Data Eng. Bull., 32(3):23–28, 2009.
7. C. C. Ekanayake, M. Dumas, L. Garcıa-Banuelos, M. L. Rosa, and A. H. M. terHofstede. Approximate clone detection in repositories of business process models.In BPM, pages 302–318, 2012.
8. J. Euzenat and P. Shvaiko. Ontology Matching. Springer-Verlag, Berlin, 2013.9. D. Grigori, J. C. Corrales, and M. Bouzeghoub. Behavioral Matchmaking for
Service Retrieval. In IEEE ICWS, pages 145–152, 2006.10. T. Jin, J. Wang, M. L. Rosa, A. H. ter Hofstede, and L. Wen. Efficient querying
of large process model repositories. Computers in Industry, 64(1):41–49, 2013.11. C. Klinkmuller, I. Weber, J. Mendling, H. Leopold, and A. Ludwig. Increasing
recall of process model matching by improved activity label matching. In BPM,pages 211–218, 2013.
12. A. Koschmider and E. Blanchard. User assistance for business process modeldecomposition. In IEEE RCIS, pages 445–454, 2007.
13. M. Kunze, M. Weidlich, and M. Weske. Behavioral similarity - a proper metric.In BPM, pages 166–181, 2011.
14. H. Leopold, M. Niepert, M. Weidlich, J. Mendling, R. M. Dijkman, and H. Stuck-enschmidt. Probabilistic optimization of semantic process model matching. InBPM, pages 319–334, 2012.
15. V. I. Levenshtein. Binary codes capable of correcting deletions, insertions andreversals. Soviet Physics Doklady., 10(8):707–710, 1966.
16. D. Lin. An information-theoretic definition of similarity. In ICML, pages 296–304,1998.
17. F. J. Massey. The kolmogorov-smirnov test for goodness of fit. Journal of theAmerican Statistical Association, 46(253):68–78, 1951.
18. R. Navigli. Word sense disambiguation: A survey. ACM Comput. Surv., 41(2):10:1–10:69, 2009.
19. P.-N. Tan, M. Steinbach, and V. Kumar. Introduction to Data Mining, (FirstEdition). Addison-Wesley Longman Publishing Co., Inc., Boston, 2005.
20. J. Vanhatalo, H. Volzer, and J. Koehler. The refined process structure tree. DataKnowl. Eng., 68(9):793–818, 2009.
21. M. Weidlich, R. M. Dijkman, and J. Mendling. The ICoP framework: Identificationof correspondences between process models. In CAiSE, pages 483–498, 2010.
22. M. Weidlich, J. Mendling, and M. Weske. Efficient consistency measurement basedon behavioral profiles of process models. IEEE Trans. Softw. Eng., 37(3):410–429,2011.
23. M. Weidlich, T. Sagi, H. Leopold, A. Gal, and J. Mendling. Predicting the qualityof process model matching. In BPM, pages 203–210, 2013.
24. M. Weidlich, E. Sheetrit, M. C. Branco, and A. Gal. Matching business processmodels using positional passage-based language models. In ER, pages 130–137,2013.
25. C. Wohlin, P. Runeson, M. Host, M. C. Ohlsson, B. Regnell, and A. Wesslen. Ex-perimentation in Software Engineering: An Introduction. Kluwer Academic Pub-lishers, 2000.
26. H. Zha, J. Wang, L. Wen, C. Wang, and J. Sun. A workflow net similarity measurebased on transition adjacency relations. Computers in Industry, 61(5):463 – 471,2010.
16