listeningin steve goldman, quant with a record 07 21 17... · 2018-06-11 · let me be perfectly...
TRANSCRIPT

Let me be perfectly blunt.When I first met StevenGoldman, 18 years ago,he was an enigma. Thisstudious, bespectacledfellow sitting at the endof Weeden & Co.’s often-raucous trading desk,surrounded by even morecomputer screens thanthe rest of the guys,rarely raised his head —or his voice. But when hedid, the room stilled.Virtually everyone want-ed to hear what “Goldie”was saying over the hoot.
Steve was Weeden’s chiefmarket strategist and, asfar as he was concerned,I was a new kid on theblock of a potentiallymost dangerous sort. Ajournalist, of all things,hired as an “analyst”whose new publication(you’re reading its successor) was supposed to bur-nish the firm’s reputation in research. So, whileunfailingly cordial, Steve was very careful what hesaid to me.
Besides his own reputation, you see, Steve had hisstrategy to protect. His career-long endeavor to deci-pher the myriad tell-tale signals that he had longbeen convinced could give him profit-enhancingearly indicators of the direction of the stock market.So like many proud inventors, he guarded thedetails of his strategy — well, obsessively.
But I was curious. And asevidence mounted thatthis guy who liked to talkin riddles was prettylucky in calling the mar-ket’s fits and starts, Istarted using break roomconversations to chal-lenge and pester Goldieover his puzzles. But Icouldn’t crack them — orhim, for that matter.
Then, after the internetbubble popped, sendingthe market into a deepfunk that turned immea-surably darker, society-wide, with the horrors of9/11, it seemed for a timeas if animal spirits wouldnever revive. But in thesummer of 2002 — inwhat seemed to me, atthe time, an inexplicablereversal — cautiouslyoptimistic sounds started
coming from Goldie’s end of the trading desk.Characteristically (and frustratingly) tentative atfirst, but then with building conviction, Steve wastelling clients the worst was over. Re-invest.
It was a brilliant call. And after only about sixmonths of cajoling, Barry Small, then Weeden’sCEO, convinced Steve to cooperate with me so that Icould write about it. I’m republishing that piece,originally dated May 16, 2003, just behind ourinterview in this issue of WOWS, for readers who arelikely as skeptical as I was. Because the crazy thing
RESEARCH SEE
DISCLOSURES PAGEs14-15
V O L UME 6
I S S U E 9
JULY 21, 2017
INSIDE
WELLINGONWALLST. July 21, 2017 PAGE 1
Listening InGoldie Does
The Impossible:Times The MarketTrading Idea-ReduxSteven Goldman’sSignal 2002’s Call
Guest PerspectivesChicago Fed
Comparing IntlTax Burdens Bob Preston
Banish Tech Bubble Mark Lapolla
Dam the Amazon? Hoisington & HuntFed’s Dubious Model
Joe SaluzziSen. Warner Turns
Up The Heat
Chart SightingsAndrew AddisonWhere’s Inflation?
Deep DivesCliff Asness et al
Rime, Schrimpf, SyrstadLasse Pedersen
Asness
Acute ObservationsComic SkewsHot Links
ALL ON WEBSITE
www.WellingonWallSt.com
listeninginSteve Goldman, Quant With A RecordUber-Patient, Computer-Savvy Strategist Revels In Market Complexity
Steve Goldman

WELLINGONWALLST. July 21, 2017 PAGE 2
is, Steve has kept minutely timing the market allthese years, using his calls to invest in S&P futuresfor himself — and for managed accounts at hiscommodities trading advisory firm, GoldmanManagement, Inc., as well as for a CTA limitedpartnership called [until Oct. 13, 2017], GoldmanNavigator Fund, LP. [On that date, Steve’s newmutual fund, formed in association with USAMutuals, and dubbed the USAM Navigator Fund(UNAVX) commenced investment operations andsimultaneously converted the assets of his prede-cessor partnership intoinstitutional classsshares of UNAVX.]Anyway, his record,improbable as it mayseem, has to be seen to bebelieved.
Steve was nice enough tochat with me early thisweek, from hisSpringfield, NJ office.Listen in, and prepare tobe impressed. KMW.
Hi Steve, it’s been awhile since we’vetalked on therecord. Let’s givefolks some back-ground on you that Imight not get in theintroduction. Wemet at Weeden,when I joined inMarch of 1999. AndI think you went offon your own shortlybefore I did, in thespring of 2012. Right. I left Weeden inSeptember, 2011. Soyou’ve seen me inaction, you’ve seen the dynamic calls, and many ofmy write-ups. I’ve actually published them seam-lessly since the late 1980s.
You have been kind enough to share themwith me. What they’ve told me is thatyou’ve done considerably better than theS&P. Thanks, but talking too specifically about perfor-mance is ticklish at the moment. I’m in the midstof negotiations to convert my fund into a mutual
fund. [Working with USA Mutuals, Steve accom-plished that conversion on Oct. 13, 2017, with thelaunch of UNAVX, USA Mutuals Navigator FundInstitutional Class. Simultaneous with the com-mencement of UNAVX’s investment operations, theGoldman Navigator Fund, L.P., a limited partner-ship managed by Steven Goldman (the UNAVXportfolio manager) converted the PredecessorPartnership into Institutional class shares of the newFund by contributing all of its assets to the Fund inexchange for Institutional Class shares of the
Fund.]
Go back even fur-ther, Steve. Whatattracted you to thestock market?Well, when I graduatedfrom the University ofMaryland in 1979, withan emphasis in econom-ics and finance, mythen-girlfriend’s unclebasically said, “Comeinto the business,” so Idid. Started working as abroker in the Fort Lee,N.J. office of Gruntal,while going to graduateschool at Baruch atnight. I focused onemerging growth compa-nies, looking at relativestrength, at the ValueLine surveys — pickingstocks.
You? You started asa stock picker? Not for long. What Ifound, between ’79 and’81, was that I was pick-ing stocks but the mar-ket invariably wasdeciding my fate. In ret-
rospect, I realized that because the stock markettraded in a symmetrical range from ’66 to ’81, thefirst thing that was going to determine my invest-ment outcome was getting the direction of the mar-ket right.
A “symmetrical” range? How so?I mean, the Dow Jones Industrial Average had beenbouncing between 1,000 and 600 or 700, for 15 years.
So it was spinning its wheels, in effect.
“The original iterationof my strategy, formulated in my thesis, was
essentially a black box,but by the beginning of 1987, I’d decided
to make it open-ended.I was constantly finding
new indicators andrefining the strategy —Even to this day, I’ve
never stopped research-ing ways to sharpen thestrategy’s cornerstones
and principles.”
Published exclusivelyfor professional investors
by Welling ON Wall St. LLC
ISSN 2332-161X
Kathryn M. WellingEditor, Publisher & Principal
[email protected]. (631)315-5076Cell. (973)650-2722
Donald R. BoyleChief Financial OfficerChief Marketing Officer
[email protected]. (631)315-5077Cell. (201)394-1548
Distributed biweekly, usually on Fridays, 18 times a year, by
Welling ON Wall St. LLCPO Box 620
Mattituck, NY 11952
Office:(631)315-5076Fax. (631)315-5077
Copyright Warning and Notice. It is a violation of
federal copyright law to repro-duce all or part of this publica-
tion or its contents by any means. The Copyright
Act imposes liability of up to $150,000 per issue for
such infringement.Welling ON Wall St. LLCdoes not license or authorize redistribution in any form by
clients or anyone else.However, clients may print onepersonal copy and limited
reprint/republication permis-sion may be made available, inwriting, upon specific request.
Copyright 2017, K.M. Welling and
Welling on Wall St. LLCAll rights reserved and vigorously enforced.
WELLINGONWALLST. July 21, 2017 PAGE 3
But fortunes weremade on thosemoves. Right. Which made methink, “Shouldn’t I be amarket timer rather thana stock picker?” Happily,my realization prettymuch coincided with theadvent of personal com-puters. I was one of thefirst to buy an Apple II. Iremember rushing homefrom the Hamptons —much to my wife’s chagrin— in ’81 when I got thecall it was delivered. It’sstill in my office recep-tion area — still runs, Ithink.
I guess you didn’t buyit to play games —No. I’ve been using com-puters to work diligentlyon my strategy, full-time,ever since then. My .MBA thesis, in 1984, was basedon “A Random Walk Down Wall Street” and I like tothink that if someone asks me to justify how I amallocated to the market, I could give them a mini-the-sis outlining the data-driven reasons for my stance.
I have to ask. Why did you structureGoldman Management as a commoditiestrading advisor, when you’re focused onbesting the stock market — specifically,the S&P 500 index?Timing. The No. 1 reason is that I started trading mystrategy in 1984. Back then, there weren’t any otherinstruments to use to trade a basket of stocks repre-senting the S&P 500. It wasn’t until around 2005, Ibelieve, that SPDRs were introduced.
The original iteration of my strategy, formulated inmy thesis, was essentially a black box, but by thebeginning of 1987, I’d decided to make it open-ended. I was constantly finding new indicators andrefining the strategy — so it didn’t make sense tostick with a black box model. I also became a discre-tionary trader at about that time, when I joinedWeeden as chief market strategist and a partner. ButI’ve continued to evolve my strategy, to enhance mymethodologies. Even to this day, I’ve never stoppedresearching ways to sharpen the strategy’s corner-stones and principles.
Yet my trading returns have been more or less con-sistent throughout the decades. Needless, to say,I’ve upgraded my computer resources considerably,as well!
How did you land at Weeden & Co.?I talked to a number of people before then, consid-ered joining Michael Steinhardt’s SteinhardtPartners and going to Prudential with JackSchwager, but I decided to go to Weeden becauseit was a medium-sized firm. I knew I’d have anopportunity to make a name for myself, workingwith the principals. I’m not aware of many othermarket strategists in Wall Street who succeeded atone firm over those 26 years. For that, and manyother reasons, I’m grateful for working there — andto our special colleagues/partners who created itsunusual, family-like environment.
Nobody phoned it in, that’s for sure. Therewere investment opinions aplenty aroundthat desk, but I saw very quickly thatyours commanded unusual respect. Well, that’s another reason I’m grateful. I have anumber of Weeden employees, past and present,as investors in my fund — and they’ve known me20 years or more!
Here’s the thing, Steve. If your record isas sterling as you say, why keep tinkeringwith your strategy? Or is that why it has
Subscriptions toWellingonWallSt.
Welcome!Payable in researchvotes or hard dollars.
contact:Don Boyle
Amazon Prime Directive, Jeff Koterba,Omaha World Herald, NE

kept working, as markets have morphed? After 33 years, I continue to surprise myself thatmy research opportunities aren’t exhausted. I’mcontinually astonished during the course of theyear to find new avenues to pursue in studying thedirect and indirect drivers that affect the directionof stock prices. There’s still very little that makesme more excited than increasing my knowledgeand enhancing my indicators. The best way I canthink to describe it is that I’ve been putting togeth-er this mosaic and the more kernels of informationI add, the clearer the picture becomes. As I said,the basic principles have worked fine since the1980s and that continues to this day.
I well know the last thing you’ll do isreveal your “secret sauce,” but how aboutdescribing the strategy’s basic principles? Well, the strategy’s basic principles fall into fivebroad categories — I refer to them as “UNAVX’scornerstones of investment.” They are valuations,sentiment, market internals, monetary environmentand macro.
I can be a bit secretive about some of the proprietaryways I combine many indicators, but my investmentphilosophies and the cornerstones of my analysis arescarcely unique. It’s how I interchange them andapply them against historical experience — specifi-cally, the vast data base I’ve compiled over the last37 years — that I believe creates alpha.
So tell me as much as you’re willing todivulge about what you do in GoldmanManagement—Okay, Goldman Management was a CTA that hadoffered a fund, [the assets of which, as noted previous-ly, have now been converted into USA MutualsNavigator Fund, Institutional Class, as of Oct. 13,2017, with Steve as PM]. So [now UNAVX] specializes in discretionary tacti-cal trading in the U.S. stock market through position-ing in the S&P and/or domestic stock index futures— and in that pursuit, it uses more than 300 indica-tors and dozens of models.
While this strategy is discretionary in nature, itrelies on the proprietary quantitative indicators andmodels I’ve developed over my career. The indica-tors are both technical and fundamental. My dataon many go back daily to the early-1900s. Thestrategy is well-tested. There’s a quantitative struc-ture that is overlaid with a discretionary overviewto enhance my ability to fine-tune it. Let me stressthat everything that goes into it is data-driven.
You’re a quant, first and foremost —It all goes back to my belief that market timing isone of the most critical aspects of portfolio returns.When you review UNAVX’s track record, what youshould find is a high level of consistency in main-taining a high level of stock market exposure — ahigh correlation — during bull market phases.Also, low levels of exposure — a negative correla-tion — during corrective phases. You’ll also seethere’s an added element of opportunistically trad-ing to create alpha during major phases. So thereare times that I trade around my core positioning.
I’ve also spent a lot of time allotting the indicatorsI follow to various groups that help me determinewhat phase the market is in — and trade accord-ingly. My principal objective is to profit from alltypes markets. To consistently outperform the mar-ket with lower volatility throughout market cycles.So gross exposure, over the past decade, has variedfrom 130% long to minus 40% short.What do you say to eternal skeptics likeme who insist that market timing is ulti-mately a futile endeavor? I have to say,the hot hands I’ve known have inevitablycooled.That’s usually correct.
Why are you the exception? Well, I’ve actually shown I can do it for more than30 years now. I’ve spent a lifetime developing thisstrategy — and I continue to devote my life torefining it. Plus, I incorporate multiple disciplinesinto the strategy. It’s multi-dimensional.
I like to describe the foundation of this strategy asthe dynamic discovery, historical testing and rigor-ous assessment of market data — in pursuit of pre-dictive qualitative factors that directly or indirectlydrive stock price behavior. My entire collection ofindicators and proprietary models, I employ syner-gistically to create an ever-evolving strategyfocused on predicting market behavior — andemphasizing profiting from those predictions whenrewards are attractive, relative to risks.
Another way I like to put it is, I’m an economistbut I’m not the best economist. I’m a computer pro-grammer — but I’m probably not the best comput-er programmer. I’m a quantitative person with avast data base, but it’s probably not the mostextensive, anywhere. I’m a pretty good tape reader,too, but probably not the best ever.
Then why has your strategy worked sowell, for so long?
Subscriptions toWellingonWallSt.
Welcome!Payable in researchvotes or hard dollars.
contact:Don Boyle
WELLINGONWALLST. July 21, 2017 PAGE 4

I once heard the cartoonist, Scot Adams, the cre-ator of “Dilbert” say something like, “I’m not thebest comedian, and I’m not the best illustrator, butthe combination works.” It’s sort of like that forme. It’s really the fact that the strategy combinesall the things I’ve mentioned and more — and notalways in the same ways — that makes it durable.And the unique models I’ve developed areemployed in varying combinations to increase thepredictive power of the data. There are alwaysunique features to market periods, so how do youapply your indicators? It really takes a deep under-standing of all of them, in all their permutations, toknow when something won’t work — and when itwill.
But presumably there’s a rhyme and areason in the way you come to thatunderstanding —How the data and models behave and align in dif-ferent market cycles and at market inflectionpoints is a key. Value is added through the integra-tion of all these inputs into a quantitative decisionmatrix. My emphasis is on low-risk entry/exitpoints. I rely on this quantitative matrix to discre-tionarily predict market behavior — and to posi-tion exposure accordingly in stock index futures.This process has signaled key behavioral phases inthe stock market across multiple business cycles.
Before we get to examples, can I get youto be a bit more specific about the sortsof quantitative data you look at? It’s notsun spots or Trump’s tweet count, is it?
Very funny. The components of my decision matrixtypically fall into familiar investment categories —fundamental valuations, stock market structure,market sentiment, momentum measures, over-bought/oversold measures, central bank monetarypolicy, and macro factors. It’s when I further distillthem into four major decision themes that I callthem [UNAVX’s] cornerstones of investment.
You said one is valuation. How do youemploy it?Market valuation, whether over-valued, under-val-ued or neutral, is a strong indication of the inter-mediate term risk/reward for stock prices. In par-ticular, I find that the median P/E ratio on theaverage stock is a valuable gauge in the short andintermediate time horizon. Then interest rates andrisk premiums are frequently factored into the vari-ous equations and models to standardize for differ-ent economic environments.
Sentiment is another, I think?Yes, I use more than three dozen indicators indaily and weekly sentiment models to assessinvestor expectations. These sentiment indicatorsare contrarian tools used to pinpoint the market’sshort-term inflection points, particularly after sell-offs. Interim market bottoms in bull markets fre-quently are reached as sentiment readings registermodestly bearish levels. In an actual bear marketbottom, however, sentiment gauges generally needto reach greater bearish extremes.
Then what sort of market internals are
WELLINGONWALLST. July 21, 2017 PAGE 5
Subscriptions toWellingonWallSt.
Welcome!Payable in researchvotes or hard dollars.
contact:Don Boyle
Source: All charts and tablescourtesy of USAM Navigator Fund[UNAVX]. Past Performance isnot necessarily indicative offuture results.
USAM Navigator Fund Class I - UNAVX - ReturnsCompared To Other Asset Classes

another cornerstone? Indicators like momentum, market structure andseasonal factors. Similar to sentiment readings, thisgroup of indicators shows a significant capacity toidentify market turns. Momentum readings arederived from strength or acceleration in the rate ofstock price change and can indicate the market’slikelihood to continue up or down.
And “market structure” refers to evaluating theoverall stock market vs. the individual issues and
industry groups thatcomprise it. When broadstock prices continue inan upward direction, butindividual stocks andgroups start to underper-form, stricter risk controlmeasures become neces-sary.
Okay, your monetaryindicators involveFed watching, I’mguessing —These days. The mone-tary environment isstrongly influenced byinterest rates and macro-economic circumstances.From the 1950s to 1999,short-term interest rateswere a major driver ofstock price direction.But, in the aftermath ofimploding bubbles inboth real estate andstock prices, the Fedaggressively loweredshort-term rates to near
zero, rendering them less influential. Creditspreads and long-term rates, however, continue toinfluence the intermediate direction in stockprices.
Are all your cornerstones equally weight-ed in your analysis?No, it’s the relative alignment of my cornerstonesthat determines the direction and the potentialmagnitude of changes in stock prices. Their signalspaint a picture of the evolving market environment
WELLLINGONWALLST. July 21, 2017 PAGE 6
Investment Cycle With and Without Fees2002 to July 2007
UNAVX
Gross UNAVX
Investment Cycle With and Without FeesJuly 2007 to Present
Source: All charts and tablescourtesy of USAM Navigator Fund[UNAVX]. Past Performance isnot necessarily indicative offuture results.

WELLINGONWALLST. July 21, 2017 PAGE 7
and become the core drivers of the relative expo-sure decisions I make for the portfolios. Alpha iscreated through the combination of interpreting thecornerstones and selecting the appropriate stockmarket exposures. If you pressed me to outline thekeys to my process, they’d be that its constantlyevolving. The research, like the market, is dynam-ic. It’s the interpretation of indicators in variedcombinations that creates alpha, not any individualone. No one cornerstone or model is a determiningfactor or standalone signal. And it’s often the align-ment of cornerstones that illuminates inflectionpoints in the market — helping determine thedirection and potential magnitude of stock pricemoves.
Does risk control figure prominently inyour strategy? It’s actually integrated into the whole process. Bylimiting our investments to futures on a broaddomestic stock index, [UNAVX] eliminates a largenumber of idiosyncratic risks usually linked tostock selection — systematic risk. Our risk is dis-
tilled down to one core parameter — exposure. Andmanaging it as a function of perceived opportunity
Draw DownsS&P vs. UNAVX
UNAVXHistorical Probabilities Of Monthly Returns
UNAVXSPX
Source: All charts and tablescourtesy of USAM Navigator Fund[UNAVX]. Past Performance isnot necessarily indicative offuture results.

— or lack thereof — puts risk control at the centerof the process. In other words, exposure levels aredynamically varied based on signal strength —which is analyzed throughout the trade day and canprompt intra-day adjustments of exposure. The rel-ative strength of trading signals is also used todynamically adjust leverage levels.
How about giving me a specific example ofhow it all works?Well, a certain “desert island” indicator worked inthe ’60s until 2000 — it involved Treasury bills. Thestock market would never go down — invariably — ifinterest rates were trending lower. Only whenTreasury bills would go up by X percentage pointswas the stock market potentially vulnerable. Then itturned out the indicator is no longer relevant whenbubbles started imploding. It didn’t work in Japan, itsubsequently didn’t work here in 2000, it didn’t workin 2007. The lesson, clearly, is that you need a deepand broad understanding of your indicators — whenthey are going to work and when they’re not.
Again, it’s my broad-based overview that’s mostimportant. At any time, pieces of your radar aregoing to get knocked down, so it’s important tohave alternative radars also working for you. It’sthe breadth of the analysis. It’s my 38 years ofresearching the stock market on a consistent, full-time basis that potentially makes the difference.
Are you saying history doesn’t repeat, but itrhymes, and your strategy is tuned to pick-ing up subtle variations in those patterns?Yes, plus I try to avoid the white noise that is so muchmarket chatter. A lot of faulty narratives get passedaround today, ones that just are never researched
or analyzed against the data. Having a data-driven,logic-based investment process allows for objectivethought — allows you the confidence to implementyour trading strategies.
For instance?It was, what, a year-and-a-half ago, when we wentthrough that January correction, and the consensusquickly became, “we must be heading into a reces-sion.” But, if you looked at the 10 indicators thathistorically signify an increase in risk associatedwith recessions, not one was flashing a warning.Yet everybody was saying, “recession.”
And that was enough to keep you invest-ed? Again, a legacy of evolution is embedded in my con-fidence in trading the strategy. It’s a repeatable, ana-lytical software process, based on the indicators,which embrace a number of economic, fundamental,technical, quant and tape-reading principles — indi-cators that I’ve found predictive of subsequent mar-ket behavior.
Tape reading is almost a lost art, Steve — There’s a fine-tuning aspect to it that is quantita-tive. So for me, it isn’t a lost art. There’s a story-line, there’s a poetry, there are certain nuancesthat come out on the tape. Again, it’s not a primaryindicator I use. It’s when my indicators becomeconflicting, when the market’s risk profile hasrisen, or when I’m close to implementing a trade (Itypically trade in tranches) that I may resort to tapereading. If I have very bullish market projections,then I don’t look at the fine-tuning indicators as adeterminant.
It’s the weight of evidence — the summation of myindicators — that I express in the weighting of[UNAVX’s] equity exposure. But there’s also atimeliness aspect to my indicators that’s veryimportant. The indicators fall into timeliness cate-gories ranging from one day to one week, from onemonth to three months and from six months to oneyear. And I adjust exposures accordingly.
It’s probably worth mentioning here, too,that your market-timing focus is reallyshort to intermediate term. You rarely lookout beyond six months.That’s right.
Do you never feel lost in oceans of data?No, all of this continuous discovery, historical test-ing, and rigorous assessment of data is for one pur-pose: Pursuing predictive, quantitative factors that
WELLINGONWALLST. July 21, 2017 PAGE 8
Subscriptions toWellingonWallSt.
Welcome!Payable in researchvotes or hard dollars.
contact:Don Boyle
Yearly Market CallUNAVX vs. S&P Price Changes
Source: All tables courtesy ofUSAM Navigator Fund [UNAVX].Past Performance is not neces-sarily indicative of futureresults.
WELLINGONWALLST. July 21, 2017 PAGE 9
directly or indirectly affect equity prices. That’s thefoundation of everything I do at [UNAVX].
Let me emphasize, the last thing I look for are whatBuffett has called “desert island” indicators — a sin-gle signal that would supposedly be all I’d need, ifshipwrecked. No one indicator makes a difference forme. It’s the combination of indicators that reallygives me increased prognosticating power.
I guess another way to put it is that youactually embrace market complexity. Yes, yes, yes. Correct. And I’m a big proponent ofstudying history — I’ve spent my whole career, find-ing every source imaginable. Reading countlessbooks, ranging from Marty Zweig’s “Winning on WallStreet,” to Norman Fosback’s “Stock Market Logic” toall of Ned Davis’ guides. Everything I could find thatinvolved quantitative indicators — not just opinions.There were many mentors in the beginning, theneventually you just take flight. I continue to look fornew quantitative indicators, but these days theprocess tends to be more self-exploration than find-ing others who’ve discovered kernels. Really, whenyou have hundreds of indicators, all interacting, youcan have literally an infinite number of setups. Butyou have to find which are significant, by applyingyour knowledge, understanding your indicators andcomparing today’s environment with the past.
Let’s talk about how you’ve put all thistogether to make market calls. You weren’ttaken by surprise in 2007, I recall.No, as early as May 2007, I started telling clients at
Weeden and in my letters that defensive positioningwas warranted. The S&P in that June declined by1.8%. But my trading returns that month were a posi-tive 0.8%. In July, the S&P fell by 3%, but my trad-ing account climbed by 4.1%. That August, the S&Pgot hammered, plunging 3.7%, but my tradingaccount rose by 6.6%.
Some of the drivers / bullet points that I mentionedduring that time in my research reports at Weedenincluded: Long-term yields moved to the highestlevel in five years, while the S&P was at an all-timehigh. Since the 1960’s a move to a two-year high inlong-term rates accompanied with the S&P at or neara two-year high had occurred seven other times. Inthose instances, the S&P one month later was frac-tionally lower and, over the following three months,was lower by nearly 4%.
So? Later in August, I went so far as to put out an interimreport — intra-week — which was something I hard-ly ever did. But I wanted to stress to clients that mar-ket risk had increased another notch in just a fewshort weeks. The weight of evidence suggested thatmarket gains should become more difficult.Additionally, the earnings yield divided by bondyields, or the risk premium, was nearing zero. In fact,that ratio went to one of its lowest levels in the previ-ous 10 years.
Then, as the month progressed, market structure justkept deteriorating. Recessionary risk over recentmonths had also steadily increased.
Subscriptions toWellingonWallSt.
Welcome!Payable in researchvotes or hard dollars.
contact:Don Boyle
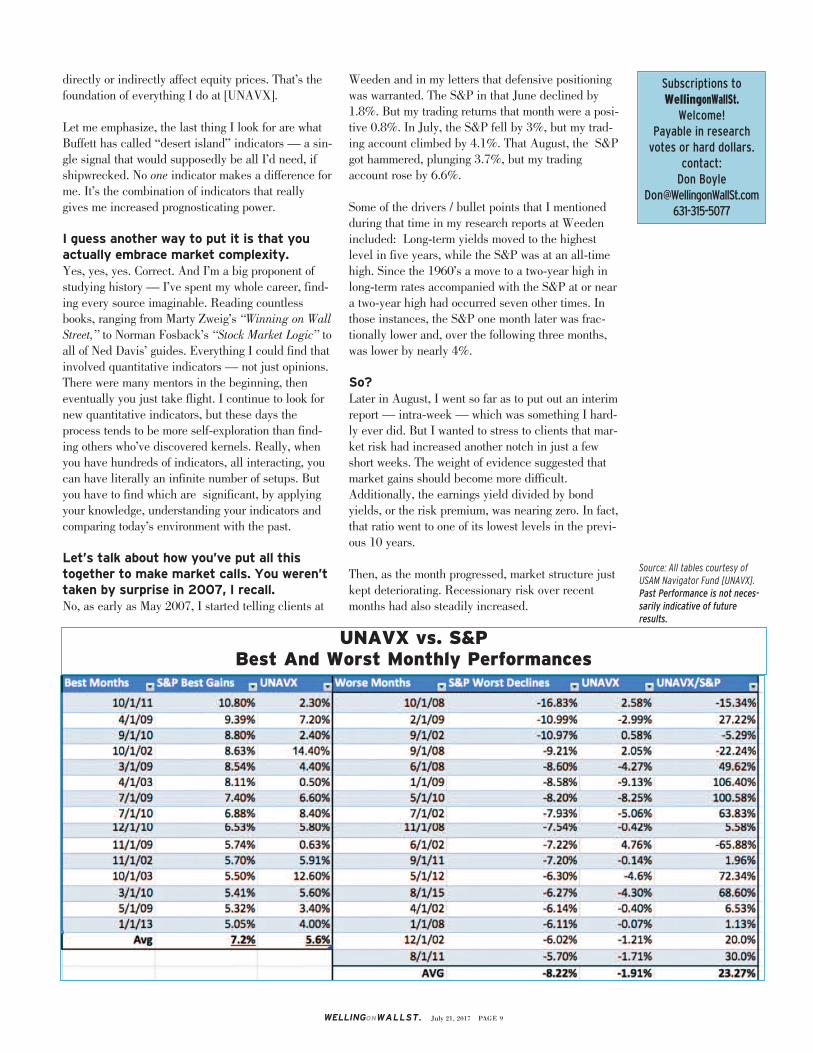
UNAVX vs. S&PBest And Worst Monthly Performances
Source: All tables courtesy ofUSAM Navigator Fund [UNAVX].Past Performance is not neces-sarily indicative of futureresults.

So based on my strategy’s cornerstones — the mone-tary backdrop, valuations and market structure — Iwas fully expecting a worsening outlook. My recordshows that I switched my allocation from an invest-ment stance that summer — which was no longerappropriate — to a trading approach. And myresults, which had been highly correlated to the mar-ket as it rallied into that summer, became inverselycorrelated to the market’s as my warning signsmounted and then as the crisis hit.
You mentioned earlier that you weren’t sur-prised in the beginning of 2016, like a lot ofinvestors were, as the market suddenlyturned south. The S&P was vulnerable at that juncture, given theweakness in oil prices, the fragile macro backdropand a topping process that had been etched over theprior six months. Nevertheless, after the pullback,market chatter was increasingly all about a recession.Our premise, based on our signals, was that we’d seea short-lived market decline, similar to those in othernon-economic bear markets.
You didn’t buy the gloom and doom?No. Reviewing other non-economic bear markets, werecognized certain characteristics.
Meaning what?We can go back and look at all the historical non-recessionary intermediate-term bear cycles. Even ifyou look at only the declines since the 1980s, you’llsee that 1987, ’98 and 2011 were non-recessionarybear markets. But none of those got as depressed asthis one did, in one aspect: The two-year rate ofchange, or the 500-day rate of change, got to zero inthis one. In ’87, ’98 and 2000, it never got downthere.
It didn’t?No. After the market decline in 2000, the 500-dayrate of change hit 3%. The ’98, number, after that20% decline, with Long-Term Capital’s collapse, wasstill 38%. And after 1987’s 30-something-percentdecline, the rate of change stood at 8%. So in someways, this market has been moving sideways for twoyears. We didn’t see that kind of grinding lack ofprogress, even in those earlier bear periods.
During bearish stretches in the ’60s and ’70s, we didget the rate of change down to zero, but that wasagainst a very different sort of economic backdrop.Interest rates were a determining factor back thenand it took a little longer for higher rates to squelchout the excesses.
Nevertheless, my point is that when the market’s500-day rate of change got down to zero as thatretreat in 2016 was first bottoming in January, it wasdoing it in a non-recessionary environment. And his-tory says that when the market drops like that — andthe decline is not related to a recession — the medi-an length of that decline is about six months, andthe base-building process is short in duration.
Which is pretty much what happened, as Irecall.Well, we had the January low, and then we got aretest in February. Afterwards, we had expectations,based on the data, that we’d be up, from the bottom— by 25% in about a year. The actual result wasthat we were up 27% a year later. Now again, thatcall wasn’t based on just one indicator. It was thesummation of all my indicators. But it happened thatin looking at them, there was a big-picture theme tobe discerned, the non-recessionary bear market.
Of course almost nobody called thatDecember-January affair a bear marketback then. They were too fixated on FANGs,and the more typical longer-term 20%decline definition of a bear market. Well, as you know, my focus is on market timing, soI watch short and intermediate-term market moves.Peak to trough, the S&P fell 15% that December-January, but its rate of change went down to zero.The overall decline was moderated because interestrates were nosediving at the same time, holding upthe defensive sectors of the market. The S&P proba-bly would have been down 20%, if it wasn’t for thathuge decline in interest rates. And financial stocksretreated 25%. As it happens, that is also a mean-ingful indicator in my toolbox.
Does your kit include ice water for yourveins? You never seem nervous, even whenyour conviction waxes and wanes.I guess what you could say is that I’m the product ofmy objective quantitative indicators at this point. Idon’t have an opinion, I don’t have views. I have dataand probabilities. It’s a big difference.
That’s what the fund has demonstrated: 16.50%annualized gross returns over the past 16 years. In aprivate partnership, it has averaged 12%. UNAVX’sgros Sharpe ratio is 1.4 — that’s almost three timesthe S&P’s. The Sortino ratio on UNAVX, at 2.8, isthree times the S&P’s.
The very long-term chart (top chart, page 5) reflectsa comparison of other assets classes to the UNAVX
WELLINGONWALLST. July 21, 2017 PAGE 10
Subscriptions toWellingonWallSt.
Welcome!Payable in researchvotes or hard dollars.
contact:Don Boyle

since 2002 — adjusted to show the results net ofperformance fees.
It’s fair to say, then, that UNAVX has demonstrat-ed superior risk-adjusted performance over severalmarket cycles — and the two charts on page 6show the fund’s long-term record broken down intothose full market cycles. The first, between 2002through June, 2007. And the second, from July2007 through to the present. The strategy has hadonly one losing year in the last 15 years. That wasin 2015, when it was down by four-tenths of a basispoint, gross, and by 1.4%, net.
What about intra-year roller coaster rides?If you look (table, bottom page 9) at the worst drawdowns in UNAVX during the years between 2002and currently — the highest monthly peak to low-est monthly peak — they’ve averaged minus5.67%. It has tended to recoup 70%-100% of thelosses, on average, within 2.7 months. Again,UNAVX’s historical returns are 979.15% vs. a223.10% return in the S&P — and that outperfor-mance was due to the avoidance of bear markets.
To review, from February 2002 to the bear marketlow in September of 2002, the market dropped29% — but UNAVX lost only 35 basis points inthat decline. The other ugly bear market wasbetween June of 2007 and March of 2009, whenthe S&P 500 declined by 52.6%.UNAVX gained2.1% during that stretch. On a cumulative basis,the S&P lost 79% while UNAVX gained 1.75%(gross basis).
What are your numbers over the full cycles?Again, if you measure from the peak in February2002 to the 2007 peak, the S&P returned 46.5%.The return on UNAVX in the same period was208%, gross.
Measured the same way, in the still-incomplete“full cycle” from July 2007 to the present, the S&Pis up just under 90% and the return (gross) onUNAVX is about 255.16%.
The other thing prospective clients like to look at ishow often has UNAVX bet wrong? One measure Iuse to give them an idea of that is how often hasUNAVX lost more than 1% within a six-monthwindow? Historically, this has occurred 12% of thetime.
Prospective clients must also focus onhow much it’ll cost them to implementyour strategy, given that you trade a lot. The fund’s trading costs are almost insignificant.
Not even a fraction of a decimal point. I don’t real-ly trade that much — and you can trade $125,000worth of futures, round trip, for $6-$7. The marketin S&P futures is quite liquid, so I should be ableto scale my strategy fairly easily. There’s also a taxbreak, by the way, because it’s 60/40 long-term/short-term trades Plus, in the futures markets, youdon’t have to put up all the money to take a posi-tion, just a down payment. But if you want to putup all the money — avoid leverage — you get paidinterest on your money. Which is starting to add upagain, finally, at 1.25%.
It pretty much seems today we’re in analternate investment universe. What areyour indicators telling you about this mar-ket environment?Some of the things that are relevant presently arefrom an intermediate-term perspective — in early-February we were getting the kind of momentumprojections that tend to last over the next sixmonths. They’re not enormously significant momen-tum projections, but they did suggest that the skewof the gain — meaning the rate of gain, versusdraw downs, should stay very shallow, with modestprojections going forward.
Well, that six-month stretch is fast-approaching its end —But most recently, minor momentum signals wererendered, as well...implying the trend is intact. Theend result, as I was anticipating in February, willprobably be no more than about a 10% gain in thisadvance’s first six months and then maybe 5% inits second half.
As you may recall from the monthly letters I sentout late last year, I’ve been detailing some reasonsthat the usual drops in earnings and in estimaterevisions, which we often see as a year progresses,might be less troublesome this year than they havebeen in the past. That has been something I’ve con-tinued seeing as this year has progressed. There was actually a study put out by McKinseynot that long ago that found Wall Street analystshad meaningfully cut their annual earnings esti-mates during every year from 1985 to 2008 —except in two years, 2005 and 2006. But this year,we’re seeing analysts cautiously raising their earn-ings estimates. I bring this up because if you lookat S&P performance during ’05 and ’06, returnswere very good in each year’s second half — aswhat was happening with earnings became obvious.
Do you have a sense of what’s driving therise in earnings?One of the main determinants regarding earnings is
WELLINGONWALLST. July 21, 2017 PAGE 11
Subscriptions toWellingonWallSt.
Welcome!Payable in researchvotes or hard dollars.
contact:Don Boyle

the firming in the industrial metals prices. Thisgroup’s profits declined by roughly 25% from 2014to January 2016 — and earnings expectationsdeclined rapidly, as well, which led to an earningsrecession. But in the past nine months, global PMIshave been improving.
And another of the indicators I’ve often mentionedas a driver of the market is the Industrials CRB(ICRB). If you look at that index, which is a proxyfor how things are going on a global basis —because it tracks industrial commodities used inproduction, not traded — it has been in a bearmarket for years. Yet lo and behold, near the bot-tom of the market in February ’16 — it didn’t evenconfirm that retest of the S&P’s December 15 lows.The CRB Industrials were actually turning up thatFebruary. I believe that’s part of the reason earn-ings have stabilized.
Still, don’t valuations give you pause?Well, let’s look at valuations from the last peak, in2007 (although market didn’t decline because ofvaluations alone, other factors became more rele-vant). The P/E ratio in ’07 was 16.75 and presentlywe have a P/E of 18.35, based on our expected yearend P/E ratio.
Like I said —But if you look at the earnings yield — if we divide1 by 16.75 — that was a 2007 earnings yield of6%. But the bond market was at 4.50% to 5.30%,so the spread was 100-50 basis points. Presently,you have a P/E of 18.35, which gives you an earn-ings yield of 5.44% and bonds are at 2.50%. That’sa risk premium spread of 300 basis points now,versus 100 basis points in 2007.
So the earnings yield on stocks is nowoffering a much higher premium to what’savailable on bonds. Exactly. It’s a bigger premium spread. And again,there’s no real divergences in my indicators here.
Okay, mission accomplished on your calllast year. But what’s your new big themenow — or is there one?There is — and this is important. There are twotypes of tightening cycles. I guess what peoplewould say is that soft landings are hard for the Fedto mediate. Because if you look at all the times,historically, that the Fed has instituted tighteningcycles, inevitably, risk has tended to increase asthose years progressed. Eventually, the market hada problem — in all cases, more or less. If you lookat Goldman Sachs’s work, they put out a releasesaying, “recession probability rises from low lev-
els.” Their measure is up to a 30%-32% recession-ary risk over the next 9 quarters. Their probabilityhas moved up coincidentally with each hike ininterest rates the Fed has made.
What’s that old saying about “three stepsand a stumble?” It was like clockwork. Right. As soon as the Fed stopped QE, boy, thatwas what everybody said was going to happen.Now, they’re saying the same kinds of things aboutEurope stopping QE. But the reality is, if you lookthrough history there are different types of tighten-ing cycles — ones with different phases and I liketo look at the different types.
How are they different?The variations have to do with the speed of thehikes and the sizes of the hikes. There are fastcycles and slow cycles, and different variationseven within those. You can really break it downinto three, four five different sets of periods. Andonce you start reviewing all of those, what you findis that it is critical to look at where market rateswere during those cycles. This most recent tighten-ing cycle, as just about everyone expected, is turn-ing out to be a slow tightening cycle. But they’renot all alike.
So what does it mean that you’re callingthis one “slow?” Tightening cycles that I’d classify as slow have ini-tially been generally favorable periods for equityprices — for at least a year, year and a half. We’vehad four of them (before this one) since 1955. Forinstance, in the tightening cycle that began in April1955, market rates rose by roughly 40 basis pointsover the first year — and the market did fine. Butin the second year, rates moved up 150 basispoints — and markets succumbed to that. If welook at the period starting in September ’58, it tookrates about a year and a half to really move higherand start impacting stocks. In other words, not untilabout a year and a half into a tightening period, inthese cases was there an amber light flashing forequity investors.
What about in the other half of your “slow”historical examples?Likewise, in the cycle starting in ’77, rates went upconsiderably in the second to third years, and that’swhen stocks suffered. The exception was the periodbeginning in ’63, when rates did not shoot up. And sofar in this cycle, they have not. Again, in all the othertightening periods, when market rates eventually shotup, the stock market responded by weakening.Actually, this occurred in both fast cycles and slowones. In slow ones, it just took longer, but eventually,
WELLINGONWALLST. July 21, 2017 PAGE 12
Subscriptions toWellingonWallSt.
Welcome!Payable in researchvotes or hard dollars.
contact:Don Boyle

market rates exploded and the stocks imploded.
So elaborate a little about what you’reimplying about 1963 and this cycle?In ’63, it took until the third year (post-the-first-hike)for the stock market to become vulnerable —because interest rates had just flat-lined until then.If you look at the Fed’s current tightening efforts,now, after four hikes in interest rates, rates have pret-ty much flat-lined, and stocks are up. After the firsthike, the S&P had gained 9%; 19 months later, we’reup 19%.
In reviewing all four of the four prior “slow” tighten-ing periods, the stock market did eventually start tostruggle on average and eventually declined — butnot until market interest rates began to increase in adisorderly fashion.
So market risk rose during these slow tightening peri-ods, but not beginning until at least a year after theFed’s first move. And that was also very much depen-dent on how market rates behaved. This time around,market rates, such as on 3- and 10-year notes, stoodat 1.35% and 2.27%, respectively, when the Fed ini-tially raised the fed funds rate. At the end of June,the 3-year note stood at 1.55% and the 10-year rateat 2.30%. They’ve barely budged!
So we can expect stocks to keep on rallying,like in ’63-’64?Well, that was the only similar period. In that slowtightening cycle in 1963-’64, interest rates had risenby all of roughly 10 basis points one year after theinitial hike. By the end of the second anniversary,they’d risen by only another 5-10 basis points. Well,two years after that initial hike in 1963 — helped bythose “tame” market rates — stock prices hadadvanced by 32%. Indeed, the stock market escapedthat tightening cycle without succumbing. Right now,in this cycle, market rates are virtually unchanged —which hasn’t happened since ’63,- ’64. So we mightbe following a similar path.
I know that “Goldie” tone to your voice —you’re not ready to jump out on that limb.You also know I never rely on just one indicator, orreading. I’m always weighing all the evidence I canfind. I will tell you, though, that I’m also seeing somesimilarities between the periods in terms of momen-tum. In early ’64, the S&P’s total return went up forsix consecutive months, rising by 10.5%. Then itgained an addditional 5% in the second half, for atotal return of 16.3%. I’m wondering if somethinglike that may not be accomplished here, given how2017 has started.
Yet another possible parallel I’ve noticed is that themaximum intra-period draw down in 1964 was one ofthe best numbers on record, only 3.5%. Only 1995,at 2.5%, and this year’s 2.8% maximum drawdown— so far — have ever been better. As I’ve said, it’sthe way indicators combine and reinforce each other— or not — that tends to modulate my outlook andconfidence.
Interesting. So are today’s placid volatilityreadings adding another thread to yourtapestry?Well, one of the outliers here in the first half was thevery low volatility in stocks. And again, if you lookthrough the historical record, you’ll find that very lowvol was also a feature of the 1964 market. So weseem to be repeating that, as well. Part of what prob-ably has been supporting this buoyancy are expecta-tions that we will see changes in tax rates for corpora-tions. I think that’s been a significant influence onthe market’s ability to maintain this orderly advanceand not succumb, despite the evident disarray inCongress. It should be noted that the S&P’s forwardP/E prior to the election was 16.5 and it presentlystands at 17.5, as the S&P has advanced by roughly16%. So the forward P/E has risen only by 6%. Thattells me that the majority of the advance has earn-ings-driven and only about 6% of it has ridden on theback of optimism about seeing the GOP fulfill man-dates such as lower corporate taxes.
So you’re actually pretty sanguine —Listen, right now, interest rates are tame, there are noexcesses, inflation is rolling over — yet everybody isconcerned about wage inflation. Usually, this longafter the Fed has started hiking, interest rate marketsare disorderly and the Fed has to get aggressive torein in excesses in the economy and markets. Buthere, speculation is rather quiet, excesses aren’t per-vasive — and it’s still a pretty calm environment forinvestors. So that’s the big theme here, to me.
Goldilocks? That’s your theme, Goldie?I grant you, that is a vague term often used todescribe an economy “not too hot and too cold.”What’s different here is that we have Goldilockswhile the Fed is raising rates. Goldilocks usuallydoesn’t enter the picture when the Fed is raisingrates. But again, up to a couple, three weeks ago, wewere seeing aggressive stocks, defensive stocks,techs, even the average stock — all boats were beinglifted in this Goldilocks environment.
The market climbed over 100 days without as muchas a 1% correction; we went 70 weeks without a 2%weekly pullback. When I run through my indicatorshere, what tends to show up these days is usually
WELLINGONWALLST. July 21, 2017 PAGE 13
Subscriptions toWellingonWallSt.
Welcome!Payable in researchvotes or hard dollars.
contact:Don Boyle

skewed toward a decent environment going forward.So, though the market is typically vulnerable toexcesses at this later stage of the cycle, there reallyaren’t any excesses — so there still seems to be awindow of opportunity for equity investors.
I don’t want to sound like a broken record,but valuations at these elevated levels his-torically haven’t been portents of goodthings to come. Well, the average stock is a bit questionable here.But I think the expectation is for earnings to improve.It may take dynamic scoring, but if the effective taxrate on corporate earnings of 28% is cut by 4 or 5percentage points, that will help the S&P 500. If thetax rate on average stocks — which is closer to 35%— is slashed to, say, 20%, it would certainly helpmelt valuation concerns.
The other thing — if you look historically at the cor-relation of forward P/Es to one-year returns, it is like0.10. Now, if you look at forward P/Es to five-yearreturns, the correlation is 0.42. But I’m never tryingto look that far out. And who knows what tax changeswe may get next year, or even this year?
I wouldn’t place any bets on Congress or theWhite House. But it’s clear that little thingslike the age of this economic expansion andhigh valuations don’t daunt you. True. People talk about the VIX being low and worryabout low interest rates, but I don’t hear a lot of com-plaints about GDP volatility also being low. There’s areal calm in the economy — and the markets lovecalm. There are no rates flaring up, GDP volatilityisn’t spiking. And it’s this calm environment that maypossibly allow us to break another record soon —106 months without a recession. That was set in thenon-recessionary 1961-’69 market cycle. This expan-sion is already 85 months or so old, and it looks like-ly we may break that record in 20-21 months.Sometimes we don’t look at the positives enough.
Guilty. But I feel duty-bound to remind youthat a nasty, decade-long bear market fol-lowed the Go-Go Years of the ’60s. Yes — and I know this question always gets you introuble. But shouldn’t we maybe be looking at thismarket as different from others?
This time is different?Isn’t every period? In most every other period, we’vealways concerned ourselves with whether rates couldgo to 4, 5, 6, 7%. But maybe we’re a no-worryingenvironment where rates may eventually only go to3.5%? Well, if rates are only going to go to 3.5%,
where does one invest? Aren’t stocks maybe lookinga little bit more attractive? Maybe valuations are on asomewhat different plateau than in previous periodswhen rates had the potential to go to 7%.
Is that what you are suggesting?I’m not. But I think those questions need to be asked— pondered. And speaking of different. You onceasked me, I think in exasperation, what makes medifferent. Well, one thing I do differently than mostanalysts is the way — physically — I look at data.
What do you mean?Well, when we look at a table of data (at least in theWest), we read it left to right. A quant, like me, doesit the same way, looking at the data chronologically.When chartists, however, look at a chart formation,say, a head and shoulders top, they read it from rightto left. But when you’re looking right to left, you tendto have selective perception — focus on the most-recent occurrence — and don’t tend to notice, forinstance, a previous head and shoulders that didn’twork. You only notice when a head & shoulders doeswork. As a quant, I can software code for everyinstance of a signal and see how often it works,instead of being blinded by selection bias.
What are you getting at?Well, the cumulative A/D line is a generic tool fortechnicians, right? It is said that every bear market ispreceded by the A/D line topping out. So if I were tosay to you that the A/D line is topping out now, whatwould you say?
Market activity is narrowing? Well, most would say, a bear market is coming. Because they’re are being highly selective, focusingon the current “topping pattern.” But if you reviewthat data in chronological order, you may see thatthe A/D line has reached that level numerous times— and only 50% of the time has that been followedby a bear market. My argument is that you have tofilter raw data from the beginning to develop a bigpicture view.
The trick is making sense of it all —I will say this: I really study all that I can about theeconomy and the markets — then quantify all thedata that I find into a logical perspective. A logicalperspective that can be called on to illuminateevents as they are unfolding. In the summer of2011, I found I couldn’t sleep at night. Within afortnight, short-term rates in Italy had shot up sub-stantially, yet the markets were still eerily calm.But then I suddenly understood what that meant.So I lowered my exposure to the market by 80% —
WELLINGONWALLST. July 21, 2017 PAGE 14
Subscriptions toWellingonWallSt.
Welcome!Payable in researchvotes or hard dollars.
contact:Don Boyle

to 20% from 100% — while the S&P was still nearits highs. It was just about understanding that wor-risome logical sequence of events.
So Italy’s rate spike tipped your scales? Right. I had already been thinking that marketupside was going to be challenging from there, givenmy indicators. Then we had that exogenous event.Again, it’s about doing all the research and knowingand trusting your indicators. There’s all sorts of noisein the markets all the time. But the collective wisdomof my indicators helps me separate out the noise andalerts me ahead of game-changing events.
You’re pretty fully invested now, I take it?Since I increased my exposure after the weekendbefore last fall’s election, my allocation has held pret-ty steady at around 105% gross long. So you’re not leveraged to the gills, but youare more than fully invested.Well, I’m expecting 5%, as I said, in the second half.But there’s always a chance the wheels fall off thebus, given the political turmoil. And, in general, Ithink there’s a certain fragileness — ever since since’09 — to the global economies. Something that wasn’tthere, prior to the financial crisis. Before that, onecould feel much more confident in your indicators,soley based on domestic influences. Now, macroevents have to be factored into the equation.
You’ve added a lot of international inputs?Not exactly. I do have a mousetrap that I put togeth-er, regarding the global participation in key marketindexes, as a subset of market internals now. And fora while a few years ago, I was waking up at 3:15 amto check on how Germany was doing. There werestudies then that said a lot of the market gains thatshowed up in the futures later in the day originatedin Germany in the wee hours. But mine is still adomestic strategy, based mostly on domestic indica-tors. Still, because of this fragileness in many globaleconomies — which interact with our own somewhatfragile economy, I can’t have the same confidence Ionce had that all my factors will be as predictive. I’mhaving to take into consideration all sorts of nuancesin the strategy that are exerted by exogenous events,whether in Greece or Italy, Spain or China, Japan orKorea. It’s another level of concerns.
So that’s why you’re not leveraging way up?Well, in answer to your earlier question, I don’t thinkmany investors are very anxious to see levered portfo-lios here. In fact, it makes them anxious.
Who isn’t?I could probably write a mini-thesis on all the rea-
sons I have for my allocations where they are. But in terms of this market, as I said, there just aren’t a lot of things causing me to worry —
You haven’t mentioned debt levels. Although rates are low, “too much debt” is a frequent rallying cry in the Street and in Congress.Debt is high as a percentage of GDP. But there’s usu-ally a catalyst. In 2007, there was a financial cata-lyst. In 2002, there was an aneurism on the bubble in the valuations on technology stocks while the whole market was being held up by just a handful of large-cap tech stocks. In ’98, there were tremendous struc-tural problems in the market. And markets just tend to exhaust themselves, as well. Again, none of that is evident today.
In fact, much of the market looks just so — mundane— today, that it’s a bit hard to get very animated about it. But that’s part of what is giving it legs.
What’s the AUM trading this strategy?About $80 million currently trading this strategy. Not as much as I’d like, clearly, and I am working to attract more investors now that my old CTA fund has been con-verted into the mutual fund. I will note that, histori-cally, because I was a CTA, and my information was in a CTA database, it tended to be seen by CTA-ori-ented investors — many of whom weren’t terribly happy. The CTA Index that SocGen puts together, using the performance of top CTA funds, has been flat since 2009.
So it was my bad luck to be competing in a universe being tarred by bad performance. GDP is not moving much, identifiable major trends aren’t developing, and the investors tending to look in the CTA data base aren’t in the mood to add funds.
Then too, I wasn’t classified as part of the hedge fund community because I’m not dealing in stocks and I’m not dealing in SPDRs; I’m trading futures. That limit-ed my ability to market to hedge funds — I couldn’t get listed in their databases.
The obvious critical question is whether your strategy would work as well if you did add considerably more assets.Right. So I want to stress this. Sometimes, depending on the instruments they’re employing and which mar-kets they’re active in, portfolio managers can experi-ence real difficulties trying to scale up. In the small-cap arena, for instance, a fund with only $3 million or $4 million to invest may have very different perfor-mance characteristics than a fund with $250 million,
WELLINGONWALLST. July 21, 2017 PAGE 15
Subscriptions toWellingonWallSt.
Welcome!Payable in researchvotes or hard dollars.
contact:Don Boyle

Welling on Wall St. LLC believes that its reputationfor journalistic enterprise, intellectual indepen-dence and absolute integrity are essential to itsmission. Our readers must be able to assume thatwe have no hidden agendas; that our facts arethoroughly researched and fairly presented andthat when published our analyses and opinionsreflect our best judgments - and not the vestedpocketbook interests of our sources, our col-leagues, our clients or ourselves. WOWS’s mission is to provide our readers withthoroughly independent research, trenchantanalysis and opinions that are as considered asthey are provocative. We work tirelessly to fulfillthat mission. That said, you must also considerthat no one, and no organization is perfect, andbe assured that our lawyers advise that we tellyou so. So here it is, in plain language, not theusual lawyer-ese.All the material in this publication is based ondata from sources that we have every reason tobelieve are accurate and reliable. But we can’t(nor can anyone else) guarantee it to be utterlyaccurate. And there’s always a chance, though westrive to avoid it, that we’ve missed something. Sowe make no claim that it is complete; the end-alland be-all. Opinions and projections found in thisreport reflect either our opinion or that of ourinterviewees or guest authors (all of whom areclearly identified) as of the original interview/pub-lication date and are subject to change withoutnotice. When an unaffiliated interviewee’s opin-ions and projections are reported, WOWS is relyingon the accuracy and completeness of that individ-ual/firm’s own research and research disclosuresand assumes no liability for that research orthose disclosures, beyond summarizing their dis-closures in an adjacent box. This report is the product of journalistic enter-prise and research. It is NOT a sales tool. It is notintended to be - and should NOT be mistaken for -an offer to sell anything. It is NOT a solicitationfor any sort of Investment or speculation. Itshould NOT form the basis for any decision toenter into any contract or to purchase any securi-ty or financial product. It is entirely beyond thescope and, bluntly, competence of this publicationto determine if any particular security is suitablefor any specific subscriber. In other words, wedon’t give investment advice. Don’t mistake any-thing you read in WOWS for investment advice.This publication does not provide sufficient infor-mation upon which to base an investment deci-sion. WOWS does advise all readers to consulttheir brokers or other financial advisors or profes-sionals as appropriate to verify pricing and allother information. WOWS, its affiliates, officers,owners and associates do not assume any liabilityfor losses that may result if anyone, despite ourwarnings, relies on any information, analysis, oropinions in the publication. And, of course, pastperformance of securities or any financial instru-ments is not indicative of future performance.
Confidentiality and Trading Disclosure: All infor-mation gathered by WOWS staff or affiliates inconnection with her/his job is strictly the propertyof WOWS It is never to be disclosed prior to publi-cation to anyone outside of WOWS and is never tobe used, prior to publication-and for two weekthereafter-as the basis for any personal invest-ment decision by staff, affiliates and/or membersof their immediate households. All staff and affili-ates of WOWS will avoid not only speculation butthe appearance of speculation and may notengage in short-term trading, the short selling ofsecurities, or the purchase or sale of options,futures, or other derivatives, including ETFsreliant on derivatives. Any equity or fixed-incomeinvestments entered into by WOWS staff or affili-ates will be held for a minimum of six monthsunless dispensation is received, under extraordi-nary circumstances, from WOWS’s legal counsel.Any pre-existing direct investment interest in anystock, mutual fund, ETF or partnership portfoliocovered in an issue of WOWS will be specificallydisclosed in that edition and that position will befrozen for at least a month. Internet disclosure:Electronic Communications Disclosure: The web-sites and WOWS’ electronic communications can,alas, fall prey of all manner of malicious activity.While WOWS takes reasonable and prudent stepsto try to prevent its website, journals and commu-nications from interception, corruption, infection,contamination and other electronic malefactors,there are even fewer guarantees in the realms ofsoftware and the web than in finance—where thereare none. WOWS disclaims and cannot accept lia-bility for any damages to computer systems as aresult of downloading or opening contaminatedversions its website, journals or communications.
WELLINGONWALLST. July 21, 2017 PAGE 16
much less $500 million. Liquidity is an issue.
No kidding.But whether you’re managing a $3 million program in S&P futures or a $100 million program, there’s no difference. There’s no slippage. In fact, the bid/offer is $100 million. So I could most likely run $1 billion in my strategy and see no slippage.
Couldn’t you apply your strategy to stock index ETFs or SPDRs?The problem is, then I couldn’t use my track record. And the regulatory issues would be off the charts.[The right solution was teaming up with USA Mutuals and converting Goldman Navigator Fund LP into the institutional class shares of UNAVX, USA Mutuals’ Navigator Fund, simultaneously with the commence-ment of the fund’s investment operations on Oct. 13, 2017.] That said, I have 100% of my liquid net worth in UNAVX, $15 million. This is really my net worth vessel. And I’m really proud of my pure market calls record, as reflected in market timing chart. [Page 4]
I've got to admit, I've never though it possible to consistently time the market correctly. You’re a rare bird. Thanks, Steve.Research Disclosure
SubscribeTo WellingonWallSt.Many of our clients of every imaginable size
and asset class tell us they subscribe to WellingonWallSt.
because it makes them think.If your curiosity is piqued, drop a line directly to
Don Boyle at [email protected](631)315-5077

WellingonWallSt. REPRINT disclosure: This authorized reprint of the interview with Steve Goldman, originally published inWOWS’ July 21, 2017 issue, has been updated to reflect the change in the organizational structure of Steve’s business, as ofOct. 13, 2017. On that date, the assets of Steve’s Goldman Navigator Fund, an investment limited partnership he managedthrough his CTA, Goldman Management, were converted into the institutional class shares of USA Mutuals’ Navigator Fund(UNAVX). The conversion occurred simultaneously with the commencement of UNAVX’s investment operations. The perfor-mance charts, tables and statistics in this piece have been updated to reflect that conversion, and UNAVX’s subsequent per-formance. Steve is now the senior portfolio manager of UNAVX, and continues as Goldman Management’s sole Principal andowner.
WellingonWallSt. interviewee disclosure. Steven Goldman has been the Principal, the founder, the sole director and shareholder of Goldman Management, Inc., acommodities trading advisory firm based in Springfield, N.J., since October 1985. He has been registered as an Associated Person of GMI since January 1986. He isresponsible for all aspects of the firm's operations including market research, trading operations and management. Steve, who also answers to “Goldie,” receiveda Bachelor’s of Science degree from the University of Maryland in 1979, with an emphasis in economics and finance. He received a Master’s in BusinessAdministration in 1984 from the Zicklin School of Business, Baruch College with an emphasis in economics. From April 1986 to September 2011, Steve served as theChief Market Strategist and a partner at Weeden & Co, LP. The Greenwich, Ct.-based firm was founded in 1922 and is a medium-size institutional equity brokeragecompany, which provides execution services for institutional clients. As such, Kate Welling was a colleague of Steve’s while she also was a partner in Weeden from1999 to 2014. Mr. Goldman still presently owns a minority stake in the firm. Kate has fully divested. GMI offers clients a managed account program based on its proprietary trading strategy that is a product of over 30 years of rigorous research developing toolsto forecast the short term, intermediate and long term direction in stock indexes. The strategy seeks capital appreciation of client assets through speculative trad-ing in stock index futures. There is no representation being made that these programs will be successful in achieving this goal. Hundred of indicators and modelsare employed, using a quantitative analysis, many of these indicators date back to the early 1900's. These indicators comprise the principals of both technical andfundamental analysis. The risk of loss in trading commodities can be substantial. You should therefore carefully consider whether such trading is suitable for youin light of your financial condition. Past performance is not necessarily indicative of future results. The principle objective of GM is to profit from all types of mar-kets while using strict control measures to minimize risk. Analysis and research into improving systems and strategies is an ongoing process. It may be determinedminor modifications to one or more trading models would improve performance. New systems and or models may be added, removed or modified for future use.Managed account clients will not be informed with respect to such minor changes in GM trading methods. The program enters both long and short positions andthe level of investment varies.GMI’s program is only open to investors fitting the definition of a “qualified eligible person” as that term is defined under Commodity Futures Trading Commission(“CFTC”) Regulation 4.7(a). An investment in the GMI’s program, like all investments, contains risk including the risk of total loss. Trading in commodity futuresinvolves significant risk of loss, and is thus not appropriate for all investors. This presentation is not an offer to buy or sell, nor a solicitation of an offer to buy orsell financial instrument. An investment with GMI may be made only by clients after receipt of GMI’s Disclosure Document and execution of the appropriate agree-ments by such clients, and only in those jurisdictions where permitted by law. GMI is an exempt Commodity Trading Advisor under CFTC Regulation 4.7, and there-fore is not required to adhere to certain disclosure, reporting and recordkeeping requirements under the Commodity Exchange Act (“CEA”).This interview was initiated by Welling on Wall St. and contains the current opinions of the interviewee. Such opinions are subject to change without notice. Thisinterview and all information and opinions discussed herein is being distributed for informational purposes only and should not be considered as investment adviceor as a recommendation of any particular security, strategy or investment product. Information contained herein has been obtained from sources believed to bereliable, but is not guaranteed. In addition, forecasts, estimates and certain information contained herein are based upon proprietary research and should not beinterpreted as investment advice, as gospel or as infallible. Nor should they, in any way shape or form, be considered an offer or solicitation for the purchase orsale of any financial instrument. The price and value of investments may rise or fall. There are no guarantees in investment or in research, as in life. No part of this copyrighted interview may be reproduced in any form, without express written permission of Welling on Wall St. and Kathryn M. Welling.© 2017 Welling on Wall St. LLC
Commodities Trading Disclosure: THE RISK OF LOSS IN TRADING COMMODITIES CAN BE SUBSTANTIAL. YOU SHOULD THEREFORE CAREFULLY CONSIDER WHETHERSUCH TRADING IS SUITABLE FOR YOU IN LIGHT OF YOUR FINANCIAL CONDITION. IN CONSIDERING WHETHER TO TRADE OR TO AUTHORIZE SOMEONE ELSE TO TRADEFOR YOU, YOU SHOULD BE AWARE OF THE FOLLOWING:IF YOU PURCHASE A COMMODITY OPTION, YOU MAY SUSTAIN A TOTAL LOSS OF THE PREMIUM AND OF ALL TRANSACTION COSTS.IF YOU PURCHASE OR SELL A COMMODITY FUTURE OR SELL A COMMODITY OPTION, YOU MAY SUSTAIN A TOTAL LOSS OF THE INITIAL MARGIN FUNDS AND ANY ADDI-TIONAL FUNDS THAT YOU DEPOSIT WITH YOUR BROKER TO ESTABLISH OR MAINTAIN YOUR POSITION. IF THE MARKET MOVES AGAINST YOUR POSITION, YOU MAY BECALLED UPON BY YOUR BROKER TO DEPOSIT A SUBSTANTIAL AMOUNT OF ADDITIONAL MARGIN FUNDS, ON SHORT NOTICE, IN ORDER TO MAINTAIN YOUR POSITION. IFYOU DO NOT PROVIDE THE REQUESTED FUNDS WITHIN THE PRESCRIBRD TIME, YOUR POSITION MAY BE LIQUIDATED AT A LOSS AND YOU WILL BE LIABLE FOR ANYRESULTING DEFICIT IN YOUR ACCOUNT.UNDER CERTAIN MARKET CONDITIONS, YOU MAY FIND IT DIFFICULT OR IMPOSSIBLE TO LIQUIDATE A POSITION. THIS CAN OCCUR, FOR EXAMPLE, WHEN THE MARKETMAKES A"LIMIT MOVE."THE PLACEMENTOF CONTINGENT ORDERS BY YOU OR YOUR TRADING ADVISOR, SUCH AS A"STOP-LOSS" OR"STOP-LIMIT" ORDER WILL NOT NECESSARILY LIMIT YOURLOSSES TO THE INTENDED AMOUNTS, SINCE MARKET CONDITIONS MAY MAKE IT IMPOSSIBLE TO EXECUTE SUCH ORDERS.A"SPREAD" POSITION MAY NOT BE LESS RISKY THAN A SIMPLE"LONG" OR"SHORT" POSITION.THE HIGH DEGREE OF LEVERAGE THAT IS OFTEN OBTAINABLE IN COMMODITY TRADING CAN WORK AGAINST YOU AS WELL AS FOR YOU. THE USE OF LEVERAGE CANLEAD TO LARGE LOSSES AS WELL AS GAINS.IN SOME CASES, MANAGED COMMODITY ACCOUNTS ARE SUBJECTED TO SUBSTANTIAL CHARGES FOR MANAGEMENT AND ADVISORY FEES. IT MAY BE NECESSARY FORTHOSE ACCOUNTS THAT ARE SUBJECT TO THESE CHARGES TO MAKE SUBSTANTIAL TRADING PROFITS TO AVOID DEPLETION OR EXHAUSTION OF THEIR ASSETS. THISDOCUMENT CONTAINS A COMPLETE DESCRIPTION OF EACH FEE TO BE CHARGED TO YOUR ACCOUNT BY THE COMMODITY TRADING ADVISOR.THIS BRIEF STATEMENT CANNOT DISCLOSE ALL THE RISKS AND OTHER SIGNIFICANT ASPECTS OF THE COMMODITY MARKETS. YOU SHOULD THEREFORE CAREFULLYSTUDY OFFERING DOCUMENTS AND COMMODITY TRADING BEFORE YOU TRADE.YOU SHOULD BE AWARE THAT THIS COMMODITY TRADING ADVISOR MAY ENGAGE IN TRADING FOREIGN FUTURES OR OPTIONS CONTRACTS. TRANSACTIONS ON MARKETSLOCATED OUTSIDE THE UNITED STATES, INCLUDING MARKETS FORMALLY LINKED TO A UNITED STATES MARKET MAY BE SUBJECT TO REGULATIONS WHICH OFFER DIF-FERENT OR DIMINISHED PROTECTION. FURTHER, UNITED STATES REGULATORY AUTHORITIES MAY BE UNABLE TO COMPEL THE ENFORCEMENT OF THE RULES OF REG-ULATORY AUTHORITIES OR MARKETS IN NON-UNITED STATES JURISDICTIONS WHERE YOUR TRANSACTIONS MAY BE EFFECTED. BEFORE YOU TRADE YOU SHOULDINQUIRE ABOUT ANY RULES RELEVANT TO YOUR PARTICULAR CONTEMPLATED TRANSACTIONS AND ASK THE FIRM WITH WHICH YOU INTEND TO TRADE FOR DETAILSABOUT THE TYPES OF REDRESS AVAILABLE IN BOTH YOUR LOCAL AND OTHER RELEVANT JURISDICTIONS.THIS COMMODITY TRADING ADVISOR IS PROHIBITED BY LAW FROM ACCEPTING FUNDS IN THE ADVISOR’S NAME FROM A CLIENT FOR TRADING COMMODITY INTERESTS.YOU MUST PLACE ALL FUNDS FOR TRADING IN THIS TRADING PROGRAM DIRECTLY WITH THE FUTURES COMMISSION MERCHANT.4.7 EXEMPT CTA ADDITIONAL RISK DISCLOSURE STATEMENT: PURSUANT TO AN EXEMPTION FROM THE COMMODITY FUTURES TRADING COMMISSION IN CONNECTIONWITH ACCOUNTS OF QUALIFIED ELIGIBLE PERSONS, THIS BROCHURE OR ACCOUNT DOCUMENT IS NOT REQUIRED TO BE, AND HAS NOT BEEN, FILED WITH THE COMMIS-SION. THE COMMODITY FUTURES TRADING COMMISSION DOES NOT PASS UPON THE MERITS OF PARTICIPATING IN A TRADING PROGRAM OR UPON THE ADEQUACY ORACCURACY OF COMMODITY TRADING ADVISOR DISCLOSURE. CONSEQUENTLY, THE COMMODITY FUTURES TRADING COMMISSION HAS NOT REVIEWED OR APPROVED THISTRADING PROGRAM OR THIS INTERVIEW.
WELLINGONWALLST. July 21, 2017 PAGE 17

DefinitionsVIX - Volatility Index - shows the market's expectation of 30-day volatilityP/E Ratio - is the ratio for valuing a company that measures its current shareprice relative to its per-share earningsAlpha - excess returns of a fund relative to the return of a benchmark indexBasis Points - one hundredth of one percentCorrelation - a quantity measuring the extent of interdependence of variablequantitiesS&P 500 - American stock market index based on the market capitalizations of500 large companies having common stock listed on the NYSE or NASDAQCTA Index - a leading industry benchmark of representative performance ofcommodity trading advisorsBarclays Hedge Fund Index - a measure of the average return of all hedgefundsBarclays L/S Index – a measure of the average return of all long/short fundsSharpe Ratio: a measure that indicates the average return minus the risk-freereturn divided by the standard deviation of return on an investment.Sortino ratio: is a variation of the Sharpe ratio that only factors in downside,or negative volatility, rather than the total volatility used in calculating theSharpe ratio.
One cannot invest directly in an index.
Disclosures Holdings and allocations are subject to change at any time.
Opinions expressed are subject to change at any time, are not guaranteed andshould not be considered investment advice.
Performance - As of March 31, 2018Performance greater than 1 year is average annualized.
Ticker 1 Year 5 Years 10 Years Since Inception UNAVX 10.88% 9.17% 9.71% 12.00%
Gross Expense Ratio Inst. Class is 2.75%Net Expense Ratio Inst. Class is 1.99%Contractual fee waivers through 7/31/19.
Performance data quoted represents past performance; past perfor-mance does not guarantee future results. The investment return andprincipal value of an investment will fluctuate so that an investor’sshares, when redeemed, may be worth more or less than their originalcost. Current performance of the fund may be lower or higher than theperformance quoted. Performance data current to the most recentmonth end may be obtained by calling 1-866-264-8783.
*Simultaneous with the commencement of the Fund’s invest-ment operations on October 13, 2017, the Goldman NavigatorFund, L.P., a limited partnership managed by Mr. StevenGoldman, the Fund’s portfolio manager (the “PredecessorPartnership”), converted into the Institutional Class sharesof the Fund by contributing all of its assets to the Fund inexchange for Institutional Class shares of the Fund. Performance data quoted prior to October 13, 2017 repre-sents the past performance of the Goldman Navigator Fund,L.P., a limited partnership managed by Mr. Steven Goldman,the Fund’s portfolio manager (the “PredecessorPartnership”). From its inception in 2002 through 2012, thePredecessor Partnership was managed as a proprietaryaccount of the portfolio manager, and was converted to alimited partnership in 2012. From its inception on February 1,
2002 through October 13, 2017, the Predecessor Partnershipmaintained investment policies, objectives, guidelines, andrestrictions that were, in all material respects, equivalent tothose of the Fund, and at the time of the conversion, thePredecessor Partnership was managed by the same portfoliomanager as the Fund. Such portfolio manager managed thePredecessor Partnership since its inception in a manner that,in all material respects, complied with the investment guide-lines and restrictions of the Fund. The Fund’s performancefor periods before October 13, 2017 is that of thePredecessor Partnership and includes the expenses of thePredecessor Partnership. The performance includes gains orlosses plus income and the reinvestment of all dividends andinterest. All returns reflect the deduction of all actual feesand expenses, paid by the Predecessor Partnership, withoutprovision for state or local taxes. If the PredecessorPartnership’s performance was adjusted to reflect the pro-jected first year expenses of the Fund, the performance forall periods would have been lower than that stated.
The Predecessor Partnership was not registeredunder the 1940 Act, and was not subject to certain invest-ment limitations, diversification requirements, and otherrestrictions imposed by the 1940 Act and the InternalRevenue Code of 1986, as amended (the “Code”), which, ifapplicable, may have adversely affected its performance. Ona going forward basis after October 13, 2017, the Fund’s per-formance will be calculated using the standard formula setforth in rules promulgated by the SEC, which differs in certainrespects from the methods used to compute total returns forthe Predecessor Partnership. Please refer to the FinancialStatements section of the Fund’s SAI to review additionalinformation regarding the Predecessor Partnership.
The Fund’s investment objectives, risks, charges andexpenses must be considered carefully before investing. Thestatutory and summary prospectuses contain this and otherinformation about the investment company, and they may beobtained by contacting 866.264.8783 or going towww.usamutuals.com. Read it carefully before investing.
Mutual fund investing involves risk; principal lossis possible. Leveraging may exaggerate the effect on netasset value of any increase or decrease in the market valueof a Fund’s portfolio. Investing in derivatives may subjectthe Fund to losses if the derivatives do not perform asexpected. Short sales involve selling a security that a Fundborrows and does not own. Short sales carry significantrisk, including the risk of loss if the value of a security soldshort increases prior to the scheduled delivery date, sincea Fund must pay more for the security than it has receivedfrom the purchaser in the short sale. Futures contracts aresubject to the same risks as the underlying investmentsthat they represent, but also may involve risks differentfrom, and possibly greater than, the risks associated withinvesting directly in the underlying investments. The Fundsmay invest in foreign securities which involve greatervolatility and political, economic and currency risks and dif-ferences in accounting methods. This risk increases withemerging markets. Small and mid-size companies involveadditional risks such as limited liquidity and greater volatil-ity. Investments in futures may result in a substantial lossin a short period. The loss may be more than the originalinvestment. The USA Mutuals Funds are distributed by Quasar Distributors, LLC.
WELLINGONWALLST. July 21, 2017 PAGE 18