l’italia del fdi è un’espressione geografica · slow growth (if any…), deflationary...
TRANSCRIPT

MILANO I ITALY
L’Italia del FDI è un’espressione geografica
Università Bocconi – 26.2.2018 Prof. Carlo Alberto Carnevale Maffè
Il campo del capitalismo finanziario non è verde. Però è marrone.
Twitter: @carloalberto
Dear Investor, welcome in Italy. You’re reallylucky to be in the wrong place…
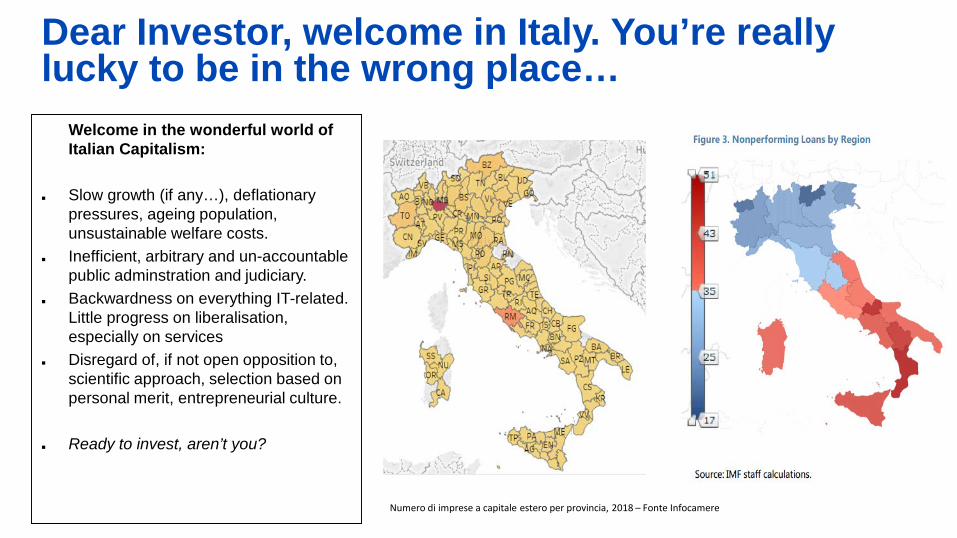
Welcome in the wonderful world of Italian Capitalism:
Slow growth (if any…), deflationarypressures, ageing population, unsustainable welfare costs.
Inefficient, arbitrary and un-accountablepublic adminstration and judiciary.
Backwardness on everything IT-related. Little progress on liberalisation, especially on services
Disregard of, if not open opposition to, scientific approach, selection based on personal merit, entrepreneurial culture.
Ready to invest, aren’t you?
Numero di imprese a capitale estero per provincia, 2018 – Fonte Infocamere
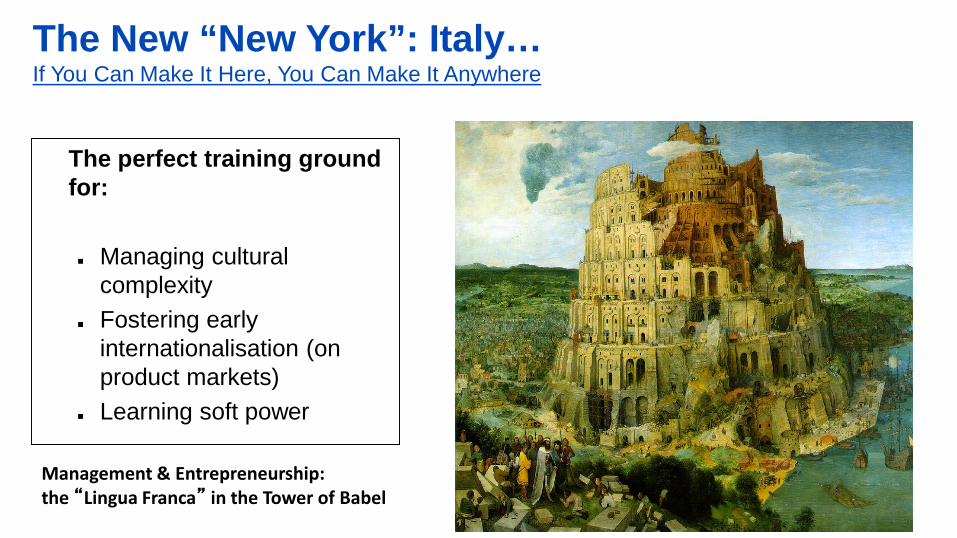
The New “New York”: Italy…If You Can Make It Here, You Can Make It Anywhere
The perfect training groundfor:
Managing cultural complexity
Fostering earlyinternationalisation (on product markets)
Learning soft power
Management & Entrepreneurship: the “Lingua Franca” in the Tower of Babel

Un Paese senza private equity in grado di rilanciare le imprese

Un Paese senza venture capital per finanziare l’innovazione


Source: IMF WP/18/33, 2018

Decomposition of labor productivity growth(unweighted, 1996–2006)
This chart shows the breakdown of log growth in GDP per hour worked at constant prices between 1996 and 2006 into its four components: TFP growth and the contributions of ICT capital, non-ICT capital and laborcomposition. For this chart we use industry-level data in the business sector. Growth across sectors isunweighted, in order to factor out the sectoralcomposition of the economy.
(Pellegrino & Zingales, 2017)

Sector-level productivity growtharound the ICT revolution.
This figure displays the evolution of TFP estimates, indexed at 1995, from the EU KLEMS database for differentcountry/sector groups. We sort high-Meritocracy versus low-Meritocracycountries (top tercile versus bottom tercile based on our country-levelmeasure of meritocracy) and high ICT intensiveness versus low ICT intensiveness sectors (top eight versus bottom eight sectors based on the sector-level, cross-country averagecontribution of ICT capital to output growth in 1995–2006). We take the median TFP growth rate for eachgroup/year, giving equal weight to allcountry/sectors.
(Pellegrino & Zingales, 2017)

«The interaction betweenmeritocratic management and ICT investment is the ground on which Italianproductivity came to die (since 1995)". "At least halfof Italy’s productivity gap can be accounted for by thisinteraction»
(Pellegrino & Zingales, 2017)
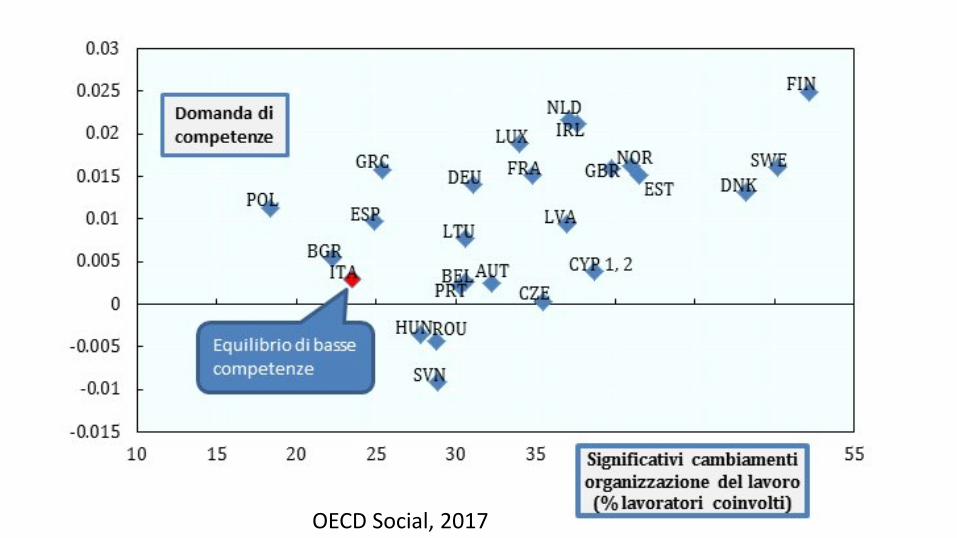
OECD Social, 2017

Non avendo mai attecchito in Italia né il modello di public company né quello di azienda a radicamento locale come nella tradizione germanica, le opzioni si riducono alla proprietà famigliare o al protettorato politico-finanziario.
Se non si vuole languire nell’assenza di crescita o nella mediocrità, l’alternativa più praticabile rimane la vendita o la fusione con un gruppo estero.
Le ragioni sono essenzialmente tre:
1. il fabbisogno di capitali2. l’evoluzione del modello organizzativo3. la necessità del supporto istituzionale all’estero.
Tali fattori impattano più sulle imprese che producono beni di consumo che su quelle che si focalizzano su beni strumentali o comunque su mercati B2B.
«AAA Vendonsi gioielli industriali di famiglia, causa globalizzazione dei mercati. Astenersi improbabili cordate imprenditoriali nostrane»

With the entrance of a new foreigninvestor, companies experienced:
• entry into new markets and internationalization, increasedproduct diversification, new commercial partnerships and greaterattention on sustainability;
• changes in governance, such as the appointment of new directors, a new CEO and/or top managers, the exit of minority shareholders and new remuneration plans;
• increased bargaining power with suppliers and greater synergies;
• new customers, increasedbargaining power with existingcustomers and enhanced visibilityand reputation;
• improvements in terms of sales, margins, CAPEX, employment and personnel remuneration.
Shopping in Italy…


Straniere
Analisi sulle imprese presenti nelRegistro italiano con partecipazioni
Analisi sulle imprese presenti nel Registro italiano conpartecipazioni straniere
Questa analisi considera le imprese con capitale sociale a partecipazione straniera a Febbraio 2018 iscritte al Registro Imprese italiano.
L’analisi non include le imprese quotate perché quest’ultime non hanno l’obbligo di comunicare i social Registro Imprese (esempio: Pirelli, Ansaldo, Telecom Italia, etc.).

Numero imprese italiane con quota di possesso estera

Capitale sociale per stato estero

Capitale sociale estero, numero imprese e totale capitale sociale
(Totale imprese: 32.885) (Totale capitale estero: 60.455.960.893€ - Totale capitale sociale: 132.538.551.455€)

Numero imprese per provincia(Totale imprese: 32.885)

Capitale sociale per provincia(Totale capitale estero: 60.455.960.893€ - Totale capitale sociale: 132.538.551.455€)

Capitale sociale estero, numero imprese e totale capitale sociale
(Totale imprese: 32.885) (Totale capitale estero: 60.455.960.893€ - Totale capitale sociale: 132.538.551.455€)

Numero imprese per settore(Totale imprese: 32.885)

Capitale sociale per settore(Totale capitale estero: 60.455.960.893€ - Totale capitale sociale: 132.538.551.455€)

Capitale sociale estero, numero imprese e totale capitale sociale
(Totale imprese: 32.885) (Totale capitale estero: 60.455.960.893€ - Totale capitale sociale: 132.538.551.455€)

Numero imprese per natura giuridica
(Totale imprese: 32.885)

Capitale sociale per natura giuridica(Totale capitale estero: 60.455.960.893€ - Totale capitale sociale: 132.538.551.455€)

Capitale sociale estero, numero imprese e totale capitale sociale
(Totale imprese: 32.885) (Totale capitale estero: 60.455.960.893€ - Totale capitale sociale: 132.538.551.455€)

Capitale sociale estero (in miliardi di €)(Totale capitale estero: 60.455.960.893€ - Totale capitale sociale: 132.538.551.455€)
Top Ten Nations Sep. 2017 Feb. 2018 Var
Netherlands 12.1 12.6 + 0.5
Luxembourg 11.7 12.1 + 0.4
France 9.7 9.8 + 0.1
Great Britain 7.4 7.3 - 0.1
Germany 3.9 3.8 - 0.1
Spain 3.5 3.6 + 0.1
Switzerland 2.5 2.5 -----
U.S.A 1.6 1.6 -----
Belgium 1.3 1.1 - 0.2
Austria 0.8 0.8 -----