literacy boost assessment - resource centre · english reading passages were more difficult for...
TRANSCRIPT

1
© 2009 Save the Children
2009
Prepared by:
Yvonne Cao SUPER Fellow
Literacy Boost Assessment Philippines Country Office
MMPO/SCMPO

2
Table of Contents
List of Acronyms and Abbreviations ............................................................................................................................. 3
Acknowledgments ............................................................................................................................................................. 4
Introduction and Purpose ................................................................................................................................................ 5
Development of Literacy Boost Assessment Tool .................................................................................................... 6
Stage 1: First draft of the tool .................................................................................................................................... 6
Stage 2: Step 1 of the pilot .......................................................................................................................................... 7
Stage 3: Step 2 of the pilot ........................................................................................................................................ 11
Stage 4: Revision of the final tool ............................................................................................................................ 11
Methodology ..................................................................................................................................................................... 13
Sample Size ................................................................................................................................................................... 13
Student Sample Selection .......................................................................................................................................... 15
Data collection and tabulation ................................................................................................................................. 15
Assessment Findings ........................................................................................................................................................ 17
MMPO ............................................................................................................................................................................ 17
Grade 1 ..................................................................................................................................................................... 17
Grade 3 ..................................................................................................................................................................... 27
SCMPO .......................................................................................................................................................................... 37
Grade 1 ..................................................................................................................................................................... 38
Grade 3 ..................................................................................................................................................................... 48
Main Limitations ............................................................................................................................................................... 60
Discussion and Initial Recommendations ................................................................................................................... 61
Conclusion ......................................................................................................................................................................... 62

3
List of Acronyms and Abbreviations
CAP Concepts About Print
DepEd Department of Education
ES Elementary School
LB Literacy Boost
LBA Literacy Boost Assessment
LLC Letter Lower Case
LUC Letter Upper Case
MLE Multi-Lingual Education
MMPO Metro Manila Program Office
n.s. Non-significant
PhCO Philippines Country Office
SC Save the Children
SCMPO South Central Mindanao Program Office
SUPER Save the Children – University Partnership for Education Research
4
Acknowledgments
This project would not have been possible without the support of the following amazing individuals:
Many thanks to Julie for orienting me on PhCO and Literacy Boost; Lanie for coordinating efforts with the entire MMPO office and making sure all materials were available for the development of the tool; Pery for being my initial in-country education expert and for translating the entire student background questionnaire into Filipino; Ernie for allowing me to use her books for Concepts About Print; Bonna and Fanny for coordinating all the efforts in SCMPO, facilitating orientation and the data collection; Elmer for his technical assistance; Ronald for orienting the enumerators and making sure I was always safe; Ramil for allowing me to use his computer and for his tutorial of SPSS; Doc Cel for orienting me on M&E in PhCO; all the drivers for always being so available; all the wonderful enumerators without whom this data would never have been collected and in general, the entire MMPO and SCMPO offices for being so welcoming and making me feel part of the SC family.
Finally, I would like to thank Amy Jo Dowd and Ces Ochoa for their continuous support and guidance throughout the entire project.

5
Introduction and Purpose
The Save the Children Philippines Country Office (PhCo) has been supporting basic education for the past 20 years in the Philippines. In response to situational analysis findings in 2002 that pointed to rising numbers of pupils struggling with reading, PhCo started to support reading remediation and literacy development programs as part of its basic education interventions. This is also aligned with the national government/Department of Education’s policy to emphasize the importance of building reading skills among school children through their “Every Child A Reader” programs.
Increasingly, Save the Children Country Offices are assessing their progress in supporting student learning by utilizing a program-focused version of the Early Grades Reading Assessment, EGRA (RTI, 2008). The Literacy Boost Assessment described in this report is a similar test designed especially for PhCO impact areas. It is part of an SC intervention called Literacy Boost, a comprehensive package that includes [1] a literacy assessment, [2] teacher training sessions and [3] community action activities.
SUPER Research Fellow Yvonne Cao conducted this assessment in September-November 2009 with 1st and 3rd grade students in 39 SC partner public elementary schools located in [a] Taguig-Pateros, Metro Manila, [b] Municipalities of Lake Sebu and T’boli, South Cotabato (Mindanao); and [c] Municipalities of Lutayan and Bagumbayan, Sultan Kudarat (Mindanao).
This report will answer the following research questions:
1. How applicable is the global literacy assessment approach being tested by Save the Children in the urban poor, majority Muslim, and indigenous community contexts where PhCO works?
2. How can findings from the SC literacy assessment add value to the way partner schools are teaching and promoting reading? To the way PhCO is supporting literacy development in its partner schools? What improvements can be recommended based on an analysis of the findings?
3. In contexts where PhCO is pilot-testing an MLE approach to reading and language of instruction, how can the literacy assessment be adapted so that children’s home language can be used? Is there a difference in literacy assessment results when the official language of instruction is used and when children’s home language is used?

6
Development of Literacy Boost Assessment Tool
The literacy assessment is the first component of the Literacy Boost intervention developed by Save the Children. The assessment tool was thus designed based on the Literacy Boost toolkit and adapted to the context of the PhCO impact areas and considering the national curriculum of the Department of Education of the Philippines.
The tool was developed for 1st grade and 3rd grade, and some components of the tool were in both English and Filipino (Most Used Words, and Reading Passages).
The development of the LBA tool happened in 4 stages:
1. First draft of the tool. 2. Step 1 of the pilot: equating reading passages with 2nd and 4th grade students. 3. Step 2 of the pilot: entire tool piloted with 1st and 3rd grade students. 4. Final revisions of the tool.
Stage 1: First draft of the tool The LBA tool is comprised of 5 components:
Component 1:
The background information component of the tool includes questions related to (1) educational background, (2) SES level, and (3) home literacy environment. SES proxy questions asked students to indicate [a] type of house walls, [b] type of house floor, and [c] type of bed as well as [d] if they have electricity, and [e] what type of house appliances they possess. Home literacy environment questions asked [a] what type of books they have in the home, [b] whether they see family members reading at home, and [c] if family members read to them at home.
Component 2:
Concepts About Print assesses emergent literacy skills (e.g. can the student indicate where the cover of the book is, can the student open to a certain page number, etc).

7
Component 3:
The Letter Test is an alphabet knowledge test. Students have to read both lowercase and uppercase letters. For this component, the English and Filipino alphabets were combined for a total of 28 letters (26 English letters + 2 Filipino letters “Ñ” and “NG”).
Component 4:
For the Most Used Words component, words in 1st and 3rd grade public school reading textbooks were tabulated. The 10 most common words found in the Grade 1 textbook and the 20 most common words found in Grade 3 textbook were used.
Component 5:
Reading Passages were adapted from private school textbooks (we did not manage to find old public school textbooks in time). For Filipino, 1st and 3rd grade private school reading textbooks were used. On the other hand, for English, Primer Level and 2nd grade textbooks were used for 1st and 3rd grade respectively because of the gap in English levels between private and public schools.
Six English passages and six Filipino passages were developed for each grade. Grade 1 passages were about 50 words long, and Grade 3 passages 160 words long.
Component 6:
Four comprehension questions (3 factual questions and 1 inferential question) were created for each of the reading passages. Questions for the English reading passages were in English only, with no translation provided for the students.
Stage 2: Step 1 of the pilot The reading passages alone were first piloted with 10 2nd grade (for 1st grade passages) and 9 4th grade students (for 3rd grade passages) in order to equate them. Students were chosen from a pilot school (in Caloocan) in Metro Manila. Equating reading passages is necessary because this assessment is meant to be used at baseline at the beginning of the school year and at endline at the end of the school year. Having equated passages allows us to use different reading passages at the beginning and end of the school year – and thus to avoid having students memorize the reading passage – while making sure that they are of the same reading difficulty so that we can compare results between different passages more reliably [Reading Passages can be found in the files “LB ASSESSMENT TOOL – GRADE 1 – PILOT STEP1” and “LB ASSESSMENT TOOL – GRADE 3 – PILOT Step1”].

8
Results from Step 1:
We piloted 12 passages in each grade (6 English and 6 Filipino) for the 1st step of the pilot.
Note: we could only assess 9 students for Grade 3 (as opposed to 10). Here are the results:
1. English Grade 1
English Grade 1
Percent Word Correct Q1 Q2 Q3 Q4
Passage 1 81.5% 0.2 0.4 0.8 0 Passage 2 90.3% 0.7 0.3 0.3 0.3 Passage 3 88.2% 0.4 0.7 0.4 0 Passage 4 84.1% 0.6 0 0.3 0.2 Passage 5 92.8% 0.8 0.1 0.1 0.7 Passage 6 76.2% 0.5 0.2 0.3 0.1
English reading passages were more difficult for students than Filipino passages. For grade 1,
reading fluency varied quite considerably from passage to passage, with passage 6 being the
hardest (76.2% of correct words read) and passage 5 the easiest (92.8% of correct words read).
We equated the passages as follows: Passage 1 with Passage 6, Passage 2 with Passage 5 and
Passage 3 with Passage 4.
Because there is a 5.3 percentage point difference between Passage 1 and Passage 6, we
decided to modify Passage 6 to make it easier for children to read. We thus changed the word
“kittens” to “babies”. We also slightly modified Passage 3, “says Nana to herself” became “says
Nana out loud” and the last two lines of the passage were combined into one line: “’Well, you
don’t have beautiful eyes. But you can do things I cannot do,’ says Nana.”
As for the comprehension questions, we changed Passage 1 Question 1 (“Who is Jerry”
became “Who is new in school?”), Passage 4 Question 3 (“Who is playing with the red ball”
became “What color is the ball”).
Due to time constraints, we could not change Questions 4 of Passage 1 and of Passage 3. We
also hypothesized that the English passages would be too difficult across the board for Grade 1
students (Recall that Step 1 of the pilot was done with Grade 2 students (one grade above our
target grade), and they were already struggling to read and answer questions) and that we will
probably not use the English passages at all in the official assessment.
Passages 1, 3 and 5 were selected for Step 2 of the pilot.

9
2. English Grade 3
English Grade 3
Percent Word Correct Q1 Q2 Q3 Q4
Passage 1 81.9% 0.11 0.89 0.56 0.22 Passage 2 82.8% 1.00 0.89 0.22 0.33 Passage 3 80.2% 0.33 0.44 0.22 0.44 Passage 4 80.3% 0.67 0.33 0.22 0.56 Passage 5 79.3% 0.67 0.56 0.33 0.33 Passage 6 81.0% 0.89 0.33 0.56 0.56
For Grade 3, students also had difficulty reading and answering questions, as compared to the
Filipino passages. Passage 5 was the hardest and Passage 2 was the easiest. We equated the
passages as follows: Passage 1 & Passage 2, Passage 3 & Passage 5, Passage 4 & Passage 6.
(Note: Passage 3 was originally equated with passage 6, and passage 4 with 5, but due to some
miscalculations, the equated passages were changed. Passages 3 and 4 should have been equated
for Step 1, but unfortunately they were not chosen as passages to pilot in Step 2 so we do not
know how grade 3 students would have scored with passages 3 and 4.)
We modified some questions: Passage 1 Question 1 (“Where is the boat parade” became
“Why was it a special day?”), Passage 2 Question 3 (“Who won the race” became “Who slept
during the race”), Passage 3 Question 1 (“Who wanted the school to be free from litter”
became “What was the Grade Three class busy with?”), Passage 3 Question 3 (“What kind of
waste is placed in container B” became “who cleaned the blackboard”), Passage 6 Question 2
(“How did Vilma’s career start?” became “When she was a child, what did Vilma do?”).
Passages 2, 5 and 6 were selected for Step 2 of the pilot.

10
Filipino Grade 1 and Grade 3
Filipino Grade 1
Percent Word Correct Q1 Q2 Q3 Q4
Passage 1 95.7% 1 0.8 0.9 0.9 Passage 2 94.8% 1 1 0.1 0.4 Passage 3 95.4% 0.8 0.6 1 1
Passage 4 93.3% 0.8 0.8 0.9 0.9 Passage 5 97.1% 0.9 1 1 0.6 Passage 6 91.9% 1 0.8 0.8 0.8
Filipino Grade 3
Percent Word Correct Q1 Q2 Q3 Q4
Passage 1 94.3% 0.78 0.89 0.89 0.78
Passage 2 95.6% 0.56 0.78 0.33 0.22 Passage 3 88.7% 0.11 0.44 0.44 0.22
Passage 4 93.6% 0.56 0.78 0.33 0.78
Passage 5 87.1% 0.78 0.78 0.56 0.00 Passage 6 91.2% 0.44 0.78 0.44 0.56
For grade 1, we equated the passages as follows: Passage 1 with Passage 3, Passage 4 with
Passage 6, Passages 2 and 5 could not be equated. For grade 3: Passage 1 with Passage 2,
Passage 3 with Passage 5, Passage 4 with Passage 6. (Note: Passages were equated differently at
the very beginning due to some miscalculations)
Passage 4 Question 3 (“ano pa ang mga paraang binanggit ni Nina upang ipakita ang paggalang sa
watawat?” became “Ayon kay Nina, ano ang dapat gawin sa watawat matapos itong ibaba?”).
Passage 5 Question 4 (“Sa iyong palagay, bakit “tipaklong” ang nagging tawag sa mga lalaking
nagging insekto?” became “Bakit naging tipaklong ang tatlong lalaki? (dahil sa sumpa ni Aling
Maria”).
Passages 3, 4 and 5 were selected for Grade 1, and Passages 1, 4 and 5 were
selected for Grade 3, for Step 2 of the Pilot.
VERY IMPORTANT: For endline, look for equated passages in files “LB ASSESSMENT
TOOL – GRADE 1 – PILOT STEP2.1” and “LB ASSESSMENT TOOL – GRADE 3 – PILOT
STEP2.2” (these files contain the corrected questions based on pilot).

11
Stage 3: Step 2 of the pilot The entire tool including 3 reading passages in each language (i.e. 6 passages in Grade 1 – 3 in English and 3 in Filipino; and 6 passages in Grade 3 – 3 in English and 3 in Filipino) was then piloted with 20 1st grade and 20 3rd grade students from one pilot school in Metro Manila, and 26 1st grade students and 19 3rd grade students from three pilot schools in South Central Mindanao. The three schools of SCMPO were chosen from our three ethnic communities, Ilonggo, Maguindanaon, and T’boli. The entire tool was piloted in both sites due to the large difference in school environment and student background between Metro Manila and South Central Mindanao.
The tools used for step 2 of the pilot were “LB ASSESSMENT TOOL – GRADE 1 – STEP2.3” and “LB ASSESSMENT TOOL – GRADE 3 – STEP2.3”.
Stage 4: Revision of the final tool Based on the results of the 2nd step of our pilot, we then made final revisions to the tool:
1) Student Background: a. We added options for “N/A” (no answer) and “Nothing” to most multiple choice questions.
This allowed enumerators to differentiate between students who did not answer or did not know (which was scored as “missing data”) and students who did not possess anything (e.g. no books at home, or no appliances, which was scored as “0”).
b. Question 20 (“What type of appliances do you have at home?”): We deleted options for “component” (music stereo system) and “oven” as very few of our pilot students reported possessing one of these items.
2) Concepts About Print: a. We changed the order of items #10, 11 and 12. They were placed earlier and replaced
items # 8, 9 and 10 instead. Items #8 and 9 thus became items #11 and 12. This was done in response to enumerators’ feedback that item # 8 (show me the beginning of the story) was very similar to item #4 (show me the beginning of the story/where to start reading). In fact, those two items test for different concepts, item #4 tests for knowledge of “first word” or “beginning of sentence” (items #4, 5, 6 and 7 are thus part of the concept of “sentence structure”) whereas item #8 tests for “beginning of story/book” (items #8 and 9 are thus part of the “beginning/end of story” concept).
b. In addition, we changed the item “open the book to page 3” to “open the book to page 12”, thus deliberately choosing a page number that is located towards the middle of the book in order to avoid biasing students for the subsequent questions (“show me the beginning of the story/show me the end of the story”).
c. The wording was changed for some of the items. For instance, in item #3, instead of “we will read the book Bubbles”, the enumerator was asked to say “we will look at the book Bubbles”. Enumerators reported that the word “read” misleads students to think that they would read the entire book together.
d. Scoring of questions #9 and #10 (can you identify/name a letter/word) is tricky; enumerators often forgot that it is to be scored out of a total of 2 points. Point numbers were thus added for each item to remind enumerators of the scoring system (“/1” for “out of 1” and “2” for “out of 2” were added).
3) Letter test: a. No change was made to the letter test component.
4) Most Used Words: a. Grade 1: no change was made.

12
b. Grade 3: English words “they”, “you”, “on”, “to”, “for” were known by almost all students, so they were replaced by “friends”, “this”, “will”, “some”, “trees”. Filipino words “po”, “ako”, “mo”, “ito” were replaced by “tunog”, “inyong”, “nang”, “ibigay”.
5) Reading Passages: a. As expected, English passages were difficult for Grade 1 students. For MMPO the average %
word correct for all 3 passages was 45.8%, but for SCMPO it was much lower at 19.8%. We thus decided not to use English passages for the final Grade 1 tool.
b. For Filipino Grade 1 passages, passage 3 was chosen for the final tool. As is shown in the table below, SCMPO students scored highest on passage 3. Passage 3 also had higher standard deviations than other passages in general, which would allow to better capture variation in the literacy skills of the student sample. Finally, passage 3 was well-equated with passage 1 in the first step of the pilot (95.7% and 95.4% words correct for passage 1 and passage 3, respectively).
Passage 3 Passage 4 Passage 5
% words correct words/min
% words correct words/min
% words correct words/min
MMPO average 0.77 23.61 0.74 20.50 0.75 22.83 SD 0.27 15.58 0.23 13.28 0.25 15.96
SCMPO average 0.23 5.77 0.18 4.31 0.19 6.00 SD 0.39 13.36 0.37 11.98 0.38 14.69
c. For English Grade 3, passage 5 was chosen. Considering that these are baseline results and that scores are quite high, we decided to choose the passage for which students scored lowest in order to avoid a ceiling effect at endline.
Passage 2 Passage 5 Passage 6
% words correct words/min
% words correct words/min
% words correct words/min
MMPO average 0.80 65.19 0.80 54.38 0.84 54.50 SD 0.16 24.41 0.09 20.41 0.09 19.33
d. For Filipino Grade 3, passage 1 was chosen. Passage 1 was the most well-equated with passage 2 (from 1st step of pilot).
Passage 1 Passage 4 Passage 5
% words correct words/min
% words correct words/min
% words correct words/min
MMPO average 0.93 60.25 0.96 58.25 0.93 58.38 SD 0.05 15.4576 0.04 17.39 0.08 18.42
The final tools are files “LB ASSESSMENT TOOL – GRADE 1” and “LB ASSESSMENT TOOL – GRADE 3”.

13
Methodology
Sample Size This LB assessment was designed to be a baseline assessment for all SC partner schools in MMPO and SCMPO. As such, 8 schools in MMPO and 31 schools in SCMPO participated.
The target sample size was 40 students for each school – 20 students from Grade 1, and 20 students from Grade 3.
The total number of students actually tested was 1,426: 320 students in MMPO and 1,106 students in SCMPO. The target was thus reached for MMPO (40 students for all 8 schools) but not for SCMPO due to teacher/student absences, and small class sizes (Don J., Pine Tree and Spur2 are small schools).
The breakdown by school for SCMPO can be found in the tables below:
Municipality School Grade 1 Grade 3
1 SCMPO Bagumbayan Busok 20 20
2 SCMPO Bagumbayan Chua 19 20
3 SCMPO Bagumbayan Daguma 20 20
4 SCMPO Bagumbayan Don J. 14 9
5 SCMPO Bagumbayan Kapaya 20 20
6 SCMPO Bagumbayan Nakan 20 20
7 SCMPO Bagumbayan Pine tree 8 4
8 SCMPO Bagumbayan Sinagandal 20 16
9 SCMPO Bagumbayan Sison 14 19
10 SCMPO Bagumbayan Spur2 11 6
11 SCMPO Bagumbayan Titulok 18 20
12 SCMPO Bagumbayan Tuka 20 20
13 SCMPO Lutayan Mamali 20 20
14 SCMPO Lutayan Sisiman 20 20

14
Municipality School Grade 1 Grade 3
15 SCMPO Lake Sebu Klubi 18 20
16 SCMPO Lake Sebu Lake Lahit 20 21
17 SCMPO Lake Sebu Lake Seloton 20 20
18 SCMPO Lake Sebu Lamfugon 20 20
19 SCMPO Lake Sebu Lamlahak 20 20
20 SCMPO Lake Sebu Luhib 20 20
21 SCMPO Lake Sebu Odos Angkoy 21 16
22 SCMPO Lake Sebu Tablo 20 20
23 SCMPO Lake Sebu Tidac 12 11
24 SCMPO Tboli Basag 20 11
25 SCMPO Tboli Dataldlanag 20 20
26 SCMPO Tboli Lambuling 20 20
27 SCMPO Tboli Lamhako 20 18
28 SCMPO Tboli Lamsalome 20 20
29 SCMPO Tboli Salacafe 20 20
30 SCMPO Tboli Talufo 20 20
31 SCMPO Tboli T'bong 11 9

15
Student Sample Selection The random selection of students followed a two-step process. First, for schools with multiple sections, one section was randomly selected. This means that for some schools a “high” section might have been selected, whereas for other schools, a “lower” section might have been selected. It is important to keep this in mind when comparing results between schools.
Second, from that one section, 20 students were randomly selected (10 boys and 10 girls). For schools which provided us with student lists, this was done ahead of time using Excel. For schools which did not provide us with student lists, students were chosen by drawing lots (enumerators were provided with numbered pieces of paper that they could draw, then selecting students from the class list that they got from teachers the day of the assessment). An additional 3 boys and 3 girls were also selected as back-ups in case of student absences.
How to randomize in Excel from a class list: 1. After you get the student list, and number each student, enter this number into one
column in Excel. (E.g. If there are 25 boys in the class, then you would enter numbers 1 to 25 in one column). In the column next to it, enter the formula =RAND() and copy it so that all student numbers are assigned a random number. This is a number between 0 and 1 that is assigned randomly by Excel. Then sort by the Random Number. Your students are now sorted randomly!
2. Now take the number of students in the class and divide by the number of students wanted for the assessment. Say you need 10 boys, and you have 25 boys in the class: 25/10 = 2.5. Round this number up, so for us it will be 3, and from your randomized list of students (from step 1) count every 3 students. Once you reach the bottom of the list, go back to the top, until you get 10 students. This will be your random sample!
Data collection and tabulation A total of 4 enumerators in MMPO and 18 enumerators in SCMPO (originally 20 enumerators for first 3 days) tested students in one-on-one sessions. Each session lasted approximately 25-30 minutes. They were conducted without the audience of teachers, parents or any other adults or children. As much as possible, the assessment took place in a quiet, isolated room. However, conditions were more challenging in SCMPO, and at times, enumerators had to test students outside due to a lack of empty rooms.
Data tabulation was conducted by 1 research assistant in MMPO and 3 tabulators in SCMPO. Tabulation was done in Excel to allow for easy import into SPSS.
The assessment was conducted over a period of 8 days in MMPO (one school per day) and of 2.5 weeks in SCMPO. SCMPO enumerators were divided into 4 teams: one Maguindanaon team (blue), one Ilonggo team (purple) and two T’boli teams (green). The table below shows the final schedule of the data collection process in SCMPO.

16
Mon Tues Wed Thurs Fri Sat Sun 9/21 9/22 9/23 9/24 9/25 9/26 9/27
Holiday
SCMPO LB Assessment
Orientation for Enumerators
Pilot-testing of the LB assessment tool
9/28 9/29 9/30 10/1 10/2 10/3 10/4
LB Orientation with Dep Ed partners
AM. South Cotabato PM. Sultan Kudarat
Review and Reorientation for Enumerators with
Yvonne and SCMPO staff
Mamali ES, LT No data collection
Busok ES, BB Tuka ES, BB
Lamfugon ES, LS (T1 &2) Lamfugon (T1&2) Lahit ES, LS (T1)
Lahit ES, LS (T1) Lake Seloton Es, LS (T2)
Luhib (T2) Assessment Meeting w/ Enumerators/tabulators
10/5 10/6 10/7 10/8 10/9 10/10 10/11
Sisiman ES, Lutayan Nakan ES, BB Sinagandal ES, BB No data collection
Tuka ES, BB Sison ES, BB Chua ES, BB No data collection Lake Seloton ES, LS
(T2) Tbong ES, LS (T1) Odos Angkoy ES, LS (T2) TIDAC, LS (T2) Lamhaku ES, TB (T1 &2)
Luhib (T2) Odos Angkoy ES, LS (T2) TIDAC (T2) Klubi ES, TB (T1) Assessment Meeting w/
Enumerators/tabulators Tablo (T1) Lamlahak Es, LS (T1)
10/12 10/13 10/14 10/15 10/16 10/17 10/18
Daguma ES, BB No data collection Don J ES (3), BB Titulok ES, BB
Assessment Meeting w/ Enumerators/tabulators
Kapaya ES, BB No data collection Spar2 ES (2) & Pine Tree ES (3), BB Titulok ES, BB
Lamhaku ES, TB Lambuling ES, TB (T1) Dataldlanag ES, TB (T1) Salacafe Es, TB (T1)
Talufo Es, TB (T2) Lamsalome PS, TB (T2) Basag PS, TB (T2)

17
Assessment Findings
Findings are divided by program site (MMPO and SCMPO) and by grade level (Grade 1 and Grade 3).
MMPO
Grade 1
Student Background A total of 160 1st grade students were tested in MMPO (80 boys and 80 girls). Of all 160 students, about 90% have attended and completed some form of Early Childhood Education, 14% have repeated 1st grade, over 90% have electricity, 73% have seen someone read at home, and 64% have been read to at home.
Figure 1 - Student background MMPO Grade 1
The following charts compare the scores of Taguig vs. Paranaque. While analyzing these results, it is important to keep in mind that students from a specific section were chosen for each school. Some schools therefore had students from a high section tested, while others had students from a lower section tested. The following table shows the breakdown of each type of section in Taguig and Paranaque. For instance, the only high section chosen was in Taguig. This could affect the interpretation of comparative results between Taguig and Paranaque.
Grade 1
Taguig Paranaque
High section 1 0
Middle section 2 3
Low section 1 0
No classification 0 1
18
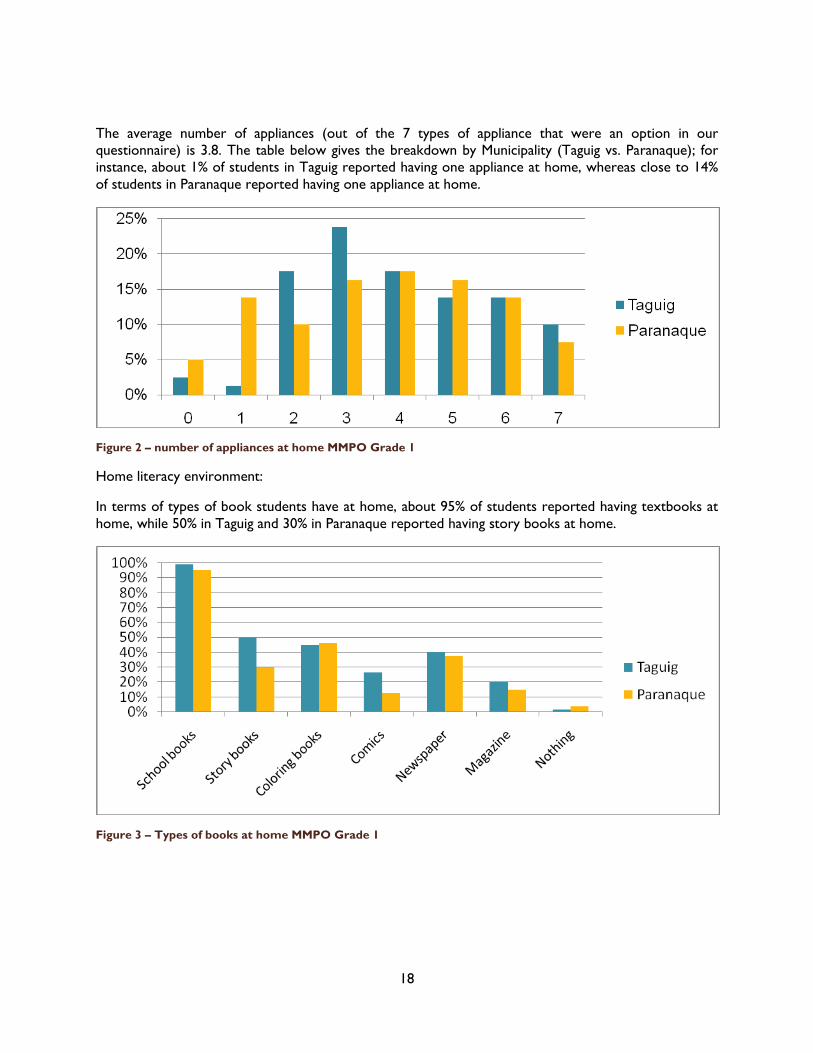
The average number of appliances (out of the 7 types of appliance that were an option in our questionnaire) is 3.8. The table below gives the breakdown by Municipality (Taguig vs. Paranaque); for instance, about 1% of students in Taguig reported having one appliance at home, whereas close to 14% of students in Paranaque reported having one appliance at home.
Figure 2 – number of appliances at home MMPO Grade 1
Home literacy environment:
In terms of types of book students have at home, about 95% of students reported having textbooks at home, while 50% in Taguig and 30% in Paranaque reported having story books at home.
Figure 3 – Types of books at home MMPO Grade 1

19
Main literacy indicators
Figure 4 – Main literacy indicators MMPO Grade 1
Figure 4 above details the average scores of students tested in Taguig and Paranaque for the different components of the assessment tool (** indicates a difference that is statistically significant at the 5% level, n.s. = non-significant).
For Concepts About Print, the average score was 85% (correct responses), while for the Letter Test students identified 88% of all letters correctly on average. On average, students scored better in the Filipino section of Most Used Words (‘FIL words’) than on the English section (‘ENG words’). Students read 60% of words correctly in the reading passage (recall Grade 1 only has one reading passage, in Filipino) and answered 50% of questions correctly (average of 2 out of 4 questions).
Gender differences:
No gender difference was found in Grade 1in MMPO. Therefore, on average, boys and girls score similarly.

20
Relationship between SES and literacy outcomes:
Figure 5 – Literacy outcomes by house wall type MMPO Grade 3
Note: Semento = Cement, Kahoy = Wood.
Figure 5 above gives the average scores of students who live in houses with cement walls versus those who live in houses with wood walls. The difference is significant only for the Letter Test and not for the Most Used Words or Reading Passages (although there seems to be a trend). It should be noted, however, that it is unclear which type of walls, cement or wood, would be considered of higher SES. Indeed, Department of Education officials observed that wooden walls could be of higher SES than cement, whereas plywood walls would be of lower SES than cement walls. Our data does not allow us to differentiate between plywood and other types of wood. Therefore, this indicator might not be a good proxy for SES.
**
n.s. n.s.

21
Figure 6 - Literacy outcomes by number of type of appliances in the home
An analysis of literacy outcomes by the number of type of appliances in the home reveals a trend, as shown in Figure 6 above. Students with 1, 2, 3 and 4 types of appliance in the home, tend to score lower than students with 5, 6, and 7 types of appliances in the home, on average.
An Analysis of Variance (ANOVA) did not determine that these differences were statistically significant.
Relationship between home literacy environment and literacy outcomes:
Figure 7 - Literacy outcomes by students who are read to and who are not read to at home
No statistically significant differences were found between students who are read to at home, and students who are not read to at home (Figure 7).

22
Concepts About Print
Figure 8 - Concepts About Print MMPO Grade 1
CAP scores show that students could name letters easily but not words. They also were able to identify the beginning of the story more often than the end of the story. However, CAP results might not be reliable due to the difficulty in administering this portion of the assessment tool.
Letter Test
Figure 9 - Letter Test, Grade 1 MMPO
Generally speaking, students scored higher on uppercase letters than lowercase letters. The most difficult letters were “l” (lowercase L), “ñ” and “Ñ”, “ng” and “NG”, and “q”.

23
Most Used Words
Figure 10 - Filipino Most Used Words, Grade 1 MMPO
The word “o” was the easiest word, while the word “bagay” was the most difficult.
Figure 11 - English Most Used Words, Grade 1 MMPO
Students scored lower on English words than Filipino words on average. The easiest word was “I” and the most difficult “use”.

24
Reading Passages
Figure 12 - Reading Passage, all Grade 1 students MMPO
Figure 13 - Reading Passage, excluding struggling readers Grade 1 MMPO
Considering that 39% of Taguig students and 25% of Paranaque students tested are struggling readers (students are identified as struggling readers if the enumerator had to read to him/her, enumerators were asked to read to students if they could read 4 words or less in one minute), an analysis of words read correctly per minute and in the entire passage was also done including only students who are not struggling. Because struggling readers skew the average scores negatively, this analysis gives us another measure of fluency for students who can read.
The average fluency score of all Grade 1 students in MMPO is 20 words per minute, while the average fluency score of students who are not struggling is 30 words per minute. Students can read 31 words (out of 52 words) correctly overall, while students who are not struggling can read 44 words (out of 52 words).

25
Figure 14 - # of correct questions, all students Grade 1 MMPO
Figure 15 - # of correct questions, excluding struggling readers Grade 1 MMPO
A similar analysis was conducted for the number of comprehension questions answered correctly. Including all students, an average of 2 out of 4 questions were answered correctly. When excluding struggling readers, this score increases somewhat, to about 2.2 questions. This seems to suggest that even non-struggling readers show difficulty answering comprehension questions.
Analysis by School An analysis by school was also conducted. Here, it is important to keep in mind once again that low sections were chosen in some schools, while higher sections were chosen in others.

26
Figure 16 - Literacy outcomes by school/type of section, Grade 1
As we can see in this graph, the only school with the low section is also the school that scored the lowest on average. The range of scores is very wide across schools/sections, for instance scores on Filipino most used words ranged from 19% to 85% (average 68%) and the scores on English most used words ranged from 25% to 70% (average 53%).

27
Grade 3
Student Background A total of 160 3rd grade students were tested in MMPO (80 boys and 80 girls). The student background characteristics of these 160 3rd grade students are fairly similar to those of 1st grade students. About 5% of these students repeated grades (as opposed to 14% in our 1st grade sample).
Figure 17 - Student background MMPO Grade 3
The average number of appliances is 4.76. The table below gives the breakdown by Municipality.
Figure 18 - Number of appliances at home MMPO Grade 1
In terms of types of appliances students have at home, the most common appliance is the TV (more than 90% of students have a TV at home) and the least common is the computer (30 to 35% of students have a computer at home).

28
Home literacy environment:
In terms of types of book students own at home, about 99% of students reported having textbooks at home, while about 60% of students have story books.
Figure 19 - Types of books at home MMPO Grade 3
In terms of socioeconomic status (SES), one of the proxy questions used in the student background questionnaire concerned the type of the walls of student’s houses. In MMPO, more students had homes with walls made out of cement (bato) than wood (kahoy) but as mentioned previously, the term “kahoy” does not allow us to differentiate between plywood (lower SES level than cement) and other types of wood which might be indicative of higher SES levels.

29
Figure 20 - Types of house walls MMPO Grade 3
Main literacy indicators
Figure 21 - Literacy indicators (CAP, LUC, LLC) MMPO Grade 3
Figure 20 above gives the average scores of Taguig and Paranaque students in Concepts About Print and Alphabet Knowledge (uppercase and lowercase). Scores for these components are high, averaging 95-98% (** indicates a significant difference at the 5% level).

30
Figure 22 - Literacy indicators (Most Used Words) MMPO Grade 3
Figure 21 gives the average scores on the Most Used Words components of the assessment. Students could read almost all of the words, with a better score on the Filipino words (almost 100%) than on the English words (average of 19 words out of 20).
Figure 23 - Literacy indicators (Reading Passages) MMPO Grade 3
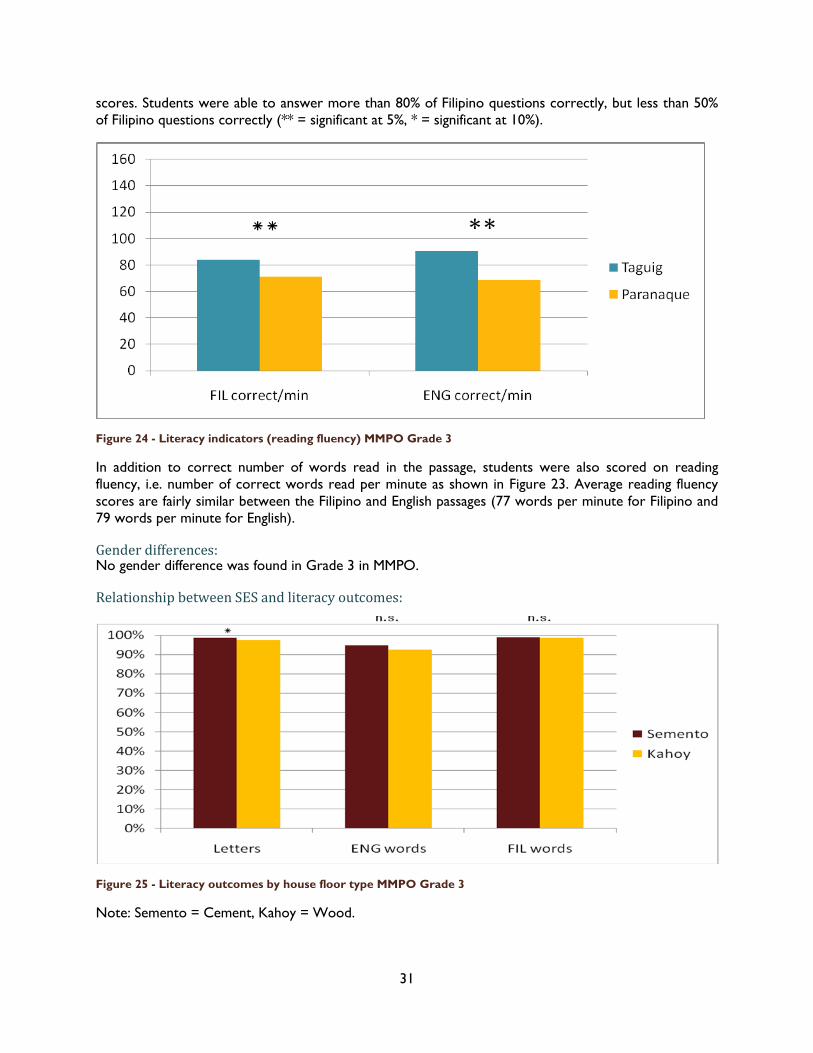
Figure 22 gives the average scores on both reading passages, the Filipino passage and the English passage. Students were tested on correct number of words read in the entire passage as well as on comprehension. Third grade students were generally able to read the words in both languages, with scores in Filipino higher than in English (about 95% of words in Filipino, and about 88% of words in English). The difference between Filipino and English is however more flagrant in the comprehension
31
scores. Students were able to answer more than 80% of Filipino questions correctly, but less than 50% of Filipino questions correctly (** = significant at 5%, * = significant at 10%).
Figure 24 - Literacy indicators (reading fluency) MMPO Grade 3
In addition to correct number of words read in the passage, students were also scored on reading fluency, i.e. number of correct words read per minute as shown in Figure 23. Average reading fluency scores are fairly similar between the Filipino and English passages (77 words per minute for Filipino and 79 words per minute for English).
Gender differences: No gender difference was found in Grade 3 in MMPO.
Relationship between SES and literacy outcomes:
Figure 25 - Literacy outcomes by house floor type MMPO Grade 3
Note: Semento = Cement, Kahoy = Wood.

32
Figure 24 above gives the average scores of students who live in houses with cement floors versus those who live in houses with wood walls. The difference is significant only for the Letter test and not for the Most Used Words sections of the assessment or any other sections.
Figure 26 - Literacy outcomes by house wall type MMPO Grade 3
Figure 25 gives scores by house wall type. Here significant differences are found on all components of the assessment except for Filipino Most Used words. However, note that the house wall question might not be a good proxy question for SES as “kahoy” could refer to cheaper plywood wood as well as more expensive wood.
Figure 27 - Literacy outcomes by number of book types at home MMPO Grade 3
Figure 26 shows comprehension scores in Filipino and English by number of book types at home. An Analysis of Variance showed that number of book types at home was a significant predictor only in English comprehension questions (and no other component of assessment even though there seems to be a trend). Students with 1, 2 or 3 book types at home scored lower on average than students with 4

33
book types at home who in turned scored lower on average than students with 5 or 6 book types at home in English comprehension.
Figure 28 - Letter test MMPO Grade 3
Figure 27 gives the average scores of MMPO 3rd grade students in the letter test for uppercase letters and lowercase letters. The lowest score was obtained for “l” (“L” lowercase) as it was often confused for I (“i” uppercase). Students also showed difficulty identifying “ñ” (both uppercase and lowercase).
Analysis by type of class section: As with Grade 1, a comparison between Taguig and Paranaque calls for caution as different types of class sections were tested between the two municipalities. The following table shows the breakdown of different types of class sections (high section, middle section and low section) between Taguig and Paranaque. The table shows that the only one low section was tested, in Paranaque, whereas 3 high sections were tested in Taguig as opposed to only 1 high section in Paranaque. This might explain some of the significant differences that were found between the two municipalities across the different components of the assessment tool.
Table 1 - Breakdown of section type by Grade and Municipality
Grade 1 Grade 3
Taguig Paranaque Taguig Paranaque
High section 1 0 3 1
Middle section 2 3 1 1
Low section 1 0 0 1
No classification 0 1 0 1

34
A follow-up analysis was thus done comparing the one low section in Paranaque to all other sections, which the following charts describe.
Figure 29 - Literacy outcomes (letter test and most used words) by section type MMPO Grade 3
Figure 30 - Literacy outcomes (reading passages) by section type MMPO Grade 3

35
Figure 31 - Literacy outcomes (comprehension questions) by section type MMPO Grade 3
Figures 28-30 show the difference in scores between the low section and all the other sections combined. Similarly to Grade 1, there is a wide range in scores with the low section scoring significantly lower than all the other sections combined, especially in the English comprehension questions.
The following figures give the scores by school/section for Most Used Words and Reading Passages.
Figure 32 - Most Used Words score by school/section

36
Figure 33 - Reading Passages scores by school/section
Figure 31 shows that all sections scored relatively similarly in the Most Used Words component of the tool, except for the only low section (Sampaloc school) which scored much lower, especially in English. Figure 32 also shows the range of the scores obtained in the Filipino and English reading passages. Sampaloc scores particularly low in reading fluency (number of correct words per minute for Filipino and English).

37
SCMPO Scores for SCMPO are divided between 4 municipalities and 3 languages as indicated in the following table.
Table 2 - Breakdown of language/municipality SCMPO
Municipality Maguindanaon Ilonggo T’boli
Lutayan X
Bagumbayan X X
Lake Sebu (x) X
T’boli X
The Maguindanaon ethnic group (the language is also called Maguindanaon) form the Muslim community in South Central Mindanao. The Ilonggo (language is also Ilonggo) are the Christian settlers, who can also be found in the Visayas (Central Philippines), and finally the T’boli are the indigenous mountainous group of Mindanao. Lutayan Municipality is predominantly Maguindanaon, while T’boli Municipality is predominantly T’boli. Bagumbayan Municipality is majority Ilonggo but also includes some Maguindanaon communities, and finally Lake Sebu is for the most part T’boli but also has some Ilonggo residents (although not a considerable number for the purpose of our study).
Each ethnic group speaks a distinct language that is unintelligible by the other ethnic groups. The Ilonggo language however is closer to Tagalog than Maguindanaon or T’boli (to keep in mind for the interpretation of our findings).

38
Grade 1
Student Background
Figure 34 - Student background by municipality SCMPO Grade 1
As compared to MMPO students, our sample of SCMPO students is more disadvantaged. Less students have attended early childhood education, less have electricity and more have repeated grades; Lutayan students especially with 50% of Grade 1 students having repeated a grade. Lutayan is also the municipality with the most students with electricity; SCMPO staff have indicated that this is not surprising given that Lutayan is closer to the city Koronadal.
Figure 35 - Number of appliances at home by municipality SCMPO Grade 1
Figure 35 shows the number of appliances in the home by municipality. Students in Bagumbayan own the most appliances with an average of 2.2, while students in T’boli own the least number of appliances with 0.8. Compared to MMPO, using number of appliances as a proxy of SES level, SCMPO students seem more disadvantaged.

39
Figure 36 - Types of book at home by municipality MMPO/SCMPO Grade 1
As compared to MMPO (Taguig and Paranaque), many more SCMPO students own “nothing”, i.e. students do not even have textbooks at home. Coloring books, comics, newspapers and magazines are also fairly rare in SCMPO.
Main literacy indicators
Figure 37 - Literacy indicators (CAP, Letter Test) by municipality MMPO/SCMPO Grade 1

40
Figure 38 - Literacy indicators (Most Used Words, reading passages) by municipality MMPO/SCMPO Grade 1
Figure 37 and 38 above show the main literacy indicators by municipality. Overall, SCMPO students score much lower than MMPO students on all components of the assessment. SCMPO students’ scores in the reading passage are especially low, particularly for the comprehension questions. For Bagumbayan province, results were also divided between the Maguindanaon and the Ilonggo ethnic groups (recall that Bagumbayan province has a considerable number of both Maguindanaon and Ilonggo students). Overall, Ilonggo students tend to score higher than the other 2 ethnic groups in SCMPO. Maguindanaon students from Bagumbayan municipality and T’boli students from T’boli municipality tend to score the lowest amongst SCMPO students.
Gender difference:
Figure 39 - Gender differences for T'boli students Grade 1

41
None of the language groups showed a significant gender difference, EXCEPT FOR the T’boli group. In the T’boli group female students scored higher on average than male students (statistically significant difference on all components).
Relationship between SES and Main literacy outcomes:
Figure 40 - Relationship between 'electricity at home' and literacy outcomes
A statistically significant difference between students who had electricity and students who did not have electricity was found on all components of the assessment. An average difference of 8 percentage points was found between the two groups of students.
Figure 41 - Type of house walls and literacy outcomes
A statistically significant difference in literacy scores was found between students with semento house walls and the two other types of house walls, but not between students with kahoy and students with bamboo walls.

42
Figure 42 - Number of appliances at home and literacy outcomes SCMPO Grade 1
Figure 42 shows the scores of students by number of appliances owned at home. As we can see there is a trend whereby students with less appliance tend to score lower than students with more appliances (there were very few students who had 5 or more appliance at home, so their scores were not included here).
Home Literacy Environment
Figure 43 - Number of book types at home and literacy outcomes SCMPO Grade 1
Students with more book types at home tend to score higher on average than students with less book types at home, similarly to MMPO students.

43
Figure 44 - Students being read to vs. students not being read to at home SCMPO Grade 1
Furthermore, students who are being read to at home also tended to score higher than students who were not read to at home. The difference was statistically significant for all components of the assessment.
Concepts About Print
Figure 45 - Concepts About Print by Municipality SCMPO Grade 1
Like MMPO students, SCMPO students showed more difficulty in naming a word than a letter and in identifying the end of the story than the beginning of the story. Figure 45 gives the score for each concepts about print question by municipality. On average, Lutayan (Maguindanaon) students scored lower than the other 3 municipalities.

44
Letter Test
Figure 46 - Letter Test SCMPO Grade 1
Students in Grade 1 in SCMPO could identify approximately 50% of the letters (52% uppercase and 50% lowercase).The most difficult letters are “ñ”, “ng” and “q” (lowercase).
Most Used Words
Figure 47 - Filipino Most Used Words by language SCMPO Grade 1

45
Figure 48 - English Most Used Words by language SCMPO Grade 1
SCMPO Grade 1 students could identify 27% of Filipino words and 23% of English words. Ilonggo students overall scored higher on this component than the other two groups. The easiest words to identify were “o” and “I” in Filipino and English (which is not surprising given that they’re also letters).
Reading Passage
Figure 49 - Filipino Reading Passage (Correct Words total and Correct Words per minute) SCMPO Grade 1
On average, SCMPO students read 4 correct words per minute and 8.6 correct words in the entire passage. Figure 49 also divides the T’boli students into those from Lake Sebu municipality and those from T’boli municipality. As we can see, students from T’boli municipality score significantly lower (p<.05) than those from Lake Sebu municipality. However, Maguindanaon students are those that score

46
the lowest overall. They could only read 0.59 words correctly per minute and 3.19 words total in the entire passage on average.
Figure 50 - Reading Passage (comprehension questions) by language SCMPO Grade 1
On average, SCMPO students could not answer more than .5 question correctly. Ilonggo students scored the highest but the score still remained low (about 0.62).
Figure 51 - % of struggling readers SCMPO Grade 1
Figure 51 shows the percentage of struggling readers by language group. A student was identified as a struggling reader if the enumerator had to read to him/her (the enumerator was instructed to read to the student if he/she could read less than 4 words a minute). As we can see, about 80% of students are considered struggling readers.

47
Analysis by School
Figure 52 - Letter Test and Filipino Most Used Words by school SCMPO Grade 1
Figure 52 above gives the average letter test and Filipino Most Used Words scores by school. Again, these results must be interpreted with caution as different section types might have been tested for different schools (however, section types in SCMPO are not as clearly divided as in MMPO, and a lot of these schools did not have as many sections as MMPO schools so the sections appear to be more homogeneous overall; although we do not have exact data to be conclusive).

48
Grade 3
Student Background
Figure 53 - Student background between sites Grade 3
Figure 54 - Number of appliances in the home by municipality SCMPO Grade 3

49
Figure 55 - Type of appliance at home by municipality SCMPO Grade 3
The 3 figures above show the main student background indicators by program site and by SCMPO municipality. Like Grade 1 students, Grade 3 students from SCMPO are more disadvantaged than MMPO students. Forty percent of 3rd graders from SCMPO repeated a grade as opposed to 5% in MMPO. In terms of home appliances, most SCMPO students own 1 or 2 appliances with the most common being the TV, Radio and Dining Table. Very few students own fridges or a computer at home.
Home Literacy Environment
Figure 56 - Type of books at home by municipality SCMPO Grade 3

50
As compared to Grade 1 students, more Grade 3 students have school books at home. Ninety-five percent of Lutayan students have school books at home but none of them mentioned having story books, coloring books or any other type of books.
SES indicators
Figure 57 - Type of house walls by municipality SCMPO Grade 3
Most houses in Bagumbayan municipality are made of cement or wooden walls, whereas houses in Lutayan, Lake Sebu and Tboli municipalities are mostly made of bamboo and cement walls. Note: our proxy question did not distinguish between kahoy and bamboo; variables had to be recoded after data collection to account for the fact that in Lake Sebu and Tboli wooden walls are in fact bamboo walls. This question might thus not be a good proxy of SES indicator.
Main Literacy Indicators
Figure 58 - Literacy indicators (Concepts About Print and Letter Test) by municipality Grade 3

51
As Figure 58 shows, SCMPO Grade 3 students score lower on average than MMPO students on the Concepts About Print and Letter Test components, but less dramatically so than Grade 1 students. SCMPO Grade 3 students are able to identify 90% of letters.
Figure 59 - Literacy indicators (Most Used Words) SCMPO Grade 3
SCMPO Grade 3 students are able to read Filipino words better than English words, but lag behind MMPO counterparts considerably. Here Figure 58 and 59 give the breakdown between Bagumbayan Ilonggo students and Bagumbayan Maguindanaon students, like for Grade 1. However, unlike Grade 1 students, Grade 3 Ilonggo students do not score the highest. Instead Lutayan students and Lake Sebu students (T’boli group) score higher than Ilonggo students.
Figure 60 - Literacy indicators (reading passages) by municipality Grade 3

52
The difference between SCMPO students and MMPO students is even more considerable in other components of the test, in the particular on the English reading passage. On the comprehension questions, SCMPO students answered 50% of the questions correctly in Filipino but only 18% in Filipino.
Figure 61 - Reading fluency Grade 3
As for reading fluency, SCMPO students reach much slower than MMPO students, at 35 words per minute for Filipino and 25 words per minute for English.
Gender differences
Figure 62 - Gender difference by language group SCMPO Grade 3
53
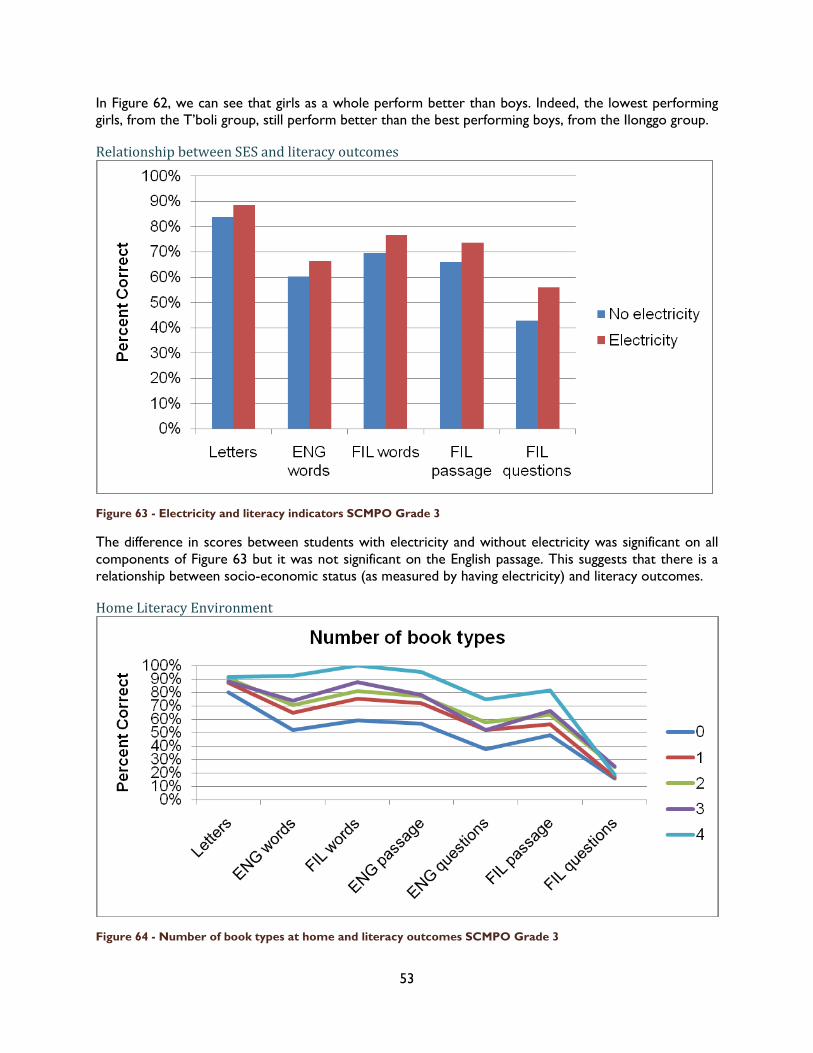
In Figure 62, we can see that girls as a whole perform better than boys. Indeed, the lowest performing girls, from the T’boli group, still perform better than the best performing boys, from the Ilonggo group.
Relationship between SES and literacy outcomes
Figure 63 - Electricity and literacy indicators SCMPO Grade 3
The difference in scores between students with electricity and without electricity was significant on all components of Figure 63 but it was not significant on the English passage. This suggests that there is a relationship between socio-economic status (as measured by having electricity) and literacy outcomes.
Home Literacy Environment
Figure 64 - Number of book types at home and literacy outcomes SCMPO Grade 3

54
Figure 65 - 'Being read to at home' and literacy outcomes SCMPO Grade 3
Like Grade 1, students with more book types at home tend to score higher than students with less book types at home. Furthermore, students who are being read to at home score significantly higher than students who are not being read to at home on all components of the assessment.
Concepts About Print
Figure 66 - Concepts About Print SCMPO Grade 3
Grade 3 students showed more difficulty pointing to words while enumerator was reading (which has also been reported in other literacy boost assessment, like in Bangladesh) and identifying the end of the story.

55
Letter Test
Figure 67 - Letter Test SCMPO Grade 3
Most Used Words
Figure 68 - Filipino Most Used Words SCMPO Grade 3
In Filipino, T’boli students score lower than Ilonggo and Maguindanaon students on average, but this is not the case for English words. This might be due to the fact that T’boli students are more disadvantaged than Ilonggo students for Filipino since Ilonggo is closer to Tagalog/Filipino, whereas all three languages are equidistant from English thus putting all three language groups on the same starting ground.

56
Figure 69 - English Mosed Used Words SCMPO Grade 3
Reading Passages
Figure 70 - Filipino and English reading passages SCMPO Grade 3

57
Figure 71 - Comprehension questions SCMPO Grade 3
There is no single language group that scores significantly higher or lower than the other two language groups on the reading passages. For English, however, the T’boli group scored higher on both the total number of correct words and the correct number of questions than Ilonggo and Maguindanaon students. Nevertheless, comprehension scores overall remain very low.

58
Figure 72 - Filipino Most Used Words by school SCMPO Grade 3

59
Figure 73 - Filipino Reading Passage (% of correct words read) SCMPO Grade 3
Figures 72 and 73 show the scores in Filipino Most Used Words and Reading Passages respectively by school. Again here, the interpretation of results must take into account what type of section was tested (although, as mentioned before, sections are not as clearly divided as MMPO). This information has, however, not been completely analyzed yet. This data should be used as indicative data for SCMPO staff to determine which schools might most need a literacy intervention.

60
Main Limitations
1. Correlation vs. causality:
Our results do not enable us to make any causal claims. For instance, we cannot say that having more books at home led/caused a higher score in literacy. Our results merely suggest a strong relationship between the two. More regression analyses controlling for a variety of factors that could also influence literacy outcomes would allow us to determine with more certainty if a richer home literacy environment could lead to higher literacy scores (although certain claims about causality would still be very difficult).
2. Inter-rater reliability
Given the timeline allotted for this study, it was impossible to hire enumerators through a rigorous recruitment process. It is therefore possible that some enumerators were “better” than others and that inter-rater reliability might not have been as high as expected not only between language groups but also within language groups. This could have affected the average scores of students in the different language groups as well as the standard deviations within those groups (which could have an effect on statistical significance). In fact, SCMPO had to let go of 2 enumerators who were not up to standard (could not effectively interact with children and could not record results appropriately) after the first few days of data collection. An informal analysis also showed that some enumerators tended to interpret students’ responses in certain ways with regards to their answers to SES proxy questions (e.g. type of house walls).
3. Testing conditions
In general, testing conditions varied a lot between schools. Because of a lack of space, several enumerators sometimes had to test students in the same room, or even outside. This was often accompanied by distractions as other children crowded around the rooms to observe their peers while they were being assessed.
4. Personality of students
The one-on-one assessment style was sometimes uncomfortable for students who were very shy. Anecdotally, it seems that T’boli students are shyer than Maguindanaon or Ilonggo students. This is a problem as it can affect the reliability of our data. It is thus extremely important to recruit enumerators who have the right social skills to interact with children and make them feel comfortable.
5. Appropriateness of assessment
While data collection was already underway, the issue of cultural appropriateness of some of our reading passages was raised. The reading passages were developed based on a book that was purchased in Metro Manila. One in particular discussed a “taxi driver”, but taxis are practically inexistent in South Central Mindanao (most people commute by bus/minivan, motorcycles, or tricycles). Similarly, one of our Filipino passage discussed the words “po” and “opo” which are politeness words used exclusively in Tagalog and that students from other ethnic groups might not have heard or used as much.
6. Section types
The interpretation of our data by school has to take into consideration the type of section that was selected for data collection. In some schools/municipalities, more “high sections” were tested and in others more “low sections” were tested, thus making comparisons more difficult.

61
Discussion and Initial Recommendations
Overall, our literacy boost assessment results indicate that SCMPO students are much more disadvantaged than MMPO students, as measured by our proxy questions for socio-economic status. SCMPO students score significantly lower than MMPO students on all literacy indicators on average in Grade 1 as well as Grade 3. Nevertheless, although MMPO students score higher than SCMPO, there is still a wide variation amongst students.
Implication: There is a higher need for Literacy Boost in South Central Mindanao than in Metro Manila.
Gender differences? In MMPO, no gender differences were found. But in SCMPO, gender differences were found in the T’boli group for Grade 1, and in all language groups (T’boli, Ilonggo, Maguindanaon) for Grade 3. In fact, the highest performing boys (Ilonggo boys) still performed below the lowest performing girls (T’boli girls).Nevertheless, at this point of the analysis, we do not have a clear rationale for explaining this discrepancy between boys and girls in SCMPO, whereas MMPO scores do not show a gender difference.
Implication: Literacy Boost might want to target boys specifically in SCMPO.
SES and literacy outcomes? Overall, scores show a significant relationship between socio-economic status and literacy scores (except in Grade 1 MMPO). Students with lower socio-economic status tend to score lower on average than students with higher socio-economic status.
Implication: Focus on students of lower socio-economic status in both MMPO and SCMPO.
Home literacy environment and literacy outcomes? Our results also show a strong correlation between home literacy environment and literacy outcomes. In MMPO Grade 1, at first glance home literacy environment and literacy outcomes do not seem related (not statistically significant), however when completion of early childhood education and SES are controlled for, the number of book types significantly predicts score in comprehension questions. In Grade 3, the number of book types at home was significantly related to the score in comprehension questions. In MMPO, results thus suggest that home literacy environment is related to scores in reading comprehension. In SCMPO, results also show a strong correlation between number of book types at home and literacy outcomes. Furthermore, students who are being read to score significantly higher than students who are not being read to at home.
Implication: Our results only show a correlation between home literacy environment and literacy outcomes (as opposed to a causal relationship),but Literacy Boost can still focus on improving the home literacy environment of students to test whether or not this would lead to an increase in literacy scores.
What specific ethnic groups? In SCMPO, T’boli and Maguindanaon students scored lower on average than Ilonggo students. T’boli and Maguindanaon students are also those that are more disadvantaged socio-economically. These students are also those that must learn two new languages upon entering 1st grade (Filipino and English). For Ilonggo students, learning Filipino/Tagalog might be easier due to the fact that Ilonggo and Tagalog are much more similar to each other than T’boli and Maguindanaon. Furthermore, it is important to note that most teachers in South Central Mindanao are from the Ilonggo tribe, they can thus communicate with Ilonggo students but cannot communicate with T’boli or Maguindanaon students.

62
Implication: Focus on T’boli and Maguindanaon students. Note: The Department of Education is also starting a Multi-Lingual Education initiative to promote the use of home language in the first grades. In partnership with Save the Children, DepEd is also developing materials in these other languages (currently materials are being developed in T’boli).
What specific literacy skills? Our results show that even when students can read words in isolation, they cannot always read very fluently (as measured by number of correct words per minute). Comprehension is the one skills where all students scored low. There is thus a gap between reading words and understanding sentences and passages. However, for SCMPO, it is also important to note that comprehension questions were asked in Filipino (and not in the home language of the student) for the sake of consistency. Perhaps if the students had been asked in their home language, they would have been able to respond with higher accuracy.
Implication: Literacy Boost must go beyond teaching words in isolation and sounds and also focus on reading comprehension.
Conclusion
This initial baseline study of the literacy skills of Grade 1 and Grade 3 students in 39 schools in Metro Manila and South Central Mindanao has helped to shed light on the current needs of students and to respond to our initial research questions:
1. How applicable is the global literacy assessment approach being tested by Save the Children in the urban poor, majority Muslim, and indigenous community contexts where PhCO works?
Our Literacy Boost Assessment was very applicable in the urban poor, majority Muslim, and indigenous communities where PhCo works. By using enumerators that came from the same ethnic groups as students and mandating that all instructions be given in the home language of the student, the tool was able to gather interpretable data from all student groups. Nevertheless, it is impossible to determine with certainty the complete reliability of the data as students were tested once by one enumerator and that other factors might have affected student performance during the assessment (see Limitations).
2. How can findings from the SC literacy assessment add value to the way partner schools are
teaching and promoting reading? To the way PhCO is supporting literacy development in its partner schools? What improvements can be recommended based on an analysis of the findings?
Overall, these baseline results helped to paint a clearer picture of the current literacy skills of students. Results helped to identify specific groups of students who are struggling as determined not only by language, but also socio-economic status and gender. Overall, results also indicate a strong relationship between SES, home literacy environment and literacy outcomes, but these results remain at the correlational and not causal level.
3. In contexts where PhCO is pilot-testing an MLE approach to reading and language of instruction, how can the literacy assessment be adapted so that children’s home language can be used? Is there a difference in literacy assessment results when the official language of instruction is used and when children’s home language is used?

63
The literacy assessment itself contained materials in Filipino and English, but unlike DepEd assessments conducted by teachers, our Literacy Boost Assessment was conducted by enumerators that spoke the home language of the student. Unfortunately, we did not have the resources to conduct two types of assessment, one where the home language is used and one where the language of instruction is used and can thus not determine differences in results when different languages are used.
Overall our study answered the research questions set forth originally. The results in this report, however, remain preliminary. Many other research questions could be explored with this dataset; the relationship between home literacy environment and literacy outcomes for instance as we also have a roster of family members for each student. Nevertheless, these initial findings will hopefully inform the design of Literacy Boost as it is being rolled out in the near future in South Central Mindanao and Metro Manila.