lithium diisopropylamide-mediated …collum.chem.cornell.edu/publications/112_si.pdfs1 lithium...
TRANSCRIPT

S1
Lithium Diisopropylamide-Mediated Ortholithiations:
Lithium Chloride Catalysis
Lekha Gupta, Alexander C. Hoepker, Kanwal Jit Singh and David B. Collum*
Contribution from the Department of Chemistry and Chemical Biology
Baker Laboratory, Cornell University
Ithaca, New York 14853-1301
Supporting Information
Page
Experimental
I Measurement of chloride concentration using potentiometry and ion- S6 chromatography
IR Rate Studies
I Representative in situ IR spectroscopic analysis of an ortholithiation S7
II Plot of IR absorbances versus time for the ortholithiation of S8 1,3-difluorobenzene
F
F
LDA/THF
-78 oC
F
F
Li
III Plot of IR absorbances versus time for the ortholithiation of S9 3-fluorophenyl-N,N-diisopropylcarbamate
F
O
O
N(i-Pr)2
F
O
O
N(i-Pr)2
LiLDA/THF
-78 oC
IV Plot of IR absorbances versus time for the ortholithiation of S10 1,3-bis(N,N-diisopropylcarbamoyl)benzene
O
O
O
N(i-Pr)2
O
O
O
N(i-Pr)2
LiLDA/THF
-78 oC
N(i-Pr)2
O
N(i-Pr)2
O

S2
V Plot of IR absorbances versus time for the ortholithiation of S11 3-fluoroanisole
OMe
F
LDA/THF-78 oC
OMe
F
Li
VI Plot of IR absorbances versus time for the ortholithiation of S12 1-chloro-3-fluorobenzene
Cl
F
LDA/THF-78 oC
Cl
F
Li
VII Plot of IR absorbances versus time for the ortholithiation of S12 2,6-difluoropyridine
N
F
F
N
F
F
Li
LDA/THF
-78 oC
VIII Plot of IR absorbances versus time for the ortholithiation of S13 2-(3-fluorophenyl)-4,4-dimethyl-4,5-dihydro-1,3-oxazole
F F
LDA/THF
-78 oC
O
N
O
N
Li
Me
Me
Me
Me
IX Plot of IR absorbances versus time for the ortholithiation of S14 3-methoxymethoxyphenyl-N,N-diisopropylcarbamate
OCH2OCH3
O
O
N(i-Pr)2
OCH2OCH3
O
O
N(i-Pr)2
LiLDA/THF
-78 oC
X Plot of IR absorbances versus time for the ortholithiation of S15 2-fluoropyridine
N
F
LDA/THF
-78 oCN
FLi

S3
XI Plot of IR absorbances versus time for the ortholithiation of S16 1,4-difluorobenzene
F
LDA/THF
-78 oC
FLi
F F
XII Plot of IR absorbances versus time for the ortholithiation of S17 1,2-difluorobenzene
F
LDA/THF
-78 oC
FFF
Li
XIII Plot of IR absorbances versus time for the ortholithiation of S18 1,3-dichlorobenzene
Cl
LDA/THF
-78 oC
Cl
Cl Cl
Li
XIV Plot of IR absorbances versus time for the ortholithiation of S19 3-chlorobenzotrifluoride
CF3
LDA/THF
-78 oC
CF3
Cl Cl
Li
XV Plot of IR absorbances versus time for the ortholithiation of S20 3-methoxyphenyl-N,N-diethylcarbamate
OCH3
O
O
NEt2
OCH3
O
O
NEt2
LiLDA/THF
-78 oC
XVI Plot of IR absorbances versus time for the ortholithiation of S20 phenyl-N,N-dimethylcarbamate
O
O
NMe2
O
O
NMe2
LiLDA/THF
-78 oC

S4
XVII Plot of IR absorbances versus time for the ortholithiation of S21 2-phenyl-2-oxazoline
LDA/THF
-78 oC
O
N
O
N
Li
XVIII Plot of IR absorbances versus time for the ortholithiation of S22 1,3-bis(4’,4’-dimethyl-2’-oxazolinyl)benzene
LDA/THF
-78 oC
O
N
O
N
Li
Me
Me
Me
Me
N
O
N
OMe
Me
Me
Me
XIX Plot of IR absorbances versus time for the ortholithiation of S23 3-chloro-5-fluoroanisole
LDA/THF
-78 oCOMe
F
Cl
OMe
F
Cl
OMe
F
Cl
Li +
major minor
Li
XX Plot of 19F NMR peak integrations versus time for the ortholithiation S23 of 3-chloro-5-fluoroanisole
XXI Plot of IR absorbances versus time for the ortholithiation of S24 4-fluorophenyl-N,N-diisopropylcarbamate
O O
LiLDA/THF
-78 oC
N(i-Pr)2
O
N(i-Pr)2
O
F F
ON(i-Pr)2
O
F Li
+
major minor
XXII Plot of 19F NMR peak integrations versus time for the ortholithiation of S24 N,N-diisopropyl-4-fluorocarbamate
XXIII Plot of IR absorbances versus time for the ortholithiation of S25 1,4-difluorobenzene in the presence of different lithium salts
XXIV Plot of IR absorbances versus time for the ortholithiation of S26 1,4-difluorobenzene using different sources of LDA

S5
Note:
1) All reported LiCl mol percentages are with respect to [LDA]. 2) Rates corresponding to the plots from XV to XVIII were determined at
temperatures other than -78 ºC. 3) Be aware of frequent changes in the scale on x-axis.

S6
Experimental I. Measurement of chloride concentration: Potentiometry: The chloride concentration was determined potentiometrically by measuring the potential against a saturated potassium chloride solution. After calibrating with known concentrations of chloride, the concentration was calculated with the Nernst equation (E=E°-(RT/zF)log10Q, where Q=[Cl-]; RT/zF is determined via calibration and is ideally 59.1 mV). The potential was measured with a potentiostat of low impedence. Both reference and indicating electrodes are made of silver plated with silver chloride (Ag/AgCl). Samples were prepared by quenching 25 mg of LDA or 100 µl of 1.6 M n-BuLi with high-purity water (from Abruña group), evacuating to dryness and redissolving in water. Because the electrodes require a near neutral pH, the quenched base solutions needed to be neutralized with HNO3. The LiCl standards were accordingly enriched with NaNO3 to ensure comparable activity. Both HNO3 and NaNO3 contained <0.5 ppm and <0.0003% Cl-, respectively. The lower detection limit for Cl- is approximately 0.5 ppm.
Ion Chromatography: Ion chromatography was performed on a Dionex ICS-2000 system (Sunnyvale, CA) with a Dionex Ionpac AG18 guard column and a Dionex Ionpac AS18 separation column. Samples and standards were run in the isocratic mode (1.0 ml/min) using 38 mM KOH as eluent. Elution time of chloride varied from 3.94 to 4.23 min. The suppression was achieved by a Dionex ASRS ULTRA II 4 mm self-regenerating suppressor. The column temperature was 30 °C and the working electric current was 100 mA. The eluent flow rate is 1.0 ml/min. The injection volume is 25 µl. Samples were prepared by quenching 25 mg of LDA or 100 µl of 1.6 M n-BuLi with high-purity water (from Abruña group), evacuating to dryness and redissolving in water. Aqueous samples of pH 12-13 were injected in duplicate into the chromatograph. The lower detection limit is approximately 10 ppb.

S7
IR Rate Studies
F
LDA/THF
-78 oC
FLi
F F
I. Representative in situ IR spectroscopic analysis of the ortholithiation of 1,4-difluorobenzene (0.1 M) with LDA (0.12 M) in neat THF at -78 ºC: (A) no added LiCl; (B) 0.5 mol % LiCl. The IR absorbance at 1507 cm-1 corresponds to 1,4-difluorobenzene, whereas the absorbance at 1418 cm-1 corresponds to its lithiated form.
A.
B.
S8
F
F
LDA/THF
-78 oC
F
F
Li
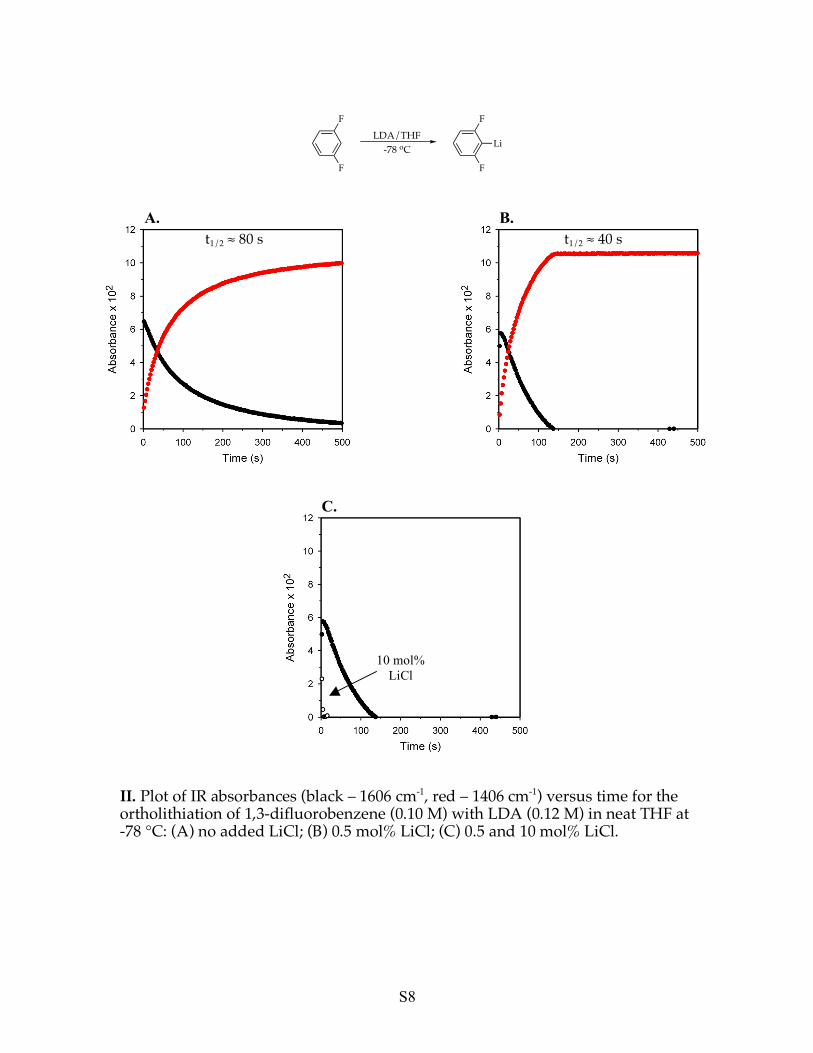
II. Plot of IR absorbances (black – 1606 cm-1, red – 1406 cm-1) versus time for the ortholithiation of 1,3-difluorobenzene (0.10 M) with LDA (0.12 M) in neat THF at -78 °C: (A) no added LiCl; (B) 0.5 mol% LiCl; (C) 0.5 and 10 mol% LiCl.
C.
10 mol%
LiCl
A.
t1/2 ! 80 s
B.
t1/2 ! 40 s

S9
F
O
O
N(i-Pr)2
F
O
O
N(i-Pr)2
LiLDA/THF
-78 oC
III. Plot of IR absorbances (black – 1715 cm-1, red – 1657 cm-1) versus time for the ortholithiation of 3-fluorophenyl-N,N-diisopropylcarbamate (0.10 M) with LDA (0.12 M) in neat THF at -78 °C: (A) no added LiCl; (B) 0.5 mol% LiCl.
A.
t1/2 ! 170 s
B.
t1/2 ! 80 s

S10
O
O
O
N(i-Pr)2
O
O
O
N(i-Pr)2
LiLDA/THF
-78 oC
N(i-Pr)2
O
N(i-Pr)2
O
IV. Plot of IR absorbances (black – 1721 cm-1, red – 1661 cm-1) versus time for the ortholithiation of 1,3-bis(N,N-diisopropylcarbamoyl)benzene (0.10 M) with LDA (0.12 M) in neat THF at -78 °C: (A) no added LiCl; (B) 0.5 mol% LiCl; (C) 0.5 and 10 mol% LiCl.
A.
t1/2 ! 190 s
B.
t1/2 ! 90 s
C.
10 mol%
LiCl

S11
OMe
F
LDA/THF
-78 oC
OMe
F
Li
V. Plot of IR absorbances (black – 1617 cm-1, red – 1412 cm-1) versus time for the ortholithiation of 3-fluoroanisole (0.10 M) with LDA (0.12 M) in neat THF at -78 °C: (A) no added LiCl; (B) 0.5 mol% LiCl (C) 0.5 and 10 mol% LiCl.
C.
10 mol%
LiCl
t1/2 ! 240 s
A.
t1/2 ! 50 s
B.

S12
Cl
F
LDA/THF
-78 oC
Cl
F
Li
VI. Plot of IR absorbances (black – 1595 cm-1, red – 1397 cm-1) versus time for the ortholithiation of 1-chloro-3-fluorobenzene (0.10 M) with LDA (0.12 M) in neat THF at -78 °C: (A) no added LiCl; (B) 0.5 mol% LiCl.
N
F
F
N
F
F
Li
LDA/THF
-78 oC
VII. Plot of IR absorbances (black – 1610 cm-1, red – 1514 cm-1) versus time for the ortholithiation of 2,6-difluoropyridine (0.10 M) with LDA (0.12 M) in neat THF at -78 °C: (A) no added LiCl; (B) 0.5 mol% LiCl.
B. A.
t1/2 ! 450 s t1/2 ! 50 s
A.
t1/2 ! 1950 s
B.
t1/2 ! 170 s

S13
F F
LDA/THF
-78 oC
O
N
O
N
Li
Me
Me
Me
Me
VIII. Plot of IR absorbances (black – 1653 cm-1, red – 1622 cm-1) versus time for the ortholithiation of 2-(3-fluorophenyl)-4,4-dimethyl-4,5-dihydro-1,3-oxazole
(0.10 M) with LDA (0.12 M) in neat THF at -78 °C: (A) no added LiCl; (B) 0.5 mol% LiCl.
A.
t1/2 ! 2850 s s
B.
t1/2 ! 285 s

S14
OCH2OCH3
O
O
N(i-Pr)2
OCH2OCH3
O
O
N(i-Pr)2
LiLDA/THF
-78 oC
IX. Plot of IR absorbances (black – 1719 cm-1, red – 1659 cm-1) versus time for the ortholithiation of 3-methoxymethoxyphenyl-N,N-diisopropylcarbamate (0.10 M) with LDA (0.12 M) in neat THF at -78 °C: (A) no added LiCl; (B) 0.5 mol% LiCl; (C) 0.5 and 10 mol% LiCl.
C.
10 mol%
LiCl
A.
t1/2 ! 2900 s
B.
t1/2 ! 1450 s

S15
N
F
LDA/THF
-78 oCN
FLi
X. Plot of IR absorbances (black – 1597 cm-1) versus time for the ortholithiation of 2-fluoropyridine (0.10 M) with LDA (0.12 M) in neat THF at -78 °C: (A) no added LiCl; (B) 0.5 mol% LiCl.
t1/2 ! 80 s
B.
t1/2 ! 3600 s
A.

S16
F
LDA/THF
-78 oC
FLi
F F
XI. Plot of IR absorbances (black – 1507 cm-1, red – 1418 cm-1) versus time for the ortholithiation of 1,4-difluorobenzene (0.10 M) with LDA (0.12 M) in neat THF at -78 °C: (A) no added LiCl; (B) 0.5 mol% LiCl; (C) 0.5 and 10 mol% LiCl.
A.
C.
10 mol%
LiCl
t1/2 ! 4300 s s ss s
B.
t1/2 ! 70 s

S17
F
LDA/THF
-78 oC
FFF
Li
XII. Plot of IR absorbances (black – 1509 cm-1, red – 1391 cm-1) versus time for the ortholithiation of 1,2-difluorobenzene (0.10 M) with LDA (0.12 M) in neat THF at -78 °C: (A) no added LiCl; (B) 0.5 mol% LiCl; (C) 0.5 and 10 mol% LiCl.
C.
10 mol%
LiCl
A.
t1/2 ! 5600 s
B.
t1/2 ! 100 s

S18
Cl
LDA/THF
-78 oC
Cl
Cl Cl
Li
XIII. Plot of IR absorbances (black – 1576 cm-1, red – 1534 cm-1) versus time for the ortholithiation of 1,3-dichlorobenzene (0.10 M) with LDA (0.12 M) in neat THF at -78 °C: (A) no added LiCl; (B) 0.5 mol% LiCl.
A.
t1/2 ! 7900 s
B.
t1/2 ! 145 s

S19
CF3
LDA/THF
-78 oC
CF3
Cl Cl
Li
XIV. Plot of IR absorbances (black – 1326 cm-1, red – 1306 cm-1) versus time for the ortholithiation of 3-chlorobenzotrifluoride (0.10 M) with LDA (0.12 M) in neat THF at -78 °C: (A) no added LiCl; (B) 0.5 mol% LiCl; (C) 0.5 and 50 mol% LiCl.
C.
50 mol%
LiCl
A.
t1/2 ! 104 s
B.
t1/2 ! 103 s

S20
OCH3
O
O
NEt2
OCH3
O
O
NEt2
LiLDA/THF
-65 oC
XV. Plot of IR absorbances (black – 1725 cm-1, red – 1675 cm-1) versus time for the ortholithiation of 3-methoxyphenyl-N,N-diethylcarbamate (0.10 M) with LDA (0.12 M) in neat THF at -65 °C: (A) no added LiCl; (B) 0.5 mol% LiCl.
O
O
NMe2
O
O
NMe2
LiLDA/THF
-30 oC
XVI. Plot of IR absorbances (black – 1725 cm-1, red – 1675 cm-1) versus time for the ortholithiation of phenyl-N,N-dimethylcarbamate (0.10 M) with LDA (0.12 M) in neat THF at -30 °C: (A) no added LiCl; (B) 0.5 mol% LiCl.
B. A.
B. A.

S21
LDA/THF
0oC
O
N
O
N
Li
XVII. Plot of IR absorbances (black – 1652 cm-1, red – 1526 cm-1) versus time for the ortholithiation of 2-phenyl-2-oxazoline (0.10 M) with LDA (0.12 M) in neat THF at 0 °C: (A) no added LiCl; (B) 0.5 mol% LiCl.
B. A.
S22
LDA/THF
21 oC
O
N
O
N
Li
Me
Me
Me
Me
N
O
N
OMe
Me
Me
Me
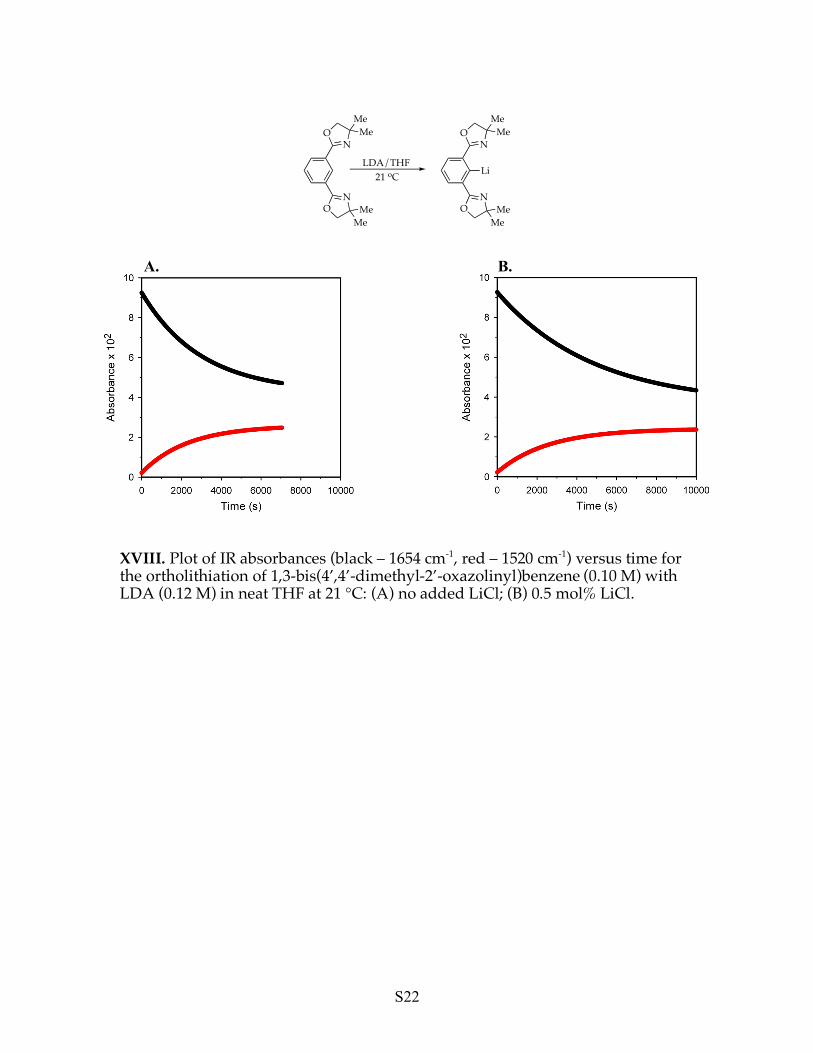
XVIII. Plot of IR absorbances (black – 1654 cm-1, red – 1520 cm-1) versus time for the ortholithiation of 1,3-bis(4’,4’-dimethyl-2’-oxazolinyl)benzene (0.10 M) with LDA (0.12 M) in neat THF at 21 °C: (A) no added LiCl; (B) 0.5 mol% LiCl.
A. B.

S23
LDA/THF
-78 oCOMe
F
Cl
OMe
F
Cl
OMe
F
Cl
Li +
major minor
Li
XIX. Plot of IR absorbances (black – 1611 cm-1, red – 1553 cm-1) versus time for the ortholithiation of 3-chloro-5-fluoroanisole (0.10 M) with LDA (0.12 M) in neat THF at -78 ºC: (A) no added LiCl; (B) 0.5 mol% LiCl.
XX. Plot of 19F NMR peak integrations (black: ! -110.1, red: ! -77.8, green: ! -76.6) versus time for the ortholithiation of 3-chloro-5-fluoroanisole (0.05 M) with LDA (0.20 M) in neat THF at -78 ºC: (A) no added LiCl; (B) 10 mol% LiCl.
B. A.
t1/2 ! 1000 s s
t1/2 ! 150 s
B. A.

S24
O O
LiLDA/THF
-78 oC
N(i-Pr)2
O
N(i-Pr)2
O
F F
ON(i-Pr)2
O
F Li
+
major minor
XXI. Plot of IR absorbances (black – 1717 cm-1, red – 1657 cm-1) versus time for the ortholithiation of 4-fluorophenyl-N,N-diisopropylcarbamate (0.025 M) with LDA (0.12 M) in neat THF at -78 ºC: (A) no added LiCl; (B) 0.5 mol% LiCl.
XXII. Plot of 19F NMR peak integrations (black: ! -118.8, red: ! -123.7, green: ! 85.5, yellow: ! -124.1) versus time for the ortholithiation of 4-fluorophenyl-N,N-diisopropylcarbamate (0.05 M) with LDA (0.20 M) in neat THF at -78 ºC: (A) no added LiCl; (B) 10 mol% LiCl.
B. A.
B. A.
t1/2 ! 840 s t1/2 ! 70 s

S25
XXIII. Plot of IR absorbances (black – 1507 cm-1, red – 1418 cm-1) versus time for the ortholithiation of 1,4-difluorobenzene (0.10 M) with LDA (0.12 M) in neat THF at -78 °C: (A) no additive; (B) 10 mol% LiCl; (C) 10 mol% LiBr; (D) 10 mol% PhCCLi; (E) 10 mol% PhCOOLi; (F) 10 mol% PhOLi.
t1/2 ! 4300 s s
A. B.
D.
E. F.
C.
t1/2 < 15 s
t1/2 ! 50 s t1/2 ! 50 s
t1/2 ! 135 s t1/2 ! 2000 s s

S26
XXIV. Plot of IR absorbances (black/red – duplicated rates) versus time for the ortholithiation of 1,4-difluorobenzene (0.10 M) with LDA (0.12 M) in 10.0 M THF/hexane at -78 °C using: (A) Acros n-BuLi – batch1; (B) Acros n-BuLi – batch2; (C) Aldrich n-BuLi – batch1; (D) Aldrich n-BuLi – batch2; (E) Acros LDA; (F) Aldrich LDA
A. B.
D.
E. F.
C.